brooks automation investor overview
TRANSCRIPT
June 2021
Brooks AutomationInvestor Overview
Safe Harbor Statement
2
“Safe Harbor” Statement under the U.S. Private Securities Litigation Reform Act of 1995; certain matters in this
presentation, including forecasts of future demand and future Company performance, are forward-looking
statements that are subject to risks and uncertainties that could cause actual results to materially differ, either
better or worse, from those projected. Further discussions of risk factors are available in the Company’s most
recent SEC filings, including the annual report on Form 10-K for the fiscal year ended September 30, 2020 and
any subsequent quarterly reports on Form 10-Q. The Company assumes no obligation to update the
information in this presentation.
Regulation G
This presentation contains certain non-GAAP measures which are provided to assist in an understanding of the
Brooks business and its operational performance. These measures should always be considered in
conjunction with the appropriate GAAP measure. Reconciliations of all non-GAAP amounts to the relevant
GAAP amount are provided as a separate presentation on the Company’s website. All financial projections
throughout this presentation, other than ROIC, exclude amortization of intangibles, restructuring expense and
other special charges.
© 2021 Brooks Automation, Inc. • Proprietary Information
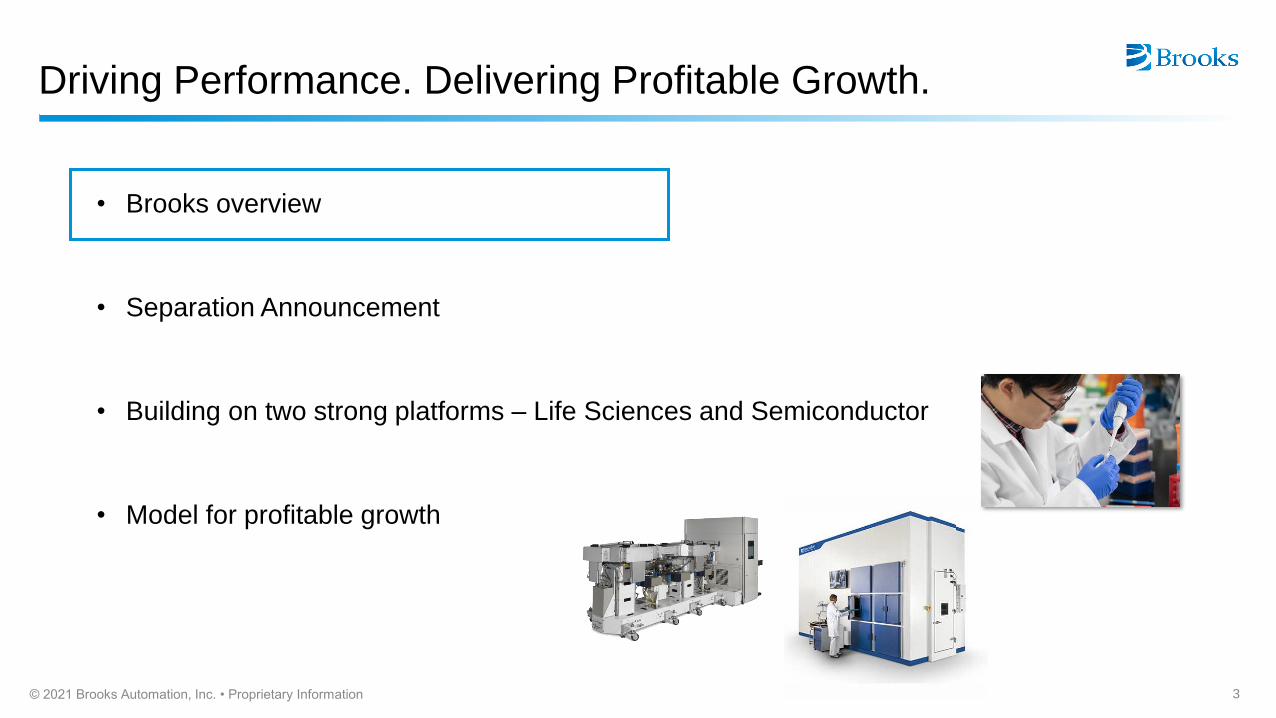
Driving Performance. Delivering Profitable Growth.
• Brooks overview
• Separation Announcement
• Building on two strong platforms – Life Sciences and Semiconductor
• Model for profitable growth
3© 2021 Brooks Automation, Inc. • Proprietary Information
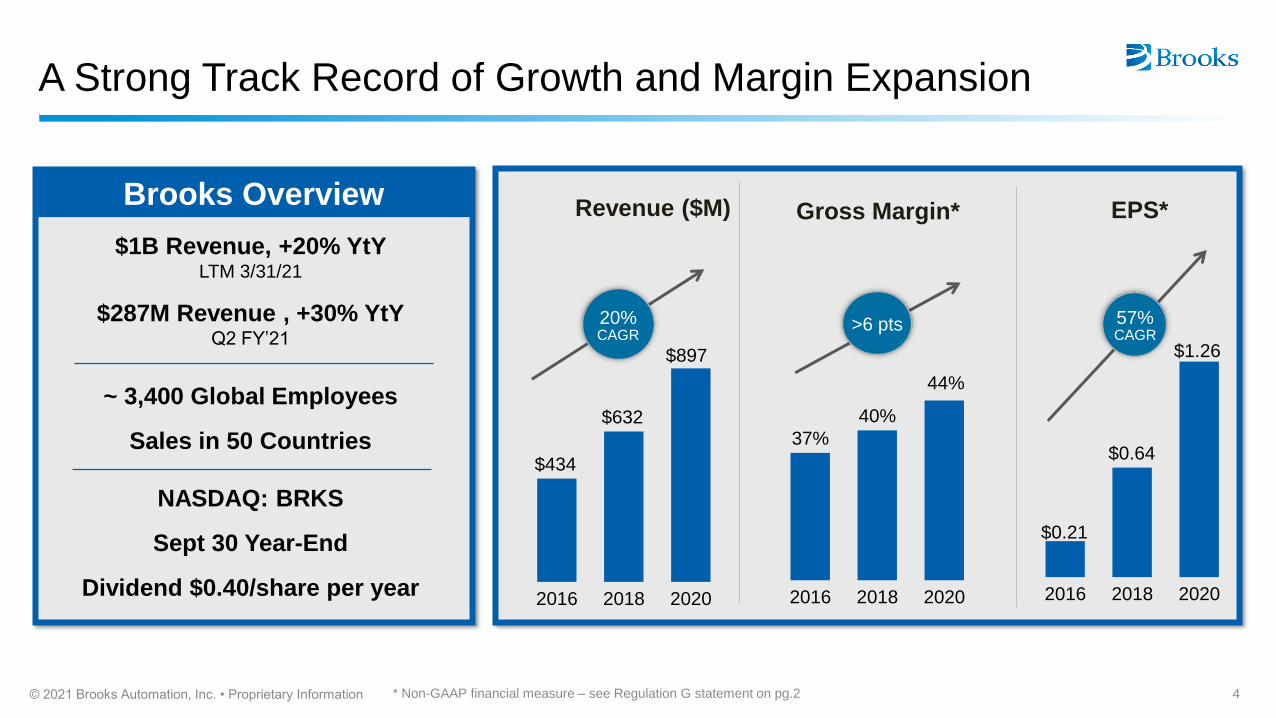
A Strong Track Record of Growth and Margin Expansion
* Non-GAAP financial measure – see Regulation G statement on pg.2
$434
$632
2016 2018 2020
$0.21
$0.64
$1.26
2016 2018 2020
37%
40%
44%
2016 2018 2020
20%CAGR
>6 pts 57%CAGR
Revenue ($M) EPS*Gross Margin*
$897
4© 2021 Brooks Automation, Inc. • Proprietary Information
$1B Revenue, +20% YtY LTM 3/31/21
$287M Revenue , +30% YtYQ2 FY’21
~ 3,400 Global Employees
Sales in 50 Countries
NASDAQ: BRKS
Sept 30 Year-End
Dividend $0.40/share per year
Brooks Overview
Driving Performance. Delivering Profitable Growth.
• Brooks overview
• Separation Announcement
• Building on two strong platforms – Life Sciences and Semiconductor
• Model for profitable growth
5© 2021 Brooks Automation, Inc. • Proprietary Information
© 2021 Brooks Automation, Inc. • Proprietary Information
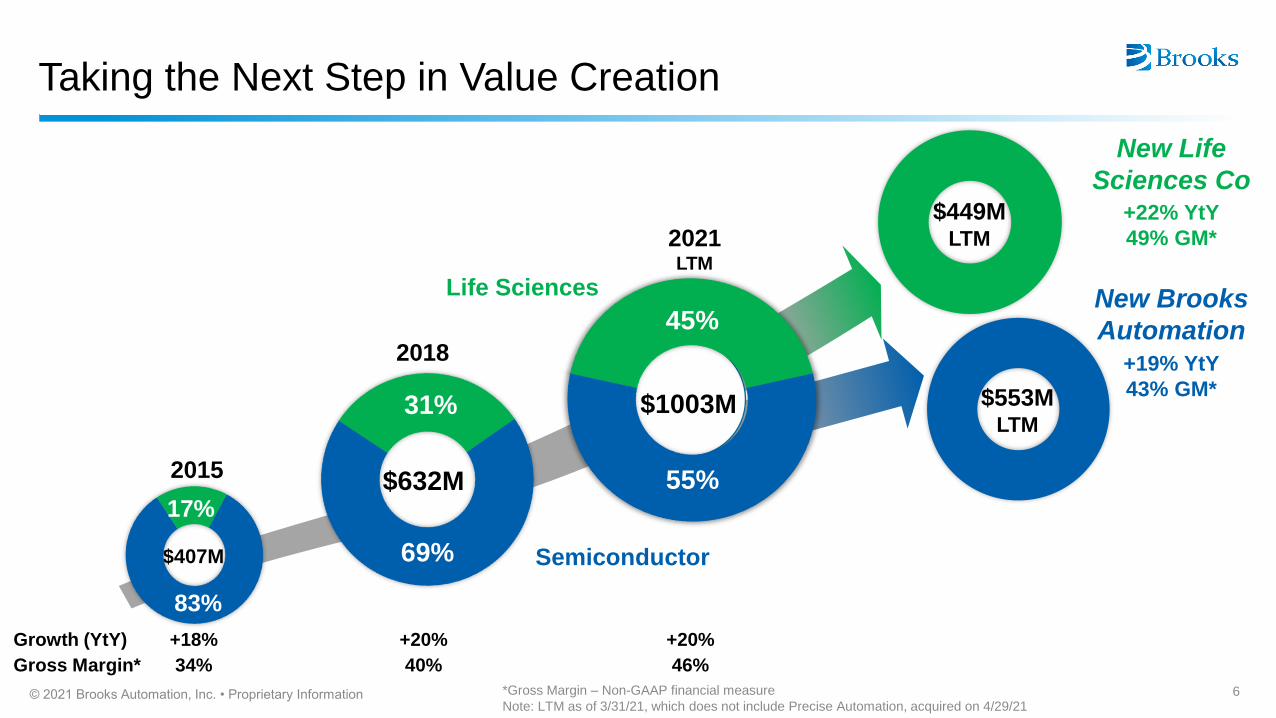
Life Sciences New Brooks
Automation
$632M
2018
69%
31%
$407M
2015
83%
17%
$553MLTM
$449MLTM
New Life
Sciences Co
$1003M
2021 LTM
45%
55%
Growth (YtY)
Gross Margin*
+18%
34%
+20%
40%
+20%
46%
+22% YtY
49% GM*
+19% YtY
43% GM*
*Gross Margin – Non-GAAP financial measure
Note: LTM as of 3/31/21, which does not include Precise Automation, acquired on 4/29/216
Taking the Next Step in Value Creation
Semiconductor
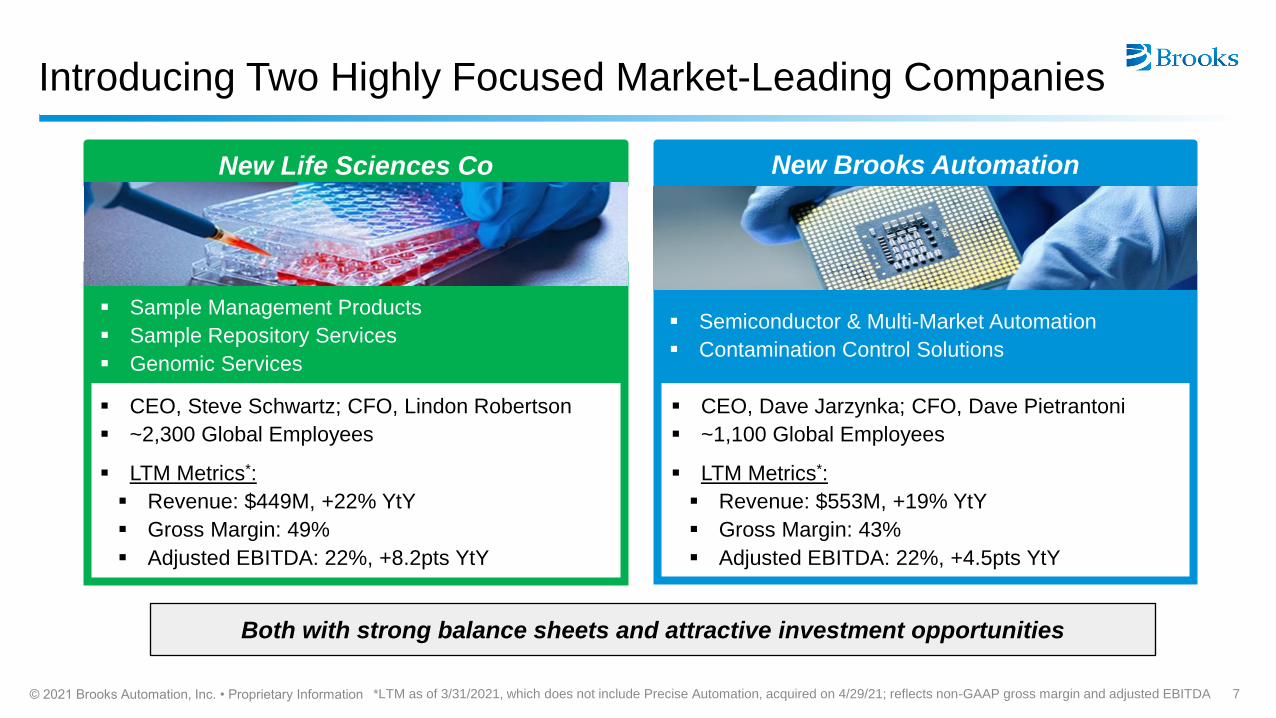
▪ Sample Management Products
▪ Sample Repository Services
▪ Genomic Services
▪ Semiconductor & Multi-Market Automation
▪ Contamination Control Solutions
Introducing Two Highly Focused Market-Leading Companies
7© 2021 Brooks Automation, Inc. • Proprietary Information *LTM as of 3/31/2021, which does not include Precise Automation, acquired on 4/29/21; reflects non-GAAP gross margin and adjusted EBITDA
New Brooks AutomationNew Life Sciences Co
▪ CEO, Steve Schwartz; CFO, Lindon Robertson
▪ ~2,300 Global Employees
▪ LTM Metrics*:
▪ Revenue: $449M, +22% YtY
▪ Gross Margin: 49%
▪ Adjusted EBITDA: 22%, +8.2pts YtY
▪ CEO, Dave Jarzynka; CFO, Dave Pietrantoni
▪ ~1,100 Global Employees
▪ LTM Metrics*:
▪ Revenue: $553M, +19% YtY
▪ Gross Margin: 43%
▪ Adjusted EBITDA: 22%, +4.5pts YtY
Both with strong balance sheets and attractive investment opportunities
Driving Performance. Delivering Profitable Growth.
• Brooks overview
• Separation Announcement
• Building on two strong platforms – Life Sciences and Semiconductor
• Model for profitable growth
8© 2021 Brooks Automation, Inc. • Proprietary Information
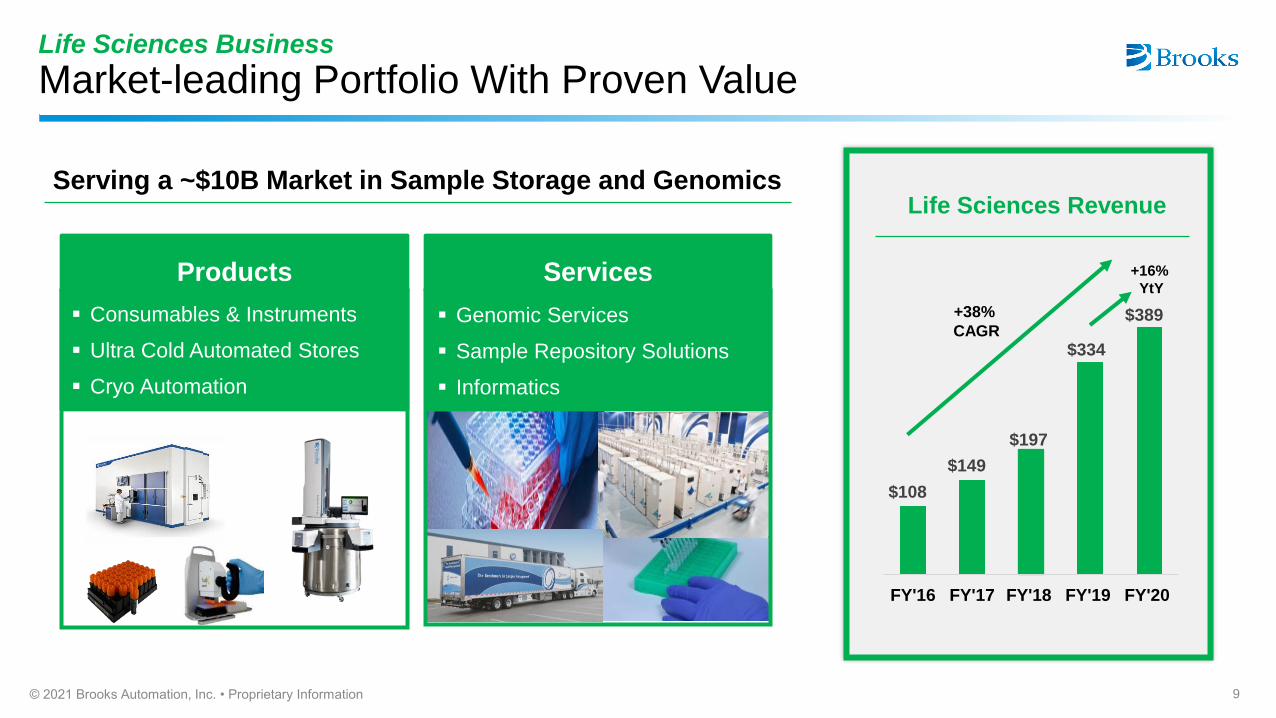
Life Sciences Business
Market-leading Portfolio With Proven Value
9© 2021 Brooks Automation, Inc. • Proprietary Information
Serving a ~$10B Market in Sample Storage and Genomics
Products
▪ Consumables & Instruments
▪ Ultra Cold Automated Stores
▪ Cryo Automation
Services
▪ Genomic Services
▪ Sample Repository Solutions
▪ Informatics
$108
$149
$197
$334
$389
FY'16 FY'17 FY'18 FY'19 FY'20
+38%
CAGR
+16%
YtY
Life Sciences Revenue
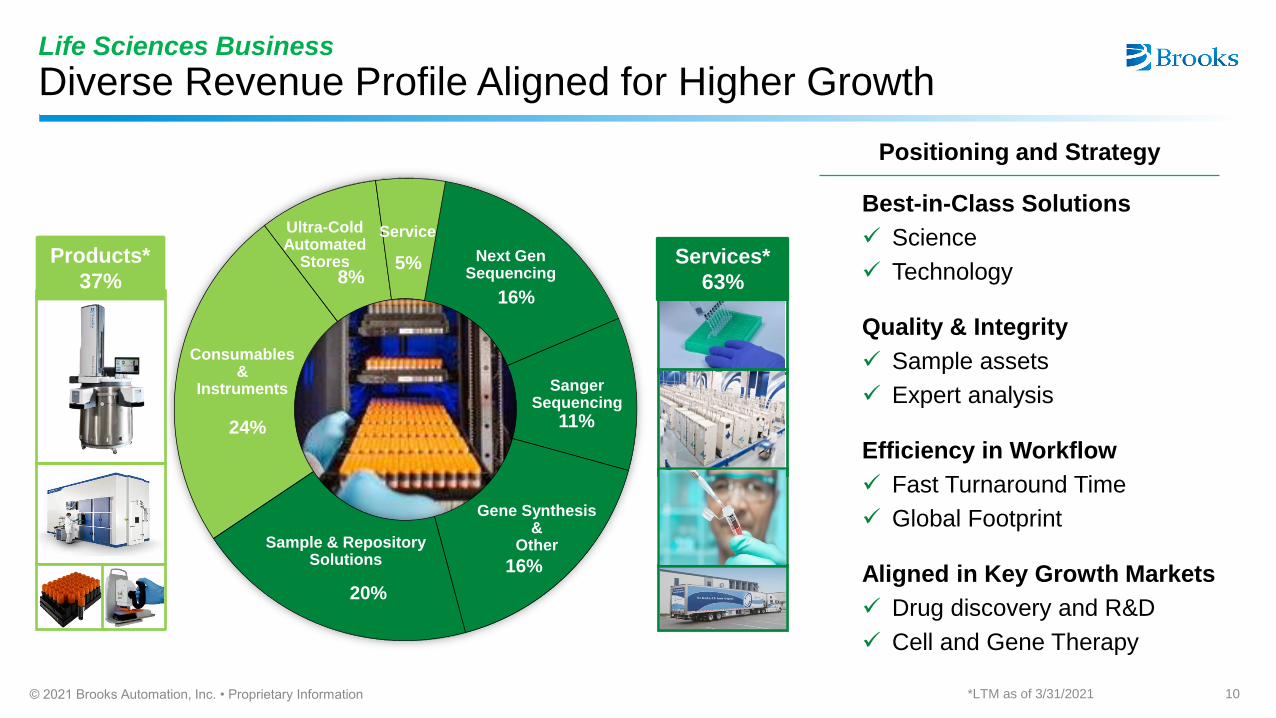
Life Sciences Business
Diverse Revenue Profile Aligned for Higher Growth
16%
11%
16%
20%
24%
8%5%
Ultra-Cold Automated
Stores
Sample & Repository Solutions
Service
Consumables&
Instruments
Next Gen Sequencing
SangerSequencing
Gene Synthesis &
Other
Products*
37%Services*
63%
10© 2021 Brooks Automation, Inc. • Proprietary Information
Positioning and Strategy
Best-in-Class Solutions
✓ Science
✓ Technology
Quality & Integrity
✓ Sample assets
✓ Expert analysis
Efficiency in Workflow
✓ Fast Turnaround Time
✓ Global Footprint
Aligned in Key Growth Markets
✓ Drug discovery and R&D
✓ Cell and Gene Therapy
*LTM as of 3/31/2021
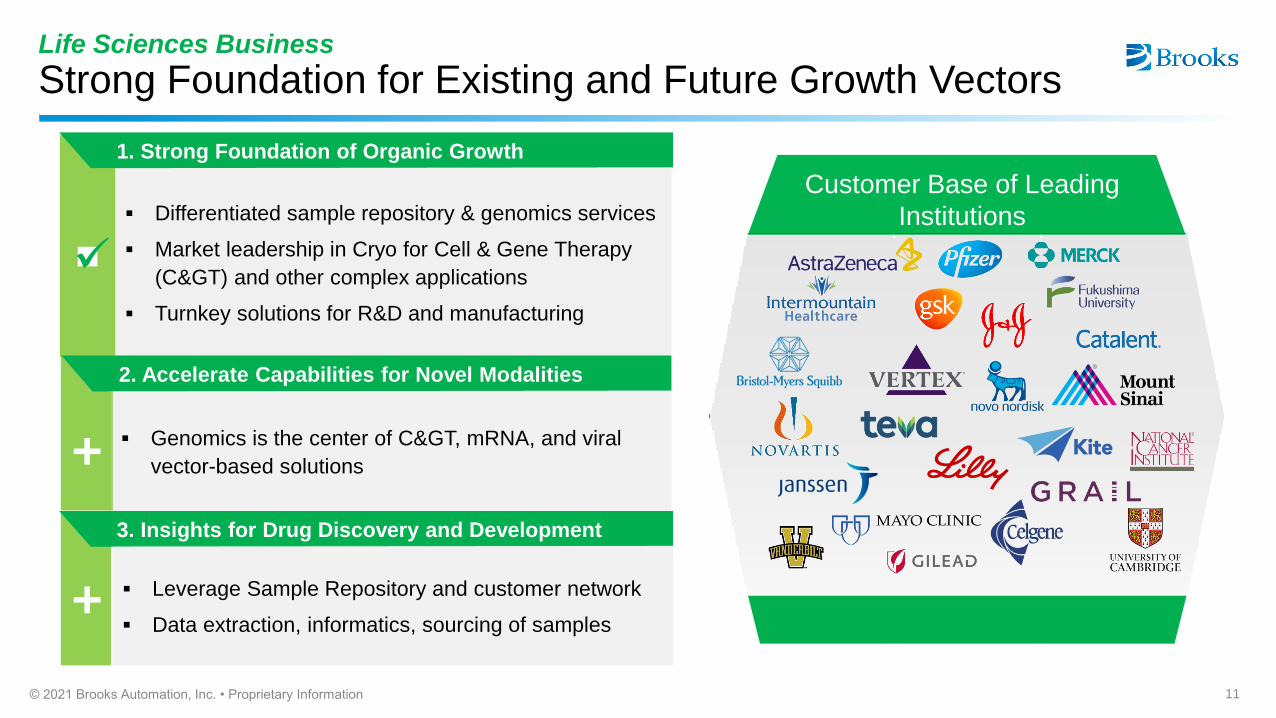
Life Sciences Business
Strong Foundation for Existing and Future Growth Vectors
11© 2021 Brooks Automation, Inc. • Proprietary Information
▪ Differentiated sample repository & genomics services
▪ Market leadership in Cryo for Cell & Gene Therapy
(C>) and other complex applications
▪ Turnkey solutions for R&D and manufacturing
1. Strong Foundation of Organic Growth
2. Accelerate Capabilities for Novel Modalities
▪ Genomics is the center of C>, mRNA, and viral
vector-based solutions
3. Insights for Drug Discovery and Development
▪ Leverage Sample Repository and customer network
▪ Data extraction, informatics, sourcing of samples
✓
Customer Base of Leading
Institutions
Driving Performance. Delivering Profitable Growth.
• Brooks overview
• Separation Announcement
• Building on two strong platforms – Life Sciences and Semiconductor
• Model for profitable growth
12© 2021 Brooks Automation, Inc. • Proprietary Information
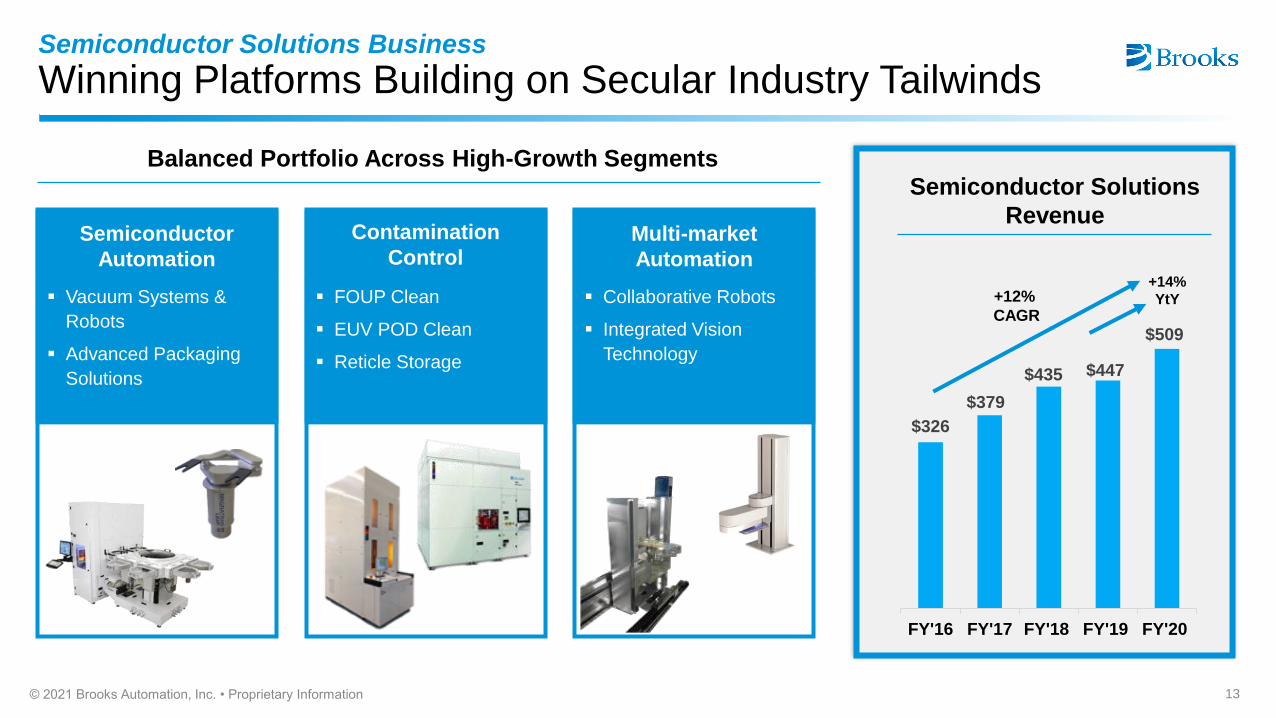
Semiconductor Solutions Business
Winning Platforms Building on Secular Industry Tailwinds
13© 2021 Brooks Automation, Inc. • Proprietary Information
Balanced Portfolio Across High-Growth Segments
Contamination
Control
▪ FOUP Clean
▪ EUV POD Clean
▪ Reticle Storage
Semiconductor
Automation
▪ Vacuum Systems &
Robots
▪ Advanced Packaging
Solutions
Multi-market
Automation
▪ Collaborative Robots
▪ Integrated Vision
Technology
Semiconductor Solutions
Revenue
$326
$379
$435 $447
$509
FY'16 FY'17 FY'18 FY'19 FY'20
+14%
YtY+12%
CAGR
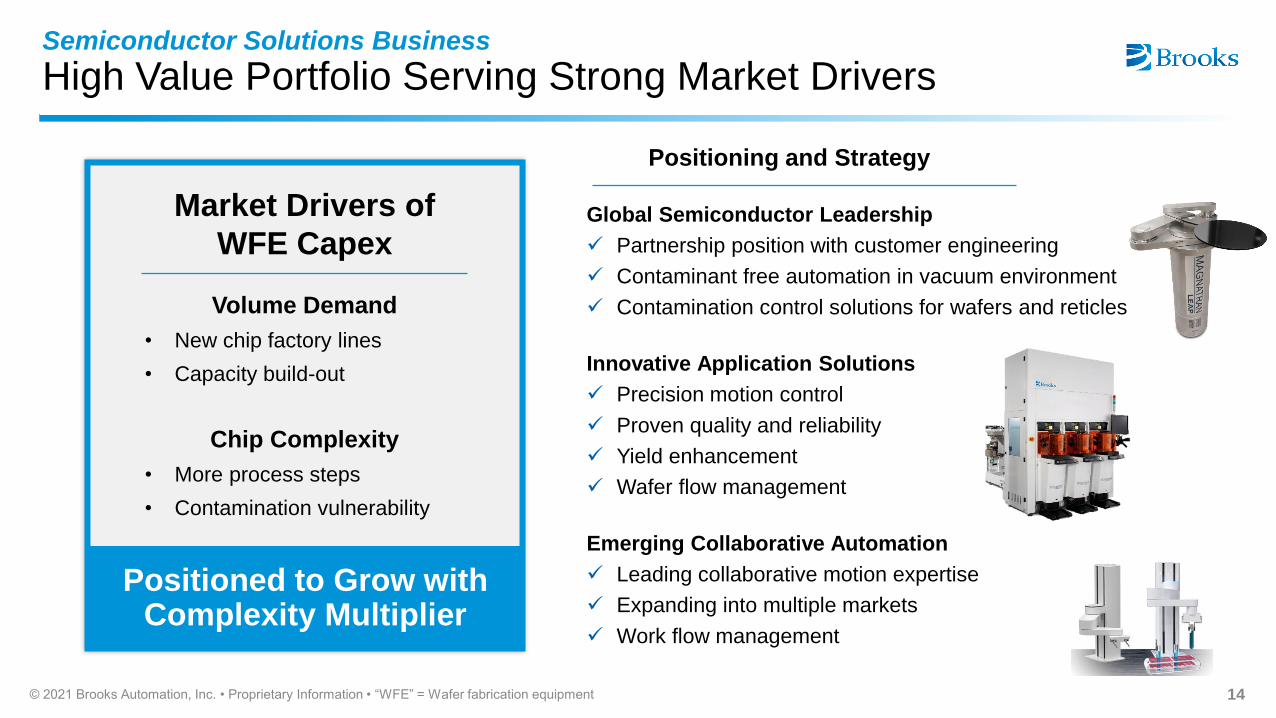
Semiconductor Solutions Business
High Value Portfolio Serving Strong Market Drivers
14© 2021 Brooks Automation, Inc. • Proprietary Information • “WFE” = Wafer fabrication equipment
Volume Demand
• New chip factory lines
• Capacity build-out
Chip Complexity
• More process steps
• Contamination vulnerability
Positioned to Grow withComplexity Multiplier
Market Drivers of
WFE CapexGlobal Semiconductor Leadership
✓ Partnership position with customer engineering
✓ Contaminant free automation in vacuum environment
✓ Contamination control solutions for wafers and reticles
Innovative Application Solutions
✓ Precision motion control
✓ Proven quality and reliability
✓ Yield enhancement
✓ Wafer flow management
Emerging Collaborative Automation
✓ Leading collaborative motion expertise
✓ Expanding into multiple markets
✓ Work flow management
Positioning and Strategy
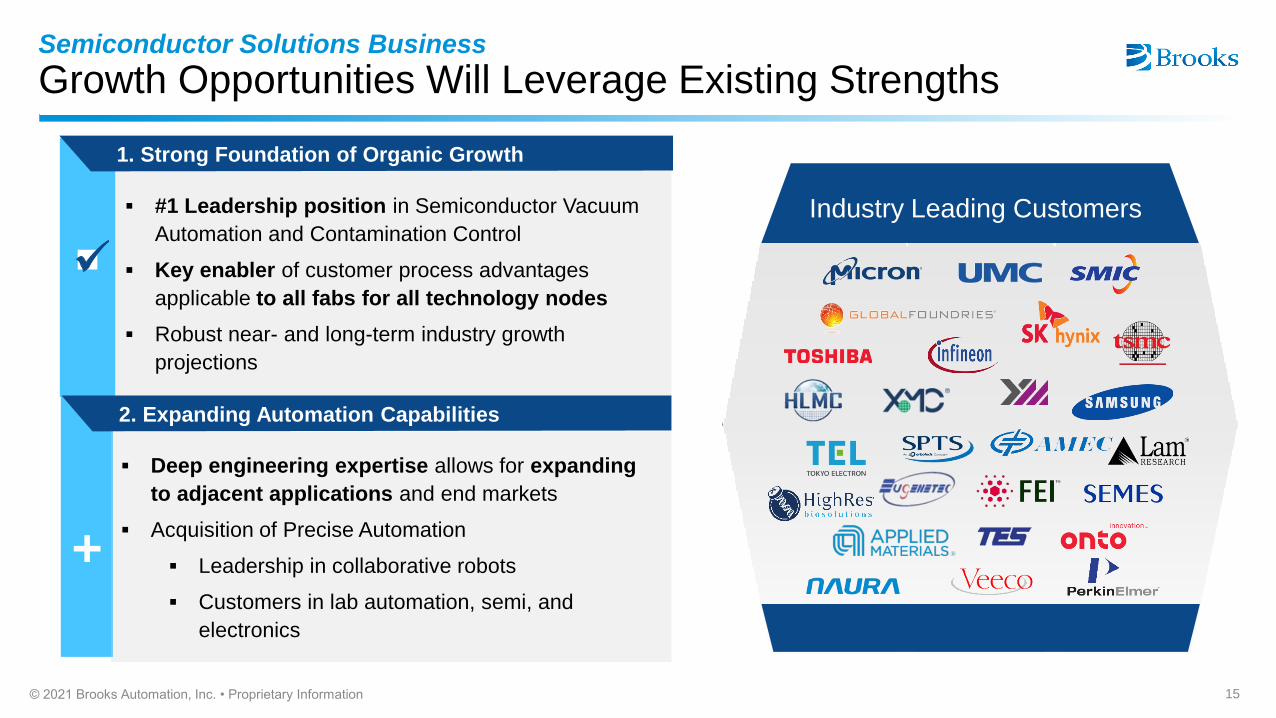
Semiconductor Solutions Business
Growth Opportunities Will Leverage Existing Strengths
15© 2021 Brooks Automation, Inc. • Proprietary Information
AutomationContamination Control Solutions
▪ #1 Leadership position in Semiconductor Vacuum
Automation and Contamination Control
▪ Key enabler of customer process advantages
applicable to all fabs for all technology nodes
▪ Robust near- and long-term industry growth
projections
1. Strong Foundation of Organic Growth
2. Expanding Automation Capabilities
▪ Deep engineering expertise allows for expanding
to adjacent applications and end markets
▪ Acquisition of Precise Automation
▪ Leadership in collaborative robots
▪ Customers in lab automation, semi, and
electronics
Industry Leading Customers

Driving Performance. Delivering Profitable Growth.
• Brooks overview
• Separation Announcement
• Building on two strong platforms – Life Sciences and Semiconductor
• Model for profitable growth
16© 2021 Brooks Automation, Inc. • Proprietary Information
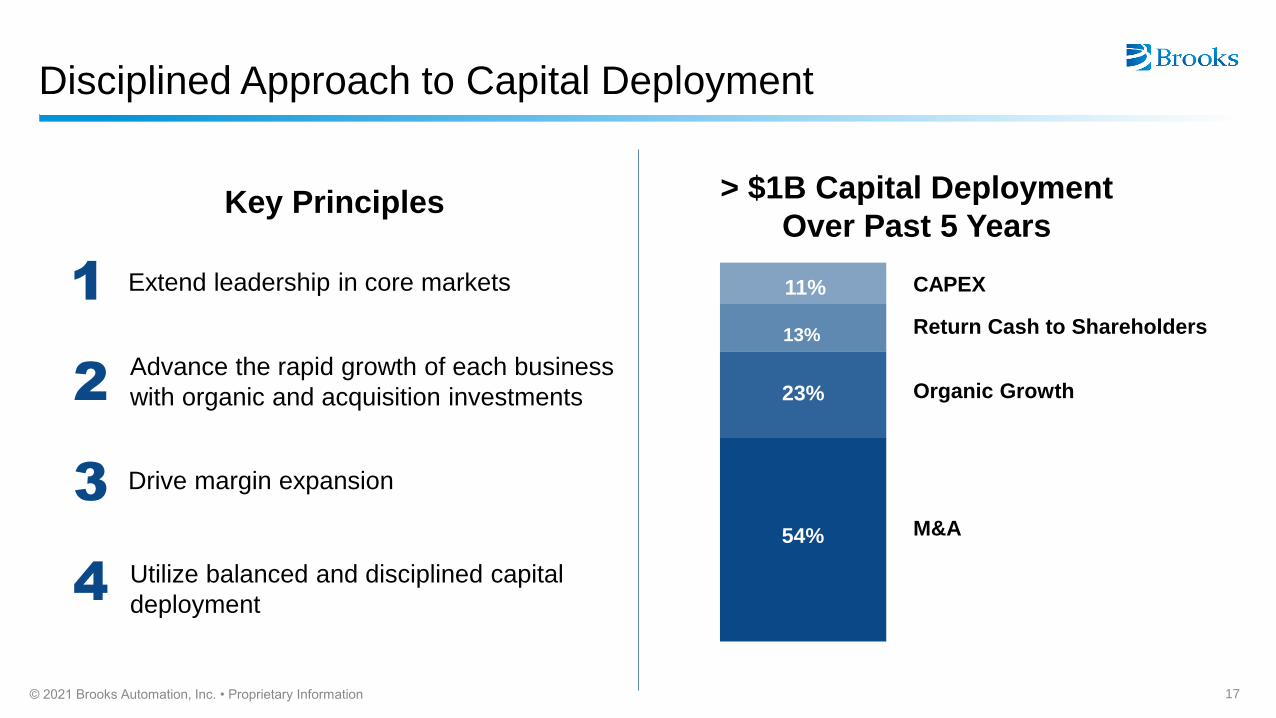
Disciplined Approach to Capital Deployment
Extend leadership in core markets1
Advance the rapid growth of each business
with organic and acquisition investments2
Drive margin expansion3
Utilize balanced and disciplined capital
deployment4
17© 2021 Brooks Automation, Inc. • Proprietary Information
Key Principles > $1B Capital Deployment
Over Past 5 Years
54%
23%
13%
11% CAPEX
Return Cash to Shareholders
Organic Growth
M&A
• GENEWIZ for
$450M
• RURO for $15M
• Divested Semi Cryo
for $675M
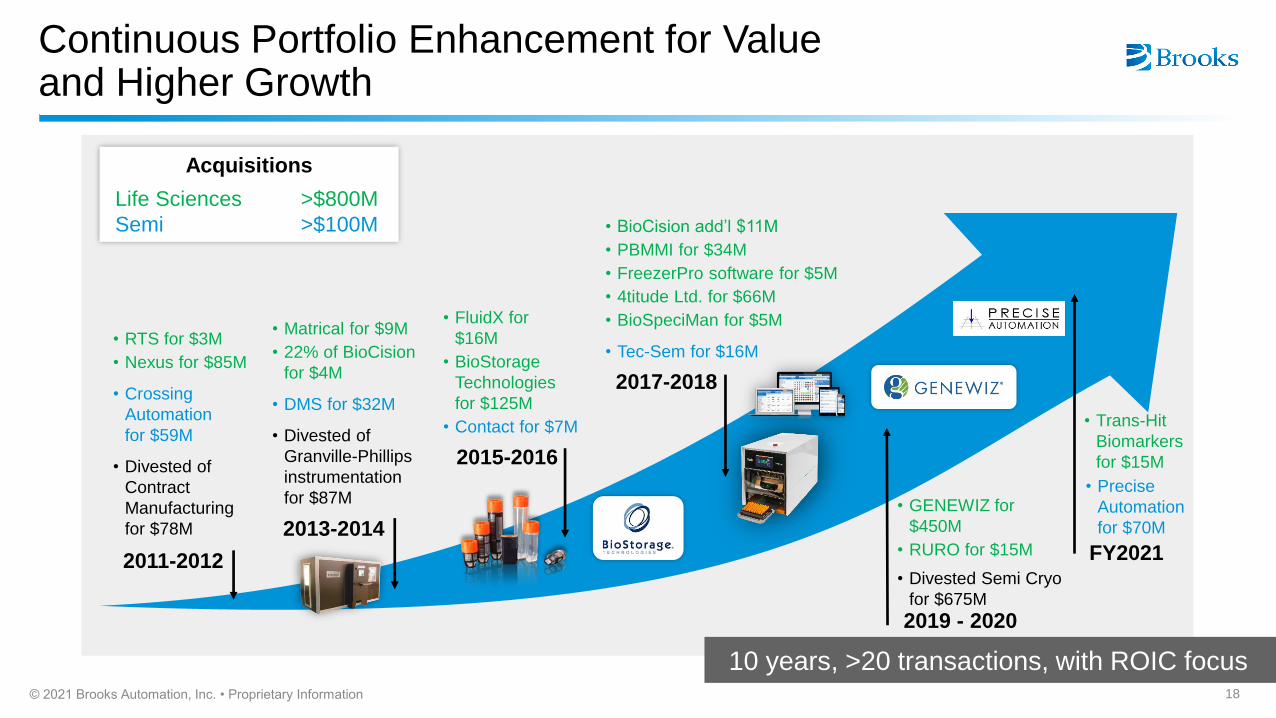
Continuous Portfolio Enhancement for Value and Higher Growth
• RTS for $3M
• Nexus for $85M
• Crossing
Automation
for $59M
• Divested of
Contract
Manufacturing
for $78M
• Matrical for $9M
• 22% of BioCision
for $4M
• DMS for $32M
• Divested of
Granville-Phillips
instrumentation
for $87M
• FluidX for
$16M
• BioStorage
Technologies
for $125M
• Contact for $7M
2013-2014
2015-2016
• BioCision add’l $11M
• PBMMI for $34M
• FreezerPro software for $5M
• 4titude Ltd. for $66M
• BioSpeciMan for $5M
• Tec-Sem for $16M
2017-2018
Acquisitions
Life Sciences >$800M
Semi >$100M
2019 - 2020
10 years, >20 transactions, with ROIC focus
2011-2012
18© 2021 Brooks Automation, Inc. • Proprietary Information
• Trans-Hit
Biomarkers
for $15M
FY2021
• Precise
Automation
for $70M
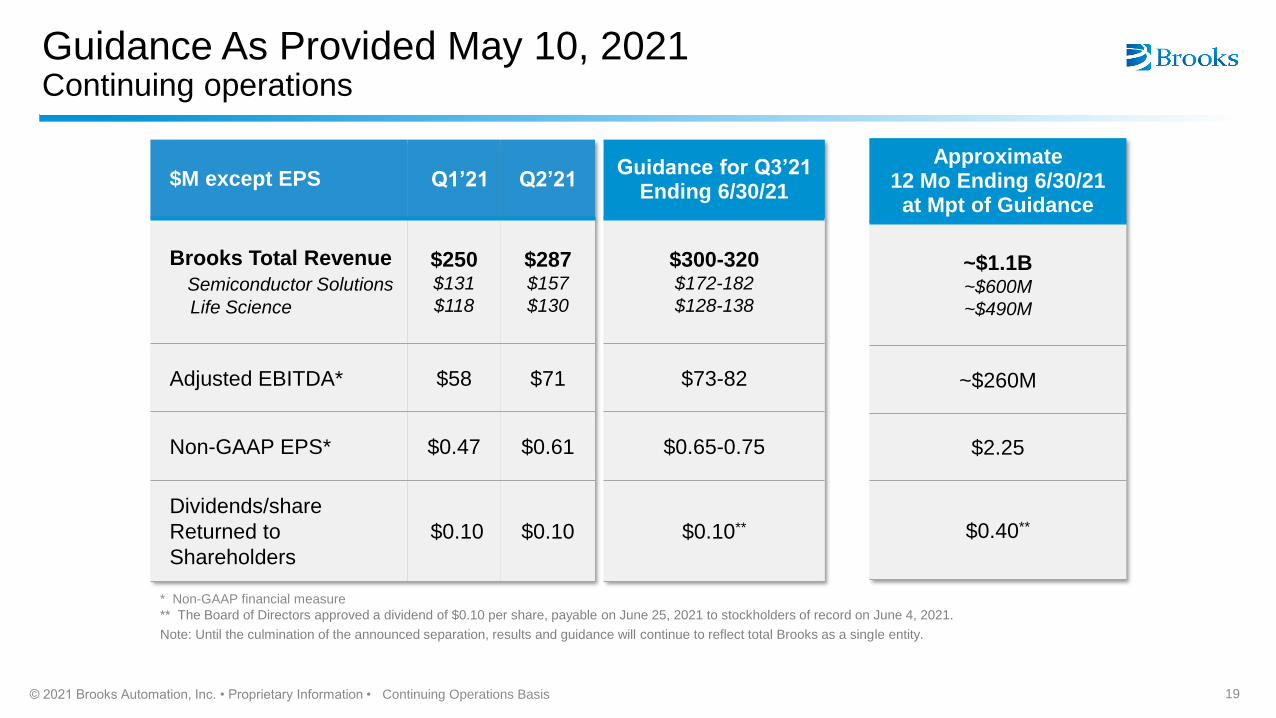
$M except EPS Q1’21 Q2’21
Brooks Total Revenue
Semiconductor Solutions
Life Science
$250$131
$118
$287$157
$130
Adjusted EBITDA* $58 $71
Non-GAAP EPS* $0.47 $0.61
Dividends/share
Returned to
Shareholders
$0.10 $0.10
Guidance As Provided May 10, 2021Continuing operations
Note: Until the culmination of the announced separation, results and guidance will continue to reflect total Brooks as a single entity.
© 2021 Brooks Automation, Inc. • Proprietary Information • 19
* Non-GAAP financial measure
** The Board of Directors approved a dividend of $0.10 per share, payable on June 25, 2021 to stockholders of record on June 4, 2021.
Approximate12 Mo Ending 6/30/21
at Mpt of Guidance
~$1.1B~$600M
~$490M
~$260M
$2.25
$0.40**
Guidance for Q3’21Ending 6/30/21
$300-320$172-182
$128-138
$73-82
$0.65-0.75
$0.10**
Continuing Operations Basis
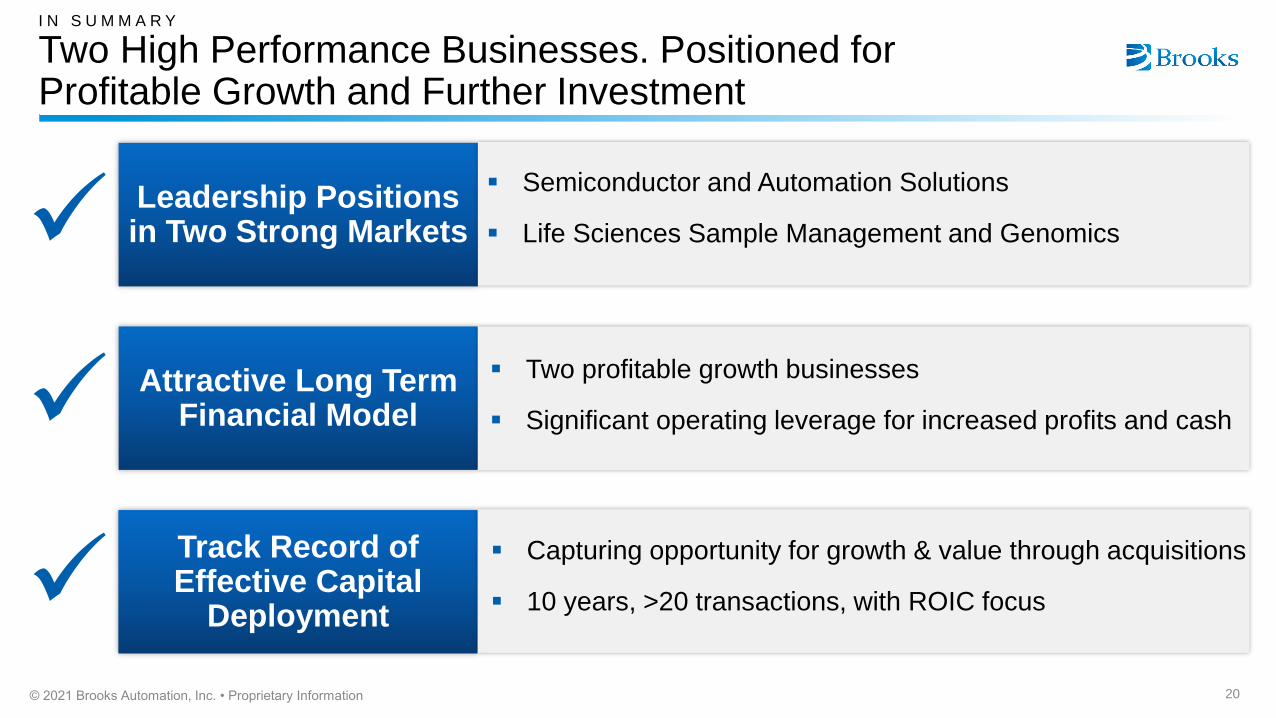
I N S U M M A R Y
Two High Performance Businesses. Positioned for Profitable Growth and Further Investment
20© 2021 Brooks Automation, Inc. • Proprietary Information
Leadership Positions in Two Strong Markets
▪ Semiconductor and Automation Solutions
▪ Life Sciences Sample Management and Genomics
Attractive Long TermFinancial Model
▪ Two profitable growth businesses
▪ Significant operating leverage for increased profits and cash
Track Record of Effective Capital
Deployment
▪ Capturing opportunity for growth & value through acquisitions
▪ 10 years, >20 transactions, with ROIC focus
✓
✓
✓

Thank You
21
Non-GAAP Reconciliation Appendix
22
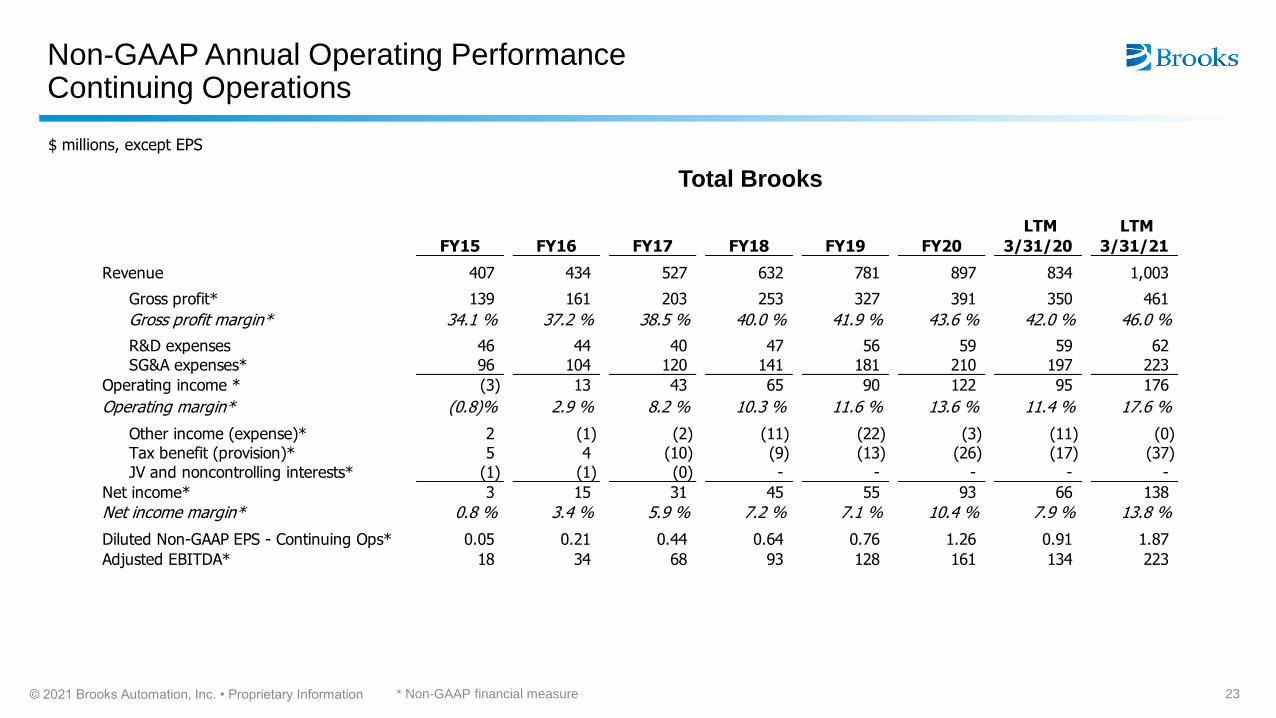
Non-GAAP Annual Operating PerformanceContinuing Operations
* Non-GAAP financial measure
$ millions, except EPS
23© 2021 Brooks Automation, Inc. • Proprietary Information
Total Brooks
FY15 FY16 FY17 FY18 FY19 FY20
LTM
3/31/20
LTM
3/31/21
Revenue 407 434 527 632 781 897 834 1,003
Gross profit* 139 161 203 253 327 391 350 461
Gross profit margin* 34.1 % 37.2 % 38.5 % 40.0 % 41.9 % 43.6 % 42.0 % 46.0 %
R&D expenses 46 44 40 47 56 59 59 62 SG&A expenses* 96 104 120 141 181 210 197 223
Operating income * (3) 13 43 65 90 122 95 176
Operating margin* (0.8)% 2.9 % 8.2 % 10.3 % 11.6 % 13.6 % 11.4 % 17.6 %
Other income (expense)* 2 (1) (2) (11) (22) (3) (11) (0) Tax benefit (provision)* 5 4 (10) (9) (13) (26) (17) (37) JV and noncontrolling interests* (1) (1) (0) - - - - -
Net income* 3 15 31 45 55 93 66 138
Net income margin* 0.8 % 3.4 % 5.9 % 7.2 % 7.1 % 10.4 % 7.9 % 13.8 %
Diluted Non-GAAP EPS - Continuing Ops* 0.05 0.21 0.44 0.64 0.76 1.26 0.91 1.87
Adjusted EBITDA* 18 34 68 93 128 161 134 223
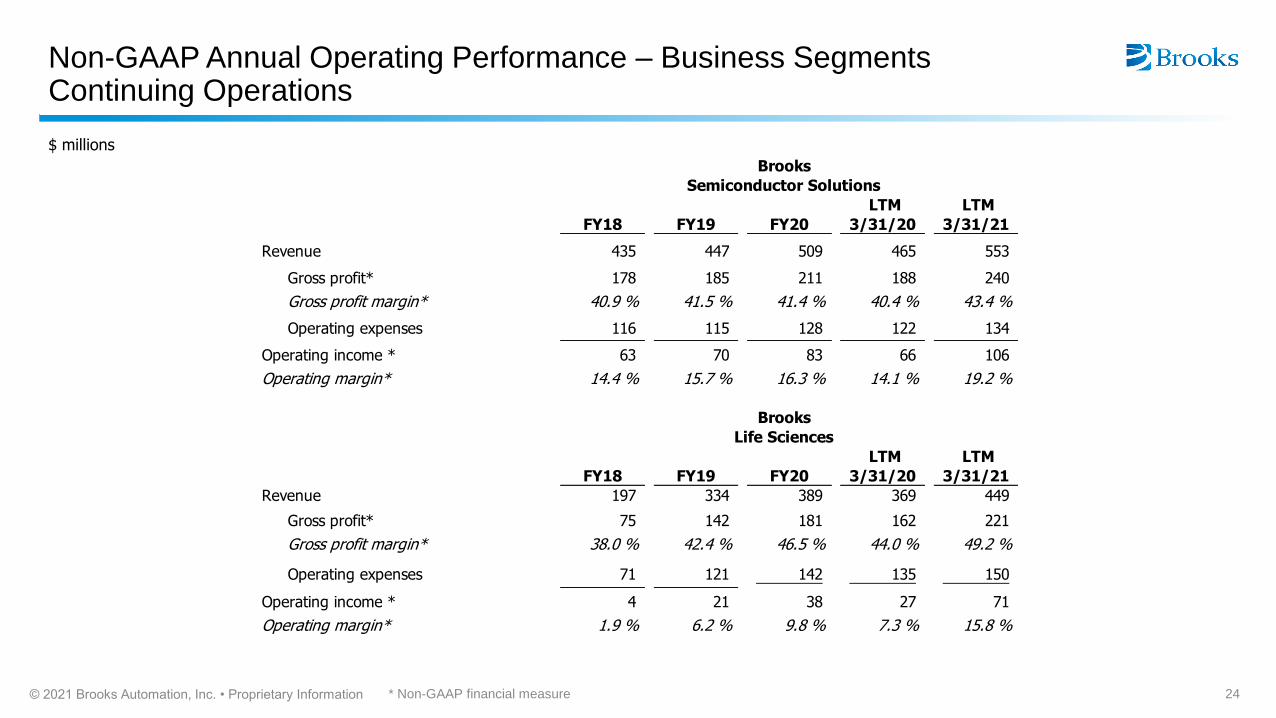
Non-GAAP Annual Operating Performance – Business SegmentsContinuing Operations
$ millions
24© 2021 Brooks Automation, Inc. • Proprietary Information * Non-GAAP financial measure
FY18 FY19 FY20
LTM
3/31/20
LTM
3/31/21
Revenue 435 447 509 465 553
Gross profit* 178 185 211 188 240
Gross profit margin* 40.9 % 41.5 % 41.4 % 40.4 % 43.4 %
Operating expenses 116 115 128 122 134
Operating income * 63 70 83 66 106
Operating margin* 14.4 % 15.7 % 16.3 % 14.1 % 19.2 %
FY18 FY19 FY20
LTM
3/31/20
LTM
3/31/21
Revenue 197 334 389 369 449
Gross profit* 75 142 181 162 221
Gross profit margin* 38.0 % 42.4 % 46.5 % 44.0 % 49.2 %
Operating expenses 71 121 142 135 150
Operating income * 4 21 38 27 71
Operating margin* 1.9 % 6.2 % 9.8 % 7.3 % 15.8 %
Brooks
Semiconductor Solutions
Brooks
Life Sciences

Non-GAAP Quarterly Operating PerformanceContinuing Operations
* Non-GAAP financial measure
$ millions, except EPS
25© 2021 Brooks Automation, Inc. • Proprietary Information
Q2'20 Q3'20 Q4'20 Q1'21 Q2'21
Revenue 220 220 246 250 287
Gross profit* 93 96 115 116 135
Gross profit margin* 42.2 % 43.5 % 46.6 % 46.3 % 47.1 %
R&D expenses 15 14 15 16 17 SG&A expenses* 52 52 55 56 60
Operating income * 26 30 45 44 58
Operating margin* 11.7 % 13.5 % 18.2 % 17.5 % 20.2 %
Other income (expense) (2) (0) (1) 1 (0) Tax benefit (provision)* (5) (6) (10) (10) (12)
Net income* 18 23 35 35 46
Net income margin* 8.4 % 10.6 % 14.0 % 14.0 % 15.9 %
Diluted Non-GAAP EPS - Continuing Ops* 0.25 0.32 0.47 0.47 0.61
Adjusted EBITDA* 35 40 54 58 71
Total Brooks
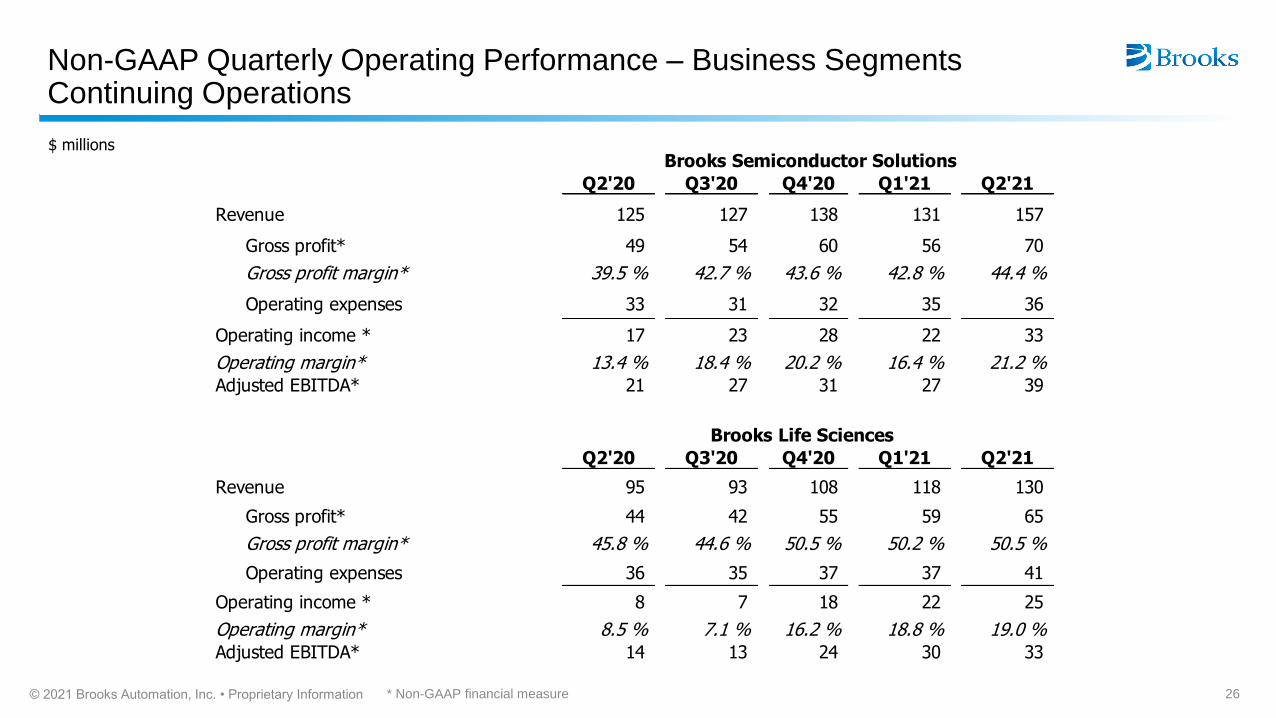
Non-GAAP Quarterly Operating Performance – Business SegmentsContinuing Operations
* Non-GAAP financial measure
$ millions
26© 2021 Brooks Automation, Inc. • Proprietary Information
Q2'20 Q3'20 Q4'20 Q1'21 Q2'21
Revenue 125 127 138 131 157
Gross profit* 49 54 60 56 70
Gross profit margin* 39.5 % 42.7 % 43.6 % 42.8 % 44.4 %
Operating expenses 33 31 32 35 36
Operating income * 17 23 28 22 33
Operating margin* 13.4 % 18.4 % 20.2 % 16.4 % 21.2 %Adjusted EBITDA* 21 27 31 27 39
Q2'20 Q3'20 Q4'20 Q1'21 Q2'21
Revenue 95 93 108 118 130
Gross profit* 44 42 55 59 65
Gross profit margin* 45.8 % 44.6 % 50.5 % 50.2 % 50.5 %
Operating expenses 36 35 37 37 41
Operating income * 8 7 18 22 25
Operating margin* 8.5 % 7.1 % 16.2 % 18.8 % 19.0 %Adjusted EBITDA* 14 13 24 30 33
Brooks Semiconductor Solutions
Brooks Life Sciences
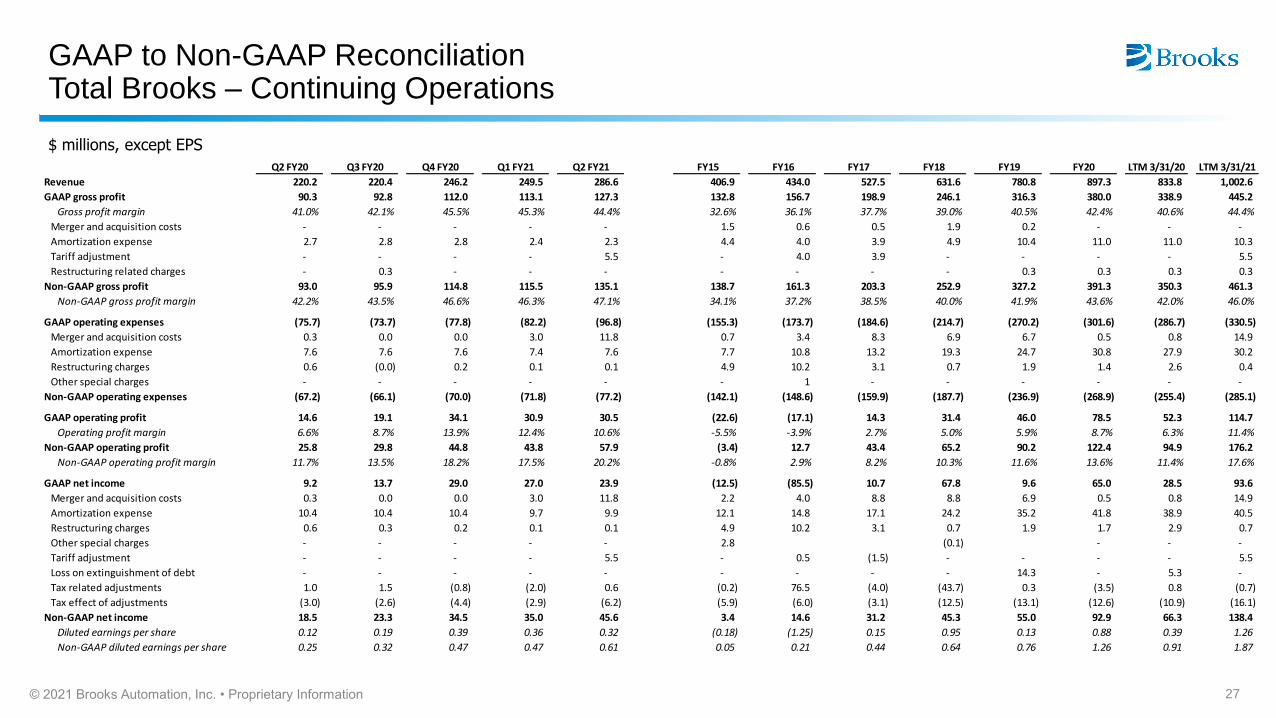
GAAP to Non-GAAP ReconciliationTotal Brooks – Continuing Operations
$ millions, except EPS
27© 2021 Brooks Automation, Inc. • Proprietary Information
Q2 FY20 Q3 FY20 Q4 FY20 Q1 FY21 Q2 FY21 FY15 FY16 FY17 FY18 FY19 FY20 LTM 3/31/20 LTM 3/31/21
Revenue 220.2 220.4 246.2 249.5 286.6 406.9 434.0 527.5 631.6 780.8 897.3 833.8 1,002.6
GAAP gross profit 90.3 92.8 112.0 113.1 127.3 132.8 156.7 198.9 246.1 316.3 380.0 338.9 445.2
Gross profit margin 41.0% 42.1% 45.5% 45.3% 44.4% 32.6% 36.1% 37.7% 39.0% 40.5% 42.4% 40.6% 44.4%
Merger and acquisition costs - - - - - 1.5 0.6 0.5 1.9 0.2 - - -
Amortization expense 2.7 2.8 2.8 2.4 2.3 4.4 4.0 3.9 4.9 10.4 11.0 11.0 10.3
Tariff adjustment - - - - 5.5 - 4.0 3.9 - - - - 5.5
Restructuring related charges - 0.3 - - - - - - - 0.3 0.3 0.3 0.3
Non-GAAP gross profit 93.0 95.9 114.8 115.5 135.1 138.7 161.3 203.3 252.9 327.2 391.3 350.3 461.3
Non-GAAP gross profit margin 42.2% 43.5% 46.6% 46.3% 47.1% 34.1% 37.2% 38.5% 40.0% 41.9% 43.6% 42.0% 46.0%
GAAP operating expenses (75.7) (73.7) (77.8) (82.2) (96.8) (155.3) (173.7) (184.6) (214.7) (270.2) (301.6) (286.7) (330.5)
Merger and acquisition costs 0.3 0.0 0.0 3.0 11.8 0.7 3.4 8.3 6.9 6.7 0.5 0.8 14.9
Amortization expense 7.6 7.6 7.6 7.4 7.6 7.7 10.8 13.2 19.3 24.7 30.8 27.9 30.2
Restructuring charges 0.6 (0.0) 0.2 0.1 0.1 4.9 10.2 3.1 0.7 1.9 1.4 2.6 0.4
Other special charges - - - - - - 1 - - - - - -
Non-GAAP operating expenses (67.2) (66.1) (70.0) (71.8) (77.2) (142.1) (148.6) (159.9) (187.7) (236.9) (268.9) (255.4) (285.1)
GAAP operating profit 14.6 19.1 34.1 30.9 30.5 (22.6) (17.1) 14.3 31.4 46.0 78.5 52.3 114.7
Operating profit margin 6.6% 8.7% 13.9% 12.4% 10.6% -5.5% -3.9% 2.7% 5.0% 5.9% 8.7% 6.3% 11.4%
Non-GAAP operating profit 25.8 29.8 44.8 43.8 57.9 (3.4) 12.7 43.4 65.2 90.2 122.4 94.9 176.2
Non-GAAP operating profit margin 11.7% 13.5% 18.2% 17.5% 20.2% -0.8% 2.9% 8.2% 10.3% 11.6% 13.6% 11.4% 17.6%
GAAP net income 9.2 13.7 29.0 27.0 23.9 (12.5) (85.5) 10.7 67.8 9.6 65.0 28.5 93.6
Merger and acquisition costs 0.3 0.0 0.0 3.0 11.8 2.2 4.0 8.8 8.8 6.9 0.5 0.8 14.9
Amortization expense 10.4 10.4 10.4 9.7 9.9 12.1 14.8 17.1 24.2 35.2 41.8 38.9 40.5
Restructuring charges 0.6 0.3 0.2 0.1 0.1 4.9 10.2 3.1 0.7 1.9 1.7 2.9 0.7
Other special charges - - - - - 2.8 (0.1) - - -
Tariff adjustment - - - - 5.5 - 0.5 (1.5) - - - - 5.5
Loss on extinguishment of debt - - - - - - - - - 14.3 - 5.3 -
Tax related adjustments 1.0 1.5 (0.8) (2.0) 0.6 (0.2) 76.5 (4.0) (43.7) 0.3 (3.5) 0.8 (0.7)
Tax effect of adjustments (3.0) (2.6) (4.4) (2.9) (6.2) (5.9) (6.0) (3.1) (12.5) (13.1) (12.6) (10.9) (16.1)
Non-GAAP net income 18.5 23.3 34.5 35.0 45.6 3.4 14.6 31.2 45.3 55.0 92.9 66.3 138.4
Diluted earnings per share 0.12 0.19 0.39 0.36 0.32 (0.18) (1.25) 0.15 0.95 0.13 0.88 0.39 1.26
Non-GAAP diluted earnings per share 0.25 0.32 0.47 0.47 0.61 0.05 0.21 0.44 0.64 0.76 1.26 0.91 1.87
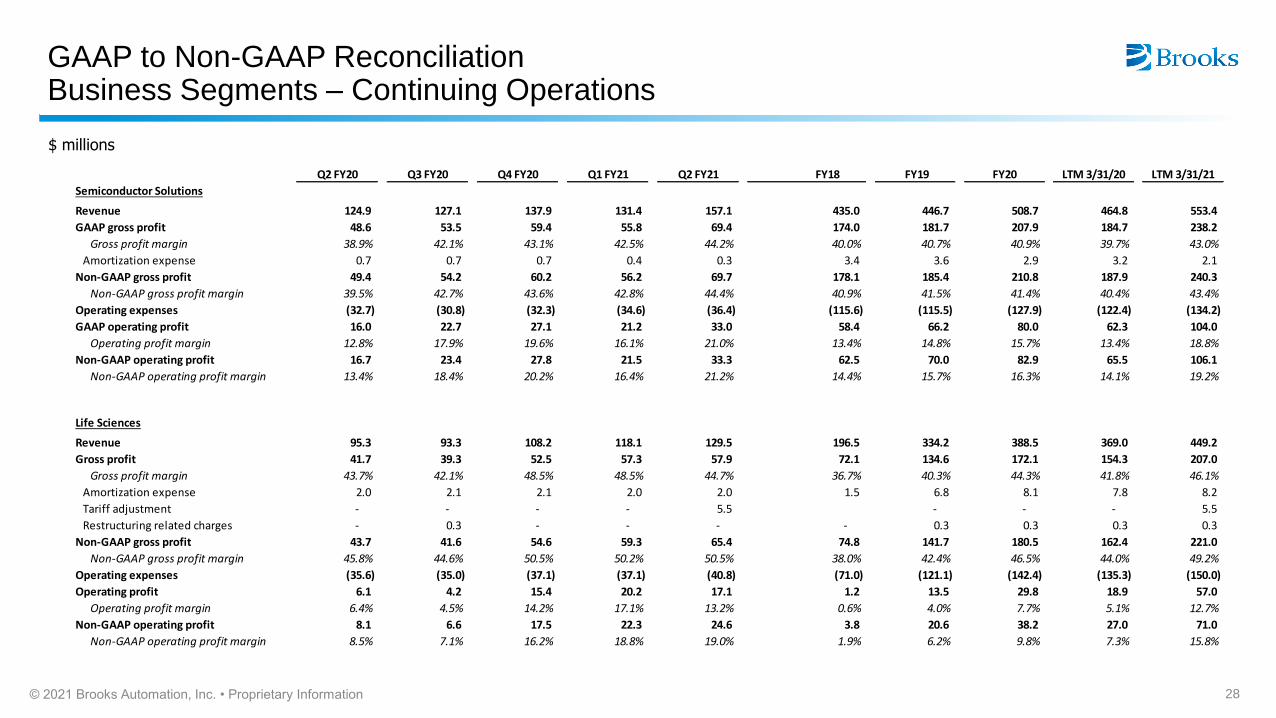
GAAP to Non-GAAP ReconciliationBusiness Segments – Continuing Operations
$ millions
28© 2021 Brooks Automation, Inc. • Proprietary Information
Q2 FY20 Q3 FY20 Q4 FY20 Q1 FY21 Q2 FY21 FY18 FY19 FY20 LTM 3/31/20 LTM 3/31/21
Semiconductor Solutions
Revenue 124.9 127.1 137.9 131.4 157.1 435.0 446.7 508.7 464.8 553.4
GAAP gross profit 48.6 53.5 59.4 55.8 69.4 174.0 181.7 207.9 184.7 238.2
Gross profit margin 38.9% 42.1% 43.1% 42.5% 44.2% 40.0% 40.7% 40.9% 39.7% 43.0%
Amortization expense 0.7 0.7 0.7 0.4 0.3 3.4 3.6 2.9 3.2 2.1
Non-GAAP gross profit 49.4 54.2 60.2 56.2 69.7 178.1 185.4 210.8 187.9 240.3
Non-GAAP gross profit margin 39.5% 42.7% 43.6% 42.8% 44.4% 40.9% 41.5% 41.4% 40.4% 43.4%
Operating expenses (32.7) (30.8) (32.3) (34.6) (36.4) (115.6) (115.5) (127.9) (122.4) (134.2)
GAAP operating profit 16.0 22.7 27.1 21.2 33.0 58.4 66.2 80.0 62.3 104.0
Operating profit margin 12.8% 17.9% 19.6% 16.1% 21.0% 13.4% 14.8% 15.7% 13.4% 18.8%
Non-GAAP operating profit 16.7 23.4 27.8 21.5 33.3 62.5 70.0 82.9 65.5 106.1
Non-GAAP operating profit margin 13.4% 18.4% 20.2% 16.4% 21.2% 14.4% 15.7% 16.3% 14.1% 19.2%
Life Sciences
Revenue 95.3 93.3 108.2 118.1 129.5 196.5 334.2 388.5 369.0 449.2
Gross profit 41.7 39.3 52.5 57.3 57.9 72.1 134.6 172.1 154.3 207.0
Gross profit margin 43.7% 42.1% 48.5% 48.5% 44.7% 36.7% 40.3% 44.3% 41.8% 46.1%
Amortization expense 2.0 2.1 2.1 2.0 2.0 1.5 6.8 8.1 7.8 8.2
Tariff adjustment - - - - 5.5 - - - 5.5
Restructuring related charges - 0.3 - - - - 0.3 0.3 0.3 0.3
Non-GAAP gross profit 43.7 41.6 54.6 59.3 65.4 74.8 141.7 180.5 162.4 221.0
Non-GAAP gross profit margin 45.8% 44.6% 50.5% 50.2% 50.5% 38.0% 42.4% 46.5% 44.0% 49.2%
Operating expenses (35.6) (35.0) (37.1) (37.1) (40.8) (71.0) (121.1) (142.4) (135.3) (150.0)
Operating profit 6.1 4.2 15.4 20.2 17.1 1.2 13.5 29.8 18.9 57.0
Operating profit margin 6.4% 4.5% 14.2% 17.1% 13.2% 0.6% 4.0% 7.7% 5.1% 12.7%
Non-GAAP operating profit 8.1 6.6 17.5 22.3 24.6 3.8 20.6 38.2 27.0 71.0
Non-GAAP operating profit margin 8.5% 7.1% 16.2% 18.8% 19.0% 1.9% 6.2% 9.8% 7.3% 15.8%
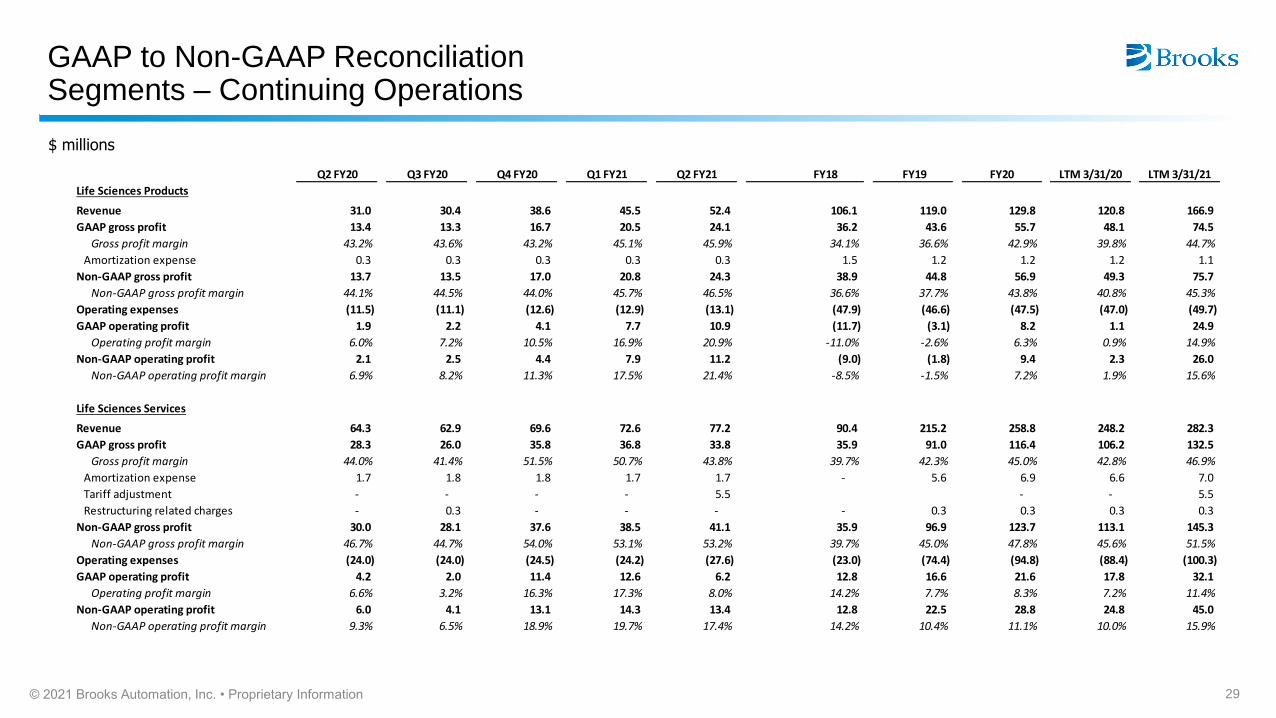
GAAP to Non-GAAP ReconciliationSegments – Continuing Operations
$ millions
29© 2021 Brooks Automation, Inc. • Proprietary Information
Q2 FY20 Q3 FY20 Q4 FY20 Q1 FY21 Q2 FY21 FY18 FY19 FY20 LTM 3/31/20 LTM 3/31/21
Life Sciences Products
Revenue 31.0 30.4 38.6 45.5 52.4 106.1 119.0 129.8 120.8 166.9
GAAP gross profit 13.4 13.3 16.7 20.5 24.1 36.2 43.6 55.7 48.1 74.5
Gross profit margin 43.2% 43.6% 43.2% 45.1% 45.9% 34.1% 36.6% 42.9% 39.8% 44.7%
Amortization expense 0.3 0.3 0.3 0.3 0.3 1.5 1.2 1.2 1.2 1.1
Non-GAAP gross profit 13.7 13.5 17.0 20.8 24.3 38.9 44.8 56.9 49.3 75.7
Non-GAAP gross profit margin 44.1% 44.5% 44.0% 45.7% 46.5% 36.6% 37.7% 43.8% 40.8% 45.3%
Operating expenses (11.5) (11.1) (12.6) (12.9) (13.1) (47.9) (46.6) (47.5) (47.0) (49.7)
GAAP operating profit 1.9 2.2 4.1 7.7 10.9 (11.7) (3.1) 8.2 1.1 24.9
Operating profit margin 6.0% 7.2% 10.5% 16.9% 20.9% -11.0% -2.6% 6.3% 0.9% 14.9%
Non-GAAP operating profit 2.1 2.5 4.4 7.9 11.2 (9.0) (1.8) 9.4 2.3 26.0
Non-GAAP operating profit margin 6.9% 8.2% 11.3% 17.5% 21.4% -8.5% -1.5% 7.2% 1.9% 15.6%
Life Sciences Services
Revenue 64.3 62.9 69.6 72.6 77.2 90.4 215.2 258.8 248.2 282.3
GAAP gross profit 28.3 26.0 35.8 36.8 33.8 35.9 91.0 116.4 106.2 132.5
Gross profit margin 44.0% 41.4% 51.5% 50.7% 43.8% 39.7% 42.3% 45.0% 42.8% 46.9%
Amortization expense 1.7 1.8 1.8 1.7 1.7 - 5.6 6.9 6.6 7.0
Tariff adjustment - - - - 5.5 - - 5.5
Restructuring related charges - 0.3 - - - - 0.3 0.3 0.3 0.3
Non-GAAP gross profit 30.0 28.1 37.6 38.5 41.1 35.9 96.9 123.7 113.1 145.3
Non-GAAP gross profit margin 46.7% 44.7% 54.0% 53.1% 53.2% 39.7% 45.0% 47.8% 45.6% 51.5%
Operating expenses (24.0) (24.0) (24.5) (24.2) (27.6) (23.0) (74.4) (94.8) (88.4) (100.3)
GAAP operating profit 4.2 2.0 11.4 12.6 6.2 12.8 16.6 21.6 17.8 32.1
Operating profit margin 6.6% 3.2% 16.3% 17.3% 8.0% 14.2% 7.7% 8.3% 7.2% 11.4%
Non-GAAP operating profit 6.0 4.1 13.1 14.3 13.4 12.8 22.5 28.8 24.8 45.0
Non-GAAP operating profit margin 9.3% 6.5% 18.9% 19.7% 17.4% 14.2% 10.4% 11.1% 10.0% 15.9%

Net Income Reconciliation to Adjusted EBITDAContinuing Operations
$ millions
30© 2021 Brooks Automation, Inc. • Proprietary Information
Q2'20 Q3'20 Q4'20 Q1'21 Q2'21 FY'15 FY'16 FY'17 FY'18 FY'19 FY'20
LTM
3/31/20
LTM
3/31/21
Net income (loss) attributable to Brooks Automation, Inc. 9.1 13.7 29.0 26.0 23.7 14.2 (69.5) 62.6 116.6 437.4 64.9 441.8 92.4
(Income) loss from discontinued operations, net of tax 0.1 - 0.0 1.0 0.2 (26.7) (16.0) (51.9) (48.7) (427.9) 0.2 (413.3) 1.2
Net income (loss) from continuing operations 9.2 13.7 29.0 27.0 23.9 (12.5) (85.5) 10.7 67.8 9.6 65.0 28.5 93.6
Adjustments:
Interest income (0.1) (0.0) 0.0 (0.1) (0.0) (0.9) (0.5) (0.5) (1.9) (1.4) (0.8) (1.5) (0.1)
Interest expense 0.7 0.8 0.7 0.6 0.5 0.4 0.2 0.4 9.5 22.2 2.9 10.4 2.5
Income tax provision (benefit) 3.4 5.1 4.4 4.8 6.3 (11.3) 66.3 3.4 (47.3) (0.1) 9.9 7.2 20.6
Depreciation 6.2 6.3 5.3 6.0 5.9 11.4 12.2 10.4 12.5 19.3 23.7 22.3 23.5
Amortization of intangible assets 10.4 10.4 10.4 9.7 9.9 12.1 14.8 17.1 24.2 35.2 41.8 38.9 40.5
Loss on extinguishment of debt - - - - - - - - - 14.3 - 5.3 -
EBITDA-from Continuing Operations 29.8 36.3 49.8 48.0 46.5 (0.8) 7.5 41.5 64.9 99.0 142.6 111.0 180.5
Non-GAAP adjustments:
Purchase accounting impact on inventory
and contracts acquired - - - - - 1.5 0.6 0.5 1.9 0.2 - - -
Stock-based compensation 4.2 3.7 4.0 6.7 7.5 11.9 11.3 16.6 18.9 19.5 16.3 18.8 21.9
Tariff adjustment 5.5 - - - - - - - 5.5
Restructuring 0.6 (0.0) 0.2 0.1 0.1 4.9 10.2 3.1 0.7 1.9 1.4 2.6 0.4
Restructuring related charges 0.3 - - - - - 0.3 0.3 0.3 0.3
Merger and acquisition costs / Other 0.3 0.0 0.0 3.0 11.8 0.7 4.2 6.7 6.9 6.7 0.5 0.8 14.9
Adjusted EBITDA - from Continuing Operations 34.8 40.3 54.0 57.8 71.4 18.1 33.8 68.5 93.3 127.6 161.0 133.5 223.5
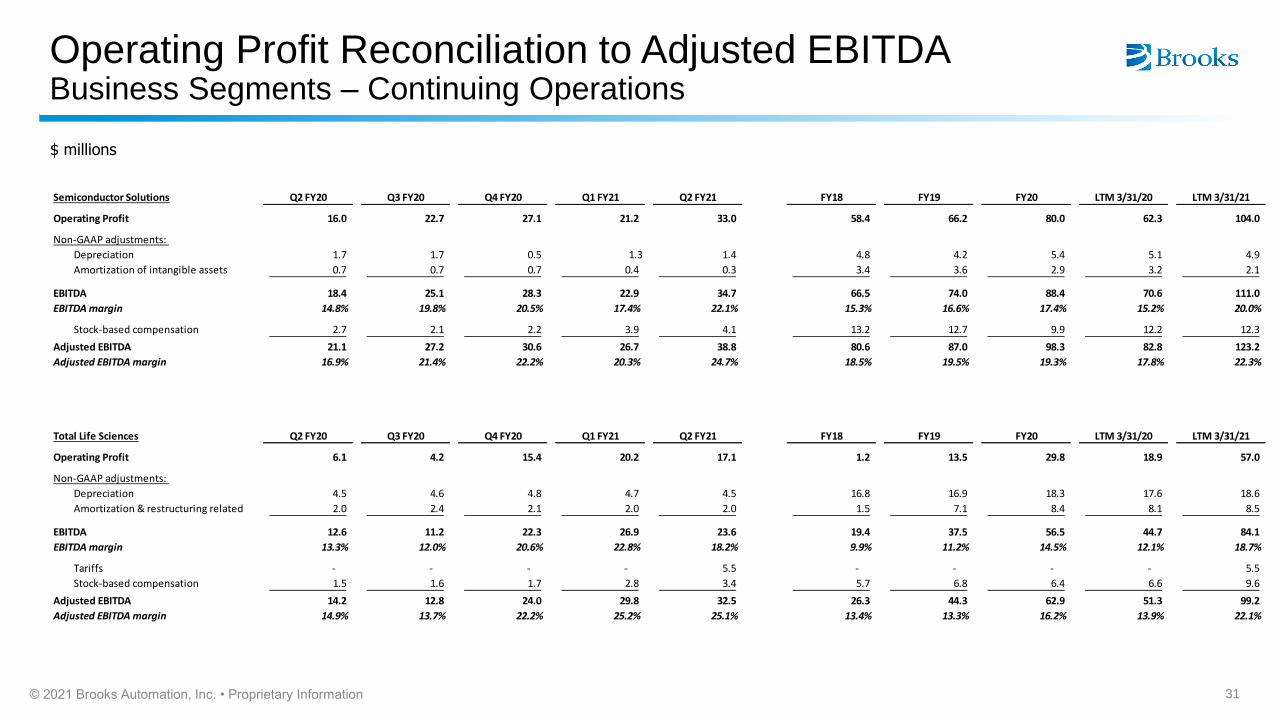
Operating Profit Reconciliation to Adjusted EBITDABusiness Segments – Continuing Operations
31© 2021 Brooks Automation, Inc. • Proprietary Information
$ millions
Semiconductor Solutions Q2 FY20 Q3 FY20 Q4 FY20 Q1 FY21 Q2 FY21 FY18 FY19 FY20 LTM 3/31/20 LTM 3/31/21
Operating Profit 16.0 22.7 27.1 21.2 33.0 58.4 66.2 80.0 62.3 104.0
Non-GAAP adjustments:
Depreciation 1.7 1.7 0.5 1.3 1.4 4.8 4.2 5.4 5.1 4.9
Amortization of intangible assets 0.7 0.7 0.7 0.4 0.3 3.4 3.6 2.9 3.2 2.1
EBITDA 18.4 25.1 28.3 22.9 34.7 66.5 74.0 88.4 70.6 111.0
EBITDA margin 14.8% 19.8% 20.5% 17.4% 22.1% 15.3% 16.6% 17.4% 15.2% 20.0%
Stock-based compensation 2.7 2.1 2.2 3.9 4.1 13.2 12.7 9.9 12.2 12.3
Adjusted EBITDA 21.1 27.2 30.6 26.7 38.8 80.6 87.0 98.3 82.8 123.2
Adjusted EBITDA margin 16.9% 21.4% 22.2% 20.3% 24.7% 18.5% 19.5% 19.3% 17.8% 22.3%
Total Life Sciences Q2 FY20 Q3 FY20 Q4 FY20 Q1 FY21 Q2 FY21 FY18 FY19 FY20 LTM 3/31/20 LTM 3/31/21
Operating Profit 6.1 4.2 15.4 20.2 17.1 1.2 13.5 29.8 18.9 57.0
Non-GAAP adjustments:
Depreciation 4.5 4.6 4.8 4.7 4.5 16.8 16.9 18.3 17.6 18.6
Amortization & restructuring related 2.0 2.4 2.1 2.0 2.0 1.5 7.1 8.4 8.1 8.5
EBITDA 12.6 11.2 22.3 26.9 23.6 19.4 37.5 56.5 44.7 84.1
EBITDA margin 13.3% 12.0% 20.6% 22.8% 18.2% 9.9% 11.2% 14.5% 12.1% 18.7%
Tariffs - - - - 5.5 - - - - 5.5
Stock-based compensation 1.5 1.6 1.7 2.8 3.4 5.7 6.8 6.4 6.6 9.6
Adjusted EBITDA 14.2 12.8 24.0 29.8 32.5 26.3 44.3 62.9 51.3 99.2
Adjusted EBITDA margin 14.9% 13.7% 22.2% 25.2% 25.1% 13.4% 13.3% 16.2% 13.9% 22.1%
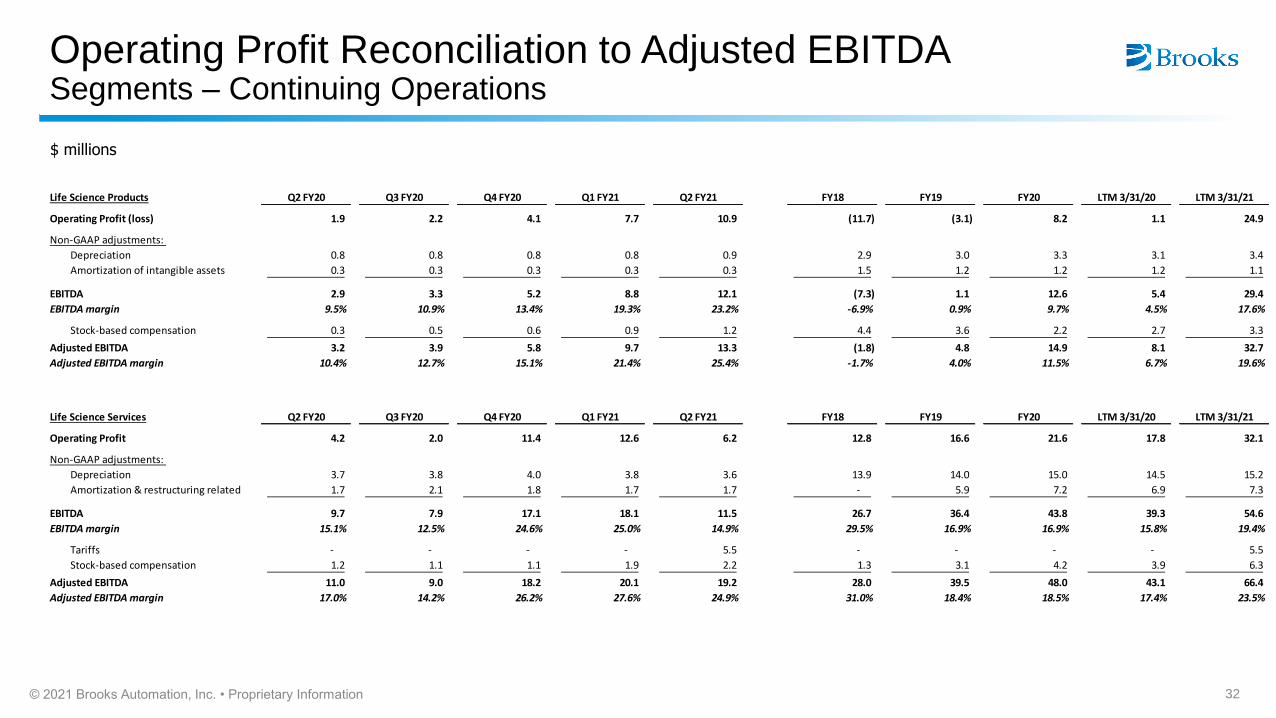
Operating Profit Reconciliation to Adjusted EBITDASegments – Continuing Operations
32© 2021 Brooks Automation, Inc. • Proprietary Information
$ millions
Life Science Products Q2 FY20 Q3 FY20 Q4 FY20 Q1 FY21 Q2 FY21 FY18 FY19 FY20 LTM 3/31/20 LTM 3/31/21
Operating Profit (loss) 1.9 2.2 4.1 7.7 10.9 (11.7) (3.1) 8.2 1.1 24.9 -
Non-GAAP adjustments:
Depreciation 0.8 0.8 0.8 0.8 0.9 2.9 3.0 3.3 3.1 3.4
Amortization of intangible assets 0.3 0.3 0.3 0.3 0.3 1.5 1.2 1.2 1.2 1.1
EBITDA 2.9 3.3 5.2 8.8 12.1 (7.3) 1.1 12.6 5.4 29.4
EBITDA margin 9.5% 10.9% 13.4% 19.3% 23.2% -6.9% 0.9% 9.7% 4.5% 17.6%
Stock-based compensation 0.3 0.5 0.6 0.9 1.2 4.4 3.6 2.2 2.7 3.3
Adjusted EBITDA 3.2 3.9 5.8 9.7 13.3 (1.8) 4.8 14.9 8.1 32.7
Adjusted EBITDA margin 10.4% 12.7% 15.1% 21.4% 25.4% -1.7% 4.0% 11.5% 6.7% 19.6%
Life Science Services Q2 FY20 Q3 FY20 Q4 FY20 Q1 FY21 Q2 FY21 FY18 FY19 FY20 LTM 3/31/20 LTM 3/31/21
Operating Profit 4.2 2.0 11.4 12.6 6.2 12.8 16.6 21.6 17.8 32.1
Non-GAAP adjustments:
Depreciation 3.7 3.8 4.0 3.8 3.6 13.9 14.0 15.0 14.5 15.2
Amortization & restructuring related 1.7 2.1 1.8 1.7 1.7 - 5.9 7.2 6.9 7.3
EBITDA 9.7 7.9 17.1 18.1 11.5 26.7 36.4 43.8 39.3 54.6
EBITDA margin 15.1% 12.5% 24.6% 25.0% 14.9% 29.5% 16.9% 16.9% 15.8% 19.4%
Tariffs - - - - 5.5 - - - - 5.5
Stock-based compensation 1.2 1.1 1.1 1.9 2.2 1.3 3.1 4.2 3.9 6.3
Adjusted EBITDA 11.0 9.0 18.2 20.1 19.2 28.0 39.5 48.0 43.1 66.4
Adjusted EBITDA margin 17.0% 14.2% 26.2% 27.6% 24.9% 31.0% 18.4% 18.5% 17.4% 23.5%