brooks slides - home | itf
TRANSCRIPT

© Mary R. Brooks, 2015
Port Performance
Thoughts to Share
Why Measure Performance?
How to Measure?
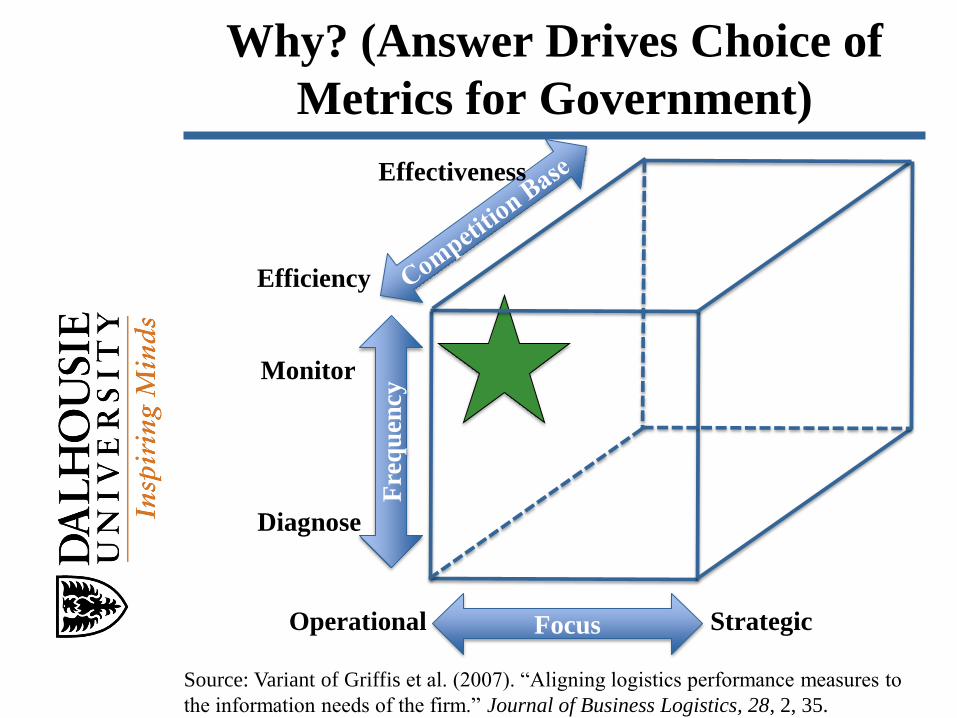
Why? (Answer Drives Choice of
Metrics for Government)
Source: Variant of Griffis et al. (2007). “Aligning logistics performance measures to
the information needs of the firm.” Journal of Business Logistics, 28, 2, 35.
Focus
Fre
qu
ency
Operational Strategic
Monitor
Diagnose
Efficiency
Effectiveness

Why Are You Measuring Performance?
(Port Service Perspective)
Source: Variant of Griffis et al. (2007). “Aligning logistics performance measures to
the information needs of the firm.” Journal of Business Logistics, 28, 2, 35.
Focus
Fre
qu
ency
Operational Strategic
Monitor
Diagnose
Efficiency
Effectiveness

Technical Efficiency
Possible Inputs Possible Outputs
Land (Area in hectares) Throughput (Tonnes, TEUs)
Labour (Number) Profit
Capital Invested Customer Satisfaction
Equipment (Number of cranes) Ship Turnaround
Port Charges Berth Utilization
Performance = Input
Output
Key Issues:
• How to define the element?
• How to collect the data?
• How to do this uniformly across all ports?

What Does Transport Canada Choose
to Measure? Efficiency as Fluidity
Source: Transport Canada Transportation in Canada 2012, Table M-30A.
7 Intermodal Indicators (containers) Units
Truck turnaround time Minutes
Vessel turnaround time Hours
Vessel turnaround time per TEU Seconds/ TEU
Average vessel call size TEU
Berth utilization TEU/ m. of workable berth
Import container dwell time Days
Gross port productivity TEU/ hectare
Gross crane productivity TEU/ gantry crane
4 Bulk Indicators Units
Vessel turnaround time Hours
Average vessel call size Tonnes
Berth occupancy rate Percent
Gross berth productivity Tonnes/ hour
The AAPA’s Customer Service
Initiative Vision
• An independent third-party assessment of use to ports in effecting change and improving service delivery in supply of port services.
• An individualized report to each port that provides “best practice” scores and the port’s scores to provide context to user “importance” and that enables benchmarking for assessing resource allocation
• Each port gets its own report; AAPA gets a “state of its ports” report.
• The first study was done in 2012 and it was repeated in 2014 but with port-specific results only.

What are the Effectiveness Outputs?
The determinants of the effectiveness of service
delivery score for each particular port (using NPE—
normalized pairwise estimation) SCORE
INFLUENCERS for PORTS
A gap analysis (importance minus performance) for
each user SERVICE GAPS (for PORTS)
Direction to each port on their particular ratings and
results, including their relative score in comparison
with the other ports in the survey. BENCHMARK
(for PORTS)
Open-ended comments and demographics of the
survey participants INDIVIDUAL FEEDBACK (for
PORTS)

Evaluation Report Card by Cargo Interests for
the Mystery Port on 9 of 10 Criteria
Evaluative Criteria I-P Gap
Performance
Mean Lowest Highest NPE
Relative
Score
A Criterion A 0.16 5.16 4.21 6.09 0.289 51%
B
Choice of rail/truck/ warehousing
companies -0.40 5.96 5.25 6.12 0.211 82%
C Criterion C 0.21 5.63 4.50 5.89 0.283 81%
D Criterion D 0.24 5.80 5.19 6.11 0.259 66%
E Criterion E 0.32 5.37 4.55 6.19 0.305 50%
F Criterion F 0.15 5.77 5.38 6.33 0.211 41%
H Criterion H -0.31 6.00 5.50 6.61 0.158 45%
I
Provision of adequate, on-time
information 0.96 5.50 5.00 6.08 0.250 46%
J
Terminal operator responsiveness
to special requests 0.75 5.19 4.44 5.96 0.304 49%
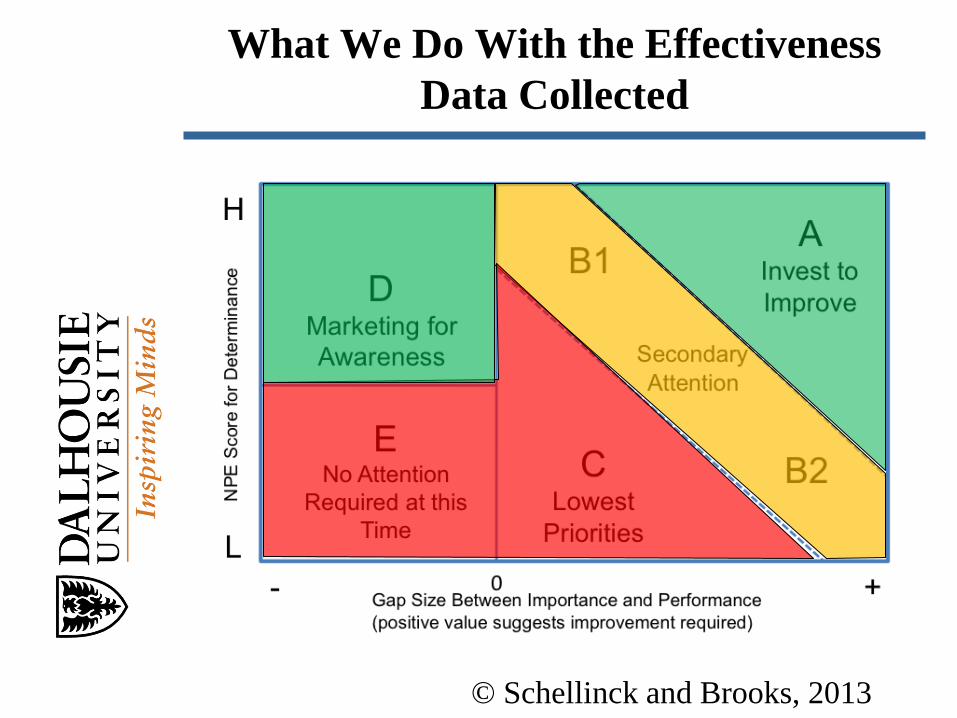
What We Do With the Effectiveness
Data Collected
© Schellinck and Brooks, 2013
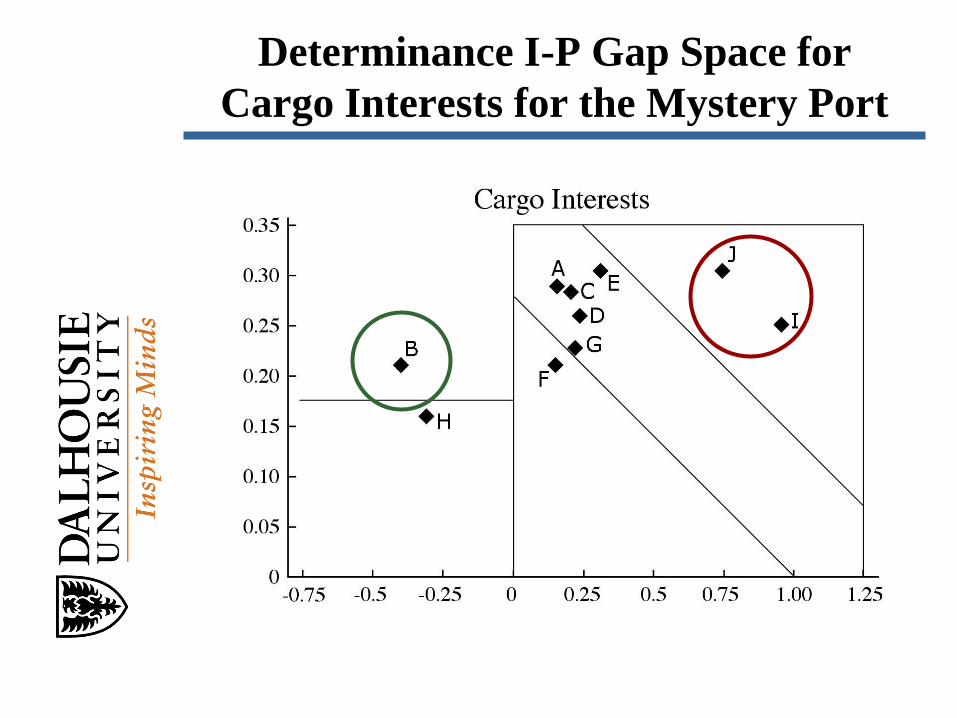
Determinance I-P Gap Space for
Cargo Interests for the Mystery Port

What We Found in 2012
Port user groups rate a port’s effectiveness in service delivery
differently, i.e., a port that is rated highly by the shipping lines
may score poorly when rated by cargo owners or its own
supply chain partners, or vice versa.
No port excelled in serving all three user groups (Cargo
Interests, Shipping Lines, and Supply Chain Partners.)
The pattern of performance gaps were different on the various
criteria for each port.
In all cases, the initiative identified criteria for targeted
improvement for each user group—Cargo Interests, Shipping
Lines, and Supply Chain Partners. Each port had a unique
portfolio of factors to repair by investing for improvement, and
many ports found a usable “market for awareness” opportunity.
East and West Coast patterns were also noted.

What We Found in
2013’s Further Data Analysis
Cargo Owners who book their own transport arrangements
are a distinct sub-group from those who act as Agents for
owners on five of 13 criteria.
Cargo Agents are more influenced traditional CRM criteria like
responsiveness and information provision while Cargo Owners
are more influenced by perceptions of port security.
The two Cargo segments are best evaluated separately where
possible.
We have learned enough to focus the Shipping Line criteria
more tightly in future surveys.
Supply Chain Partners are a forgotten user group for some
ports; with their own unique set of needs, as partners they need
to be part of the solution in developing port strategic
investments.
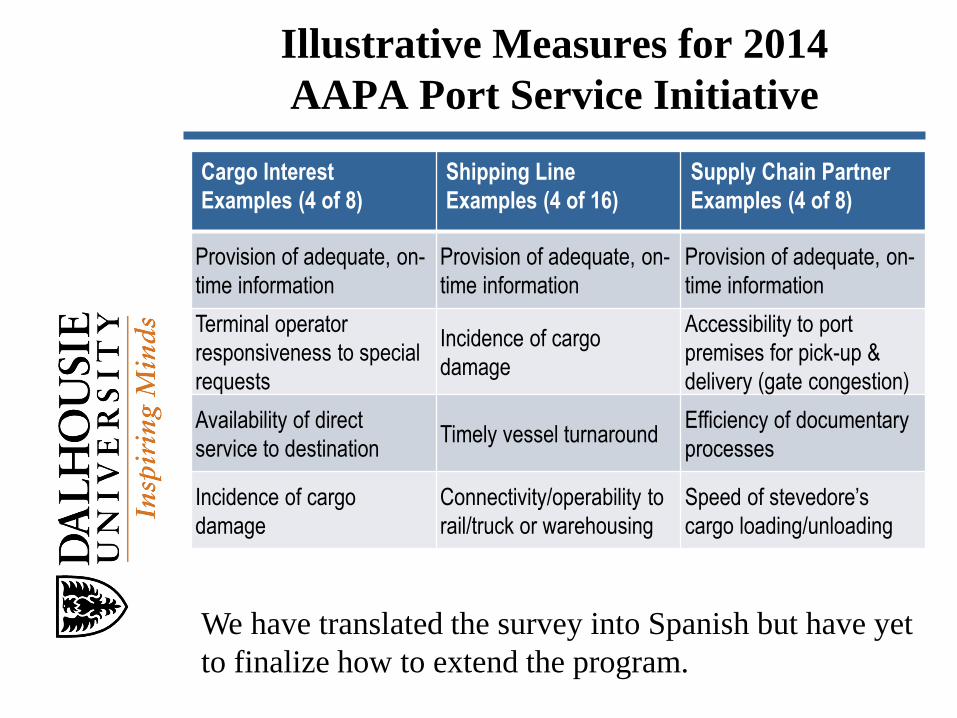
Illustrative Measures for 2014
AAPA Port Service Initiative
Cargo Interest
Examples (4 of 8)
Shipping Line
Examples (4 of 16)
Supply Chain Partner
Examples (4 of 8)
Provision of adequate, on-
time information
Provision of adequate, on-
time information
Provision of adequate, on-
time information
Terminal operator
responsiveness to special
requests
Incidence of cargo
damage
Accessibility to port
premises for pick-up &
delivery (gate congestion)
Availability of direct
service to destination Timely vessel turnaround
Efficiency of documentary
processes
Incidence of cargo
damage
Connectivity/operability to
rail/truck or warehousing
Speed of stevedore’s
cargo loading/unloading
We have translated the survey into Spanish but have yet
to finalize how to extend the program.