brotherhood of st laurence retail study
TRANSCRIPT

Brotherhood of St Laurence Retail Study
Research Report, 2005

The Australian Centre for Retail Studies, October 2005 2
The information contained in this report has been prepared for Brotherhood of St Laurence
Australia by The Australian Centre for Retail Studies and may not be reproduced without
the permission of Brotherhood of St Laurence.
Prepared by: Catherine Nicolas and Carla Ferraro
Contact: The Australian Centre for Retail Studies (ACRS)
Level 6, Building S
26 Sir John Monash Drive
Caulfield East VIC 3145
Tel: (03) 9903 2455
Fax: (03)9903 2099
Email: [email protected]
Website: www.buseco.monash.edu.au/centres/acrs

The Australian Centre for Retail Studies, October 2005 3
Background and Scope of the Brotherhood of St Laurence Retail Study
This report presents the findings of research into the Brotherhood of St Laurence (BSL)
retail stores, conducted pro-bono by the Australian Centre for Retail Studies (ACRS). The
research was initiated by BSL to evaluate their current retail offering through the eyes of
their customers. Consequently, the ACRS undertook secondary research, a competitor
analysis (focusing on three competitors selected by BSL), a financial analysis and a
customer questionnaire. The customer questionnaire formed the major component of this
research. The purpose of the questionnaire was to identify who BSL customers are, to
determine customer perceptions regarding BSL stores, discover the reasons why
customers shop at BSL stores, and understand the factors that influence how often
customers shop and how much they spend. These results will enable BSL to increase
customer satisfaction and to enhance the shopping experience within BSL stores. Further
it can be used to form strategies aimed at increasing the number of times customers shop
at and the amount they spend per transaction.
Summary of Key Findings
Charity retailing is an important and growing sector of retail trade in Australia,
however information regarding this industry is lacking
Several industry trends and challenges are affecting the ability of charities to delivery
their services. These include:
o An increase in the demand for services
o A reduction in traditional governmental financial support
o An increase in the number of charity organisations
o Increasing pressure to sustain and increase profits due to heightened
competitive conditions
o More centralised decision making
o The introduction of new merchandise for sale in charity shops
o A decrease in donor giving

The Australian Centre for Retail Studies, October 2005 4
Financials
o Sales have fallen significantly in recent years although Auxiliary stores
performance has been more stable
o Profits have fallen dramatically since 2003, with the profit to sales ratio
currently at 2.5%
o Auxiliary stores are performing better in financial terms than Managed stores
The majority of BSL customers are:
o female,
o educated,
o working,
o retirees or young singles,
o have 2 people in their household, and
o earn between $30-60k
Customers have very positive responses towards all BSL store characteristics
Product range, product pricing, customer service, and store location are all
important in increasing customers’ spend and visits to a BSL store
BSL customers visit at least once a week to ‘hunt’ for a bargain or a good deal and
spend $10 or more
Clothing and accessories, bric-a-brac, books, and footwear are the most popular
purchases at a BSL store
BSL customers make purchases because the goods are value for money or they
needed something specific
Goods at BSL stores are considered to be of very good value for money
Customers are prepared to pay $2 more for goods they purchase at BSL stores
Customers would consider buying new clothing and accessories, footwear, bric-a-
brac and books
Customers would consider using a Café and Photocopying & Printing services at a
BSL store
BSL customers also shop at other charity shops

The Australian Centre for Retail Studies, October 2005 5
Table of Contents
Background and Scope of the Brotherhood of St Laurence Retail Study .......................... 3
Summary of Key Findings................................................................................................. 3
Table of Contents............................................................................................................. 5
1.0 Secondary Research ............................................................................................. 7
Non-Profit Organisations .................................................................................................. 7
Charity Retailing ............................................................................................................... 8
Industry Size .................................................................................................................... 9
Factors behind the Growth in Charity Retailing.................................................................. 9
Volunteers versus Paid Employees ................................................................................. 10
Volunteers and Charity Retailing ..................................................................................... 11
Paid Employees and Charity Retailing............................................................................. 13
Sourcing of Goods ......................................................................................................... 14
Industry Trends and Challenges ..................................................................................... 16
2.0 Key Competitor Analysis...................................................................................... 20
The Salvation Army ........................................................................................................ 20
St Vincent de Paul.......................................................................................................... 26
Savers............................................................................................................................ 29
3.0 Summary of Store Visits....................................................................................... 32
4.0 Financial Analysis................................................................................................. 35
Sales.............................................................................................................................. 35
Cost of Goods Sold........................................................................................................ 37
Operating Expenses ....................................................................................................... 38
Gross Margin ................................................................................................................. 40

The Australian Centre for Retail Studies, October 2005 6
Stock Turnover............................................................................................................... 41
Profit .............................................................................................................................. 42
Breakeven Analysis of Store Types ................................................................................. 44
5.0 Customer Questionnaire ...................................................................................... 46
6.0 Recommendations .............................................................................................. 72
7.0 References .......................................................................................................... 73
APPENDIX A: Customer Questionnaire ........................................................................... 75

The Australian Centre for Retail Studies, October 2005 7
1.0 Secondary Research
Charity retailing is an important and growing sector of retail trade in Australia, however
information regarding this industry is lacking. This is largely because Australia does not
have a governing body to collect data on charity organisations’ retail activities. In addition,
charity organisations do not release detailed financial data regarding their retail operations.
Therefore, Australian charity retailing industry statistics, trends and characteristics are not
readily available, making comparisons and benchmarking a difficult task. It is important to
note, however, that this problem is not isolated to Australia, with the exception of the UK
where charity retailing has been a topical issue. The following section brings together the
scare information available in a bid to understand the key characteristics and drivers of
charity retailing in Australia.
Non-Profit Organisations
In Australia, and throughout the world, non-profit (NP) institutions play an important role in
the delivery of welfare, healthcare, education, and other key services. They can be defined
as groups of people committed to the provision of a service for themselves or others, to
the representation of their interests or lobbying on behalf of others, or to the practice of
religion (Lyons, 1999).
The number of NPs has ballooned in recent years, growing from 12,000 in 1940 to more
than 1.5 million organisations in 2003 (Aoki, 2003). According to the Australian Bureau of
Statistics (2002), the NP sector plays an increasingly important role in the Australian
economy. The Bureau states that the total income raised by the sector grew from $26.6
billion in 1995–1996 to $33.5 billion in 1999–2000, representing an annual average growth
rate of 6.5 percent.

The Australian Centre for Retail Studies, October 2005 8
The NP sector accounted for 3.3 percent of total GDP in 1999–2000, a contribution
greater than many other commercial industries such as communications, gas and
electricity, accommodation, cafes, and restaurants. NPs also accounted for 6.8 percent of
total employed persons during the same period and volunteers worked 558 million hours,
which equates to 285,000 full time positions.
Charity Retailing
A key avenue through which NP organisations raise funds is through charity shop retailing.
Charity shops provide a vital source of “unallocated” funds; they can be used in any area
of charitable work because they are not pre-allocated to any specific project (Parsons,
2002). Other than raising funds for the organisation, charity shops also fulfil a wide range of
other roles in their local communities (Parsons, 2002). These include:
providing a contact point between the parent charity and the general public
providing clothes and household goods cheaply for customers
providing useful employment support and training for a range of volunteers
recycling unwanted household items
Despite moves towards professionalisation, charity
shops still exist on a broad continuum. At one end are
small stores that are volunteer-managed, selling
donated goods only, and charging very low prices and
sited in back and side streets. At the other end, are
more “upmarket” shops, which employ paid
management, sell both new and donated goods and
occupy more prominent, high street premises. Therefore
charity retailing embraces a spectrum of approaches to
the many facets of retail management including locating,
presenting, staffing and resourcing shops (Parsons,
2002).

The Australian Centre for Retail Studies, October 2005 9
Industry Size
While the NP sector contributes over $33 billion to the Australian economy, it is not known
what proportion of this resulted from retail trade. However, the size on the Australian
sector is comparable to that in the UK in terms of growth and contribution to the national
economy.
In 1990, there were just over 3200 charity shops in the UK, and by 2000 they had almost
doubled to 6300 (NGO Finance, 2000). The total sales of charity shops in the UK grew
from £183.3 million in 1992 to £426.5 million in 2002 (Parsons, 2002). However, the signs
at the beginning of the 21st century are that the growth of the 1980s and 1990s is not
sustainable. Competition from discount commercial retailers (Charter, 2000), and an overall
saturation of the charity shop market, has seen diminishing returns with charities forced to
cut costs, and some to close outlets altogether.
Factors behind the Growth in Charity Retailing
There are a number of reasons why charity shops have thrived over the last decade, both
in Australia and abroad (Parsons, 2000; 2005). Reasons include:
A climate where as consumers have become increasingly willing to try a complex
array of retail formats, resulting in more diverse patronage habits
Increased environmental awareness amongst consumers has boosted both
donations and custom in charity outlets
Shopping in charity shops has both increased in popularity and become de-
stigmatised as shop numbers multiply and charities become more professional in
their retail activities
The introduction of new goods in the shops has further diversified their customer
base
Perceptions of charity shops as serving only the less affluent in society have now
largely died away, and as a result, a range of customers across class and economic
status now patronise charity shops

The Australian Centre for Retail Studies, October 2005 10
Volunteers versus Paid Employees
Volunteers are becoming increasingly difficult to recruit. This is attributable to the dramatic
rise of charity shop numbers, all of which are competing for volunteers, as well as the
increased competition for volunteers in the voluntary sector generally. It may also be
associated with the notion of the commercialisation of the charity retail sector, which
perhaps dissuades traditional volunteers from offering their services (Broadbridge and
Parsons, 2003). Consequently, there is competition in the recruiting and retention of good
volunteers. One way to overcome these issues is to pay shop staff. However, this brings
staffing into competition with established retailers and means that wages and working
conditions have to be comparable to established retailers in order to attract the most
skilled workforce.
The payment of shop managers is undoubtedly the most obvious symbol of the move
towards professionalism in the sector. While large charity retailers have retained their
volunteer workforce at shop assistant level, most now employ paid shop managers to
oversee these volunteers. In fact, 82 percent of charity shops are now managed by at least
one paid staff member. Independent charities have been slower to move to a paid
management model. However, in the UK independent charities now employ a higher
percentage (95 percent) of managers than large chain or hospice retailers (Parsons, 2004).
Despite moves to paid management, the links between paying managers and increasing
profits are not clear – and it is suggested that in this industry, paid management is not a
key success factor. Whilst paying managers does, in many cases, result in an increase
turnover, the associated costs may override this. One key problem is that more often than
not, managers are placed in charity shops without thought given to training and support
which results in poor management of stores and wasted resources (Parsons, 2004).

The Australian Centre for Retail Studies, October 2005 11
Volunteers and Charity Retailing
The use of unpaid staff is a major difference between the traditional retailer and the charity
retailer and volunteers will undoubtedly remain a large resource that need to be managed
by charity retailers. The retail volunteer can be on the one hand the biggest asset, working
for no financial reward, and on the other hand the biggest headache because often he/she
has their own very definite ideas of how the operation should be run. In order to be
properly managed, retailers need to understand the characteristics of this segment of their
workforce. According to one of the few studies on charity retail volunteers (Horne, 1998)
the volunteer workforce is almost all (98 percent) female, indicating that women are even
more predominant in charity shops than they are in traditional retail outlets. Not only was
this found for volunteers on the shop floor, but it also applied to shop and area managers
– all of whom were women.
Unlike retail employment
research, where it has been
shown that women are over
represented in the less skilled
retailing categories, this survey
found that women predominate
at all levels of retail charity
volunteering. Managerial
responsibilities for the shops,
which are not traditionally
regarded as women’s roles in ordinary retailing, are undertaken by female volunteers.
However, the shops are not operated by paid managers who work on a full-time basis.
The majority of the respondents are aged 55-64, with the largest cohort between 65 and
74. Three-quarters (76 percent) of the volunteer workforce were over the age of 55.

The Australian Centre for Retail Studies, October 2005 12
The survey also found that 60 percent of female and 47 percent of male respondents
volunteer for four hours per week, while 27 percent of females and 40 percent of males
volunteer for 8 hours per week. Seven per cent volunteer for between 9 and 12 hours per
week; these were all women. Very few volunteers were also found to work beyond 12
hours a week. Only two managers reported working over 30 hours per week; most
managers volunteer for 8 or 12 hours per week.
Most managers volunteer for 8 or 12 hours per week, and are therefore not physically
present in the shop for three quarters of the trading week. These findings are significant for
charity organisations in an increasingly competitive market. The survey also found that the
shops do not, in general, have deputy managers. When the manager is unavailable at the
shop, she generally designates another volunteer to cover for her.
Almost half (48 percent) of the volunteers surveyed had a personal affiliation with the cause
of the charity being investigated. A further quarter (28 percent) of the volunteers chose this
charity primarily because they believed the mission of the charity to be a worthwhile cause.
Eight percent of volunteers chose this charity directly as a response to an appeal for help,
while 6 percent because they were lonely at home, had time to spare or lived nearby.
Almost one-third of volunteers believed charity retailing to be the most interesting form of
charity work, while a third wanted to meet people and make friends and felt that charity
retailing as opposed to other forms of charity work gave them this opportunity. Nearly a
quarter of the volunteers had been asked to help or already had friends in the shop.

The Australian Centre for Retail Studies, October 2005 13
Paid Employees and Charity Retailing
While in the early years of charity retail most shops were managed almost entirely by
volunteers; in an increasingly competitive environment, employing paid staff in charity
shops is seen as the only effective way to increase sales and compete in a an increasingly
professional sector (Parsons and Broadbridge, 2004). The payment of store managers is
now practised widely in the Australian charity retail sector. Nevertheless, employing paid
managers has to be cost-effective as the overall objectives of the charities are to raise as
many funds as possible. Generally, the payment of managers is justified in terms of being
able to operate in a more professional and profitable manner.
Charities do, however, experience difficulties in paying employees for a number of reasons.
Firstly, remuneration is generally low and in some instances not much higher than the
national minimum wage. This low salary often poses difficulties in attracting suitable
candidates with the right skill sets to the job, and at times, someone less than ideal is
selected for the position. There is also the potential for fraught relationships between paid
managers and volunteer staff. The payment of sales assistants is potentially even more
problematic, and can cause considerable resentment and conflict with those who
volunteer in the shop.
Managing a charity shop involves much hard physical work as managers are heavily
involved in the preparation of stock for sale. Managers must also possess a developed set
of communication skills to manage volunteers adequately as well as a sense of
entrepreneurship to make creative (and profitable) use of limited stock and labour
resources. In addition, the work is poorly paid and holds few opportunities in the way of
career progression. This issue may be one that charities have to tackle. Indeed, some have
begun to do so by focusing on staff development and training, and introducing
performance based bonuses. Some charities also have inserted a management tier in
between shop managers and area managers creating senior shop managers. These new

The Australian Centre for Retail Studies, October 2005 14
posts extend the shop manager’s role to include the provision of three or four charity
shops (Broadbridge and Parsons, 2003).
Looking specifically at the characteristics of charity retail managers, research shows that
an overwhelming 94 percent are women and nearly half (47 percent) aged 50 or over.
Managers tend to be married or living with a partner (70 percent), have no dependants (61
percent), and not be the chief wage earner in their household (61percent). Most managers
tend to be educated at a high school level but 22 percent have no formal educational
qualifications (Parsons and Broadbridge, 2004).
Sourcing of Goods
Charities compete for good quality donated second-hand
goods which, as the number of shops increases becomes
increasingly difficult. The search for the best quality
donated goods has led to greater sophistication in charity
retail “distribution” methods. In the past, most charity
shops relied on donors bringing unwanted goods to
individual shops. In doing so, there is little control over
distribution, no means of monitoring which location goods
are from, or how regularly donors provide the goods or any
means of moving them from shop to shop. The
pedestrianisation of the high street in many towns has also caused a downturn in the
number of goods being given in to individual shops. Donors are finding it harder to “park
and drop” and for many donors it was either too embarrassing to carry goods in or the
goods were too heavy (Horne, 1998).

The Australian Centre for Retail Studies, October 2005 15
While there appears to be a growing trend towards donation to charity shops, competition
between charities for these donations has meant that shops are still struggling for stock.
Charity retailers are actively seeking extra donations through a range of means. These
include: introducing new merchandise into shops, undertaking bag drops, seeking goods
in kind from commercial retailers and circulating stock between shops to make up deficits.
Initially, bag drops were a popular method of actively seeking donations amongst charity
multiples, but competition from both other charities and private rag merchants has
rendered this method less than lucrative. As a result, many large chains are cutting back
on their bag dropping activities and concentrating their resources into other methods of
acquiring stock (Parsons, 2004). Many of the more professional charity retailers now
operate their own pick up and distribution systems. Van drivers, many of whom are
employed on an hourly rate or are self-employed, drop bags in neighbourhoods and call
back for them at a later date. Charities operating this system suggest that it is the control
and monitoring of these systems which make them so much more useful than traditional
collection bins (Horne, 1998).
In Australia, problems with the quality of goods deposited at charity bins (discussed in the
next section in more detail) has meant that charities are increasingly diversifying their
avenues through which goods are sourced. At the forefront of this trends has been the
Salvation Army who no longer rely on deposit bins, instead they have invested in smaller
bins inside stores, clubs and offices, home pick-up of goods and paying community clubs
for collecting goods on their behalf.

The Australian Centre for Retail Studies, October 2005 16
Industry Trends and Challenges
Several market trends are affecting the ability of charities to deliver their services. For
instance, the increasingly competitive charity sector is characterised by an increase in the
demand for services, a reduction in traditional governmental financial support, and an
increase in the number of organisations (Ignacio, Gonzalez, Vijande, and Casielles, 2002).
As a result, charities are now fighting over smaller funding budgets, a smaller pool of
volunteers and struggling as they have to implement business practices that will ultimately
make them more accountable, profitable, an attractive to future business partners (Goerke,
2003; Rados, 1996). This has, in turn, brought about a number of challenges including
managing financial resources, managing human resources including volunteers, managing
changing consumer needs, and challenges of finding new markets, new partners and new
ways of working (Inglis, Alexander, and Weaver, 1999).
Shop managers are under increasing pressure from charities, particularly to sustain and
increase profits. This is not easy in today’s competitive climate where both good quality
donated stock and volunteers are in short supply. This means that managers are working
increasingly hard to increase sales through careful pricing, display and merchandising, and
regulating the stock on the shop floor by coordinating changeovers and promotions and
generally keeping stock moving. This is especially important because many customers visit
the shops very regularly so changing stock is essential to keep them interested in making a
purchase. However by transforming these spaces into professional retail outlets charities
may extinguish the very features that charity shops rely on for their success (Parsons,
2004). By maximising profit – and thus maximising prices obtained for goods – the shops
may ironically hurt those they are collecting money for and the volunteers dedicated to the
cause.

The Australian Centre for Retail Studies, October 2005 17
There has also been a trend towards more centralised decision making. Rather than the
traditional system where store managers make decisions regarding pricing, merchandising
and promotion, these decisions are now being made in centralised locations. Research
suggests that this may not be the best strategy in terms of keeping staff motivated and
satisfied (Parsons and Broadbridge, 2004). In a UK study, managers agreed most strongly
with the statement that “Too many decisions are made by head office without branch
managers’ consultation” (64 percent agreed or agreed strongly). They also tended to
express agreement with the statements “I would like more opportunity to influence
decisions made by the charity” (51 percent agreed or agreed strongly) and “I feel
constrained by head office rules” (50 percent agreed or agreed strongly). These findings
indicate that managers are concerned about their wider role within the organisation;
wanting to be consulted on decisions made at higher levels and wanting to have some
influence within the organisation.
The introduction of new merchandise in charity shops has become a popular strategy for
these organisations. However, it has become apparent that some volunteers find the
concept of selling new merchandise difficult to understand and the introduction of new
goods is perceived by some to be changing the nature of their volunteering altogether.
Many report that money is being spent unnecessarily on the purchase of new goods and
do not appreciate the reasons for the change (Horne and Broadbridge, 1995). If new
goods are on sale then charity shops will begin to compete more directly with each other
(Horne, 1998).
Competition is an issue that has affected all charity retailers. However, competition is
more than just existing charities dividing up available funds, but also the result of new
focused charities being developed to examine specific aspects of a social issue
(Joachimsthaler and Aaker, 1997). It is estimated that on top of the 30,000 plus registered
charities, a new foundation is established at least every four days (Brook, 2002). This is
mainly due to the Government’s withdrawal from many areas of social welfare provision
(Bennett and Gabriel, 2003).

The Australian Centre for Retail Studies, October 2005 18
The increase in competition and its
effect on the ability to attract finding
is compounded by a decrease in
individual giving. A charity funding
report by UK research group Key
Note (Marketing Week, 2001)
reported that giving has dropped
steadily since 1993. Other figures
indicate that donations have steadily
been declining for over 20 years
(Fletcher, 1998), with the biggest
drop among younger audiences (Hughes, 2003).
This can, in part, be attributed to the sheer number of charitable organisations. According
to a British survey, adults believe that “there are too many charities doing similar work and
competing with each other” (Poole, 2000, p.9). Individual giving behaviour has also
changed as donors no longer remain loyal to a cause over their lifetime, and are more
selective and sophisticated in their giving.
The progressive reduction in government and donor support has led charities to
diversify their sources of revenue (Mariiez, 2003), leading to a growth in cause related
marking. Cause related marketing can loosely be defined as a product promotion that
pledges to donate money or good goods to a worthy cause (Anonymous, 2003).
Corporate brands meet their economic responsibilities and improve corporate reputation
on a number of levels, whilst charities gain increased funding and awareness for their
brands (Martinez, 2003). The Australian government has been actively encouraging these
business partnerships between the profit and non-profit sectors (Busch, 2001) and the
many benefits that can be gained by charities has meant that there is an increased
imperative for them to create partnerships with profit-driven organisations (Goerke, 2003;
The Australian Centre for Retail Studies, October 2005 19
Irwin, 2003). However, corporate Australia has put pressure on charity organisations to
develop better marketing and business skills when seeking funding from them (Burbury,
2003), thereby raising more difficulties for charities.
Problems related to stock management and stock control are also affecting charities
financially. Charities are paying more than $1 million a year to clear household rubbish
dumped outside their stores by Victorians. This is forcing funds to be diverted from
essential programs for the state's most needy. Thieves are also stealing from charity shops
overnight, taking the best items left outside by well-meaning donors and scattering the
rest, making much of it useless. Piles of kitchen waste, garden clippings, building
materials, car parts and syringes are regularly dumped outside Victorian charity centres.
Rubbish dumped into charity clothing bins has caused many organisations to reduce the
number of their bins with the Salvation Army cutting its bins by two-thirds. The Salvation
Army previously spent $500,000 a year on tip fees in Victoria, with transport and labour
costs adding to the bill (Rindfleisch, 2005).
Thieves are stealing up to $750,000 worth of clothing and goods from Salvation Army
family stores each year. Up to 150,000 donated items disappear each year from the
Salvos' 54 Melbourne stores as well as the few charity bins around the state. While in any
retail organisation theft has always been a problem, this problem is reported as getting
worse. In response charities have to invest in putting staff through training sessions to try
to improve their awareness of it and to try to reduce it as much as possible and some are
employing staff to collect goods from outside stores before they were stolen (Hodgson,
2004).

The Australian Centre for Retail Studies, October 2005 20
2.0 Key Competitor Analysis
The Salvation Army
The Salvation Army in Australia is part of an international movement
whose message is based on the Bible. Active in 103 countries, the
Salvation Army is evangelical part of the universal Christian Church
whose mission is to preach the gospel of Jesus Christ and to meet the
needs of the community in his name without discrimination. Their work in Australia is
based in two territories; Eastern Territory (NSW, ACT and Queensland) and Southern
Territory (Northern Territory, Tasmania, Victoria, and Western Australia). Both of these
territories answer to the global Salvation Army head office in London.
The Salvation Army assists 1.08 million people each year throughout Australia and spends
$318 million delivering its social services. In the 2004-2005 fiscal year, The Salvation Army
in all of Australia received $106,099,300 through donations in the following areas:
Red Shield Appeal: $58,546,500 Wills and Bequests: $41,220,900 Tsunami Appeal: $ 6,331,900
Their total fundraising costs amounted to less than 12 cents on the dollar. According to
the Salvation Army, their average mail donation is $65, their average phone donation is
$133 and their average internet donation is $196.
The largest campaigns run by the Salvation Army are its Red Shield Appeal and its Kmart
Wishing Tree Appeal.

The Australian Centre for Retail Studies, October 2005 21
In the UK, the Salvation Army has developed a strategy intended to seriously compete as
a value retailer over the coming years. They plan to more than double store numbers (from
45 to 120) and to refurbish all their stores, placing them under five distinct banners. Each
separate banner will offer a distinct range of products and managed by a team of retail
professionals (Retail Week, 2005). The new store offering is listed as:
Again: clothing, home accessories and books Bargain: sell clothing and charge customers by the weight of their purchase Live Again: specialises in homewares Read Again: specialises in books Re: vintage wear and original designer clothing
In Australia Salvation Army stores are known in the Eastern Territory as Salvos Stores and
in the Southern Territory as Salvation Army Family Stores. They operate in accordance to
slightly different missions and visions, however they are based on the same core values:
“Salvos Stores is committed to continually redevelop our donor base of gifted and new products and provide our retail customers with goods at affordable prices; thereby assisting The Salvation Army to be more effectively mobilised for mission.”
“Family Stores is the Recycling Division of The Salvation Army and is committed to provide services in harmony with Christian principles and providing funding for The Salvation Army.”
The purpose of Salvation Army stores throughout Australia is stated as being to:
Commit to providing all services in harmony with Christian principles Assist the community by providing reasonably priced, quality, used clothing,
furniture and other household goods Provide free goods to families referred by a welfare officer of The Salvation Army
Family Support Services Contribute to the protection of the environment by reducing the quantity of textiles
and household goods delivered to land fill, by recycling waste and providing industry with recycled cleaning materials
Providing a 'work environment' for volunteers, rehabilitation program for addicted clients, work for the dole and community services order persons
Providing a substantial financial surplus each year to Salvation Army Corps and Centre programs through Territorial Headquarters General Fund

The Australian Centre for Retail Studies, October 2005 22
The objective of the retail stores is to clear a minimum of 20% surplus from trading which
is paid into The Salvation Army general funding account to underwrite part of the annual
budget for their work throughout Australia.
According to their annual
report the total costs of
providing all Salvation Army
social services in the
Southern Territory for the
2003-2004 fiscal year was
over $288 million. Family
Stores accounted for 17% of these costs, which equates to close to $49 million. While
exact figures are not publicly available trading revenue (of which the Family Stores form the
majority) in 2003-2004 was $48.8 million.
The Salvation Army stores have been operating in some form or other for the past 116
years. Family Stores operate 206 Retail Stores throughout the Australian Southern
Territory. In Victoria alone there are approximately 98 retail outlets.
Of the total retail sales at Salvos Stores, approximately 10% are new products which The
Salvation Army purchases for resale. These stock items are quality products at attractive
prices and supplement the recycled donated products given by the general public for
resale.
Clothing is the Salvation Army’s biggest source of trading and accounts for approximately
70% of our business activity.
Once goods are collected they are sent to a central processing centre in the nearest
capital or regional city for sorting and pricing; ensuring a consistent standard of quality and
pricing. They are then distributed to one of the Salvos Stores retail outlets in Eastern
Australia to be sold to the general public at attractive prices.

The Australian Centre for Retail Studies, October 2005 23
However, products are always available free of charge to families and individuals in
genuine need who have been referred by a Salvation Army Officer to a store.
New recycled stock is delivered at least once per week to each store and after two weeks
on the racks is available for sale at half price during the third week. By the end of the fourth
week the unsold used clothing stock is culled out and sold through wholesale means. This
strategy ensures that stock is constantly refreshed and that customers always have new
stock and specials from which to choose.
The Salvation Army retail operations use both volunteer and paid staff managed by cluster
managers. All management and supervisory staff are paid salaries in line with awards and
commercial practices. In addition, to support those staff members, stores are operated
with the support of around 800 volunteers and people seeking employment through
government support programs.
The growth in Salvation Army stores are largely attributable to
the business decisions made in the mid 1990s to run Family
Stores along management lines of commercial retail operations.
Staff are fully trained in retail practice, they wear corporate
uniforms and stores and trucks are fitted out in corporate
colours and logos. Furthermore staff are now offered a career
path into management, with internal promotions a high priority.
The Salvation Army has also made a
concerted effort to market their stores so as to appeal to a range of
demographics. The current campaign is targeted at youth who are
interested in vintage clothing at a low cost. The campaign is
modern and goes along way to changing the image of Family
Stores as a place just for the needy. Further, they also have
campaigns aimed at families who are interested in saving money.
This indicates that the Salvation Army is being proactive and are

The Australian Centre for Retail Studies, October 2005 24
very advanced when it comes to marketing of their stores. Rather than relying on
emotional appeals and the loyalty of long-term customers they are making attempts to
attract new shoppers and customers who may not have considered shopping at a family
store.
In 2004 The Salvation Army axed its outdoor clothing bins because disposing of trash
abandoned at Victorian stores cost the Salvos $500,000 in tip fees a year (Herald Sun,
2004). Originally 650 bins were in use, but with the costs of disposing the rubbish left at
the sites mounting these have been phased out in favour of other collection methods.
Salvation Army bins are now inside their stores, and available only for "open hours"
donations. The charity has also boosted its home pick-up service.
In a bid to combat the shortage of donated goods to supply their retail chain the Salvation
Army has developed a range of new strategies which are focussed on making them more
“donor friendly”. These include:
Opening stores in evenings and on a Sunday for collections
Increasing Sulo Banks to replace out-door Clothing Banks
Community Recycling Partners
Online Donations
Expansion of the “Red Bag it for the Salvos” campaign throughout Australia
Dollars for donations campaign: with the help of Community Recycling Partners the
Salvation Army has developed a campaign to increase the level of donations received by
collecting from clubs, schools and community groups. In return for organising a collection
drive, the club receives a financial payment.
Online product catalogue: is used as part of its retail offering, and is available exclusively
from its Family Stores or online. The main product line available through Family Stores and
the online catalogue are bulk laundry, cleaning and body products.

The Australian Centre for Retail Studies, October 2005 25
Home collection service: To increase the number of collections their stores receive the
Salvation Army also has a home collection service. After calling a centralised centre, bulky
items such as furniture are collected at no cost.
Sulo Sallys: smaller bins (pictured below) have been placed inside dry cleaning stores,
Family Stores and selected office locations. These bins were introduced to provide donors
with a convenient location where goods can de dropped off and to attract better quality
donations than those dropped at the door.
Red Bag Campaign: each year throughout Australia the “Red bag it for the Salvos”
campaign is run to increase the donations of goods. According to the Salvation Army the
campaign is two-fold:
To keep the important message of recycling before the general public
To keep the clothing coming in, particularly during the winter months when there is
high demand for items - particularly with those who are finding it hard to make ends
meet

The Australian Centre for Retail Studies, October 2005 26
St Vincent de Paul
The St Vincent de Paul Society has
presence in 130 countries internationally
and has over 950,000 members
worldwide. The organisation was established by Frederic Ozanam in France 1833 and its
Australian operations were founded by Fr Gerald Ward at St Francis’ Church in Melbourne
in 1854. In Victoria, St Vincent de Paul is over 150 years old and has over 7,000 members
and volunteers providing assistance to over 660,000 people through its two arms: St
Vincent de Paul Society Victoria Inc. and St Vincent de Paul Aged Care & Community
Services.
The Mission of the St Vincent de Paul Society in Australia is to deepen the Catholic faith of
its members and to heighten the awareness of Jesus Christ. In this mission of service, St
Vincent de Paul works with the poor, by respecting their dignity, sharing their hope, and
encouraging them to take control of their destiny.
The focus of retailing for St Vincent de Paul is to provide the best quality items to
customers and to build a reputation as places where genuine treasures and bargains can
be found.
St Vincent de Paul has around 250 retail centres in
operation throughout Australia, 94 of which are
located in the state of Victoria.
Approximately 4,000 people volunteer in St Vinnies
Shops in Victoria and approximately 73 people are
paid employees, including Managers, Warehouse
Staff, Area Managers and Centres Administration Office Staff. Employee numbers equate
to only 1.8% of the total number of people who work in Vinnies Shops.

The Australian Centre for Retail Studies, October 2005 27
The aim of St Vincent de Paul Society Vinnies Shops is to provide high quality, low cost
furniture, clothing and household items to people on low incomes or who are in need, as
well as to the general public at a low cost. In addition, Vinnies Shops play a critical role in
distributing and co-ordinating goods during disasters and other emergencies.
All profits raised from the sale of stock in the shops goes towards providing resources and
support to those in need. Much of this money is used to buy food for local families in need.
Vinnies Shops not only sell essential
items at affordable prices, but
continue to provide a visual presence
of the organisation in the community
and an easily identifiable point of
contact for people seeking assistance
and community fellowship.
In the non-metropolitan areas, many
Vinnies Shops also provide a
confidential waiting area and interview referral room for people seeking assistance where
brief information can be obtained to refer the person to other Society services such as
home visitation or counselling.
In the past few years, a national decision was made to rename the Society’s Centres of
Charity to Vinnies Shops. During the past 12 months, St Vincent de Paul has also made
concerted efforts to improve its retailing standards and provide a modern, fresh and
popular shopping environment for both its clients and customers. This has been achieved
by means of major renovations to many of its stores and retail facelifts.

The Australian Centre for Retail Studies, October 2005 28
St Vincent de Paul also has a newly developed INNZONE concept, which includes youthful
fashions of today and originals from the 60s, 70s and 80s. This strategy has proved to be
an extremely popular initiative attracting both bargain hunters and vintage clothing
enthusiasts. Its success has seen the Society introduce the concept to a further nine
shops across metropolitan and regional areas.
They have also refurbished the shop in Brunswick to convert it into Victoria’s very first
Vinnies INNZONE concept shop. True to the concept, the store is bright, eclectic and
provides a “veritable treasure chest of goodies for retro shoppers”. Furthermore, world
renowned children’s entertainers The Wiggles continue to provide their support to the
Society for a national campaign promoting Vinnies Shops.
The St Vincent de Paul Society also operates six charity supermarkets around Australia, all
of which are staffed and managed by volunteers. St Vinnies food stores sell 10,000 lines of
groceries, from milk and bread to tinned food, ice cream, frozen and fresh meat, cleaning
products, toilet paper and shampoo at quarter of their price in major grocery chains. Only
pensioners, health card holders and those on government benefits are able to shop in
these supermarkets for which donations are sought for goods from manufacturers and
suppliers, as well as cash donations from the public.
The Society's retail centres rely solely on quality donated goods from the general public.
St Vincent de Paul has collection bins that are conveniently located to deposit items such
as furniture, books, clothing, household goods, bric-a-brac, toys, and blankets. Other
sourcing option include the deposit of these items at local Vinnies Shops or a free pick up
service for people who do not have the means to do so.
Donated goods are sorted by volunteers into family assistance, retail and recyclable items.
Through its recycling of donations, the Society is a major contributor to Australia's
environment and minimises the amount of landfill otherwise required.

The Australian Centre for Retail Studies, October 2005 29
This year, St Vinnies shops have assisted over 14,000 households with goods valued at
$1,233,442, while sales have contributed $6,615,130 to fund St Vincent de Paul services.
During 2004-2005, sales were recorded at $12,486,196, representing growth in excess of
10% and an increase in the amount of funds available for assisting those in need.
Savers
Originally founded in the USA in 1954, Savers is a privately
owned for-profit retail store chain that pays cash to their non-
profit partners for donated clothing and household items for
resale. As an international company, Savers now operates
nearly 200 locations throughout the United States, Canada and
Australia and is the largest company of its kind in the world. Savers currently has 5 stores
in Victoria and a sixth store in the pipeline for 2006. However, as they are not publicly
listed company information on this organisation is scarce.
The vision of Savers is to achieve distinction as a second-hand retailer that provides a
refreshing shopping experience at incomparable value for customers, while simultaneously
giving back to the local community. The organisation's mission is to succeed and grow as
a profitable resale enterprise that leverages unique partnerships with local non-profit
organisations and donors to continuously innovate a recycling-focused retail approach,
ensuring consistent sourcing and volume of the highest quality product in multiple
channels.
As Australia's recycling superstore, Savers has been described as an "op shop on
steroids," from designer and vintage clothing to unique accessories, home décor, books,
shoes, electronics, and sporting goods. There is always a guarantee of something new at
Savers, and this is largely due to the thousands of items arriving daily from non-profit
partners. The shop itself is run like a department store; things are sorted into sizes so
goods are quick and easily found.

The Australian Centre for Retail Studies, October 2005 30
Savers accept donations of quality re-sellable items on their partnering charities’ behalf
and also conduct home pick-ups.
A large part of the Savers business is regular 50% off everything sale
days and promotions. Savers also gives every donation of reusable
clothing and household items a voucher for 30% off their next
purchase. A free recycle rewards card also offers customers
discounts of up to 30% off.
Key to Savers’ success is their unique “everyone wins” business
model. Savers pioneered the concept of partnering with local non-
profits by purchasing and reselling donated items. Under this model,
charities and the communities they support win by receiving a
sustainable funding source; the environment wins through the
implementation of recycling; and Savers wins by managing a thriving
business. Savers' winning business model is three-fold:
1. Community and Charitable Partnerships: Savers provides
benefits for local communities by purchasing goods collected by local
non-profit organisations. This functions in the following way:
Charity partners collect reusable clothing and household items and deliver them to Savers
Savers pays the non-profit a bulk rate based on the volume of goods delivered; Savers also compensates charities for donated items delivered directly to the stores by individuals
Savers sorts through the donations for reusable items suitable for the retail floor, which are then value priced and displayed for purchase

The Australian Centre for Retail Studies, October 2005 31
Through this business model, Savers has paid more than one billion dollars to charitable
organisations in their 50 years of operation, allowing the non-profits to concentrate on the
core needs of their organizations while leaving the complex retail operation to Savers.
Currently, Savers partners with 120 charity organisations throughout the United States,
Canada and Australia. In Victoria Savers is aligned with Diabetes Australia (since 1997) and
YMCA (since 2003). Across the world more than $100 million is paid annually to non-profit
partners.
2. Environment: The Savers business model helps protect the
environment by promoting the reuse of household goods and
clothing which otherwise may end up in landfills. Beyond that,
roughly 50 % of donated goods are unsuitable for the retail floor,
and are shipped to developing countries and material
wholesalers for reuse. Savers sells and ships 220 million
pounds of reusable goods to developing nations annually, which are then sold at local
markets or shredded and recycled into rags. This represents another avenue through
which Savers gain a substantial portion of their revenue.
3. Company and Employee Growth: Through strong non-profit partnerships and a
commitment to recycling, Savers has grown from a single store in 1954 to nearly 200 retail
outlets throughout North America and Australia in 2004. More than 7,000 individuals are
employed throughout the Savers network, and because the business operates as a
commercial organisation, employees enjoy a promising career track, full benefits and entry
into the retail market. From training store managers to managing regional teams, Savers
career tracks exceed positions typically found in the second-hand or charity industry.

The Australian Centre for Retail Studies, October 2005 32
3.0 Summary of Store Visits
In order to gain a deep understanding of BSL retail, nine stores were visited. Store visits
encompassed an analysis of such factors as store layout, product range, pricing, display,
signage, service, and trading circles. The stores visited were selected based on
consultation with the Brotherhood of St Laurence to represent a range of retail operations.
The BSL stores visited are listed in the table below:
LOCATION DESCRIPTION Balwyn Auxiliary Bentleigh Managed Brunswick Managed Eltham Auxiliary Heidelberg West Managed Hunter & Gatherer St Kilda Managed Knox Managed Moonee Ponds Managed Ormond Auxiliary
Without exception, the layout of all stores was consistent with commercial retail models.
Products were displayed in separate areas, with products in the same category grouped
together. Merchandise was well arranged and sorted according to styles, colours and
occasions (i.e. casual versus formal). In addition, menswear was separated from
womenswear, and in most cases clothing was divided into sections such as shirts, jackets,
skirts and pants to facilitate easy customer browsing. This compares well against other
charity retailers who often have poorly laid out stores making it difficult for customers to
search through the goods on offer.

The Australian Centre for Retail Studies, October 2005 33
While the product range varied according to store size, most stores had a wide selection
of goods for customers to choose from. Typically, stores stocked items such as clothing,
shoes, books, toys, bric-a-brac, bags, manchester, hats, and CDs/tapes/LPs. The larger
stores also sold a range of furniture and homewares. Due to their different format and
philosophy, Hunter & Gatherer stores only stocked new and vintage clothing and
accessories.
Most of the stores visited used BSL price labels to attach to items, which were clearly
marked with the retail price and, in some cases, the date of which they arrived at the store.
Prices were fairly consistent across stores and suitable to the area in which they operated.
For example, Knox’s womenswear was at a higher price point than other stores. While
charities do vary in their pricing strategies between locations, the BSL stores visited priced
their goods below that of other charity retailers and Savers.
The way in which merchandise was displayed did vary
among stores. While some stores were more professional
than others, all had stock displayed neatly either on
clothing racks or shelves. Only one of the stores visited
had a “bargain bin” for customers to rummage through.
Several of the stores had mannequins in the display
window modelling fashionable vintage clothing to attract buyers. Generally, the products
were displayed clearly and without clutter that is typical in many op-shops.
Signage throughout the stores also varied between locations. The majority of stores used
BSL signs to indicate where items were located within the store and to highlight specials.
However, some stores used hand-written signage on –plain paper rather than that printed
by BSL. Overall, stores did have signage that clearly directed customers around the store
using the colours consistent with the BSL brand. The only inconsistency with regards to
signage related to the display of BSL information, while some stores had information
placed around the store highlighting the BSL mission, values and purpose for raising
funds, some stores were completely lacking in this sort of information.

The Australian Centre for Retail Studies, October 2005 34
The stores visited were all located near public transport, enabling easy access for
customers without personal transport. Within the immediate trading circle, BSL stores had
a tendency to be surrounded by independent retailers rather than large chain stores. The
immediate area was also often characterised by vacant shopfronts or stores that operated
with limited hours, this may indicate the low foot traffic experienced by these high street
locations.

The Australian Centre for Retail Studies, October 2005 35
Financial Analysis
A key task in developing an organisation’s financial strategy is to analyse current
performance and set future targets based on a number of key financial indicators. The key
financials related to the Brotherhood of St Laurence’s (BSL) retail operations will now be
discussed in turn so as to analyse their current performance and provide
recommendations. As suggested, the analyses in this section are based on financial
figures outlined in BSL’s most recent retail store PowerPoint presentation.
Sales
Net sales represent the revenues received by BSL from the sale of their stock during a
given time period minus any markdowns or discounts. For the year ended June 2005, BSL
retail sales totalled $5,711,361. This represented an increase of close to $1.5 million in
sales since 2000 (most of this growth is attributable to increased sales by Managed
stores). The average sales for BSL stores over the most recent six year period are
illustrated in the following graph.
BSL Store Average Sales
0
50,000
100,000
150,000
200,000
250,000
300,000
350,000
2000 2001 2002 2003 2004 2005
Year Ended June
Sal
es ($
)
Managed Auxilliary Total

The Australian Centre for Retail Studies, October 2005 36
As can be seen from the graph, Managed BSL stores have experienced higher average
sales than Auxiliary stores, and are therefore driving sales for BSL retail. However, during
the period 2004-2005, for the first time, Managed stores recorded a downturn in average
sales to $240,562. On the other hand, Auxiliary stores sales have remained relatively stable
over the past six years with average store sales of around $50,000 per annum.
Looking at the percent of sales growth over the last six years for the two types of stores
(see graph below), it is possible to see that they have followed quite distinct patterns of
growth. While Auxiliary store sales have been fairly stable, they have declined in recent
years, particularly in 2004-2005 when sales fell by 5%. Managed stores have followed a
less stable growth pattern, experiencing large increases and decreases, culminating in a
10% fall in sales in 2004-2005.
BSL Store % of Sales Growth on Previous Year
-15
-10
-5
0
5
10
15
2001 2002 2003 2004 2005
Year Ended June
% o
f Gro
wth
Managed Auxiliary
The decline in BSL sales may be a result of fall in patronage numbers. In 2003, BSL stores
processed 680,724 sale transactions. In 2005, however, this number fell to 577,200 for
the year, representing a decline of 15% in transactions.

The Australian Centre for Retail Studies, October 2005 37
Compared to St Vincent de Paul, BSL retail stores are still performing well in terms of total
sales. For the period 2004-2005, St Vincent de Paul reported total sales of $12,486,196
for its 94 Victorian stores. Each Vinnies Shop recorded an average of $132,832 for the
year. In comparison, the average BSL store made $190,378; this amounts to $60,000
(43%) more than a St Vincent de Paul store. However, while BSL store sales have been in
the decline over the last fiscal period, St Vincent de Paul retail sales have increased by
more than 10%.
Cost of Goods Sold
The cost of goods sold (COGS) refers to the amount a retailer pays to acquire stock during
a given time period. It is based on the purchase prices and freight charges, less any
discounts. The COGS is usually the largest expense on the income statement of any retail
organisation. The COGS for BSL retail is made up of factory purchases, furniture delivery
and the purchase of new goods and materials. Auxiliaries have no significant COGS due to
their differing business operations. For example, Auxiliary stores receive a large amount of
direct donations from the local community and therefore do not purchase large amounts of
stock from the factory. As such, the following table lists the COGS of Managed stores only
for the last six years.
Year Factory Purchases
Furniture Delivery & New Goods
Total Cost of Goods sold
% of Sales
99/00 $ 1,109,939 $ 262,860 $ 1,372,799 31% 00/01 $ 1,050,545 $ 281,138 $ 1,331,683 28% 01/02 $ 1,515,481 $ 318,552 $ 1,834,033 35% 02/03 $ 1,537,295 $ 324,596 $ 1,861,891 34% 03/04 $ 1,589,248 $ 410,124 $ 1,999,372 34% 04/05 $ 1,415,424 $ 317,542 $ 1,732,966 33%
Over the last six years, the average COGS in Managed stores was 32.5% of sales. As the
table above highlights, the COGS for BSL retail is fairly stable, with the exception of a jump
in factory purchases (up $500,000) in 2001-2002 which contributed to an increase in
COGS of 7% to 35%. However, as would be expected, the COGS for Managed BSL
stores has fluctuated in line with sales which experienced a large growth in 2001-2002.

The Australian Centre for Retail Studies, October 2005 38
When Auxiliary sales are taken into account, the COGS for all BSL stores for the period
2004-2005 was $1.9 million, representing 30% of total sales. Throughout the recorded
period, the COGS has remained relatively stable. These figures are low as is common
amongst charity retailers where there is little need to purchase merchandise as goods are
largely sourced through donations. As a point of comparison, department and apparel
stores COGS is normally about 60-65% of sales (Ghosh, 2004).
In retailing, COGS usually includes not only the invoice cost of merchandise but also the
cost of transportation to the store, plus any workroom costs associated with preparing the
merchandise for sale. From the management point of view, COGS can be reduced by
operating on any or all of these factors. The Brotherhood of St Laurence would be able to
substantially reduce their COGS by either delivering to stores less frequently or developing
an alliance with a transportation company who willing to manage delivery of goods pro-
bono or at reduced cost.
Operating Expenses
Operating expenses are the costs associated with running a business. Retail managers
have traditionally concentrated on reducing their operating expenses in order to increase
profits. Operating expenses for BSL retail include all expenses that the organisation incurs
with the exception of the COGS; wages, property costs, promotion costs, and
administration costs. These operating expenses, for all BSL stores, totalled $4,296 million
in the year to date June 2005, representing 66.7% of total sales. Operating expenses was
equal to 68.7% of sales for Managed stores for the same period, while only 55% for
Auxiliary stores. The major reason for this difference is related to wage costs, which are
minimal for Auxiliaries but are a substantial expensed for Managed stores.
In comparison, expenses for St Vincent de Paul, Vinnies Shops, were $5,871 million for the
period 2004-2005. This is $1 million more than BSL store expenses, however there are
60% (64 stores) more St Vinnies stores throughout Victoria. This would indicate that St
Vincent de Paul have greater control over their operating expenses than BSL.
The Australian Centre for Retail Studies, October 2005 39
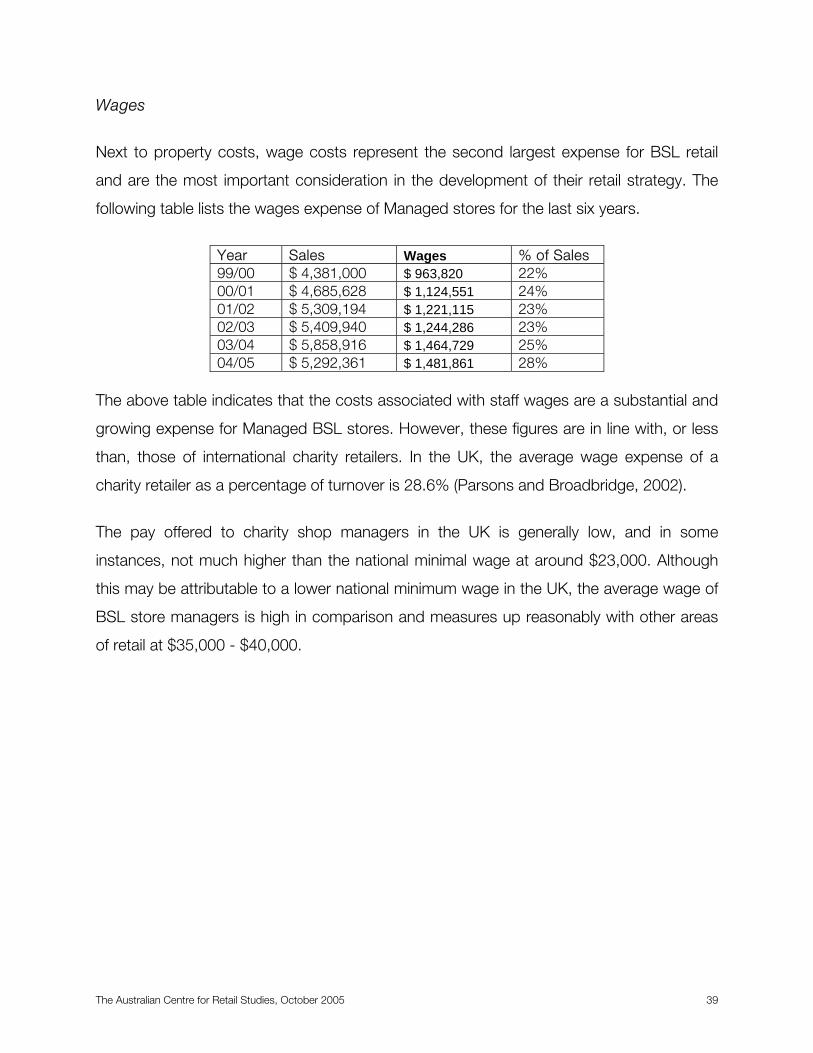
Wages
Next to property costs, wage costs represent the second largest expense for BSL retail
and are the most important consideration in the development of their retail strategy. The
following table lists the wages expense of Managed stores for the last six years.
Year Sales Wages % of Sales 99/00 $ 4,381,000 $ 963,820 22% 00/01 $ 4,685,628 $ 1,124,551 24% 01/02 $ 5,309,194 $ 1,221,115 23% 02/03 $ 5,409,940 $ 1,244,286 23% 03/04 $ 5,858,916 $ 1,464,729 25% 04/05 $ 5,292,361 $ 1,481,861 28%
The above table indicates that the costs associated with staff wages are a substantial and
growing expense for Managed BSL stores. However, these figures are in line with, or less
than, those of international charity retailers. In the UK, the average wage expense of a
charity retailer as a percentage of turnover is 28.6% (Parsons and Broadbridge, 2002).
The pay offered to charity shop managers in the UK is generally low, and in some
instances, not much higher than the national minimal wage at around $23,000. Although
this may be attributable to a lower national minimum wage in the UK, the average wage of
BSL store managers is high in comparison and measures up reasonably with other areas
of retail at $35,000 - $40,000.

The Australian Centre for Retail Studies, October 2005 40
Gross Margin
The gross margin represents the difference between sales and the cost of goods sold; it
consists of operating expenses plus net profit. The table below lists the gross margin of
Managed BSL stores for the past six years.
Year Sales Cost of goods sold Gross Margin % of Sales 99/00 $ 4,381,000 $ 1,372,799 $ 3,008,201 69% 00/01 $ 4,685,628 $ 1,331,683 $ 3,353,945 72% 01/02 $ 5,309,194 $ 1,834,033 $ 3,475,161 65% 02/03 $ 5,409,940 $ 1,861,891 $ 3,548,049 66% 03/04 $ 5,858,916 $ 1,999,372 $ 3,859,544 66% 04/05 $ 5,292,361 $ 1,732,966 $ 3,559,395 67%
This table indicates that the gross margin for Managed BSL stores has fluctuated during
the last six years and averages over the period to 67.5% of sales. This means that for
every dollar of sales generated, stores had 67.5 cents to cover costs such as rent and
wages, and from which to draw a profit. The remaining 32.5 cents went directly to cover
costs associated with the acquisition of stock.
The gross margin was higher for Auxiliary stores at 98.7% for the year to date June 2005,
further figures were not available. While this figure is much lower, it is not unexpected as
these stores are managed by volunteer staff (rather than salaried staff) and have relatively
low costs associated with the goods they sell.
BSL will find that the profit margin may be increased by controlling expenses. If they can
maintain the same level of sales with lower costs, net profit margin will increase. Generally,
retailers find that a small change in costs results in a substantial improvement in net profit
margin. The key areas where BSL should try and minimise costs are personnel and rent.

The Australian Centre for Retail Studies, October 2005 41
Stock Turnover
Turnover of stock on hand refers to the number of times during a specific period, usually
one year that inventory in the store is sold. The rate of stock turnover in BSL stores has
been increasing since 2002 and in 2004 the average piece of stock took 8 months to be
sold. This rate is much lower than in the rest of retail. For example, the average family
clothing store, women’s clothing store and furniture store take 3 months, 2 months and
1.5 months respectively to turn stock over (Dun and Bradstreet, 2001). With regard to this
area, BSL retail is performing below average compared to the rest of the retail industry.
However this is not unusual for second hand goods which typically take longer to turnover.
It is important to remember that the Salvation Army, BSL’s biggest competitor, has a
policy of turning stock over every four weeks. Stock is displayed for two weeks, if stock
has not sold by the third week it is sold at half price, and by the fourth week stock is taken
off display and sent back to the warehouse. This is very important in an industry where
customer shop on a regular basis and seek new goods each time they visit.
BSL should try and attempt to increase the turnover rate of its products because a high
turnover sees many benefits for the organisation. The higher the turnover the more
inventory investments can be said to be productive in that items a fresher, there are
reduced costs associated with change in styles and interest, insurance, breakage, and
warehousing costs are reduced. However BSL will need to determine the optimal level of
stock turnover for their stores, since profits may be lost if prices are reduced to turnover
stock quicker and BSL may experience higher freight costs if stores no longer ordered in
bulk (Berman and Evans, 2004).

The Australian Centre for Retail Studies, October 2005 42
Profit
For the year ended June 2005, BSL retail stores recorded profits close to $145,000. While
Managed stores made a loss equivalent to 1% of sales (a fall of 17% since its peak in
2001), Auxiliary stores boosted overall results with profits equivalent to 43% of sales.
Individual store profits have followed a similar pattern. The following graph illustrates the
average net profit earned for a BSL store over time.
The preceding graph shows that the average Managed store has experienced a marked
decline in profitability since 2003. In 2005 the average store made a loss of $2,406, a
$15,721 fall from the previous year. While the average store sales is in the negatives, 63%
of Managed stores did generate a profit – 14 stores made a profit in the year ended June
2005, with 8 stores making profits in excess of $20,000. Of the stores performing poorly, 7
stores made a loss – 5 of these made losses over $20,000. The biggest losses were
recorded at Footscray and Deer Park, with $111,334 and $91,448 respectively. These
negative profit figures by far outweigh the profits gained by other stores as the highest
Managed store profit was only $39,818.
BSL Store Average Net Profit
-10,000
0
10,000
20,000
30,000
40,000
50,000
60,000
70,000
2000 2001 2002 2003 2004 2005
Year
Pro
fit ($
)
Managed Auxilliary Total

The Australian Centre for Retail Studies, October 2005 43
On the other hand, the profit of all Auxiliary stores during the same period has remained
relatively stable. For the year ended June 2005, the average Auxiliary store made a profit of
$22,625; almost $25,000 more than the average Managed store. No losses were
recorded for the period, although Box Hill did only record a profit of $307.
Overall, Auxiliary stores performed better than Managed stores in terms of profit. Three of
the highest profit earners were Auxiliary stores who achieved profits in excess of $40,000.
Auxiliary profit is comparable to such successful UK charities as OXFAM, Barnados, Help
the Aged, and The British Red Cross (from figures in Parsons, 2003).
In 2005, the average weekly profit earned by a BSL store was $92. Looking at the two
types of stores separately, the average weekly profit for a Managed store and an Auxiliary
store was $33 and $439 respectively. However, these results have been in decline in
recent years. For example in 2004 the average weekly profit for a BSL store was $322; a
Managed store had an average profit of $256 and Auxiliaries an average weekly profit of
$502.
In comparison to profits attained in by charities in the UK, BSL retail is performing poorly
overall. While Auxiliary store profits are good in comparison, total BSL retail figures per
store, per week, is less than the average profit of multiple and independent charity retailers
in the UK which was reported as $437 and $647 respectively (Parsons, 2003).
Profits for St Vincent de Paul were reported as $6,615,130, in comparison to BSL’s
$145,000. This equates to a profit of $70,374 per Vinnies Shop which is significantly
higher than BSL stores. It is important to note that St Vincent de Paul store sales were
significantly lower than the average BSL store but they have been able to achieve profits
much higher than that of BSL perhaps because of lower expenses. In comparing the
performance of these two charity retailers it is possible to see that St Vincent de Paul are
receiving far greater returns on their sales than BSL. Where BSL’s profit as a percent of
sales is 2.5%, St Vincent de Paul are able to achieve 53% profit to sales.

The Australian Centre for Retail Studies, October 2005 44
Breakeven Analysis of Store Types
A breakeven analysis is useful in determining the point at which total revenue equal total
cost, and any sales beyond this point result in profit. Due to the distinct salary costs, the
breakeven points of Managed stores and Auxiliary stores are markedly different.
Managed Stores Auxilary StoresFixed Expense $ 1,628,959$ 175,360$
(property costs)
Gross Margin % 67% 98.7%
Salaries % 28% 4.2%Central Admin % 6.8% 7.6%
Other Variable Exp % 2% 1.3%Total Variable Exp % 36.9% 13.1%
Break-Even Sales $ 5,404,642$ 204,860$
Number of Stores 22 8
B/E Sales per Store 245,666$ 25,607$
Year to Date: June 2005
Managed stores need to make $5.4 million in sales in order to cover their expenses which
equates to $245,666 in sales per store. However, Auxiliary stores need to achieve total
sales of only $204,860 or sales of $25,607 per store. The breakeven point for the Auxiliary
stores is less than the breakeven amount required per Managed store.
These findings highlight the key point that the most significant expense for BSL in
comparison to other charities and retail organisations is the wage expense of Managed
stores. While the average retailer’s wage expense is 8% of sales (CCH Benchmarking,
2003) BSL Managed stores’ wage expense is 28%, and this figure has been steadily
rising. Looking at the actual number of paid staff, this group accounts for 8% of the BSL
workforce, four times more than that of St Vincent de Paul at 1.8%.

The Australian Centre for Retail Studies, October 2005 45
If BSL were to change the management structure of their Managed stores to be consistent
with the Auxiliary stores (i.e. using paid regional managers and volunteer shop staff)
salaries would be 4.2% of sales. This represents a breakeven point $2.4 million less than
with the current structure.
However, volunteers may not be readily available in which case the use of paid staff would
be necessary. In this case BSL’s sales expenses should be inline with commercial retailers,
at 8%, if they are to succeed. In this case the breakeven point would also be significantly
reduced by $2.2 million. Each store’s sales targets would be reduced to $137,101 – a
drop of over $100,000.
Salaries at 8% of Sales Salaries at 4.2% of Sales Fixed Expense $ 1,628,959$ 1,628,959$
(property costs)
Gross Margin % 67% 67.7%
Salaries % 8.0% 4.2%Central Admin % 6.8% 7.4%
Other Variable Exp % 2% 2.1%Total Variable Exp % 16.8% 13.7%
Break-Even Sales $ 3,244,938$ 3,016,224$
Number of Stores 22 22
B/E Sales per Store 147,497$ 137,101$
Projected Figures
A key point to note is that the financial analysis did not find a correlation between paid staff
and profitability. In fact, the three most profitable stores were Auxiliaries who rely solely on
volunteers. Even though their sales were lower, they had a higher profit to sales ratio. As
such it does not appear that increased staff expenses are warranted and that moving
towards a greater volunteer base would have a positive affect on profit.

The Australian Centre for Retail Studies, October 2005 46
4.0 Customer Questionnaire
Brotherhood of St Laurence Customer Questionnaire
Report of Findings14 December 2005
Report Contents
Questionnaire Aims Methodology & SampleSample ProfileStore CharacteristicsShopping BehaviourSummary of Findings Appendix A: Hunter & Gatherer Findings

The Australian Centre for Retail Studies, October 2005 47
Questionnaire Aims
Identify who Brotherhood of St Laurence (BSL) customers are Determine customer perceptions regarding BSL storesDiscover the reasons behind why customers shop at BSL storesUnderstand factors that may influence how often customers shop and how much they spend
Methodology & Sample
A self-administered customer survey was distributed by retail staff following ACRS guidelines Completed surveys were collected from the following stores:
Total 40010Pakenham
3Watsonia10Deer Park
5Ormond10City
6Knox11Dandenong
6Box Hill12Malvern
7Greensborough15Fairfield
8Seaford19Croydon
8Ivanhoe20St Kilda
8Glen Huntly20 Footscray
9Rosebud20Fitzroy
9Northcote25Geelong
9Mt Waverley26Moonee Ponds
9Eltham44Brunswick
9Bentleigh62Heidelberg

The Australian Centre for Retail Studies, October 2005 48
Sample Profile
Gender
26%
74%
Male Female
Base Sample = 400
The sample skews towards females

The Australian Centre for Retail Studies, October 2005 49
Education
6%
47%
1%
46%
Primary Secondary None Tertiary
The majority of respondents have completed a secondary
education or higher
Base Sample = 400
Employment Status
27%
26%
23%
11%
8%3% 2%
Parttime FulltimeRetired Household DutiesUnemployed StudentLooking for Employment
The majority of respondents were employed either
Fulltime or Parttime
Base Sample = 400
Retirees represented the third largest
segment in terms of employment status

The Australian Centre for Retail Studies, October 2005 50
Life Stage
Base Sample = 400
Other = Older Singles
18%
19%
8%15%
13%
11%
14%2%
Young single/sharing RetireesYoung couple no kids Older couple no kidsFamily with kids under 12 Family with kids over 12Family with kids over 18 Other
The highest proportions of respondents are Retirees and Young
Singles
Looking at families with kids at home (i.e. Family
with kids under 12, Family with kids over 12 & Family with kids over 18) together these three
groups make up the largest segment of the
sample (38%)
Household Size
18%
33%
20%
17%
3%9%
1 2 3 4 5-6 7-10
The largest segment of respondents have 2 people in
their household
Base Sample = 400

The Australian Centre for Retail Studies, October 2005 51
Household Income
Base Sample = 400
19%
16%
16%12%
9%
7%
7%3%
11%
Declined $40-60k $30-40k$20-30k $10-20k $60-80k$80k+ Don’t know $0-10k
Of those respondents that provided their income, the
majority fall within the $30-60k income bracket
Store Characteristics

The Australian Centre for Retail Studies, October 2005 52
1. The following statements refer to your thoughts and opinions on particular characteristics of this Brotherhood of St Laurence store.
Please indicate the extent to which you agree or disagree
Base Sample = 400
42% 41%36% 35%
39%
21%
39%40%
53%59%
77%
47%55%
47%48%56%
50%
46%
0%
10%
20%
30%
40%
50%
60%
70%
80%
90%
100%
Wideproductrange &variety
Goodquality
products
Productssuit needs
Good valuefor money
Store is welllaid out &easy to
navigate
Clearsignage
Courteous& friendly
staff
Store iseasily
accessible
Convienentoperating
hours
Strongly Agree Agree
Strongly Agree and Agree Combined
“I couldn’t praise the staff here enough, management is excellent and friendly. I’m extremely happy with the store… I’m here almost every day!”“Love the ladies, love the service, love the hunt, don’t change, keep it up!”“Great staff; most people go for a chat or to meet up and then purchase goods because it’s a fun experience”“I am so thankful that I am able to buy presents for friends and family”“It’s a grey day and I needed cheering up so popping in to buy something, trying some things on and saying hi to staff does the trick”
Customer Quotes

The Australian Centre for Retail Studies, October 2005 53
2. How important are each of the following store characteristics in increasing your visits to this store?
Please indicate the extent to which you find each important
Base Sample = 400
6% 5%
55%
19%
6%8%
34% 32%
44%
32%
38%
59% 62%
18%
33%
61%51%
1%2%1%1% 4% 3%
25%
0%
10%
20%
30%
40%
50%
60%
70%
80%
90%
100%
Product range Product pricing Display Storelayout/signage
Customer service Store location
Not Important/Not important at all Neither Important Very Important
6% 5%
20% 22%
8%
12%
31% 31%
41%
35%
40%
62% 63%
32% 31%
54%
43%
3%6%1%1% 6% 5%
42%
0%
10%
20%
30%
40%
50%
60%
70%
80%
90%
100%
Product range Product pricing Display Storelayout/signage
Customer service Store location
Not Important/Not important at all Neither Important Very Important
3. How important are each of the following store characteristics inincreasing the amount of goods you buy when you visit this store?
Please indicate the extent to which you find each important
Base Sample = 400

The Australian Centre for Retail Studies, October 2005 54
Shopping Behaviour
3%
32%
4% 4%
16%14%
27%
0%
5%
10%
15%
20%
25%
30%
35%
40%
More than oncea week
Once a week Every secondweek
Monthly Every secondmonth
Every sixmonths
Once a year
1. How often do you visit this store?
Base Sample = 400
n=128 n=108 n=65 n=55 n=17 n=16 n=11
The majority of respondents shop at a BSL store once a
week or more

The Australian Centre for Retail Studies, October 2005 55
2. Which of the following statements best describes why you shop at this store?
Base Sample = 400
13%
14%
22%
51%
0% 10% 20% 30% 40% 50% 60%
Its exciting and I don't knowwhat I'll find
I like to support charity stores
Because it fits in with the familybudget
I like to 'hunt' for a bargain or agood deal n=207
n=87
n=55
n=51
Most respondents shop at BSL
because they like to ‘hunt’ for a bargain
or a good deal
2% 1% 1%
10% 9%10%
2%
8%
57%
0%
10%
20%
30%
40%
50%
60%
$10 or more $8 - 9 $5 - 6 $4 - 5 $6 - 7 $2 - 3 $3 - 4 $1 - 2 $0 - 1
3. Approximately how much do you spend each time you shop at this store?
Base Sample = 360 (HG not included)
n=208 n=35 n=35 n=33 n=28 n=9 n=6 n=4
92% of HG customers spend, on average, $10 or
more each time they shop at the store
Most respondents spend $10 or more each time they shop
at a BSL store

The Australian Centre for Retail Studies, October 2005 56
5% 5%
30%26%27%
6%8%
82%
0%
10%
20%
30%
40%
50%
60%
70%
80%
90%
Clothes &accessories
Bric-a-brac Books Footwear Toys Furniture Electricalequipment
Other
4. What type of goods did you purchase from this store today?
Base Sample = 400
n=329 n=119 n=109 n=86 n=33 n=24 n=20 n=19
Multiple Response
Other = Audio, manchester, material, BSL
Christmas cards
Most customers reported purchasing
clothing & accessories
5. What is the main reason for your purchase(s) today?
Base Sample = 400
3%
3%
4%
5%
6%
14%
14%
15%
18%
18%
0% 2% 4% 6% 8% 10% 12% 14% 16% 18% 20%
Special event
Gift
Christmas gifts/cards
Needed summer clothes
Regular visit
None provided
Found whilst browsing
On a strict budget
Needed something specific
Value for money n=72
n=70
n=60
n=57
n=14
n=23
n=21
n=15
n=12
n=56
Most customers made a purchase
because they either found something that was good value for
money or they found something which they
specifically needed

The Australian Centre for Retail Studies, October 2005 57
30%
1%5%
64%
0%
10%
20%
30%
40%
50%
60%
70%
Very good value formoney
Good value for money Average Fairly poor value formoney
Very poor value formoney
6. Would you describe the goods you purchased as:
Base Sample = 400
n=256 n=122 n=20
The majority of respondents felt that
the goods they purchased were very good value for money
No respondents
described their goods as very poor
value for money
29%
7%10%
3%4%
47%
0%
10%
20%
30%
40%
50%
60%
$2 more Would not paymore
$1 more Would pay less 50c more 25c more
7. What is the most you would pay for the goods you purchased today?
Base Sample = 360 (HG not included)
n=168 n=107 n=35 n=24 n=14 n=12
A large proportion of respondents are
prepared to pay $2 more for the goods
they purchased
43% of HG customers are not prepared to pay
more for the goods they purchased

The Australian Centre for Retail Studies, October 2005 58
8. Is there anything that you think this store can do to encourage you to visit more often and buy more goods?
Base Sample = 400
3%
4%
6%
6%
14%
67%
0% 10% 20% 30% 40% 50% 60% 70% 80%
Lower pricing
Customer facilities
Sales & promotions
Improved store environment
Improved product range
Nothing n=269
n=70
n=55 The majority of respondents were satisfied with their BSL store and felt that nothing more could be done to
improve it
8. Is there anything that you think this store can do to encourage you to visit more often and buy more goods?
Definition of groupings: Improved Product Range – increased quality of goods, more bric-a-brac, more retro clothes, more audio products (CDs, tapes, LPs), larger range of bigger size clothingImproved Store Environment – Better layout and display, cleaner storesSales & Promotions – 50% off days, more specials, pensioner/student discounts, loyalty cardCustomer Facilities – Air-conditioning, toilets, longer operating hours

The Australian Centre for Retail Studies, October 2005 59
9. Would you consider buying new goods at this store?
Base Sample = 400
73%
27%
Yes No
The majority respondents would consider buying new goods from a BSL store, provided prices
are reasonable
10. Which of the following new goods would you consider buying at this store?
Base Sample = 292 respondents who would consider buying new goods
Multiple Response
29%22%
1%
53%47%48%
31%33%
79%
0%
10%
20%
30%
40%
50%
60%
70%
80%
90%
Clothin
g & ac
cess
ories
Footw
ear
Bric-a
-brac
Books
Cosmeti
cs
Electric
al eq
uipmen
tToy
sFoo
dOthe
r
n=231 n=141 n=136 n=108 n=103 n=85 n=64n=155
The new goods that respondents would consider purchasing are consistent with those that they
currently purchase

The Australian Centre for Retail Studies, October 2005 60
11. Which of the following services would you consider using at this store?
Base Sample = 400
Multiple Response
1%
34%
30%
19%20%
11%
17%
34%
0%
10%
20%
30%
40%
Café Photocopying& printing
Internet Dry-cleaning Bill-paying Hairdressing Other None
n=136 n=119 n=80 n=75 n=71 n=44 n=137
Other = Alterations,
postal services & childcare
A cafe and photocopying & printing are the most useful services for BSL customers
8%
44%
11%
38%
10%11%
82%
0%
10%
20%
30%
40%
50%
60%
70%
80%
90%
Other charityshops
Markets Garage sales Cashconverters
Internet sites Private sales Nowhere else
12. Where else do you shop for second-hand goods?
Base Sample = 400
Multiple Response
n=327 n=222 n=151 n=45 n=44 n=41 n=33
The vast majority of BSL customers also shop at other charity shops for second-hand goods

The Australian Centre for Retail Studies, October 2005 61
Summary of Findings
The majority of BSL customers are:Female; Educated; Working; Retired or young singles; Have 2 people in their household; and Earn between $30-60k
Customers have very positive responses towards all BSL store characteristics Product range, product pricing, customer service, and store location are all important in increasing customers’ spend and visits to a BSL store BSL customers visit at least once a week to ‘hunt’ for a bargain or a good deal and spend $10 or more
Summary of Findings
Clothing and accessories, bric-a-brac, books, and footwear are the most popular purchases at a BSL storeBSL customers make purchases because the goods are value for money or because they needed something specificGoods at BSL stores are considered to be of very good value for moneyCustomers are prepared to pay $2 more for goods they purchase at BSL storesCustomers would consider buying new clothing and accessories, footwear, bric-a-brac and booksCustomers would consider using a Café and Photocopying & Printing services at a BSL storeBSL customers also predominantly shop at other charity shops

The Australian Centre for Retail Studies, October 2005 62
Appendix A
Hunter & Gatherer Questionnaire Findings
NB: The sample of 40 Hunter & Gatherer customers is not large enough to draw valid and reliable conclusions, and therefore the following findings should be
taken as rough indicators only
HG Sample Profile

The Australian Centre for Retail Studies, October 2005 63
Gender
25%
75%
Male Female
Base Sample = 40
The HG sample also skews towards
females
Employment Status
30%
48%
2%
2%
15%
3%
Parttime Fulltime RetiredHousehold Duties Unemployed Student
The majority of respondents were employed either
Fulltime or Parttime
Base Sample = 40
A sizeable proportion of HG customers were
also unemployed

The Australian Centre for Retail Studies, October 2005 64
Education
Base Sample = 40
5%
20%
75%
Primary Secondary Tertiary
The majority of HG respondents have completed
a tertiary education
Life Stage
Base Sample = 40
25%
18%
7%5%
45%
Young single/sharing Young couple no kidsFamily with kids under 12 Family with kids over 12Family with kids over 18
The highest proportion of HG respondents are
Young Singles
The vast majority of HG customers (70%) are young with no kids

The Australian Centre for Retail Studies, October 2005 65
Household Size
12%
33%
25%
25%
5%
1 2 3 4 5-6
The largest segment of HG respondents have 2 people living in their home. However, sizeable
proportions also have 2 or 3 people living in their home
Base Sample = 40
Household Income
Base Sample = 40
18%
23%
15%5%
13%
7%
12%2%
5%
$80k+ $40-60k $30-40k$20-30k $10-20k $60-80kDeclined Don’t know $0-10k
Of those HG respondents that provided their income, the largest proportions fall within the $40-60k
and $80k+ income brackets

The Australian Centre for Retail Studies, October 2005 66
HG Shopping Behaviour
Only the responses that varied from total BSL retail findings were included in this section
7%
20%
13%12%
15% 15%
18%
0%
5%
10%
15%
20%
25%
30%
Every secondweek
Once a week More than oncea week
Monthly Every secondmonth
Once a year Every sixmonths
1. How often do you visit this store?
Base Sample = 40
n=8 n=7 n=6 n=6 n=5 n=5 n=3
Large proportions of HG respondents shop at a HG store every second week
or once a week

The Australian Centre for Retail Studies, October 2005 67
2. Which of the following statements best describes why you shop at this store?
Base Sample = 40
8%
8%
21%
63%
0% 10% 20% 30% 40% 50% 60% 70%
Because it fits in with the familybudget
I like to support charity stores
Its exciting and I don't knowwhat I'll find
I like to 'hunt' for a bargain or agood deal n=25
n=8
n=4
n=3
While HG customers also like to ‘hunt’ for a bargain
the proportion of customers who shop
because its exciting was significantly higher than non-HG BSL customers
Fitting in with the family budget ranked as the
number two reason for non-HG BSL shoppers
3% 2%2%
93%
0%
10%
20%
30%
40%
50%
60%
70%
80%
90%
100%
$10 or more $8 - 9 $5 - 6 $4 - 5
3. Approximately how much do you spend each time you shop at this store?
Base Sample = 40
n=36
The majority of HG respondents spend $10 or more each
time they shop at a HG store

The Australian Centre for Retail Studies, October 2005 68
5. What is the main reason for your purchase(s) today?
Base Sample = 40
2%
5%
5%
7%
7%
10%
13%
13%
15%
23%
0% 5% 10% 15% 20% 25%
Needed summer clothes
Gift
Regular visit
Special event
Christmas gifts/cards
None provided
On a strict budget
Found whilst browsing
Needed something specific
Value for money n=9
n=6
n=5
n=5
n=2
n=3
n=3
n=2
n=4
The largest segment of respondents shopped at a HG store because they felt
it was value for money
38%
17%
45%
0%
10%
20%
30%
40%
50%
Good value for money Very good value formoney
Average Fairly poor value formoney
Very poor value formoney
6. Would you describe the goods you purchased as:
Base Sample = 40
n=18 n=15 n=7
The majority of HG respondents felt that
the goods they purchased were good or very good value for
money
No respondents described their goods as fairly poor or very poor value for money

The Australian Centre for Retail Studies, October 2005 69
32%
5%
12%
3%5%
43%
0%
10%
20%
30%
40%
50%
Would not paymore
$2 more Would pay less 25c more $1 more 50c more
7. What is the most you would pay for the goods you purchased today?
Base Sample = 40
n=17 n=13 n=5 n=2 n=2 n=1
A large proportion of HG respondents would not pay
more for the goods they purchased. However, a number of HG customers are prepared
to pay $2 more.
8. Is there anything that you think this store can do to encourage you to visit more often and buy more goods?
Base Sample = 40
2%
2%
5%
10%
23%
58%
0% 10% 20% 30% 40% 50% 60% 70%
Improved store environment
Lower pricing
Customer facilities
Sales & promotions
Improved product range
Nothing n=23
n=9
n=55
n=4
Over 50% of HG customers felt that there
was nothing else that could be done to improve
the stores

The Australian Centre for Retail Studies, October 2005 70
3%
73%
33%38%
8%
18%
80%
0%
10%
20%
30%
40%
50%
60%
70%
80%
90%
Other charityshops
Markets Garage sales Internet sites Private sales Cashconverters
Nowhere else
12. Where else do you shop for second-hand goods?
Base Sample = 40
Multiple Response
n=32 n=29 n=15 n=13 n=7 n=3 n=1
Most HG customers also shop at other charity
shops and markets for second-hand goods
Summary of HG Findings
The majority of HG customers are:Female; Educated; Working;Young with no kids; Have 2 people living in their home; and Earn $40-60k
Customers visit a HG store once a week or every second week to ‘hunt’ for a bargain or a good deal and spend $10 or more

The Australian Centre for Retail Studies, October 2005 71
Summary of HG Findings
HG customers make purchases because the goods are value for moneyUnlike other BSL customers, HG customers are not prepared to pay any more for goods they purchase at HG storesHG customers also shop at other charity shops and markets (other BSL shoppers predominantly only shopped at other charity shops)Goods at HG stores are considered to be of value for money

The Australian Centre for Retail Studies, October 2005 72
5.0 Recommendations
The sales to profit ratio of BSL is too low, therefore BSL needs to reduce operating
expenses such as wages and property costs.
o Increase the number of hours worked by volunteers within stores to
decrease the number of part-time and casual hours paid to staff.
o Make concerted efforts to renegotiate rental agreements for current store
locations.
Re-examine the structure of Managed stores as paying staff wages is not affording
sufficient benefits to warrant salary costs.
Increase, where possible, the amount of floor space in Auxiliary stores as this
appears to be an inhibiting factor in generating sales.
Increase stock turnover to compete more closely with other charity retailers such as
the Salvation Army.
Develop marketing and promotional campaigns to target young singles and retirees
as they form large segments of the BSL store customer base.
Focus on product range, product pricing, customer service, and store location in
developing strategies to increase BSL customer store visits and spend.
Continue to stock wide ranges of clothing and accessories, footwear, bric-a-brac,
and books as these are the most commonly sought after and purchased items in
BSL stores.
Increase the pricing of selected items by at least $1 across all BSL stores. It is
important to note here that most respondents are accepting of a price increase of
$2, however it is most effective to increase prices gradually.
Introduce new lines of clothing and accessories, footwear, bric-a-brac, and books
into suitable BSL stores, however at reasonable prices.
Consider the offering of a café or printing and photocopying services in suitable
BSL stores as long as it is feasible to do so.
Ensure that BSL’s mission, values and purpose for raising funds is clearly
communicated within all stores.

The Australian Centre for Retail Studies, October 2005 73
6.0 References
Berman, B. & Evans, J. (2004). Retail Management: A Strategic Approach (Ninth Edition),
Prentice Hall, New Jersey.
Broadbridge, A. & Horne, S. (1994). Who Volunteers for Charity Retailing and Why, The
Service Industries Journal, 14 (4), p. 421-437.
Broadbridge, A. & Parsons, E. (2003), UK Charity Retailing: Managing in a Newly
Professionalised Sector, Journal of Marketing Management, 19, p. 729-748
Broadbridge, A. & Parsons, E. (2003). Still serving the community? The professionalisation
of the UK charity retail sector, International Journal of Retail & Distribution Management, 31
(8), p. 418-427.
Croft, N. (2002). Product quality strategy in charity retail: A case study, International
Journal of Nonprofit and Voluntary Sector Marketing, 8(1), p. 89-98.
Elder, J. (2005) Charity work providing a load of old rubbish. Sunday Age, 6 Feb, p.11.
Hodgson, S. (2004) Salvos plagued by shoplifting. Herald Sun, 26 May, p.15
Horne, S. & Broadbridge, A. (1995). Charity shops: a classification by merchandise mix,
International Journal of Retail & Distribution Management, 23 (7), p. 17-23.
Horne, S. (1998). Charity shops in the UK, International Journal of Retail & Distribution
Management, 26 (4), p.155-161.
Lush, R., Dunne, P. & Gebhardt, R. (1993). Retail Management (2nd Edition), South-
Western Publishing Co, Ohio.

The Australian Centre for Retail Studies, October 2005 74
Parsons, E. & Broadbridge, A. (2004). Managing Change in Nonprofit Organizations:
Insights From the UK Charity Retail Sector, jnternationalJournal of Voluntary and Nonprofit
Organizations, 15(3), p. 227-242.
Parsons, E. (2002). Charity retail: past, Present and future, International Journal of Retail &
Distribution Management, 30(12), p. 586-594.
Parsons, E. (2004). Charity retailing in the UK: a typology, Journal of Retailing and
Consumer Services, 11, p. 31-40.
Parsons, E. (2004). Charity shop managers in the UK: becoming more professional?,
Journal of Retailing and Consumer Services, 11, p. 259-268.
Rindfleisch, T. (2005) $1mil charity rubbish charge. Sunday Herald Sun, 27 Nov, p.22.

The Australian Centre for Retail Studies, October 2005 75
APPENDIX A: Customer Questionnaire
The Brotherhood of St Laurence
Retail Questionnaire
Store: ______________________
Thankyou for agreeing to participate in this survey, it should only take around 8 minutes to complete.
The Brotherhood of St Laurence is seeking to find out who their customers are and what they think of their stores. The Brotherhood of St Laurence is planning to use this information to make improvements to their retail stores.
Any information you provide will be anonymous and the results from your questionnaire will be combined with those from other people, and cannot be linked back to you in any way. Once you have completed the questionnaire, please place it inside the envelope provided so that your answers are kept confidential. The information collected from all questionnaires will be analysed by an independent organisation.
If you have any questions regarding this questionnaire, please contact Joe D’Angelo at The Brotherhood of St Laurence on (03) 9385 6101.

The Australian Centre for Retail Studies, October 2005 76
SECTION A: STORE CHARACTERISTICS 1. The following statements refer to your thoughts and opinions on particular characteristics of this Brotherhood of St Laurence store. Please indicate the extent to which you agree or disagree from 1-5 where: 1= Strongly agree 2= Agree 3= Neither agree/disagree 4= Disagree 5= Strongly disagree
Strongly agree
Agree Neither agree/
disagree
Disagree Strongly disagree
The store has a wide range and variety of products
1 2 3 4 5
The store has quality products
1 2 3 4 5
This store has products that suit my needs
1 2 3 4 5
The store has products that are value for money
1 2 3 4 5
The store is well laid out and makes it easy for me to move around and find what I need
1 2 3 4 5
The store has signage that informs me of where goods can be found
1 2 3 4 5
The store has friendly and courteous staff that are able to offer help when needed
1 2 3 4 5
The store is easy to find and is accessible
1 2 3 4 5
The store has operating hours that are convenient for me
1 2 3 4 5

The Australian Centre for Retail Studies, October 2005 77
2. How important are each of the following store characteristics in increasing your visits to this store? Please indicate the extent to which you find each important from 1-5 where: 1= Very important 2= Important 3= Neither important/not important 4= Not important 5= Not important at all
3. How important are each of the following store characteristics in increasing the amount of goods you buy when you visit this store? Please indicate the extent to which you find each important from 1-5 where: 1= Very important 2= Important 3= Neither important/not important 4= Not important 5= Not important at all
Very important
Important Neither important/
not important
Not important
Not important at
all
Product range 1 2 3 4 5
Product pricing 1 2 3 4 5
Product display 1 2 3 4 5
Store layout/signage 1 2 3 4 5
Customer service 1 2 3 4 5
Store location 1 2 3 4 5
Very important
Important Neither important/
not important
Not important
Not important at
all
Product range 1 2 3 4 5
Product pricing 1 2 3 4 5
Product display 1 2 3 4 5
Store layout/signage 1 2 3 4 5
Customer service 1 2 3 4 5
Store location 1 2 3 4 5

The Australian Centre for Retail Studies, October 2005 78
SECTION B: SHOPPING BEHAVIOUR
1. How often do you visit this store?
a) More than once a week b) Once a week c) Every second week d) Monthly e) Every second month f) Every six months g) Once a year
2. Which of the following statements best describes why you shop at this store? Please rank these statements from most important to least important by numbering from 1-5 where 1 = most important.
I shop at this store because I like to ‘hunt’ for a bargain or a good deal
I shop at this store because I like to support charity stores
I shop at this store because it fits in with the family budget
I shop at this store because its exciting and I don’t know what I’ll find
Other (if applicable) ____________________________________
3. Approximately how much do you spend each time you shop at this store?
a) $0 - $1 b) $1 - $2 c) $2 - $3 d) $3 - $4 e) $4 - $5 f) $5 - $6 g) $6 - $7 h) $8 - $9 i) $10 or more

The Australian Centre for Retail Studies, October 2005 79
4. What type of goods did you purchase from this store today?
Please circle all that apply
a) Clothes and accessories b) Footwear c) Bric-a-brac d) Toys e) Furniture f) Books g) Electrical equipment h) Other (please specify) ______________
5. What is the main reason for your purchase(s) today?
Please write in.
_____________________________________________________________________
______________________________________________________________________
6. Would you describe the goods you purchased as:
a) Very good value for money b) Good value for money c) Average d) Fairly poor value for money e) Very poor value for money
7. What is the most you would pay for the goods you purchased today?
a) 25¢ more b) 50¢ more c) $1 more d) $2 more e) Would not pay any more f) Would like to pay less

The Australian Centre for Retail Studies, October 2005 80
8. Is there anything that you think this store can do to encourage you to visit more often and buy more goods?
Please write in.
______________________________________________________________________
______________________________________________________________________
9. Would you consider buying new goods at this store?
a) Yes Go to Q. 10 b) No Go to Q.11
10. Which of the following new goods would you consider buying at this store?
a) Clothing and accessories b) CDs c) Cosmetics d) Food e) Footwear f) Homewares or bric-a-brac g) Books h) Toys i) Furniture j) Electrical equipment k) Other (please specify) ___________________________
11. Which of the following services would you consider using at this store?
a) Dry-cleaning b) Hairdressing c) Bill-paying d) Photocopying and printing e) Internet f) Café g) Other (please specify) ____________________________

The Australian Centre for Retail Studies, October 2005 81
12. Where else do you shop for second-hand goods?
Please circle all that apply
a) Other Charity Shops (i.e. op-shops) b) Cash Converters c) Internet sites (e.g.. eBay) d) Markets e) Garage Sales f) Private sales (e.g. newspaper ads, trading post) g) Other (please specify)_________________
SECTION C: CUSTOMER CHARACTERISTICS
Following are questions about yourself. Please write in or circle the most appropriate response for each item from the options provided. This information will be kept completely confidential and will help us to analyse the data we receive.
1. Are you?
a) Male b) Female
2. What is your level of completed education?
a) Primary b) Secondary c) Tertiary d) None
3. Which of the following best describes your employment status?
a) Full time work b) Part time work c) Unemployed d) Looking for work e) Full time student f) Retired g) Household duties h) Other (please specify)___________

The Australian Centre for Retail Studies, October 2005 82
4. Which of the following best describes your current life stage?
a) Young single/sharing accommodation b) Young couple with no children c) A family with children aged under 12 d) A family with children aged over 12 e) A family with oldest child aged over 18 and living at home f) An older couple without children living at home g) Retirees
5. How many people currently live in your home?
6. Which of the following broad categories does the combined annual income of your household fit in to? This information will be anonymous and kept confidential.
a) $0 -10,000 b) $10, 001 - $20,000 c) $20,001 to $30,000 d) $30,001 to $40,000 e) $40,001 - $60,000 f) $60,001 - $80,000 g) Over $80,000 h) Decline to answer i) Don't know
7. Is there anything else that you feel is important for the Brotherhood of St Laurence stores to know? If so, please write in. ______________________________________________________________________ ______________________________________________________________________
Thankyou for completing this survey!