bruce - high capacity rock anchors for damsgeosystemsbruce.com/v20/biblio/209 high capacity...
TRANSCRIPT
HIGH CAPACITY ROCK ANCHORS FOR DAMS: SOME FUNDAMENTAL OBSERVATIONS ON THE
ANALYSIS OF STRESSING DATA D.A. Bruce1 J.J. Jensen2
J.S. Wolfhope3
ABSTRACT Details of high capacity rock anchor design, construction and stressing are provided from two recent projects at Marmet Locks and Dam, West Virginia, and Tom Miller Dam, Texas. Particular focus is provided on the analysis of stressing and testing data insofar as the calculation of apparent debonded lengths and the “negative friction” issue are concerned. Guidance is provided on the typical ranges of permanent movement and short-term creep and lock off efficiencies which can be anticipated. The value of routine pregrouting of anchor holes in voided condition is illustrated.
INTRODUCTION It has been estimated (Bruce, 2002) that as many as 10 to 15 major rock anchor projects are conducted annually in North America for dams and dam related structures such as locks and plunge pools. In recent years, there has been a diminution in the number of technical papers written on such projects and, as a result, many practitioners may not be aware of certain issues relating to design, construction and the analysis and interpretation of stressing data. This paper describes insights gained from two recent projects, at Marmet Locks and Dam, West Virginia, and Tom Miller Dam, Texas.
MARMET LOCKS AND DAM, WEST VIRGINIA General Background Marmet Locks and Dam are located on the Kanawha River at Marmet, West Virginia, about 70 miles above its confluence with the Ohio River. The existing facility was completed in 1934 and consists of a non-navigable dam with twin locks (56 feet by 360 feet). Because of their relatively small size, the existing Marmet locks present a significant impediment to river commerce in the form of long delays associated with breaking down large tows in order to pass them through the lock. To improve the
1 President, Geosystems, L.P., P.O. Box 237, Venetia, PA 15367, U.S.A., Phone: (724) 942-0570, Fax: (724) 942-1911, [email protected]. 2 President, Jensen Drilling Company, 1775 Henderson Avenue, Eugene, OR 97403, U.S.A.; Phone: (541) 726-7435; Fax: (541) 726-6140, [email protected]. 3 Operations Leader/Project Manager, Freese and Nichols, Inc., 10814 Jollyville Road, Building 4, Suite 100, Austin, TX 78759-5674, U.S.A., Phone: (512) 451-7955 x18; Fax: (512) 451-7956; [email protected]

efficiency of the project, a new lock chamber (110 feet by 800 feet) is being built adjacent to the existing chambers on the right bank. To facilitate construction of the new lock chamber and sill monoliths in the dry, the landwall of the existing lock is being used as the river wall of the excavation, together with cellular cofferdams which form the upstream and downstream boundaries of the excavation. A similar scheme had been successfully implemented in the early 1990’s at Point Marion Locks and Dam, Pennsylvania (Bruce et al., 1994). The bedrock is Pennsylvanian sediments of the Pottsville Group. The Kanawha Formation is prominent in the project area, comprising mainly thick cross bedded sandstones, alternating with thinner sandy shales, thin coal beds, the Kanawha Black Flint, and a few thin marine sediments. The rock gently dips to both the northwest and southeast, and there is no extensive faulting. The sandstone member is the uppermost rock unit at the site and is about 23 to 43 feet thick. It contains thin carbonaceous stringers and beds. The sandstone has generally low permeability and is described as moderately hard (mean Unconfined Compressive Strength (U.C.S.) about 8500 psi). It overlies 19 to 33 feet of shale which varies from soft to moderately hard (to about 6700 psi). Laboratory grout-rock bond tests led to the Owner recommending working bond stresses of 100 psi and 55 psi for anchors founded in the sandstone and shale, respectively, with a nominal factor of safety of 2 against ultimate stress. The modulus of deformation of these main units is 1.05 and 0.63 x 10⁶ psi, respectively. There are known to be relatively weak continuous surfaces in the sandstone member, including micaceous bedding planes and thin zones of carbonaceous stringers. Scope of the Anchor Works Prestressed rock anchors were required to provide an adequate factor of safety against sliding for the monoliths of the existing lock wall and the new coffercells during the excavation. Monoliths 5 to 28 of the existing lock wall were each stabilized with 3 to 5 rows of anchors. Anchor inclinations varied from vertical for upper rows to 45º for the lowermost anchors through the thrust block (Figure 1). Each monolith had from 9 to 21 anchors, with total drilling lengths for each 6-inch hole varying from 52 to 101 feet. The total of 377 anchors included 95 thrust block anchors. Bond lengths varied from 20 to 30 feet (for 9 strand tendons — the majority); 35 feet for 12 strands and 40 to 45 feet for 15 strands. For the cells, a total of 87 thrust block anchors were installed: 9 strands per anchor, 7 or 8 anchors per cell, mainly 34-foot bond lengths, and total drilling lengths of 47 to 102 feet. There were in addition 73 anchors, each with 12 strands installed at 16º off vertical to stabilize the cells themselves. The tendon stress at Design Working Load was 60%, and at Test Load 80% Guaranteed Ultimate Tensile Strength (GUTS).

ANCHORS
A
B
C THRUST BLOCK
45º
El 182
ANCHORS
A
B
C THRUST BLOCK
45º
El 182
Figure 1. Schematic cross section showing “Daylighted” Weak Seams and positions of anchors, Marmet Lock and Dam, WV.
Construction practices were in accordance with the U.S. Army Corps of Engineers’ own anchor project specifications. Each hole was water pressure tested (to a 10 gallons in 10 minutes at 5 psi criterion (4 times the PTI criterion) and pregrouted and redrilled if necessary (in about 55% of cases). Tendon grouting was conducted in two stages, the second (along the free length) after stressing. Due to the high intensity of anchoring, drilling accuracy was crucial to maintain. Holes were drilled with stabilized down-the-hole hammers and acceptable tolerance verified with a multi-shot borehole survey tool. Given the presence of argillaceous rocks in the foundation, and the consequences of failure of the excavation support system during construction, the Corps specified an unusually large number of Performance Tests (about 14% of total anchors), and Extended Creep Tests (about 7% of the total). This intensity compares with the relevant PTI (1996) Recommendation (Section 8.3.2): “the number of Performance Tests may be increased, especially when the anchors are being used for permanent applications, when creep susceptibility is suspected, or when varying ground conditions are encountered, but normally will not exceed 5% of the total number of anchors.” Regarding Extended Creep Testing, PTI (Section 8.3.4) states: “Extended creep tests normally are not performed on rock anchors since they do not exhibit time dependent movements. However, anchors installed in very decomposed or argillaceous rocks may exhibit significant creep behavior.” Each monolith or cell was to be subjected to each type of test in a well defined order. In addition hollow center 300-ton vibrating wire load cells were incorporated on anchors throughout the cofferdam. Two load cells were placed under Proof Tested anchors in each of the 24 existing river wall monoliths, one on a vertical anchor, and one on an inclined anchor. A load cell was also placed on an inclined Proof Tested anchor in each of the coffercell thrust blocks. These load cells were monitored together with

inclinometers and tilt meters to demonstrate the safe performance of the old monolith/coffercell retention system during subsequent excavation for the new monoliths. At the time of writing, the anchor project is nearing completion and a total of 24 anchors had been subjected to firstly a Performance Test, and secondly to an Extended Creep Test. Analysis of Data The stressing data firstly confirmed that every anchor proved contractually satisfactory in every regard, i.e., with respect to elastic extension, creep and lift off criteria. However, the detailed analysis of the stressing data has allowed several interesting additional observation to be made: Elastic Extension. Specifications require that the elastic extension at Test Load (80% GUTS) be proportional to no less than 80% of the theoretical free length (plus jack length) and no more than theoretical free length (plus jack length) plus 50% of theoretical bond length. As shown in Table 1, 23 of 24 Performance Test results indicated a calculated apparent debonding length of less than or equal to 10 feet (average 2.7 feet). The exception was anchor M13-D1 (17.1 feet, but still contractually acceptable). Close examination of this anchor’s load/movement data indicated absolutely minimal debonding during stressing (the graph was virtually a straight line) and so it would seem that its bond zone grout level was actually lower than foreseen from the start. Indeed, the elastic extension curve of all anchors was extremely linear, indicative of minimal debonding during cyclic testing to Test Load. In general, the low average amount of debonding is characteristic of well bonded anchors in moderately strong rock wherein high stress concentrations at the top of the bond zone are created and the more distal parts of the bond zone see little or no load (Littlejohn and Bruce 1977). The elastic performance of each anchor was closely replicated during the subsequent (cyclic) Extended Creep Testing (average debonded length estimated for the 23 anchors was 2.4 feet). This proves that further progressive debonding was not induced by the rigors of the Extended Creep Testing process. Permanent Movement. There is no acceptance criterion for permanent movement in PTI or in the Corps’ specification. The final permanent movement can only be measured when the load is reduced back to Alignment Load following the total extension reading made at Test Load. Therefore, it is typically measured only during Performance or Extended Creep Tests since most practitioners do not accept the option given in PTI to do so during Proof Testing, due to the extra time and effort required.

Table 1. Details of anchors subjected to Performance and Extended Creep Testing, Marmet Locks and Dam.
It is therefore useful to note in Table 1 the magnitude of the permanent movement measured during the Performance Testing: a range of 0.140 to 0.697 inches (average 0.444 inches). In hard rock conditions such as here it is inconceivable that such a movement is caused by the whole bond zone pulling through the rock mass. Equally, there was no possibility of friction gripping the strands of the free length (since there was no grout in place there at the time of testing). Therefore it must simply be concluded that the permanent movement was caused by “bedding in” of the top anchorage and its components. This view is supported by a comparative examination of the permanent movements recorded during the subsequent Extended Creep Testing. In every case in Table 1, the later permanent movements were much smaller — at each load and overall — usually by several times. Table 2 provides further information on three anchors as examples. The average permanent movement at Test Load in the later Extended Creep Tests was 0.127 inches — about 3.5 times less than for the earlier Performance Test.

Creep. During a Performance Test, a 10-minute creep test is run at Test Load only. Not surprisingly, since the anchors were transferring their load in a predominantly strong sandstone horizon, creep was minimal in these tests: zero to 0.013 inches in the period 1 to 10 minutes (average 0.004 inches) into the load hold. PTI allows 0.040 inches as the acceptance criterion in this period. The same small creep values were noted in all log cycles during the Extended Creep Testing (to 300 minutes). All anchors also showed a diminishing rate of creep with time. The Corps’ criterion is 0.080 inches per log cycle during the final log cycle of the test, regardless of load. The PTI criterion is 0.040 inches in any log cycle.
Table 2. Comparison of Final Permanent Movements Measured in Each Type of Test for Three Anchors,
Marmet Locks and Dam, West Virginia.
PERMANENT MOVEMENT (INCHES)
ANCHOR M15-C1 ANCHOR M5-1/B3 ANCHOR 3-4/B4 LOAD STEP (%
DWL) PERFORMANCE TEST
EXTENDED CREEP TEST
PERFORMANCE TEST
EXTENDED CREEP TEST
PERFORMANCE TEST
EXTENDED CREEP TEST
25 0.080 0.020 0.141 0.005 0.100 0.024 50 0.135 0.028 0.214 0.013 0.272 0.053 75 0.170 0.041 0.318 0.037 0.423 0.081 100 0.225 0.055 0.367 0.045 0.458 0.092 120 0.301 0.060 0.424 0.054 0.640 0.099 133 0.451 0.100 0.528 0.100 0.697 0.110
Notes: (1) In each case, permanent movement after Test Load (133%) in the Extended Creep Test was
extrapolated. (2) In each anchor, the elastic extension curves obtained during Performance and Creep Testing were
practically identical. Lift Off Test. The load transferred at Lock Off is measured by a Lift Off Test immediately after Lock Off. A 5% tolerance is permitted. The range as shown in Table 1 was -2 to +3%, indicating that, by using good practice, accurate results can be routinely achieved.
TOM MILLER DAM, TEXAS General Background Tom Miller Dam is located on the lower Colorado River, approximately six miles northwest of Austin, Texas. Tom Miller Dam impounds Lake Austin, the last in a series of reservoirs referred to as the “Highland Lakes” of central Texas. The dam was

originally constructed from 1890 to 1893 as an uncontrolled overflow gravity spillway. The original dam was a cyclopean structure built using a core of mortared irregular limestone rocks faced with granite masonry. The dam failed catastrophically in 1900 when a 500 feet long section of the spillway slid downstream. Following the first failure, a series of site investigations concluded there were very undesirable conditions at the site to support reconstruction. A board of prominent engineers including the Chief of the United States Reclamation Service examined the site and recommended the dam be rebuilt at a different location with improved geologic conditions. Despite the board’s recommendations, the dam was rebuilt by the city of Austin in 1912, at its original location, and failed again in 1915. In a major engineering and reconstruction effort, the dam was rebuilt to its current configuration by the Lower Colorado River Authority from 1939 to 1941. The current dam is therefore a composite structure that combines features of each of the previous dams, including a 500 feet long uncontrolled overflow gravity spillway, a 600 feet long flat slab-and-buttress dam, and a powerhouse with a gravity bulkhead intake structure. The present gravity spillway consists of a reinforced concrete cap over the original cyclopean masonry core. As part of a 10-year program to modernize the Highland Lakes, the dam was upgraded in 2004 to meet current dam safety standards. Review of dam revealed that the uncontrolled overflow and powerhouse intake gravity sections were unstable against floods exceeding the 500-year event and required stabilization to comply with state dam safety regulations. Design studies showed that post-tensioned anchors were clearly the most economical solution for increasing the dam’s stability, notwithstanding the significant challenges posed by the complicated geology and composite construction of the dam. Geologic and Structural Challenges The bedrock beneath Tom Miller Dam is Edwards Limestone, specifically the basal 100 to 200 feet of the formation. It consists of moderately weathered limestone with highly weathered zones found in several horizontal planes below the structure. An extensive geotechnical investigation program identified zones of varying rock quality below the dam, ranging from a highly permeable fractured zone for the first 5 to 10 feet below the dam, a less fractured zone exhibiting lower permeability, and a deep highly porous vuggy zone showing signs of significant water movement through the formation. Cavernous voids were found in many places, with individual voids exceeding 2 feet. Several caves and karst openings had been noted in previous geotechnical investigations and surveys near the dam, although no caves were encountering during the drilling program for this project. The core of the dam comprises mortared irregular limestone blocks. The limestone was quarried from a site adjacent to the right abutment of the dam, and so the limestone is of a similar quality as the foundation rock beneath the dam. The site investigations identified this core to be highly permeable with poorly cemented areas and voids immediately beneath the concrete cap. The unconfined compressive strength of the foundation ranged from 480 to 22,400 psi, with an average value of 3,200 psi. The unit weight of the rock

ranged from 98 to 168 pcf and the rock quality designation ranged from 0 to 100%. The permeability of the foundation, measured in Lugeon units, ranged from 0 to 957 with an average value of 52 Lugeon. The unconfined compressive strength of the masonry dam core ranged from 1,090 to 9,460 psi, with an average value of 2,990 psi. The unit weight of the rock ranged from 124 to 153 pcf and the rock quality designation ranged from 0 to 90%. The permeability of the masonry core ranged from 0 to 979 Lugeons with an average value of 294 Lugeons. Scope of the Anchor Works Post-tensioned multi-strand tendon anchors were used to provide an adequate factor of safety against sliding and overturning for the uncontrolled overflow spillway and powerhouse intake structure. The anchor design was carefully developed to handle difficult geologic and structural conditions that would often be considered detrimental to construction of post-tensioned stabilization systems including zones of poor quality, severely weathered, fractured, decomposed, cavitated, or highly permeable rock showing evidence of significant water movement through the dam core and foundation rock formation. The uncontrolled overflow spillway was stabilized using a single line of fifty-two vertical post-tensioned anchors spaced over the 500 feet spillway length (Figure 2).
Figure 2. Schematic cross section of the overflow section,
Tom Miller Dam, TX The anchors were installed in 18 individual monoliths and spacings were adjusted to provide clearance to the dam’s internal drain system in the foundation and beneath the concrete overlay cap. The anchors were positioned immediately downstream of an existing concrete cutoff but upstream of existing foundation drains. The drill lengths

alternated between 127 and 137 feet for adjacent anchors to vary the bond zone depths and avoid setting up a potential plane of failure in the foundation. The 18-strand tendons, with Class 1 corrosion protection (PTI, 1996), were installed in vertical, eight-inch diameter drilled holes. An additional three anchors were installed to stabilize the powerhouse intake structure, where hole lengths alternated between 143 and 153 feet for adjacent anchors (Figure 3).
Figure 3. Location of anchors in Powerhouse intake structure,
Tom Miller Dam, TX The anchors were carefully positioned to allow installation through a narrow concrete wall section along-side and between the powerhouse intake penstocks. The Design Working Load of each anchor was 60% GUTS and the Test Load stress was 80% GUTS. A 30 feet long bond zone was selected for the production anchors based on the results of a field test anchor program conducted during final design. Two anchors were tested to failure and two were Performance Tested according to Post-Tensioning Institute (1996) procedures. The bond zone was carefully positioned to be in a region of relatively competent limestone, beneath the highly permeable zone identified immediately under the dam and above the deep vuggy zone. Despite this attention to positioning the bond zone, it was clear that the contractor would encounter random zones of poor rock and high permeability throughout the anchor holes. In response to these difficult conditions for anchor drilling and grouting, each hole was mandated to be pre-treated by gravity grouting using a sand cement mixture. The holes

were then redrilled, water-tightness tested, and neat cement grouted (where necessary) to enable the anchors to be installed in accordance with the PTI watertightness criterion for the bond zone (2½ gallons loss in 10 minutes at 5 psi excess head). A corrugated sheathing was then pregrouted in several stages in the hole prior to tendon insertion and grouting. The tendons were fabricated using a greased and sheathed free zone to ensure that post-tensioning forces were transferred into the foundation below the weaker highly fractured zone near the dam/foundation contact and away from the masonry core. A length of bare strand was provided at the top of the anchor beneath the anchorage to provide for fully grouted tendons bonded in the thirteen-foot thick concrete cap. In order to improve the quality of the stressing data, the anchor contractor elected to apply Performance Test procedures to almost every anchor, and not only the 5% or so as requested in the Specification. Analysis of Data Construction. Strict qualification requirements were developed to select a specialized anchor contractor experienced in similar post-tensioned stabilization projects. Two full-scale test anchors were first constructed to prove that the contractor could successfully install and test the production anchors. Vertical extensometers were installed adjacent to the test anchors to verify that the application of the post-tensioning forces did not have an adverse affect on the structure considering the irregular character of the masonry core. By following a disciplined quality control program, the contractor successfully demonstrated that the holes could be drilled within the specified alignment tolerances, the foundation rock treated to meet water tightness criteria, the tendons effectively installed and grouted, and the anchor tested and locked-off in accordance with the acceptance criteria. Based on observations of the site specific field conditions, several improvements were made to the fabrication and installation program to enhance the construction of the remaining 53 anchors. The two test anchors were accepted as production anchors and the remaining anchors were released for hole drilling and tendon fabrication. To gain a familiarity with the groutability of the masonry core and foundation, grouting procedures were refined based on a series of trial mix batches to enhance the effectiveness of the remaining grouting operations. Sand-cement grout takes ranged up to 369% of the theoretical hole volume. In general, the volume of takes decreased as the project proceeded and the dam and its foundation progressively tightened. Subsequent neat cement grouting was only required in 17 of the anchor holes, highlighting the effectiveness and benefits of the routine sand-cement grouting operation. Takes were generally moderate, with only four holes requiring more than one neat grout treatment. All other aspects of anchor construction (such as hole verticality, sheath testing and grouting, and tendon insertion and grouting) provided consistent, compliant, and acceptable results. 28-day tendon grout strengths were typically well in excess of 8000 psi. Stressing and Testing. Table 3 summarizes the stressing and testing data insofar as they relate to the specified acceptance criteria. It may be summarized that each and every

Table 3. Summary of Stressing Data, Tom Miller Dam, TX
Anchor Geometry Performance Test Analysis
Sequence of
Stressing
Anchor Number Monolith
Bon
d Le
ngth
(ft
)
Free
Len
gth
(feet
)
App
aren
t Fr
ee L
engt
h (ft
)
So,
App
aren
t D
ebon
ding
at
Tes
t Loa
d (ft
)
Per
man
ent
Mov
emen
t at
Test
Loa
d (In
ches
)
Cre
ep in
1 to
10
Min
utes
(In
ches
)
Lift Off Load (as %
Lock Off Load)
1 25 11 30 97 102.6 -5.6 1.024 0.027 99 2 40 5 30 103 103.7 -0.7 0.614 0.022 100 3 32 8 30 108 115.8 -7.8 0.966 0.019 100 4 22 12 30 108 115.3 -7.3 0.937 0.004 98 5 7 17 30 98 106.4 -8.4 1.062 0.022 98 6 42 4 30 108 116.9 -8.9 0.659 0.002 100 7 8 16 30 108 114.6 -6.6 0.704 0.004 101 8 30 9 30 108 115.5 -7.5 0.643 0.007 100 9 41 5 30 94 97.5 -3.5 0.583 0.005 99 10 51 1 30 98 102.3 -4.3 0.618 0.007 99 11 20 13 30 108 117.9 -9.9 0.736 0.020 101 12 31 9 30 98 105.2 -7.2 0.626 0.011 101 13 43 4 30 97 101.8 -4.8 0.730 0.021 100 14 9 16 30 97 101.5 -4.5 0.735 0.008 101 15 23 12 30 98 104.7 -6.7 0.543 0.006 100 16 6 17 30 108 112.3 -4.3 0.702 0.010 101 17 33 8 30 98 98.8 -0.8 0.533 0.011 101 18 45 3 30 98 104.0 -6.0 0.792 0.027 100 19 34 8 30 108 115.6 -7.6 0.606 0.013 100 20 21 13 30 98 103.3 -5.3 0.502 0.006 100 21 44 4 30 108 112.9 -4.9 0.687 0.005 100 22 4 17 30 108 113.3 -5.3 0.647 0.013 100 23 10 16 30 107 114.5 -7.5 0.768 0.012 100 24 26 11 30 108 110.6 -2.6 0.933 0.017 100 25 35 7 30 98 99.5 -1.5 0.691 0.016 101 26 46 3 30 108 117.1 -9.1 0.662 0.007 100 27 24 12 30 107 111.6 -4.6 0.742 0.012 100 28 36 7 30 108 116.2 -8.2 0.716 0.008 100 29 47 2 30 98 105.9 -7.9 0.552 0.002 100
(continues)

Anchor Geometry Performance Test Analysis
Sequence of Stressing
Anchor Number Monolith
Bon
d Le
ngth
(ft
)
Free
Len
gth
(feet
)
App
aren
t Fr
ee L
engt
h (ft
)
So,
App
aren
t D
ebon
ding
at
Tes
t Loa
d (ft
)
Per
man
ent
Mov
emen
t at
Test
Loa
d (In
ches
)
Cre
ep in
1 to
10
Min
utes
(In
ches
)
Lift Off Load (as %
Lock Off Load)
30 1 18 30 98 102.6 -4.6 0.660 0.014 100 31 11 15 30 98 105.7 -7.7 0.764 0.013 100 32 29 10 30 98 101.5 -3.5 0.576 0.011 100 33 37 6 30 97 101.0 -4.0 0.559 0.008 100 34 48 2 30 108 114.4 -6.4 0.600 0.006 101 35 16 14 30 108 110.9 -2.9 0.579 0.007 100 36 5 17 30 98 100.8 -2.8 0.557 0.003 100 37 28 10 30 105 108.9 -3.9 0.675 0.005 100 38 38 6 30 107 111.7 -4.7 0.651 0.005 100 39 50 1 30 107 113.3 -6.3 0.721 0.011 100 40 39 6 30 97 103.7 -6.7 0.538 0.015 100 41 27 10 30 97 102.3 -5.3 0.591 0.005 99 42 3 18 30 97 101.7 -4.7 0.698 0.010 100 43 15 14 30 97 101.9 -4.9 0.574 0.007 100 44 49 2 30 97 102.9 -5.9 0.572 0.018 100 45 2 18 30 107 113.6 -6.6 0.522 0.005 101 46 17 14 30 97 103.4 -6.4 0.571 0.006 100 47 19 13 30 97 102.9 -5.9 0.554 0.011 100 48 12 15 30 107 112.8 -5.8 0.576 0.011 100 49 14 15 30 107 115.0 -8.0 0.576 0.008 101 50 18 13 30 107 113.9 -6.9 0.552 0.007 101 51 13 15 30 97 103.5 -6.5 0.584 0.008 101 52 52 1 30 107 115.2 -8.2 0.617 0.007 100 53 53 Powerhouse 30 113 126.0 -13.0 1.310 0.005 100 54 55 Powerhouse 30 123 136.6 -13.6 0.990 0.005 101
55 54 Powerhouse 30 113 119.0 -6.0 0.624 0.003 101 (concluded)
anchor proved completely acceptable given the elastic extension criterion, the short-term creep criterion, and the lift-off criterion all in conformance with PTI (1996). Furthermore, the load-extension graphs for each anchor confirmed an extremely linear and repeatable characteristic, indicative of minimum debonding. The permanent movements ranged from 0.533 to 1.310 inches (typically around 0.750 inches), while it was observed during stressing that perhaps as much as 0.3 inch of these apparent movements could in fact be
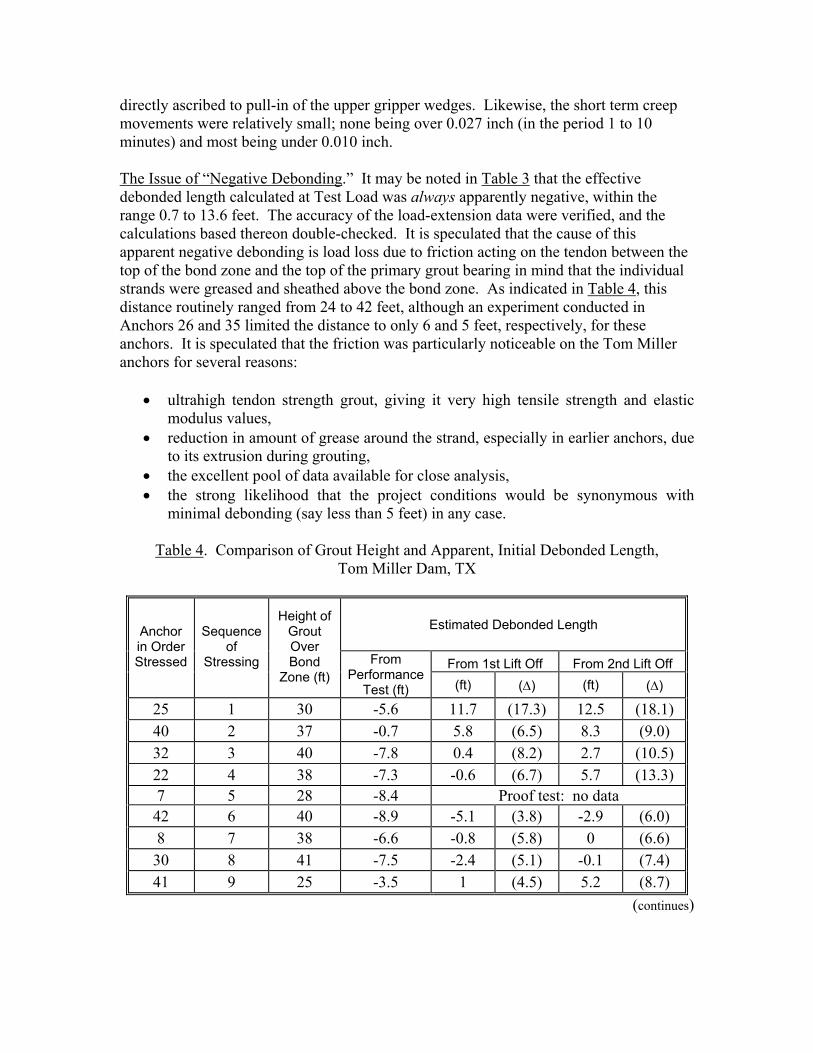
directly ascribed to pull-in of the upper gripper wedges. Likewise, the short term creep movements were relatively small; none being over 0.027 inch (in the period 1 to 10 minutes) and most being under 0.010 inch. The Issue of “Negative Debonding.” It may be noted in Table 3 that the effective debonded length calculated at Test Load was always apparently negative, within the range 0.7 to 13.6 feet. The accuracy of the load-extension data were verified, and the calculations based thereon double-checked. It is speculated that the cause of this apparent negative debonding is load loss due to friction acting on the tendon between the top of the bond zone and the top of the primary grout bearing in mind that the individual strands were greased and sheathed above the bond zone. As indicated in Table 4, this distance routinely ranged from 24 to 42 feet, although an experiment conducted in Anchors 26 and 35 limited the distance to only 6 and 5 feet, respectively, for these anchors. It is speculated that the friction was particularly noticeable on the Tom Miller anchors for several reasons:
• ultrahigh tendon strength grout, giving it very high tensile strength and elastic modulus values,
• reduction in amount of grease around the strand, especially in earlier anchors, due to its extrusion during grouting,
• the excellent pool of data available for close analysis, • the strong likelihood that the project conditions would be synonymous with
minimal debonding (say less than 5 feet) in any case.
Table 4. Comparison of Grout Height and Apparent, Initial Debonded Length, Tom Miller Dam, TX
Estimated Debonded Length
From 1st Lift Off From 2nd Lift Off
Anchor in Order Stressed
Sequence of
Stressing
Height of Grout Over Bond
Zone (ft) From
Performance Test (ft) (ft) (∆) (ft) (∆)
25 1 30 -5.6 11.7 (17.3) 12.5 (18.1) 40 2 37 -0.7 5.8 (6.5) 8.3 (9.0) 32 3 40 -7.8 0.4 (8.2) 2.7 (10.5) 22 4 38 -7.3 -0.6 (6.7) 5.7 (13.3) 7 5 28 -8.4 Proof test: no data 42 6 40 -8.9 -5.1 (3.8) -2.9 (6.0) 8 7 38 -6.6 -0.8 (5.8) 0 (6.6) 30 8 41 -7.5 -2.4 (5.1) -0.1 (7.4) 41 9 25 -3.5 1 (4.5) 5.2 (8.7)
(continues)

Estimated Debonded Length
From 1st Lift Off From 2nd Lift Off
Anchor in Order Stressed
Sequence of
Stressing
Height of Grout Over Bond
Zone (ft) From
Performance Test (ft) (ft) (∆) (ft) (∆)
51 10 32 -4.3 2.8 (7.1) 4.1 (8.4) 20 11 38 -9.9 -4 (5.9) -3.3 (6.6) 31 12 32 -7.2 -3.4 (3.8) -2.1 (5.1) 43 13 30 -4.8 -0.3 (4.5) 1.1 (5.9) 9 14 27 -4.5 3.4 (8.9) 0.7 (5.2) 23 15 28 -6.7 -1.1 (5.6) 0.9 (7.6) 6 16 36 -4.3 0.9 (5.2) 3.1 (7.4) 33 17 32 -0.8 3.7 (4.5) 4.4 (5.2) 45 18 31 -6.0 2.4 (8.4) 2.4 (8.4) 34 19 42 -7.6 -2.1 (5.5) -0.7 (6.9) 21 20 28 -5.3 -1.4 (3.9) 0.6 (5.9) 44 21 42 -4.9 0.8 (5.7) 2.3 (7.2) 4 22 35 -5.3 1.4 (6.7) 3.7 (9.0) 10 23 34 -7.5 -0.2 (7.3) 2 (9.5) 26 24 6 -2.6 6.1 (8.7) 8.5 (11.1) 35 25 5 -1.5 4.5 (6.0) 5.9 (7.4) 46 26 40 -9.1 -3.3 (5.8) -1.1 (8.0) 24 27 34 -4.6 1.1 (5.7) 3.3 (7.9) 36 28 41 -8.2 -5.3 (2.9) -0.3 (7.9) 47 29 28 -7.9 -2.9 (5.0) -1 (6.9) 1 30 24 -4.6 0.9 (5.5) 4.2 (8.8) 11 31 25 -7.7 -0.4 (7.3) 1 (8.7) 29 32 27 -3.5 2.6 (6.1) 4.7 (8.2) 37 33 28 -4.0 0.9 (4.9) 2.2 (6.2) 48 34 39 -6.4 -1.5 (4.9) -0.8 (5.6) 16 35 35 -2.9 2.2 (5.1) 4.5 (7.4) 5 36 25 -2.8 3.9 (6.7) 4.6 (7.4) 28 37 34 -3.9 -1.1 (2.8) 4.6 (8.5) 38 38 38 -4.7 2.4 (7.1) 3.9 (8.6)
50 * 39 40 -6.3 -2.9 (3.4) 0 (6.3) 39 * 40 28 -6.7 -2 (4.7) -0.6 (6.1) 27 * 41 28 -5.3 -0.2 (5.1) 1.8 (7.1)
(continues)

Estimated Debonded Length
From 1st Lift Off From 2nd Lift Off
Anchor in Order Stressed
Sequence of
Stressing
Height of Grout Over Bond
Zone (ft) From
Performance Test (ft) (ft) (∆) (ft) (∆)
3 * 42 24 -4.7 0.8 (5.5) 2.1 (6.8) 15 * 43 24 -4.9 0.2 (5.1) 0.9 (5.8) 49 * 44 28 -5.9 -0.7 (5.2) -0.1 (5.8) 2 * 45 34 -6.6 -0.11 (6.5) 0.62 (7.2) 17 46 24 -6.4 -1.2 (5.2) -0.5 (5.9) 19 47 23 -5.9 -0.7 (5.2) 2 (7.9) 12 48 31 -5.8 1 (6.8) 2.5 (8.3) 14 49 33 -8.0 -2.4 (5.6) -0.2 (7.8) 18 50 30 -6.9 -2.3 (4.6) -0.9 (6.0) 13 51 20 -6.5 -1.9 (4.6) -1.3 (5.2) 52 52 37 -8.2 -4.1 (4.1) -1.4 (6.9) 53 53 16 -13.0 -5.6 (7.4) -3.3 (9.7) 55 54 31 -13.6 -4.9 (8.7) -4.1 (9.5) 54 55 Net yet available.
(concluded) The amount of friction could reasonably be expected to increase in relation to the height of the grout column above the bond zone at time of stressing and indeed, the data of Figure 4 do indicate a broad relationship. The issue of trying to analytically isolate the effect of friction was assiduously addressed in the field resulting in a very ingenious and plausible analysis. After return to AL, following TL, each tendon was stressed again to approximately 1.2 times WL where the extension over the interval AL to 1.2 WL was measured. The anchor load was reduced to AL and the extension recorded. Following this final extension measurement, the anchor was stressed to 1.2 WL and locked-off. Thus, as 1.2 WL, the actual load remaining in the tendon, and the total tendon extension had been recorded. For the first 38 anchors, the permanent movement previously recorded at 1.2 WL during the Performance Testing was used to allow a reasonable estimate of elastic movement during the subsequent Lock-Off procedure. In this way, the standard PL/AE calculation could be applied to estimate apparent debonding after Lock-Off, i.e., accounting for some degree of quick friction release. In the latter anchors, an additional cycle to AL was added in the Lock-Off procedure to allow an actual measurement of elastic movement during this phase. Thereafter, during the final Lift-Off Testing (3 to 13 days after Initial Lift Off) a further load measurement was made and an apparent free length calculation undertaken, based on the same elastic movement used in the previous calculation.

Thus, for each anchor, there existed a calculation of apparent debonding made a) as a result of the Performance Test, b) immediately after, during the Lock-Off / Initial Lift-Off procedure and c) several days later during the Final Lift-Off Test, by which it was to be hoped that all the friction would have been released. This, of course, is a “worst case”
-16.0
-14.0
-12.0
-10.0
-8.0
-6.0
-4.0
-2.0
0.00 5 10 15 20 25 30 35 40 45
Grout Cover over bond zone (ft)
Deb
ondi
ng (f
irst e
stim
ate)
(ft)
Figure 4. Apparent debonded length (first estimate) in relation to the height of grout cover over the bond zone, Tom Miller Dam, Texas.
scenario in that all the load loss is ascribed to friction release, and the effects of steel relaxation are ignored: the amount of apparent debonding will thus be overestimated. Data are summarized in Table 4. It is remarkable that (with the exception of Anchor 25, the first tested and Anchor 7, proof tested only) this study has yielded very consistent data:
• Comparing estimates from Performance Testing and Initial Lift-Off, the apparent debonded length was typically increased by 4 to 8 feet per tendon, thus resulting in debonding estimates generally in the range of -5 to 4 feet at Test Load (TL).
• Comparing estimates from Performance Testing and the Second Lift-Off, the increase is larger (5 to 10 feet) providing debonding values typically in the range -1 to 5 feet. This seems to be a very feasible result. There is no apparent relationship between the amount of debonding variation as calculated in this process and the length of grout cover.
• Although the data plotted in Figure 4 show considerable scatter, there is some indication that the amount of extra debonding is in fact time dependent, i.e., that

relaxation is also having an effect (possibly as much as the equivalent of 4 feet over a period of 20 days). Thus, it may be speculated that the load loss (and hence the basis for calculating the apparent debonded length) is comprised of two components: an initial, very quick loss wherein the friction is released, and a normal relaxation thereafter. Up to 20 days the proportions of load loss ascribable to each may well be of the same magnitude on this project. If this is the case, then the obvious conclusion is that the true debonded lengths of the anchors were absolutely minimal, consistent with the “shape” of the load-extension plots.
FINAL REMARKS
In each of these two projects, an extremely and unusually intense level of anchor testing has been conducted. Close study of the data has permitted insights to be gained into aspects of anchor performance that are not commonly revealed in practice. The data confirm typical ranges for (apparent) permanent movements, but there is strong evidence that the great proportion of such movements are not related to bond zone phenomena. Apparent debonding lengths (i.e., tendon-grout interface) are confirmed as being minimal in medium hard rocks where high quality anchor construction has been assured. Likewise, data are provided on short-term creep performance, and Lift Off Test variations which can be anticipated under similar geological and construction circumstances. The somewhat complex issue of friction acting on the strands in the free length is addressed, and it is the hope of the authors that the additional stressing steps described in this paper will be of interest and value to engineers puzzled by the results of calculations which consistently indicate the physical impossibility of having achieved “negative debonding.” Finally the process of borehole pregrouting (and redrilling) to assure minimal loss of subsequent tendon grout is one which can severely upset a project’s schedule and cost. At Tom Miller Dam, a vital strategic decision was made in the planning stage that every hole would be pretreated with a sand-cement grout to cement the dam’s core and to fill suspected voids in the bedrock. This removed the uncertainty and the risk to all parties at the bidding stage and during construction with respect to this challenge.
ACKNOWLEDGEMENTS At Marmet Locks and Dam, the Owner was the U.S. Army Corps of Engineers, the General Contractor, Kukosing/Fru-Con, LLC and the anchor Subcontractor, Jensen Drilling Company. At Tom Miller Dam, the Owner was the Lower Colorado River Authority, the Consultant, Freese & Nichols, Inc., the General Contractor, ASI RCC and the anchor Subcontractor, FEC (now Nicholson Construction Company). The authors appreciate the cooperation of each of these companies in the preparation of this paper.

REFERENCES
1. Bruce, D.A. Gerlach, J.A., Greene, B.H. and Schaffer, A. (1994). "Locking into
Success.” Civil Engineering 64 (4) April pp. 48-50. 2. Post Tensioning Institute (PTI). (1996). “Recommendations for prestressed rock and
soil anchors.” Post Tensioning Manual. Fourth Edition. Phoenix, Arizona. 41 p. 3. Bruce, D.A. (2002, 2003). “Epoxy Protected Strand: A Historical Review of its Use
for Prestressed Rock Anchors, Part I and Part 2.” Foundation Drilling. ADSC: The International Association of Foundation Drilling, Vol. XXII, No. 8, November, pp. 14-18 and No. 1, December/January, pp. 22-31.
4. Post Tensioning Institute (PTI). (2004). “Recommendations for prestressed rock and soil anchors.” Post Tensioning Manual. Fifth Edition.
5. Littlejohn, G.S. and D.A. Bruce. (1977). “Rock Anchors - State of the Art.” Foundation Publications, Essex, England, 50 pp. (Previously published in Ground Engineering in 5 parts, 1975-1976.)