bruker’s nanoelute uhplc shows excellent performance and ... · pdf filebruker’s...
TRANSCRIPT
Keywords: LC-MS, nanoElute, nanoflow, peak area reproducibility, retention time stability, peak width, peak capacity
Bruker’s nanoElute UHPLC shows excellent performance and ease of use for proteomics
Authors: Thomas Kosinski 1, Matt Willets 2, Pierre-Olivier Schmit 3, Gary Kruppa 2
1 Bruker Daltonik GmbH, Bremen, Germany; 2 Bruker Daltonics Inc., Billerica, MA, USA; 3 BrukerDaltonique S.A., Wissembourg, France
Abstract
Bruker’s new nanoElute nanoflow UHPLC offers excellent chromato-graphic performance in terms of separation and reproducibility with different gradient lengths, and with or without a trap column.
Introduction
Samples in shotgun proteom-ics are often highly complex and can easily contain thousands of peptides in a narrow mass range which leads to analytical chal-lenges. Therefore peptide sepa-ration is commonly performed by nano-flow UHPLC, which brings
several advantages, including high peak capacity and ESI compatible solvent composition and flow rate. Despite the increasing speed and sensitivity of mass spectrometers, enhancing their ability to analyze more ions eluting from the column at any given time, an improvement of chromatographic separation still provides a tremendous boost
in the number of identified proteins. Furthermore, highly reproducible peak areas and retention times are crucial for more sophisticated quantitative analyses. To cover all these demands, a reliable HPLC system is essential.
In this study we evaluated the four essential chromatographic perfor-mance indicators of the Bruker nano-Elute: retention time variation, peak area variation, peak width and peak capacity, to test the nanoElute for the challenging requirements of sophisti-cated proteomic analytics.
Experimental
Samples
Aliquots of a commercially available tryptic digest of HeLa cells were diluted with 0.1 % formic acid in water to a concentration of 100 ng/µL.
For chromatographic separation a curved gradient with three different lengths was used, as shown in the table below. The gradient consists of solvent A, 0.1 % formic acid in water and solvent B, 0.1 % formic acid in acetonitrile with the temperature of the separation column maintained at 50 °C and a flow rate of 400 nL/min.
Four technical replicates were made with the 90 min gradient and five tech-nical replicates with the 120 min gra-dient and the 240 min gradient, each measured using a setup without a trap column, and with a trap column. Switching between setups with and without a trap column is conveniently and easily done in the software.
For MS detection an Impact II QTOF mass spectrometer equipped with a CaptiveSpray nanoBooster Source
with pure ACN was used. The instru-ment was operated in ESI positive mode acquiring full scan MS and MS/MS data using the InstantExpertise™ routine. This is a self-adapting auto MS/MS method which is designed to obtain highest quality results inde-pendently of the complexity and con-centration of the sample. It uses an advanced parent ion selection proce-dure combined with a variable MS/MS acquisition rate [1] and is pre-installed in the impact II instrument control software (otofControl).
Data Analysis
For analyzing the chromatographic data Bruker’s Compass DataAnalysis was used. Eight peptides, which were evenly distributed in time through the gradient, were selected from the HeLa chromatogram. EICs were made for these peptide masses and the peak
Mass Spectrometry
Instrument: Bruker impact II QTOF mass spectrometer
Dry Gas: 3.0 L/min
Ion source: CaptiveSpray nanoBooster in positive ion mode
Dry Temperature: 150 °C
Capillary: 1600 V nanoBooster: 0.20 Bar
Liquid chromatography
Instrument: Bruker nanoElute™ Gradient Conditions:
90 min Gradient
120 min Gradient
240 min Gradient
Composition B
Column: Acclaim PepMap™ RSLC; 75 µm x 50 cm
0 min 0 min 0 min 2 % B
Mobile phase A: Water, 0.1 % formic acid 60 min 90 min 180 min 15 % B
Mobile phase B: ACN, 0.1 % formic acid 90 min 120 min 240 min 25 % B
Trap column loading:
100 % mobile phase A 100 min 130 min 250 min 35 % B
Flow rate: 400 nL/min 110 min 140 min 260 min 95 % B
Injection volume: 2 µL 120 min 150 min 270 min 95 % B
Column oven: 50 °C
area, retention time and peak widths were compared between the technical replicates.
Results and Discussion
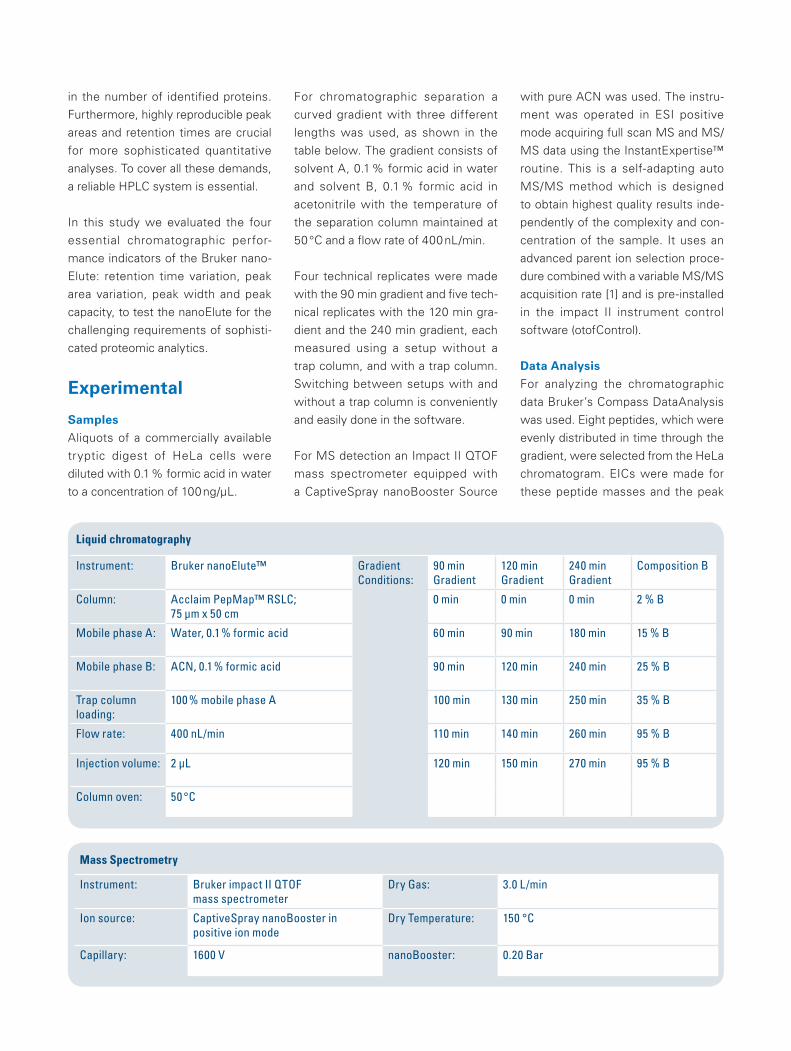
The gradient length in shotgun pro-teomics typically varies between 90 min to 240 min. With the pressure limit of the new nanoElute of 1000 bar, combined with a column oven, 50 cm column lengths are possible. The nanoElute Method Editor allows any
gradient to be generated with only a few mouse clicks and all typical wash and equilibration steps are added auto-matically.
Performance
Highly reproducible chromatographic separation is essential in any quanti-tative analysis. The LC must provide an eluent flow, the gradient mixture and the injection volume precisely to ensure the reproducibility of each chromatographic run. To evaluate the
instrument performance, we have compared multiple technical replicates with a 90 min, 120 min and 240 min gradient and determined the most important performance criteria.
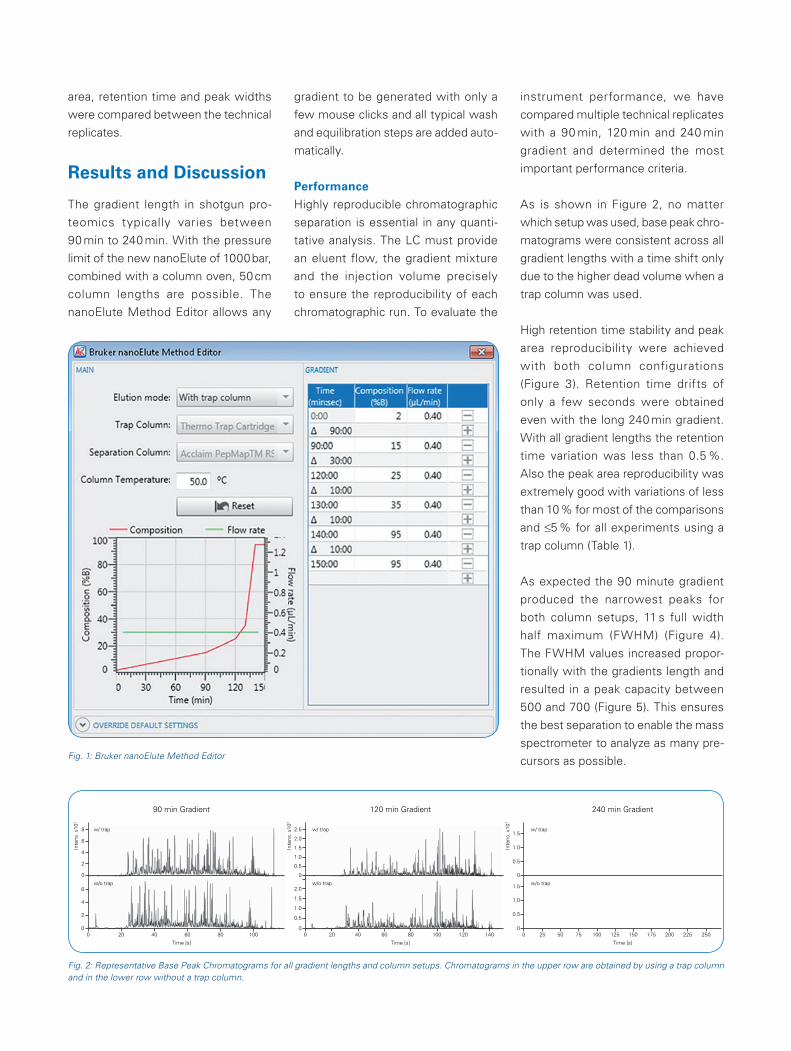
As is shown in Figure 2, no matter which setup was used, base peak chro-matograms were consistent across all gradient lengths with a time shift only due to the higher dead volume when a trap column was used.
High retention time stability and peak area reproducibility were achieved with both column configurations (Figure 3). Retention time drifts of only a few seconds were obtained even with the long 240 min gradient. With all gradient lengths the retention time variation was less than 0.5 %. Also the peak area reproducibility was extremely good with variations of less than 10 % for most of the comparisons and ≤5 % for all experiments using a trap column (Table 1).
As expected the 90 minute gradient produced the narrowest peaks for both column setups, 11 s full width half maximum (FWHM) (Figure 4). The FWHM values increased propor-tionally with the gradients length and resulted in a peak capacity between 500 and 700 (Figure 5). This ensures the best separation to enable the mass spectrometer to analyze as many pre-cursors as possible.Fig. 1: Bruker nanoElute Method Editor
Fig. 2: Representative Base Peak Chromatograms for all gradient lengths and column setups. Chromatograms in the upper row are obtained by using a trap column and in the lower row without a trap column.
0
2
4
6
0
2
4
6
8
20 40 60 80 1000
Time [s]
Inte
ns. x
107
0
0.5
1.0
1.5
2.0
0
0.5
1.0
2.0
1.5
2.5
20 40 60 80 100 120 1400
Time [s]
Inte
ns. x
107
0
0.5
1.0
1.5
0
0.5
1.0
1.5
25 50 75 100 125 150 175 200 225 2500
Time [s]
90 min Gradient 120 min Gradient 240 min Gradient
Inte
ns. x
107
w/o trap
w/ trap
w/o trap
w/ trap
w/o trap
w/ trap
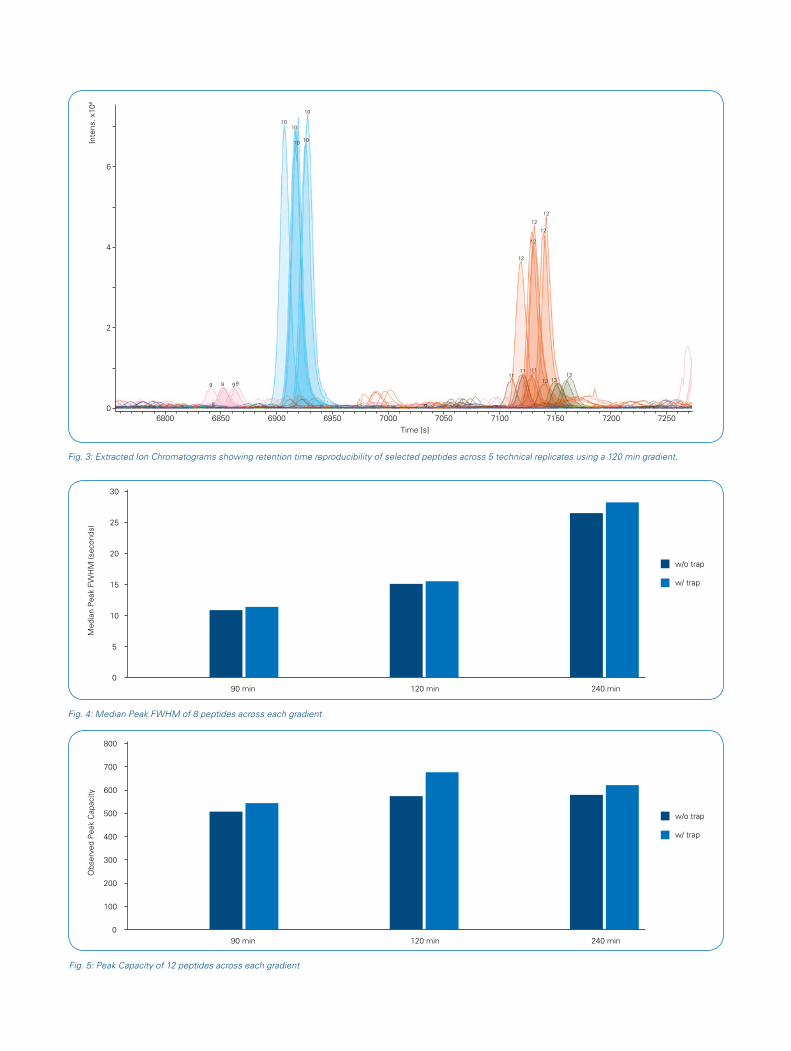
Fig. 3: Extracted Ion Chromatograms showing retention time reproducibility of selected peptides across 5 technical replicates using a 120 min gradient.
0
2
4
6
8
9 9 99
1010
10 10
10
1111 11
13 1313
12
12
12
12
12
6800 6850 6900 6950 7000
Time [s]
7050 7100 7150 7200 7250
Inte
ns. x
106
90 min 120 min 240 min0
5
10
15
20
25
30
Med
ian
Pea
k FW
HM
(sec
onds
)
w/o trap
w/ trap
90 min 120 min 240 min0
100
200
300
400
500
600
700
800
Obs
erve
d P
eak
Cap
acity
w/o trap
w/ trap
Fig. 5: Peak Capacity of 12 peptides across each gradient
Fig. 4: Median Peak FWHM of 8 peptides across each gradient

Conclusion
The nanoElute is the perfect companion to the impact II to perform high performance proteomics experiments. It outperforms state of the art nano-UHPLC systems in terms of performance and reliability combination. At the same time the nanoElute offers easy to use method configuration and sophisticated diagnostic procedures with a push of a button.
It allows for:• High retention time stability• High Peak Area reproducibility• Narrow peaks• High peak capacity
• Simple gradient configuration• Automatic diagnostic tool• Trap column switchable with a push of a button
Median Retention Time Variation
90 min 120 min 240 min
w/o trap w/ trap w/o trap w/ trap w/o trap w/ trap
0.16% 0.05% 0.18% 0.35% 0.11% 0.26%
Median Area Variation
90 min 120 min 240 min
w/o trap w/ trap w/o trap w/ trap w/o trap w/ trap
13% 4% 8% 5% 3% 4%
Median Peak FWHM (seconds)
90 min 120 min 240 min
w/o trap w/ trap w/o trap w/ trap w/o trap w/ trap
11 11 15 16 26 28
Observed Peak Capacity
90 min 120 min 240 min
w/o trap w/ trap w/o trap w/ trap w/o trap w/ trap
514 546 577 676 581 620
Table 1: Summery of chromatographic performance values
Bruker Daltonik GmbH
Bremen · Germany Phone +49 (0)421-2205-0 Fax +49 (0)421-2205-103
Bruker Daltonics Inc.
Billerica, MA · USA Phone +1 (978) 663-3660 Fax +1 (978) 667-5993
For research use only. Not for use in diagnostic procedures.
References[1] Bruker App Note LC-MS 81Introducing New Proteomics Acquisition Strategies with the compact™ – Towards the Universal Proteomics Acquisition Method
[email protected] - www.bruker.com
Learn More
Bru
ker D
alto
nics
is c
ontin
ually
impr
ovin
g its
pro
duct
s an
d re
serv
es th
e rig
ht
to c
hang
e sp
ecifi
catio
ns w
ithou
t not
ice.
© B
ruke
r Dal
toni
cs 0
5-2
017,
LC
MS
-127
, 185
2686
You are looking for further Information? Check out the Link or scan the QR Code.
www.bruker.com/nanoelute-video