brunswick conference 2002
TRANSCRIPT
Alexander KorsikFirst Vice President
Brunswick UBS Warburg Conference 2002

Sibneft acquisition strategy as a key factor of sustained long
term growth
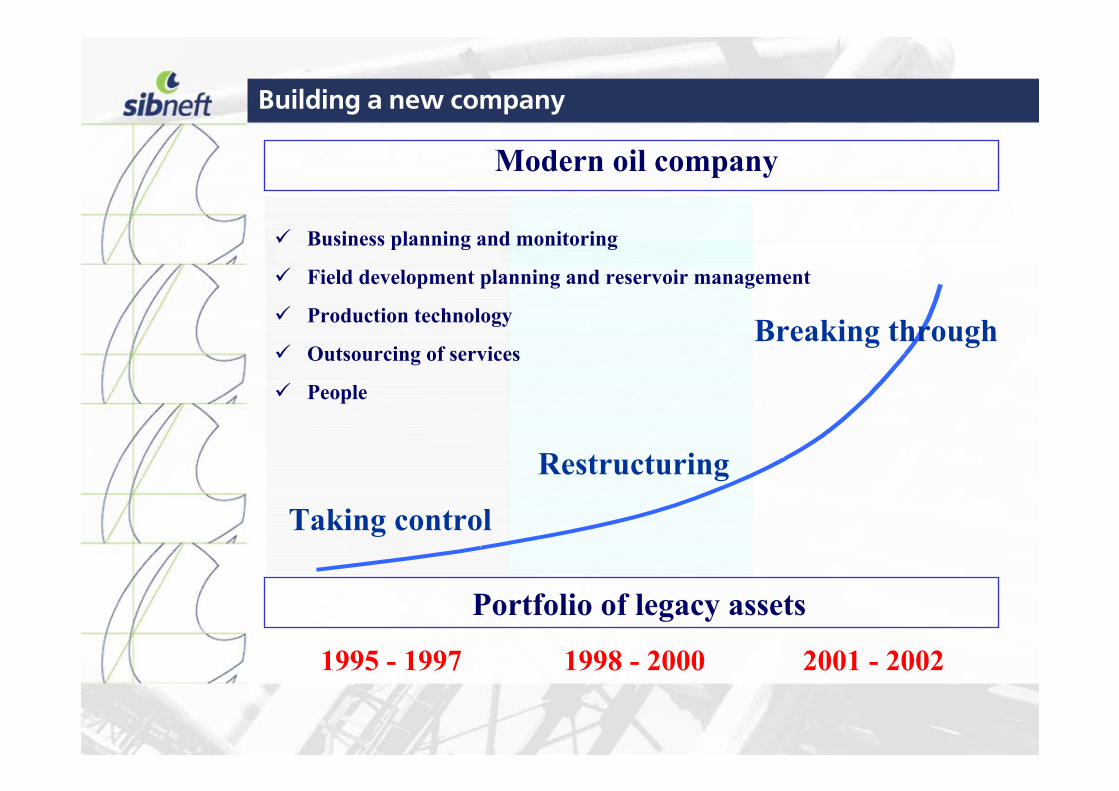
Building a new company
Modern oil company
Portfolio of legacy assets
1995 - 1997 1998 - 2000 2001 - 2002
Taking control
Restructuring
Breaking through
Business planning and monitoring
Field development planning and reservoir management
Production technology
Outsourcing of services
People

Production growth ahead of peers
Growth in output since January 2000 (%)
100
120
140
160
180
Jan
uar
y
Feb
ruar
y
Mar
ch
Ap
ril
May
Jun
e
July
Au
gu
st
Sep
tem
ber
Oct
ob
er
No
vem
ber
Dec
emb
er
Jan
uar
y
Feb
ruar
y
Mar
ch
Ap
ril
May
Jun
e
July
Au
gu
st
Sep
tem
ber
Oct
ob
er
No
vem
ber
Dec
emb
er
Jan
uar
y
Feb
ruar
y
Mar
ch
Ap
ril
May
Jun
e
July
Au
gu
st
Lukoil Surgut Yukos TNK SIBNEFT
%
2000 2001 2002

2001 EBITDA per ton ahead of peers
0
20
40
60
80
100
Sibneft YUKOS SurgutNG TNK LUKoil Tatneft

Sibneft strategy
World class returns
Potential of existing assets
New upstream assets
Refining capacity
Retail network
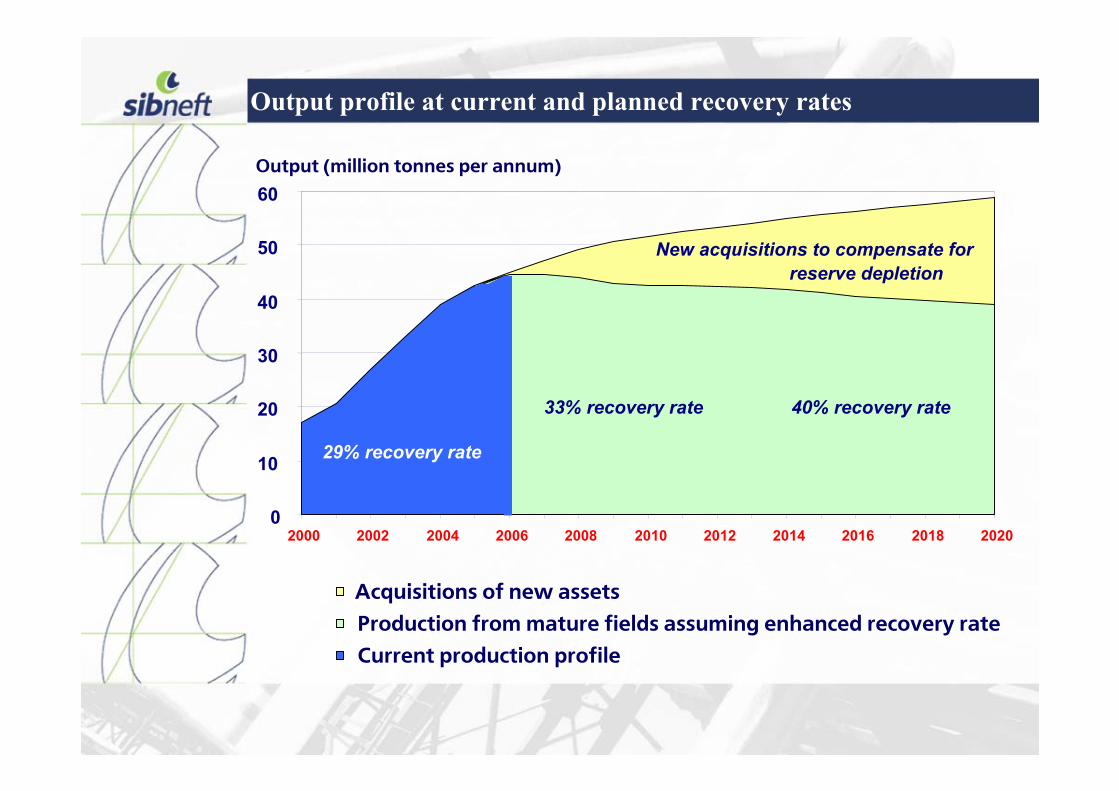
Output profile at current and planned recovery rates
0
10
20
30
40
50
60
2000 2002 2004 2006 2008 2010 2012 2014 2016 2018 2020
Acquisitions of new assetsProduction from mature fields assuming enhanced recovery rateCurrent production profile
33% recovery rate
New acquisitions to compensate for reserve depletion
40% recovery rate
29% recovery rate
Output (million tonnes per annum)

Sibneft upstream acquisitions 2000 - 2002
Orenburgneft
2001 – 50% stake in Sibneft-Yugra: Priobskoye and Palyanovskoye fields.
2002 – 67% stake in Meretoyahaneftegas: Meretoyahskoye field in “Noyabrsk region”.
2000 - 38% stake in Orenburgneft.
Slavneft Trust 2001 – 25% stake in Slavneft Trust.

New upstream acquisitions reserve addition
0 100 200 300 400 500 600 700 800
Sugmutskoye
Sutorminskoye
Vingapurovskoye
Sporishevskoye
Muravlenkovskoye
Vingayahinskoye
Sibneft-Yugra +Meretoyaha New 2001 upstream acquisitions
account for the 7-th biggest reserves group (in terms of Proved Reserves) of
Sibneft oil fields.

Future production growth, mln.tons. Acquisitions vs. old fields
0
10
20
30
40
50
2000 2001 2002 2003 2004 2005 2006 2007 2008 2009 2010
Old fields Sibneft-Yugra + Meretoyaha field
18%
82%
30%
70%
“New acquisitions of 2001 - 2002” will account for 18% in total production by 2005 and up to 30% by 2010.

Upstream acquisitions dilemma
In Russia or abroad ?
At what price?

Why do we go for Russian reserves – Finding Costs are low
(Exploration+Development)/ Reserves (extentions+discoveries+improved recovery+revaluation) - 5 years average, USD/ boe
0
1
2
3
4
5
6
7
8
9
USA Europe Canada Asia/ Pacific Middle East Russia
Russian Finding Costs are twice as low as the Finding Costs in the Persian Gulf

Why do we go for Russian reserves –Acquisition Costs are low
Acquisition Costs, USD/ boe - 5 year average
0
1
2
3
4
5
6
USA Europe Canada Asia/ Pacific Middle East Russia
Russian Reserve Acquisition costs are stil l about 10 times lower than the world
average

Sibneft upstream Acquisition Costs versus peers, USD/ boe
0
0,5
1
1,5
2
YUKOS (Arct
icgas)
Slavneft
(ObNGgeology)
LUKoil (B
itech
)LUKoil
(AmKomi)
TNK (Onaco
)
BP (Sidanco
)Sibneft
(Mere
toyaha)
Sibneft has low acquisition costs per
barrel of ABC1 Reserves

At what price ?
ReservesReservesReserves
Added value
Added value:FDP, Planning,
TechnologyPeople
Added value
Speculative value (high oil price)
Speculative value (high oil price) Upside for Sibneft
0
100
Company Y Sibneft Company X
we don't buy we buy!

Sibneft downstream acquisitions 2001
Moscow refinery characteristics:
Refining throughput – 9,8 mln.tons annually
Utilisation ratio – 91%
Depth of refining – 68%
In 2001 Sibneft acquired 37% in Moscow refinery. Currently Sibneft has a long term contract to deliver at least 350 thousand tons of crude a month to the refinery.
Central Federal Region, which includes Moscow and Moscow region,accounts for 20% of total fuel consumption in Russian Federation. Moscow share in this number is 45%. Moscow refinery is the second closest refinery to European exports markets.

Sibneft crude deliveries
Sibneft production growth will enable it to load Moscow refinery with its own crude. In 2002 Sibneft has about 14% of spare crude (net of export and Omsk refinery shipments) to supply to Moscow.
2001
Crude Exports
35%
Omsk Refinery
deliveries60%
Other deliveries
5%
2002
Crude Exports
36%
Omsk Refinery
deliveries50%
Other deliveries
14%
Due to the low direct production costs ($1.70 per barrel in 2001) Sibneft has a safe “transportation cushion” that will allow to transport crude directly from Noyabrsk and still to have competitive oil product prices on Moscow market.

Acquisition costs in downstream, USD per bbl.
0
3
6
9
12
LUKoil(Petrotel)
LUKoil(O dessa)
LUKoilNeftochim
LUKoil (Norsi) TNK(Lisichansk,
Ukraine)
YUKO S(Mazheikiu)
Sibneft(Moscow
Refinery)
USD/ Capacity USD/ Throughput

Competitive advantages of Moscow refinery acquisition
Was it expensive? Yes, it was value for money !
The last refinery for sale …
Good refinery for sale …
Excellent market …
Access to exports …
Bridgehead into St.Peterburg and Nizniy Novgorod and other European Russia markets ….
1300 – 30005500Sales per 1 station (cub.meters/ year)
1000 - 20003850Cars per 1 station
2000 - 4700
Europe
13150
Moscow
People per 1 station

Retail network growth
Sibneft acquired 20,5% of voting stock in Mosnefteprodukt. In 2002 Sibneft made acquisitions in Moscow, Tomsk and Krasnoyarsk retail businesses. We plan to add up more than 100 filling stations to the current 1125 stations by the end of 2002.
108 AZS 109 AZS 122 AZS
647 AZS732 AZS
824 AZS
1125 AZS
0
200
400
600
800
1000
1200
1996 1997 1998 1999 2000 2001 2002
own franchise+dealers
Currently 60% of light oil products are sold via own
regional marketing subsidiaries. 24% of gasoline is sold through
retail network.

Sibneft stations acquisition costs versus peers, th.USD per station
0
100
200
300
400
500
600
700
ANCAP (Arge
ntina)
Giant (U
SA)
OMV (Bulg
aria)
Genesis
(Lith
uania)
OK Petrole
um (S
weden)
Tesoro
Petrole
um (U
SA)
Parklan
d Indu
stries
(Cana
da)ENI (B
razil)
Kuwait
Petrole
um (It
aly)
Petron
as (Thai
land)
Sibnef
t (Russ
ia) min
/ max
Sibneft petrol stations acquisition costs in Russia are lower than
anywhere else in the world

Sibneft competitive position in retail products marketing
Since 1995 Sibneft added up 10 more oil product distribution companies.
Sibneft currently sells 25% of the products via marketing subsidiaries.
We control from 35% to 90% of the markets in the areas we operate.

How to maximize returns
RESERVOIR MANAGEMENT
PLANNING
TECHNOLOGIESOUTSOURCING OF SERVICES
PEOPLE