brunswick county data book county 2010 census tracts map 15 brunswick ... fastest growing counties...
TRANSCRIPT

The BRUNSWICK COUNTY
Data Book
—2017 EDITION—
Brunswick County Economic
Development & Planning
PO Box 249
Bolivia, NC 28422
910.253.2025 or 800.621.0609
www.brunswickcountync.gov


Table of Contents Historical and Genealogical Facts about Brunswick County 1
Fastest Growing North Carolina Counties 2
Demographic and Population Facts 3
Municipalities & Townships in Brunswick County Map 4
Townships in Brunswick County 5
Municipal Population in Brunswick County 6
Brunswick County Building Permit History 7
Brunswick County & North Carolina Business, Labor, and Employment Report 8
Brunswick County Tourism 9
Brunswick County Tourism Facts and Climate 10
Agriculture in Brunswick County 11
Census Data on Brunswick County Agriculture 12
Transportation, Schools, & Services Map 13
Brunswick County and City Tax Rates 14
Brunswick County 2010 Census Tracts Map 15
Brunswick County Government Complex

1
Historical and Genealogical Facts
Brunswick County was founded in 1764.
Brunswick County was formed out of New Hanover County and Bladen County.
Brunswick County was named after the Town of Brunswick, which was named in honor of King
George I, who was the Duke of Brunswick and Lunenburg.
Brunswick County is located in the southeastern part of North Carolina and is bounded by
the Atlantic Ocean, Cape Fear River, South Carolina, and Columbus, New Hanover, and
Pender counties.
The Town of Brunswick, established in 1745, was the original county seat.
In 1779, the county seat was moved to John Bell’s plantation, which was located near the
Lockwood Folly Bridge.
The Town of Walkersburg was established in 1784. The Town was named after John Walker, who
owned the property on which the town was established. A courthouse and other buildings for
public use were then built in Walkersburg.
In 1808, an act moved the courthouse from Lockwood Folly to Smithville.
The town of Smithville was established in 1792 and named for Benjamin Smith, who served as
Governor of North Carolina from 1810-1811.
In 1887 Smithville’s name was changed to Southport.
Southport was the county seat until 1977 when the county seat was moved to Bolivia.
Brunswick County ranks seventh in total land area out of 100 North Carolina Counties with 856
square miles of land.
With 19 municipalities, Brunswick County has more municipalities than any other of the 100
counties in North Carolina.
Sources: North Carolina Encyclopedia
http://statelibrary.dcr.state.nc.us/NC/COVER.HTM
Old Brunswick Town

2
Growth in Brunswick County
Sources: U.S. Census Bureau for 2000, 2010, 2015 website: www.census.gov
NC Office of State Planning website http://demog.state.nc.us
Fastest Growing Counties in North Carolina
Population Growth
County Pop. 2000
Pop. 2010
Pop. 2015 2000-2015
2010-2015
Pop. Increase
% Pop. Growth
Pop. Increase
% Pop. Growth
State Rank
Brunswick 73,141 107,431 122,765 49,624 67.85% 15,334 14.30% 1
Wake 627,865 901,021 1,024,198 396,333 63.12% 123,177 13.70% 2
Mecklenburg 695,427 919,628 1,034,070 338,643 48.69% 114,404 12.40% 3
Hoke 33,646 46,952 52,671 19,025 56.54% 5,719 12.20% 4
Harnett 91,062 114,678 128,140 37,078 40.72% 13,642 11.70% 5
Chatham 49,329 63,491 70,928 21,599 43.79% 7,437 11.70% 6
Durham 223,314 269,974 300,952 77,638 34.77% 30,978 11.50% 7
Union 123,738 201,307 222,742 99,004 80.01% 21,435 10.60% 8
Cabarrus 131,030 178,182 196,762 65,732 50.17% 18,580 10.40% 9
Pender 41,082 52,201 57,611 16,529 40.23% 5,410 10.40% 10
In 2015 Brunswick County was the 32nd fastest growing county in the United States

3
Demographic and Population Facts
Population Brunswick County North Carolina Population, 1990 50,985 6,632,448 Population, 2000 73,143 8,049,313 Population, 2010 107,431 9,535,483 Population, 2015 122,765 10,042,802 Population, percent change, 1990-2015 140.78% 51.42% Population, percent change, 2000-2015 67.84% 24.77% Population, percent change, 2010-2015 14.27% 5.32% Population projection 2020 137,032 10,574,718 Population projection 2030 167,945 11,609,883 Persons under 5 years old (2014) 4.90% 6.30% Persons under 18 years old (2014) 13.10% 17.10% Persons 65 years old and over (2014) 24.30% 13.80% Median age (2014) 49.2 37.8 Female persons (2014) 51.28% 51.30%
Ethnicity Brunswick County North Carolina
White (2014) 83.80% 69.60% Black or African American (2014) 10.90% 21.50% American Indian and Native Alaskan (2014) 0.40% 1.20% Asian (2014) 0.50% 2.40% Two or more races (2014) 2.20% 2.30% Hispanic or Latino (2014) 4.90% 8.70% White, not Hispanic (2014) 81.10% 64.60%
Education & Housing Brunswick County North Carolina
High School Graduates (2014) 86.40% 85.40% Persons with Bachelor's Degree or Higher (2014) 25.40% 27.80% Dropout rate, 2014-2015 3.82% 2.28% Graduation rate, 2014-2015 (four-year cohort) 83.20% 85.60% Housing units (2015) 83,080 4,490,948 Homeownership rate, 2010-2014 75.30% 65.80% Households (2014) 48,331 3,742,514 Persons per household (2014) 2.32 2.54
Income, Health & Poverty Brunswick County North Carolina
Median household income (2014) $46,955 $46,693 Persons below poverty (2014) 16.30% 17.60% Elderly poverty rate (2014) 6.10% 9.90% Child poverty rate (2014) 27.70% 25% Infant mortality rate (2014) 3.60% 7.10% Percent uninsured (2014) 15.40% 15.50%
Geography & Land Brunswick County North Carolina
Land area (square miles) 847 48,618 Persons per square mile (2010) 126.8 196.1 Metropolitan Area Myrtle Beach, SC
Sources: U.S. Census Bureau: www.census.gov State Center for Health Statistics
NC Office of State Planning: http://demog.state.nc.us NC Department of Public Instruction (ncpublicschools.org)
Dept. of Housing and Urban Development: www.hud.gov

4

5
Townships in Brunswick County
Township Pop. 2000 Pop. 2010 Pop. 2014 2000-2014 Growth
2010-2014 Growth
Lockwood Folly (LF) 16,100 23,248 23,802 49% 2%
Northwest (NW) 9,319 12,190 13,390 44% 10%
Shallotte (SH) 18,420 26,545 27,508 49% 4%
Smithville (SM) 12,019 14,467 14,224 18% 2%
Town Creek (TC) 14,426 27,533 30,376 111% 10%
Waccamaw (WC) 2,859 3,448 3,607 26% 5%
Source: U.S. Census Bureau 2014 Estimates
www.Census.gov
Township Population (2014) Median Age Average Household Size
Lockwood Folly (LF) 23,802 53.7 2.23
Northwest (NW) 13,390 37.6 2.84
Shallotte (SH) 27,508 58.9 2.13
Smithville (SM) 14,224 52.9 2.08
Town Creek (TC) 30,376 40.5 2.44
Waccamaw (WC) 3,607 32.4 3.04
Township Race
White Black or African
American
American Indian and
Alaska Native
Asian Native Hawaiian and Other Pacific
Islander
Some Other Race
Two or More Races
Lockwood Folly (LF)
20,049 2,612 68 136 128 265 544
Northwest (NW)
9,240 2,498 54 36 321 580 661
Shallotte (SH)
24,497 2,517 58 94 10 159 173
Smithville (SM)
13,082 645 21 40 0 131 305
Town Creek (TC)
24,598 3,820 189 304 0 804 661
Waccamaw (WC)
3,183 181 29 0 0 76 138
6
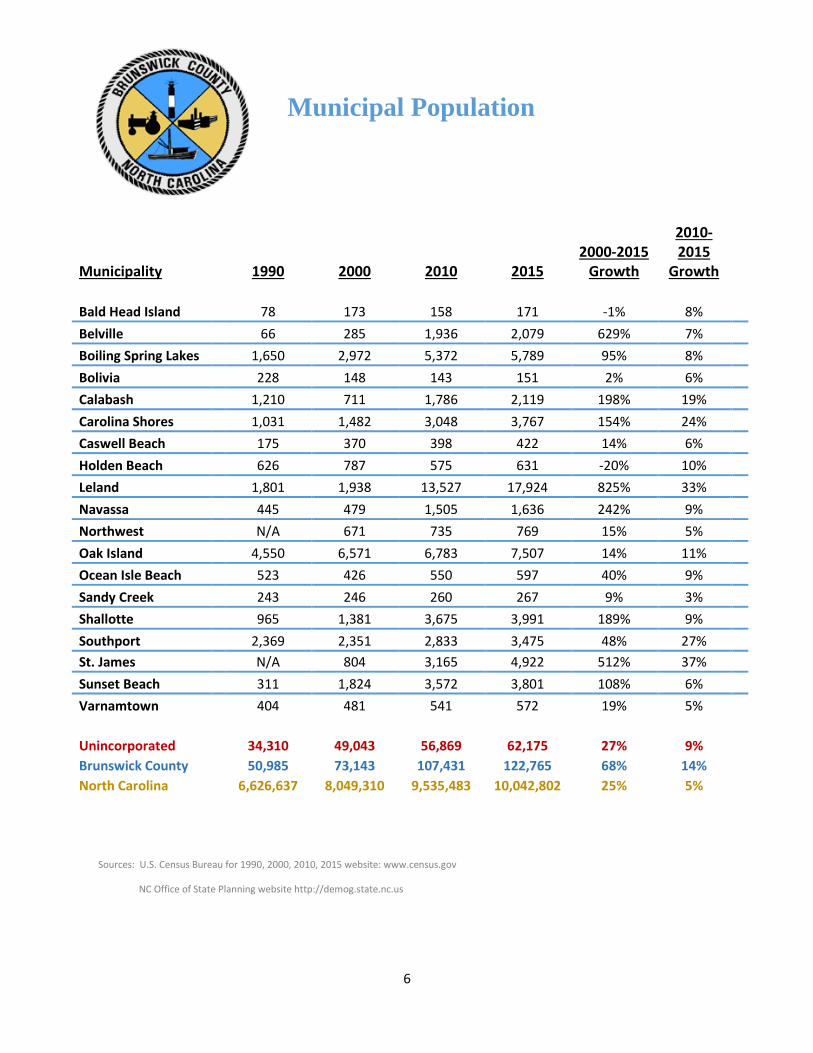
Municipal Population
Municipality 1990 2000 2010 2015 2000-2015
Growth
2010-2015
Growth
Bald Head Island 78 173 158 171 -1% 8%
Belville 66 285 1,936 2,079 629% 7%
Boiling Spring Lakes 1,650 2,972 5,372 5,789 95% 8%
Bolivia 228 148 143 151 2% 6%
Calabash 1,210 711 1,786 2,119 198% 19%
Carolina Shores 1,031 1,482 3,048 3,767 154% 24%
Caswell Beach 175 370 398 422 14% 6%
Holden Beach 626 787 575 631 -20% 10%
Leland 1,801 1,938 13,527 17,924 825% 33%
Navassa 445 479 1,505 1,636 242% 9%
Northwest N/A 671 735 769 15% 5%
Oak Island 4,550 6,571 6,783 7,507 14% 11%
Ocean Isle Beach 523 426 550 597 40% 9%
Sandy Creek 243 246 260 267 9% 3%
Shallotte 965 1,381 3,675 3,991 189% 9%
Southport 2,369 2,351 2,833 3,475 48% 27%
St. James N/A 804 3,165 4,922 512% 37%
Sunset Beach 311 1,824 3,572 3,801 108% 6%
Varnamtown 404 481 541 572 19% 5%
Unincorporated 34,310 49,043 56,869 62,175 27% 9%
Brunswick County 50,985 73,143 107,431 122,765 68% 14%
North Carolina 6,626,637 8,049,310 9,535,483 10,042,802 25% 5%
Sources: U.S. Census Bureau for 1990, 2000, 2010, 2015 website: www.census.gov
NC Office of State Planning website http://demog.state.nc.us

7
Brunswick County Building Permit History
*Data is for Brunswick County issued permits and participating municipalities, which is subject to change year-to-year
Source: apps.brunsco.net/inspectionreports
0
500
1000
1500
2000
2500
3000
2000 2001 2002 2003 2004 2005 2006 2007 2008 2009 2010 2011 2012 2013 2014 2015
Buiding Permit Data
Single-Family Residential Mobile Home Commercial
Calendar Year Single-Family
Residential Mobile Home Commercial Total
2000 811 1,036 184 2,031
2001 819 729 146 1,694
2002 1,004 701 187 1,892
2003 1,181 625 361 2,167
2004 1,435 534 277 2,246
2005 1,870 611 227 2,708
2006 1,637 552 208 2,397
2007 843 378 278 1,499
2008 575 187 204 966
2009 416 141 97 654
2010 492 142 120 754
2011 504 112 102 718
2012 661 118 140 919
2013 981 161 109 1,251
2014 1,191 122 202 1,515
2015 1,287 137 281 1,705
Total 16,205 6,360 3,229 25,794

8
Business, Labor and Employment Report
Source: U.S. Census Bureau: www.census.gov
US Dept. of Labor Bureau of Labor Statistics
Business, Labor and Employment Facts Brunswick County North Carolina
Employment Total, 2015 29,370 4,247,050
Number of Establishments, 2015 2,654 270,100
Private non-farm establishments, 2014 2,298 219,897
Private non-farm employment, 2014 23,815 3,560,448
Private non-farm employment, percent change, 2005-2014 13.55% 4.41%
Non-employer establishments, 2014 9,993 706,538
Establishments with no employees, 2012 8,157 650,211
Very small establishments (1-9 employees), 2014 1,771 158,655
Very large establishments (100+ employees), 2014 28 5,050
Accommodation and food services employment, percent, 2014 14.47% 10.67%
Arts, entertainment, and recreation employment, percent, 2014 5.53% 1.69%
Construction employment, percent, 2014 7.19% 4.72%
Education employment, percent, 2014 1.33% 3%
Health Care employment, percent, 2014 16.56% 15.74%
Information and Financial Activities employment, percent, 2014 4.69% 7.10%
Manufacturing employment, percent, 2014 5.91% 11.46%
Professional and Business services employment, percent, 2014 2.94% 8.31%
Public Administration employment, percent, 2014 5.87% 9.98%
Retail Sales, 2012 $1,562,199,000 $125,569,566,000
Retail sales per capita, 2012 $14,475 $13,157
Civilian Labor Force, 2015 51,380 4,776,963
Unemployment Rate, 2016, June 5.8% 5. 2%
Announced Job Creation, 2015 15 N/A

9
Tourism in Brunswick County
Source: NC Department of Commerce www.nccommerce.com
State Tourism Revenue Rankings 2013
Source: NC Department of Commerce: www.nccommerce.com
County Revenue
$(millions)
Revenue per Capita
% Distribution in State
State Rank 2013
2013 Population
Mecklenburg 4,610.04 $4,867.35 22.35% 1 947,135
Wake 1,883.01 $2,026.45 9.22% 2 929,214
Guilford 1,206.74 $2,436.25 5.93% 3 495,326
Dare 953.04 $27,794.30 4.76% 4 34,289
Buncombe 901.28 $3,727.36 4.25% 5 241,801
Forsythe 753.77 $2,125.36 3.74% 6 354,656
Durham 657.17 $2,376.80 3.21% 7 276,494
New Hanover 477.68 $2,314.31 2.44% 8 206,403
Cumberland 471.99 $1,465.66 2.31% 9 322,033
Brunswick 470.58 $4,265.44 2.27% 10 110,324
Moore 409.97 $4,584.51 2.03% 11 89,425
Cabarrus 371.87 $2,049.83 1.85% 12 181,415
North Carolina 20,218.68 $2,094.90 ---- ---- 9,651,380
-10.00%
-5.00%
0.00%
5.00%
10.00%
15.00%
20.00%
$0.00
$50.00
$100.00
$150.00
$200.00
$250.00
$300.00
$350.00
$400.00
$450.00
$500.00
$ M
illio
ns
Annual Brunswick County Tourism Revenue
Annual Revenue Change From Previous Year

10
Tourism Facts and Climate
Peak season population is estimated to be 2.6 times Brunswick County total year-round population.
In 2013, Brunswick County ranked 10th in travel impact among North Carolina’s 100 counties.
Domestic Tourism in Brunswick County generated an economic impact of $470,580,000 in 2013 alone.This was a 5.73% increase from 2012 and a 93.25% increase from 2000.
Tourism Revenue for Brunswick County increased by $227,070,000 from 2000 to 2013.
More than 4,670 jobs in Brunswick County were directly attributable to travel and tourism.
Travel generated an $85,710,000 payroll in 2013.
State and local tax revenues from travel to Brunswick County amounted to $49,620,000. This represents a$430.35 tax saving to each county resident.
There are 6 resort beaches located in Brunswick County: Bald Head Island, Caswell Beach, Holden Beach,Oak Island, Ocean Isle Beach, and Sunset Beach.
Area attractions include historic Southport, Old Brunswick Town, Bald Head and Oak Island Lighthouses,Ingram Planetarium, Museum of Coastal Carolina, Silver Coast Winery, Fort Caswell, Calabash seafood, andvarious parks and preserves, boat ramps/access sites, and over 30 golf courses scattered throughoutBrunswick County.
Source: NC Department of Commerce: www.nccommerce.com
Climate Summary
Brunswick county enjoys a mild, marine-influenced climate. During the summer, sea breeze-induced clouds
normally develop in the late moring and move inland during the day. Thunderstorms are not uncommon,
with an average of 9 reported storms per year causing damging winds and/or dropping hail. Records show
the #1 weather hazard is hurricanes and associated wind, storm surge, and rainwater flooding.
Temperature Normals
Precipitation Normals
Source: National Weather Service
Jan. Feb. Mar. Apr. May Jun. Jul. Aug. Sep. Oct. Nov. Dec. Annual
High 55.9 59.5 66.5 74.3 81.3 87.1 90 88.7 83.9 75.7 67.9 58.6 74.1
Low 32.6 35.2 40.8 48.2 57 66.1 70 68.8 62.5 51.1 42.3 34.6 50.8
Mean 44.4 47.4 53.8 61.3 69.2 76.7 80.2 78.9 73.3 63.4 55.1 46.6 62.5
Jan. Feb. Mar. Apr. May Jun. Jul. Aug. Sep. Oct. Nov. Dec. Annual
Total 4.23" 3.43" 4.12" 3.05" 3.88" 4.59" 6.16" 6.88" 7.12" 3.98" 2.88" 3.42" 53.74"

11
Agriculture in Brunswick County
Historically, Brunswick County’s economy and culture has been centered around agriculture. Even after decades of rapid residential and commercial growth, agriculture continues to have a strong influence on the economy and culture in Brunswick County. Agriculture in Brunswick County is very diverse from the cultivation of crops and timber to aquaculture and seafood.
Brunswick County Agriculture Facts
1st in Tomatoes in NC 80,000 hogs and pigs raised in Brunswick County in 2014 Ranked 19th in NC for number of hogs and pigs raised in 2014 Cash receipts from Agriculture and Government Payments totaled $55,490,646 in 2014 559,592 acres of forest lands 27,489 acres of farmland were protected and enrolled in the County’s Voluntary Agriculture
District (VAD) Program in 2013. In 2013 there were 190 farms enrolled in the program, a 4% increase (7 new farms) from 2012.
Sources: 2012 Census of Agriculture North Carolina Department of Agriculture and Consumer Services Brunswick County Voluntary Agricultural District 2013 Annual Report North Carolina Forest Service
Soybean40%
Corn33%
Wheat18%
Hay5%
Tobacco4%
Distribution of Top Harvested Crops in Brunswick County
Soybean Corn Wheat Hay Tobacco
12
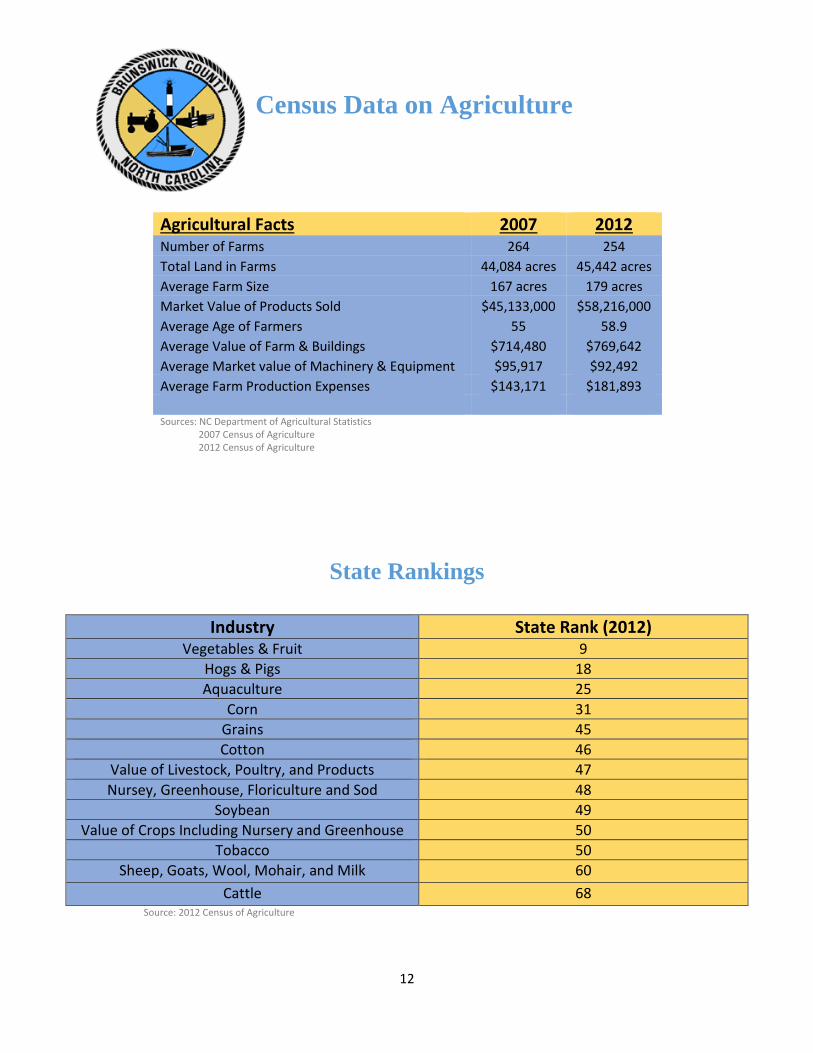
Census Data on Agriculture
Agricultural Facts 2007 2012 Number of Farms 264 254
Total Land in Farms 44,084 acres 45,442 acres
Average Farm Size 167 acres 179 acres
Market Value of Products Sold $45,133,000 $58,216,000
Average Age of Farmers 55 58.9
Average Value of Farm & Buildings $714,480 $769,642
Average Market value of Machinery & Equipment $95,917 $92,492
Average Farm Production Expenses $143,171 $181,893
Sources: NC Department of Agricultural Statistics 2007 Census of Agriculture 2012 Census of Agriculture
State Rankings
Industry State Rank (2012) Vegetables & Fruit 9
Hogs & Pigs 18
Aquaculture 25
Corn 31
Grains 45
Cotton 46
Value of Livestock, Poultry, and Products 47
Nursey, Greenhouse, Floriculture and Sod 48
Soybean 49
Value of Crops Including Nursery and Greenhouse 50
Tobacco 50
Sheep, Goats, Wool, Mohair, and Milk 60
Cattle 68 Source: 2012 Census of Agriculture

13

14
Brunswick County & City Tax Rates
Code 2005 2006 2007 2008 2009 2010 2011 2012 2013 2014 2015 2016
Brunswick County 0.54 0.54 0.305 0.305 0.305 0.305 0.4425 0.4425 0.4425 0.4425 0.485 0.485
Smithville Township 0.04 0.04 0.04 0.04 0.04 0.04 0.04 0.04 0.04 0.04 0.04 0.04
Bald Head Island 17 0.465 0.465 0.24 0.26 0.27 0.3275 0.591 0.591 0.59 0.59 0.6663 0.6663
Belville 25 0.15 0.15 0.0911 0.0911 0.0911 0.0683 0.0683 0.0683 0.0683 0.0683 0.0683 0.09
BoilingSprings Lakes 20 0.25 0.25 0.12 0.12 0.12 0.12 0.17 0.17 0.14 0.17 0.21 0.21
Bolivia 23 0.06 0.06 0.05 0.05 0.05 0.05 0.05 0.05 0.05 0.05 0.05 0.05
Calabash 19 0.1 0.1 0.07 0.07 0.07 0.07 0.0875 0.0875 0.0875 0.0875 0.0875 0.0875
Carolina Shores 18 0.08 0.08 0.08 0.08 0.08 0.08 0.1016 0.1016 0.1016 0.1016 0.1016 0.1016
Caswell Beach 16 0.21 0.22 0.11 0.15 0.13 0.13 0.17 0.17 0.17 0.17 0.22 0.22
Holden Beach 13 0.18 0.18 0.069 0.069 0.069 0.069 0.127 0.127 0.127 0.127 0.15 0.22
Leland 31 0.18 0.18 0.1166 0.1166 0.1166 0.1166 0.1515 0.1515 0.1515 0.1515 0.1515 0.1833
Navassa 24 0.27 0.27 0.2 0.2 0.2 0.2 0.2 0.2 0.2 0.2 0.2 N/A
Northwest 28 0.2 0.2 0.15 0.17 0.17 0.19 0.21 0.21 0.22 0.22 0.24 0.24
Oak Island 14 0.33 0.33 0.1245 0.14 0.14 0.155 0.275 0.275 0.275 0.275 0.275 0.29
Ocean Isle Beach 12 0.14 0.14 0.08 0.09 0.09 0.09 0.13 0.13 0.155 0.155 0.1875 0.1875
Sandy Creek 26 0.35 0.35 0.3 0.3 0.3 0.3 0.3 0.3 0.3 0.3 0.3 0.25
Shallotte 22 0.32 0.32 0.27 0.27 0.27 0.27 0.35 0.35 0.35 0.35 0.35 0.35
Southport 21 0.27 0.27 0.15 0.18 0.18 0.18 0.2456 0.2456 0.2456 0.2456 0.2456 0.2456
St. James 29 0.05 0.05 0.05 0.05 0.05 0.05 0.05 0.05 0.05 0.05 0.05 0.05
Sunset Beach 11 0.13 0.145 0.115 0.09 0.09 0.09 0.105 0.105 0.105 0.105 0.16 0.16
Varnamtown 27 0.05 0.05 0.05 0.05 0.05 0.05 0.05 0.05 0.05 0.05 0.05 0.05
BHI MSD ZONE A 33 - 0 - - 0 - - 0 - - 0 - 0.31 0.3825 0.6718 0.6718 0.6708 0.6708 0.7471 0.7471
BHI MSD ZONE B 34 - 0 - - 0 - - 0 - - 0 - 0.29 0.3625 0.6416 0.6416 0.6406 0.6406 0.7169 0.7169

15