bse limited national stock exchange of india limited · 2. disclaimer. important disclaimer this...
TRANSCRIPT
March 8, 2018
BSE Limited
Floor 25, P. J. Towers
Dalal Street,
Mumbai - 400 001
National Stock Exchange of India Limited
Exchange Plaza
Bandra Kurla Complex
Bandra (E)
Mumbai - 400 051
Dear Sirs,
Sub.: Intimation of participation in 10th Goldman Sachs India
Pharma and Healthcare Tour on March 9, 2018
Pursuant to the provisions of Regulation 30 of the Securities and Exchange Board of India (Listing
Obligations and Disclosure Requirements) Regulations, 2015, we would like to inform you that the
management of the Company is participating in the 10th Goldman Sachs India Pharma and Healthcare
Tour on March 9, 2018 in the National Capital Region, India. We enclose details of investor/analyst
meetings scheduled for the same.
The schedule may undergo change due to exigencies on the part of Investors/Analysts/ Company.
We also enclose the presentation to be used during the meetings.
This is for your kind information and records.
Thanking you,
Yours faithfully,
For Jubilant Life Sciences Limited
Rajiv Shah
Company Secretary
Encl.: as above

Investor/Analyst meeting scheduled on 9th March, 2018
Meeting Date Type of Meeting
Name of fund/firm Location
Friday, 9th March 2018 Group Meeting
1. Aberdeen Standard2. ICICI Prudential3. Orbimed Advisors4. Canopy Group5. White Oak Capital
Management6. Goldman Sachs
National Capital Region
January 2018
Jubilant Life Sciences Limited

2
Disclaimer
Important Disclaimer
This presentation (the “Presentation”, or the “document”) has been prepared by Jubilant Life Sciences Limited (the “Company”) for the recipient for the purpose of providing information on the Company. The contents
of this Presentation are confidential and strictly for use by the recipient only. The Presentation shall not, in whole or in part, be disclosed without prior written consent of the Company. This Presentation must not be
copied, reproduced, distributed, or otherwise disclosed or passed on to others, in whole or in part, by any means, in any form under any circumstances whatsoever at any time hereafter. The recipient agrees to keep
confidential any information contained herein and any other written or oral information otherwise made available in connection with the Company. In furnishing this document, neither the Company, nor its associates
and affiliates, nor any of their respective officers, directors, advisors, undertake any obligation to provide to the recipient (a) access to any additional information or to update this document, or (b) to correct any
inaccuracies therein which may or may not become apparent.
This Presentation may contain statements about events and expectations that may be “forward-looking”, including statements relating to future status, events, prospects or circumstances, including but not limited to
statements about plans and objectives, outlook, the progress and results of research and development, potential product characteristics and uses, product sales potential and target dates for product launch are
forward-looking statements based on estimates and the anticipated effects of future events on current and developing circumstances. Such statements are subject to numerous risks and uncertainties and are not
necessarily predictive of future results. Actual results may differ materially from these forward-looking statements due to number of risks and uncertainties, including future changes or developments in the Company’s
business, its competitive environment, its ability to implement its strategies and initiatives, respond to industry changes and the political, economic, regulatory and social conditions in India. The Company may, from
time to time, make additional written and oral forward looking statements, including statements contained in the company’s filings with the regulatory bodies and our reports to shareholders. The Company assumes no
obligation to update forward-looking statements to reflect actual results, changed assumptions or other factors.
This Presentation does not constitute a prospectus, offering circular or offering memorandum or an offer invitation or a solicitation of any offer to purchase or sell, any securities of the Company, and should not be
considered or construed in any manner whatsoever as a recommendation that any person should subscribe for or purchase any of Company's securities. None of the projections, expectations, estimates or prospects
in this Presentation should be construed as a forecast implying any indicative assurance or guarantee of future performance, nor that the assumptions on which such future projections, expectations, estimates, or
prospects have been prepared are complete or comprehensive.
This Presentation utilizes information which has not been independently verified (including by opinion, anecdote and speculation) and which has been sourced from a variety of public sources and third parties. Neither
the Company, nor its associates and affiliates, nor any of their respective officers, directors, advisors, makes any representation or warranty (expressly or impliedly) as to the accuracy, adequacy or completeness of
this document or its contents or of any other oral or written information furnished or made available. The Company disclaim to the extent possible by law, all responsibility in relation to this Presentation.
This Presentation, is not a recommendation to invest, is not an investment advice, and, is prepared to provide background information for investors in relation to the Company. This Presentation does not purport to
contain all information investors may require to evaluate an investment in the Company. In preparing the Presentation, the Company have not taken into account the particular investment objectives, financial situation
or particular needs of investors. Before making an investment decision, an investor should independently consider whether an investment in the Company is appropriate in light of its particular investment needs,
objectives and financial circumstances. An investor should conduct its own independent investigations, due diligence and analysis of the potential benefits and risks of any investment in the Company. An investor
should seek professional advice, including tax advice before making an investment decision.
The distribution of this Presentation in or from certain jurisdictions may be restricted or prohibited by law. Recipients are required to inform themselves of, and comply with, all restrictions or prohibitions in such
jurisdictions. Neither the Company nor any other person shall have any liability to any person in relation to the distribution or possession of this document or copies thereof in or from any jurisdiction where the
distribution of such a document is prohibited or requires special authorisation or any regulatory consent or approval. By accepting this document the recipient has agreed, upon request, to return promptly all material
received from the Company without retaining any copies.
By accepting this Presentation, the recipient agrees that this Presentation is strictly confidential and shall not be copied, published, distributed or transmitted to any person, in whole or in part, by any means, in any
form under any circumstances whatsoever and that the recipient has further agreed, upon request, to return promptly all material received from the Company without retaining any copies. The recipient further
represents and warrants that it is lawfully able to receive this Presentation under the laws of the jurisdiction in which it is located and / or any other applicable laws, and that it will not reproduce, publish, disclose,
redistribute or transmit this Presentation.
NOTES
1. The numbers for the quarter have been reclassified and regrouped wherever necessary
2. Closing Exchange Rate for USD 1 at Rs. 66.25 as on March 31’16 & Rs. 64.85 as on March 31’17; Rs. 67.93 as on December 31’16 & Rs. 63.88 as on December 31’17
3. The Exchange fluctuation on long term forex loans in Indian books have been amortized over the tenure of the loan period as recommended under Indian Accounting Standards
4. Financial numbers upto FY 2015 are as per erstwhile Indian Generally Accepted Accounting Principles (I-GAAP), whereas for FY 2016 onwards, it is as per Indian Accounting Standards (Ind-AS)

Jubilant Life Sciences At a Glance
3
Global integrated pharma and life sciences solutions provider with
a track record of 39 years
Strategic presence in lnjectables with USFDA approved
Manufacturing facilities in North America
Strong positions in products across niche businesses such as
Radiopharmaceuticals/Allergy Therapy Products
Expertise in Chemistry and manufacturing spans across over three
decades of experience
4 USFDA approved manufacturing facilities in North America and 2
USFDA approved manufacturing facilities in India
5 state-of-the-art Life Sciences Ingredients manufacturing facilities in
India
Employs around 7,600 people globally, including around 2,200 in
North America and around 1,100 dedicated to R&D
30.8 31.4 28.8 27.1 23.6
25.4 25.6 28.9 31.227.8
1.8 1.2 1.3 1.81.3
0.0
10.0
20.0
30.0
40.0
50.0
60.0
70.0
FY 14 FY 15 FY 16 FY 17 9M'FY18
Revenue (INR bn)
Life Science Ingredients Pharmaceuticals Drug Discovery Solutions
4.8 3.2 4.3 4.34.5
6.0
4.58.9 9.8 7.1
-2.0
0.0
2.0
4.0
6.0
8.0
10.0
12.0
14.0
16.0
FY 14 FY 15 FY 16 FY17 9M'FY18
Business EBITDA (INR bn)
Life Science Ingredients Pharmaceuticals Drug Discovery Solutions
Financial numbers upto FY 2015 are as per erstwhile Indian Generally Accepted Accounting Principles
(I-GAAP), whereas for FY 2016 onwards, it is as per Indian Accounting Standards (Ind-AS)

Specialty Pharma -
Injectables28%
Generics24%
Specialty Intermediates and Nutritional
Products23%
Life Sciences Chemicals
22%
Drug Discovery Solutions3%
4
Jubilant Life Sciences Overview
Pharmaceuticals Life Science Ingredients
Specialty Intermediates and Nutritional
Products
Life Sciences Chemicals
Generics
Solid Dosage Formulations
Active Pharmaceutical Ingredients
India Branded Pharmaceuticals
Specialty Pharmaceuticals - Injectables
Radiopharmaceuticals
CMO of Sterile Injectables
Allergy Therapy Products
FY17 Revenue Mix by Segment
India29%
USA & Canada41%
Europe & Japan19%
China and ROW11%
FY17 Revenue Contribution by Region FY17 EBITDA Mix by Segment
Pharmaceuticals
68%
Life Science
Ingredients30%
Drug Discovery Solutions
2%
Drug Discovery
Solutions

5
Key Credit Strengths
Global Competitive Edge Due to Low Cost and Vertical Integration1
Strong Leadership in Key Products and Markets 2
De-risked Business Model With Diverse Sources of Revenue 3
Strong Pipeline of Products with Deep R&D Capabilities4
High-Quality, World –Class, Low Cost Manufacturing Footprint5
Experienced Management team with high standards of corporate governance6
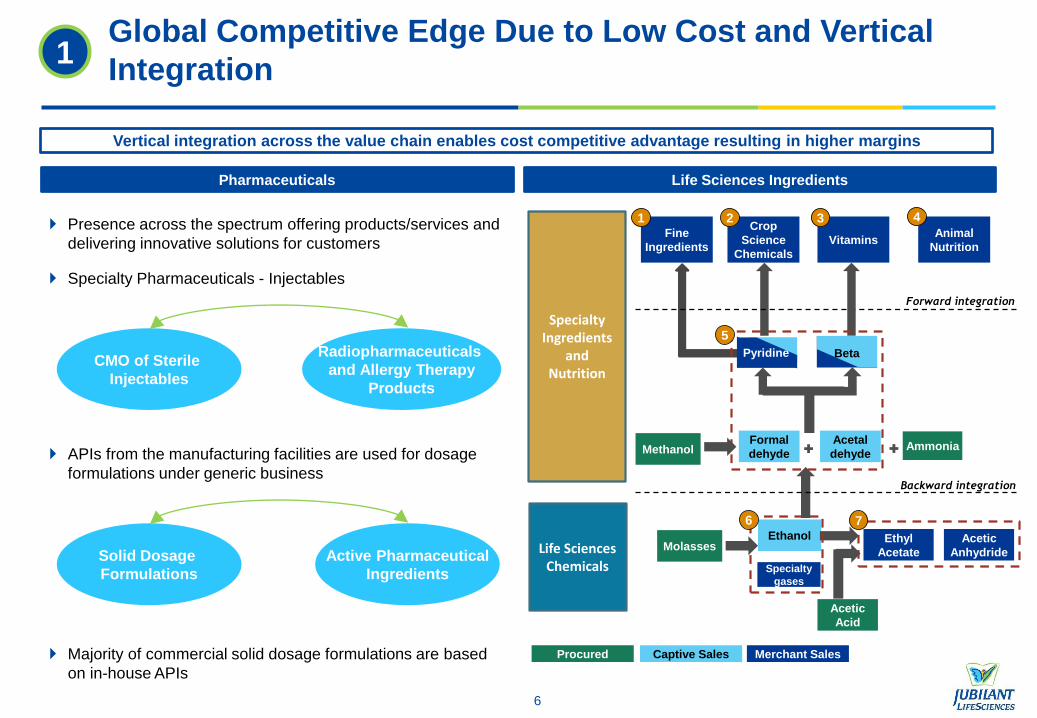
Global Competitive Edge Due to Low Cost and Vertical
Integration
6
Presence across the spectrum offering products/services and
delivering innovative solutions for customers
Specialty Pharmaceuticals - Injectables
APIs from the manufacturing facilities are used for dosage
formulations under generic business
Pharmaceuticals Life Sciences Ingredients
Vertical integration across the value chain enables cost competitive advantage resulting in higher margins
Majority of commercial solid dosage formulations are based
on in-house APIs
CMO of Sterile
Injectables
Radiopharmaceuticals
and Allergy Therapy
Products
Solid Dosage
Formulations
Active Pharmaceutical
Ingredients
1
Procured Captive Sales Merchant Sales
Specialty Ingredients
andNutrition
Animal
NutritionVitamins
Fine
Ingredients
Crop
Science
Chemicals
Forward integration
Ethanol
Acetic
Acid
Acetic
Anhydride
Ethyl
AcetateLife Sciences Chemicals
2
Specialty
gases
1
MethanolFormal
dehyde
Acetal
dehydeAmmonia
Backward integration
Pyridine Beta
3
Molasses
4
7
5
6

7
Leadership Position in Key Products…
Specialty
Pharmaceuticals -
Injectables
Leader in Radiopharmaceutical products such as MAA, DTPA and I-131
Ranked in top 5 Contract Manufacturers in North America for sterile injectables
Leading supplier in North America for Allergy Therapy Products
Generics
US leadership positions in certain Solid Dosage Formulations products in CVS (Terazosin), CNS
(Prochlorperazine) and Methylprednisolone
Global leadership positions in certain key API products in CVS (Valsartan, Irbesartan) and CNS
(Oxcarbazepine, Carbamazepine, Tramadol, Donepezil)
2
Speciality
Intermediates and
Nutritional Products
Global leadership position in Pyridines & derivatives
Second largest producer globally in Vitamin B3
Life Science Chemicals Globally #4 in Acetic Anhydride (Merchant Sales)
Globally #7 in Ethyl Acetate
Pharmaceuticals
Life Sciences Ingredients
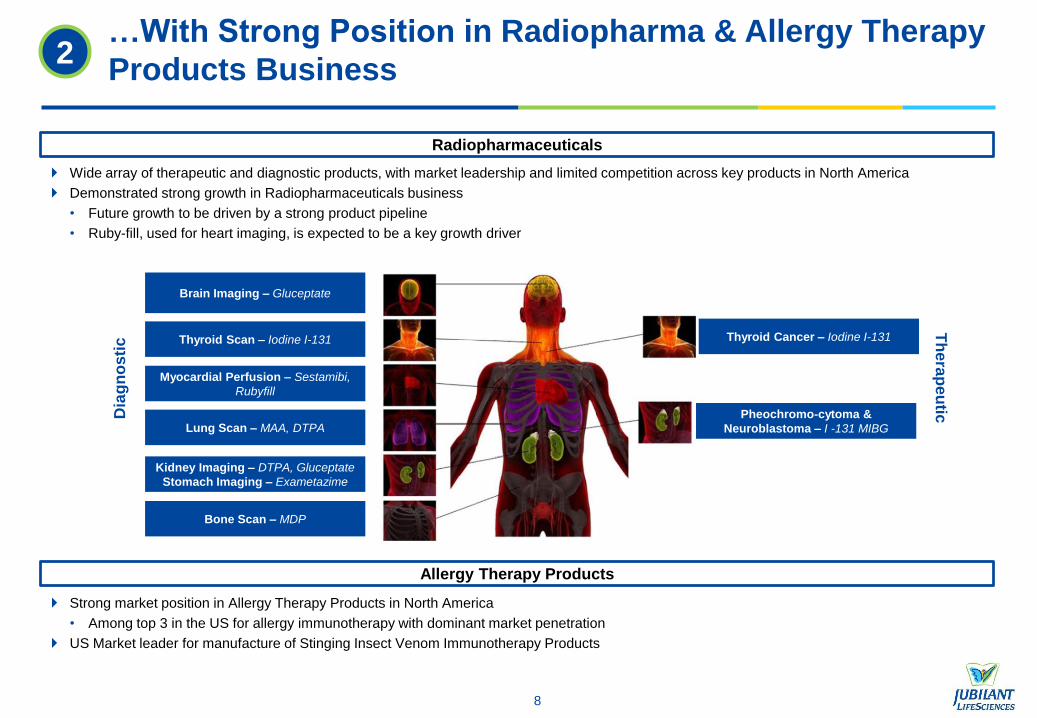
…With Strong Position in Radiopharma & Allergy Therapy
Products Business
8
2
Radiopharmaceuticals
Wide array of therapeutic and diagnostic products, with market leadership and limited competition across key products in North America
Demonstrated strong growth in Radiopharmaceuticals business
• Future growth to be driven by a strong product pipeline
• Ruby-fill, used for heart imaging, is expected to be a key growth driver
Allergy Therapy Products
Strong market position in Allergy Therapy Products in North America
• Among top 3 in the US for allergy immunotherapy with dominant market penetration
US Market leader for manufacture of Stinging Insect Venom Immunotherapy Products
Brain Imaging – Gluceptate
Thyroid Scan – Iodine I-131
Myocardial Perfusion – Sestamibi,
Rubyfill
Lung Scan – MAA, DTPA
Kidney Imaging – DTPA, Gluceptate
Stomach Imaging – Exametazime
Bone Scan – MDP
Th
era
pe
utic
Thyroid Cancer – Iodine I-131
Pheochromo-cytoma &
Neuroblastoma – I -131 MIBG
Dia
gn
osti
c

India29%
USA & Canada41%
Europe & Japan19%
China and ROW11%
Top 10 Customers
22%
Rest of the Customers
78%
De-risked Business Model With Diverse Sources of
Revenue
No Concentration Risk
Business: Specialty
Pharmaceuticals – Injectables is
the largest segment and accounts
for 28% of FY17 Revenue
Customers: Top 10 customers
account for 22% of FY17
Revenue
Products: Top 10 products
account for 47% of FY17
Revenue
Geography: 71% of FY17
Revenue from international
markets with products & services
reaching over 100 countries
9
Top 10 Products
47%
Rest of the Products
53%
3
FY17 Revenue Mix by Segment FY17 Revenue Contribution of Top 10 Customers
FY17 Revenue Contribution of Top 10 Products FY17 Revenue Contribution by Region
Specialty Pharmaceutic
als -Injectables
28%
Generics24%
Life Sciences Chemicals
22%
Specilaty Intermediates and
Nutritional Products 23%
Drug Discovery Solutions
3%
De-risked business model
Presence in niche Specialty
businesses that have high
barriers to entry
Forward integration in Pyridine
related derivatives to ensure
higher utilization and profitability
Diverse end-use industry
segmentation in Life Science
Ingredients with focus on
Pharmaceutical and
Agrochemical industries

10
Strong Pipeline of Products With Deep R&D Capabilities4
US Approvals
86 ANDAs filed + 4 ANDAs for
dosage (sterile)
30 ANDAs pending (oral solid)
approvals + 2 pending ANDA
approval for dosage (sterile)
Total 5 approvals received
from US-FDA in 9M’FY18
41 commercial APIs
89 US DMFs filed
Product pipeline as on December 31, 2017
RegionDosage (Orals) Injectables
Total Filings
Approval PendingTotal
FilingsApproval Pending
US 86 56 30 12(1) 10(2) 2
Canada 22 22 - 13 13 0
Europe 100 95 5 10 10 0
ROW 687 490 197 44 40 4
Total 893 663 232 79(3) 73 6
(1) Includes 4 ANDA filings for dosage (sterile) and 8 radiopharma US filings
(2) Includes 2 ANDA filings for dosage (sterile) and 8 radiopharma US filings
(3) Includes 4 ANDA filings for dosage (sterile) and 75 radiopharma filings
75 Radio Pharma filings
(includes 8 filings in US / 8
approved)
Strong R&D capabilities demonstrated by complex and niche product filings in formulations and API
Strong R&D support with a dedicated workforce of around 1,100 R&D professionals
Pharmaceuticals R&D Spending (INR m)
19012603
1504
FY 16 FY17 9M'FY18
3
10
8 8
5
FY14 FY15 FY16 FY17 9M'FY18
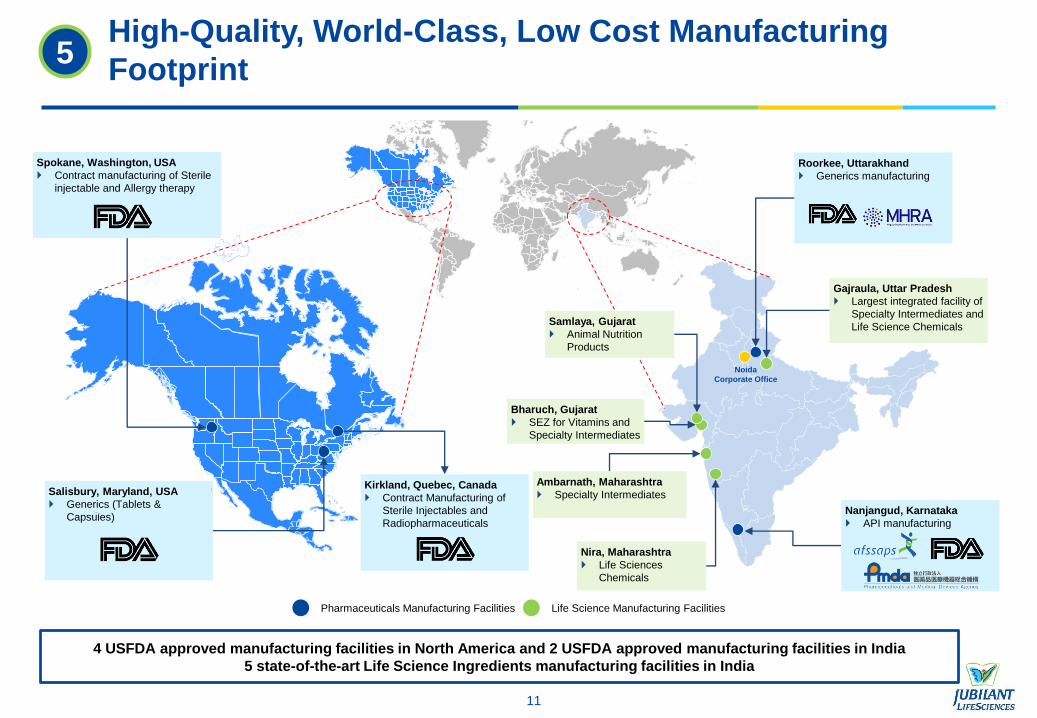
High-Quality, World-Class, Low Cost Manufacturing
Footprint
11
5
Pharmaceuticals Manufacturing Facilities Life Science Manufacturing Facilities
Salisbury, Maryland, USA
Generics (Tablets &
Capsules)
Spokane, Washington, USA
Contract manufacturing of Sterile
injectable and Allergy therapy
Roorkee, Uttarakhand
Generics manufacturing
Gajraula, Uttar Pradesh
Largest integrated facility of
Specialty Intermediates and
Life Science Chemicals
Nira, Maharashtra
Life Sciences
Chemicals
Ambarnath, Maharashtra
Specialty Intermediates
Bharuch, Gujarat
SEZ for Vitamins and
Specialty Intermediates
Samlaya, Gujarat
Animal Nutrition
Products
Kirkland, Quebec, Canada
Contract Manufacturing of
Sterile Injectables and
Radiopharmaceuticals
Nanjangud, Karnataka
API manufacturing
4 USFDA approved manufacturing facilities in North America and 2 USFDA approved manufacturing facilities in India
5 state-of-the-art Life Science Ingredients manufacturing facilities in India
Noida
Corporate Office

Experienced Management team with high standards of
corporate governance
12
6
Shyam S Bhartia
Chairman
37 industry years in pharma, specialty
chemicals, foods, oil and gas, aerospace
and IT
Hari S Bhartia
Co-Chairman & Managing Director
32 industry years in pharma, specialty
chemicals, foods, oil and gas, aerospace
and IT
Pramod Yadav, CEO Designate - Jubilant
Pharma Limited
28 years of Industry Experience
Rajesh Srivastava, whole-time Director and
CEO – Life Sciences Ingredients
28 years of Industry Experience
Pharmaceuticals Life Sciences Ingredients Drug Discovery Solutions
Steven Hutchins, President -
Drug Discovery Solutions
27 years of Industry Experience
Radiopharmaceuticals
CMO of Sterile Injectables
Allergy Therapy Products
Solid Dosage Formulations
Active Pharma Ingredients
India Branded Pharmaceuticals
Advanced Intermediates
Fine Ingredients
Crop Science Ingredients
Nutritional Products (Human and Animal)
Life Science Chemicals
Ethanol
Co
rpo
rate
Fu
nc
tio
ns
Finance
Operations
Quality
IT
HR
Regulatory
Finance
Operations
Quality
IT
HR
EHS
Bu
sin
es
se
s
Dr. Raju Mistry
Chief Human
Resources Officer
24 years Exp.
R Sankaraiah
Executive Director
– Finance
31 years Exp.
Dr. Ashutosh
Agarwal
Chief Scientific
Officer
34 years Exp.
Ajay Khanna
Chief - Strategic &
Public Affairs
36 years Exp.
Siddhartha Pahwa
Chief of Supply
Chain
20 years Exp.
Rajesh Kapoor
Chief of Quality
30 years Exp.
As of 31st Dec, 2017
Shareholding Structure
54%
20.2%
5.8%
13.7%
7.2%
Promoter
Foreign Institutional Investors
Financial Institutions / MFs / Banks
NRI and Indian Public
Others
*As on 28th Feb 2018 50.68%

13
Performance Back on Track With Business Related Concerns
Resolved
Successful Resolution of Warning Letters at Montreal and Spokane
Montreal CMO Facility
In Feb 2013, Jubilant’s manufacturing facility Jubilant HollisterStier (JHS) located at Kirkland, Quebec, Canada received a Warning Letter from the FDA
The facility engages in contract manufacturing of injectables for large pharma companies and also for the Radiopharma business
It was re-inspected in Sep 2013 and all issues related to the facility were successfully resolved in Feb 2014 with the warning letter closed out in Sep 2014
Successful inspection of the facility by USFDA in December 2015 and December 2016
Spokane CMO Facility
In Dec 2013, Jubilant’s manufacturing facility JHS located at Spokane, Washington State, US received a Warning Letter from the FDA
During H1 FY14, the contract manufacturing operations at Spokane contributed 7% to consolidated sales and 4% to consolidated EBITDA.
The facility was re-inspected by FDA in Apr 2014 and Dec 2014
In Jun 2015, Spokane facility was upgraded to the status of Voluntary Action Indicated (VAI) and ramp up of operations is underway
Successful inspection of the facility by USFDA in July 2015, September 2016, November 2016 and September 2017
Robust Growth in Jubilant Life Sciences’ EBITDA…
3,7243,453 3,369
3,1553,444 3,321
4,307
Q1 Q2 Q3 Q4
FY17 FY18
…and PAT
1,616 1,448
1,198 1,501 1,471
1,283
2,125
Q1 Q2 Q3 Q4FY17 FY18
(INR Mn)
(INR Mn)
20%22%
8%9%
21%
10%

Pharmaceuticals Segment
14
15
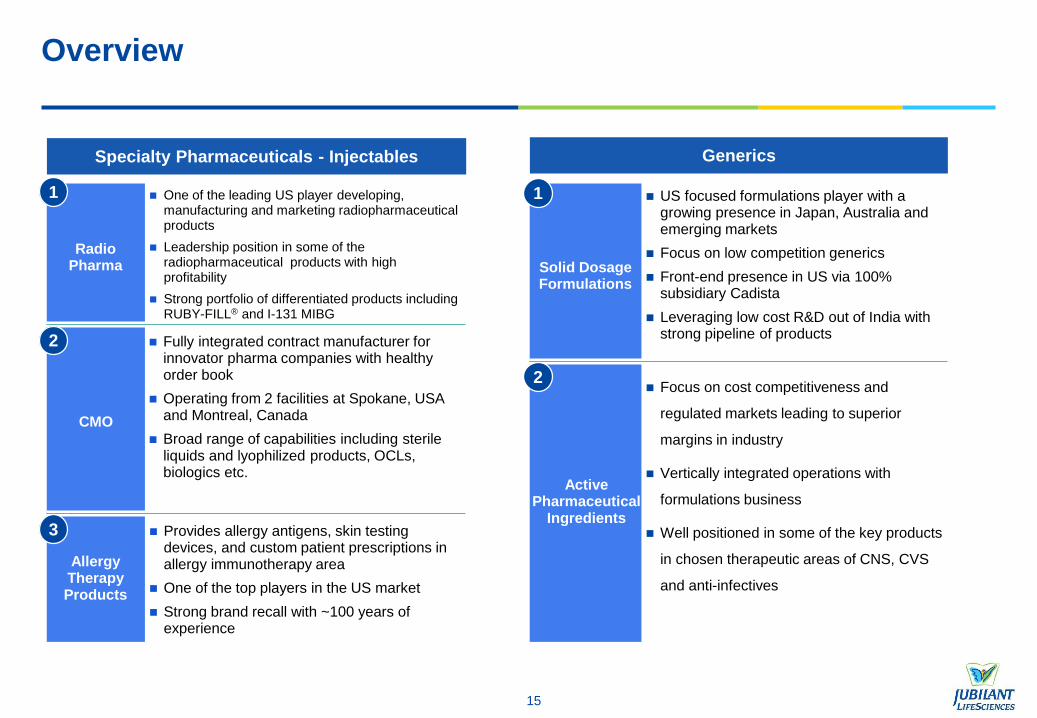
Overview
Specialty Pharmaceuticals - Injectables
Provides allergy antigens, skin testing devices, and custom patient prescriptions in allergy immunotherapy area
One of the top players in the US market
Strong brand recall with ~100 years of experience
AllergyTherapy Products
Fully integrated contract manufacturer for innovator pharma companies with healthy order book
Operating from 2 facilities at Spokane, USA and Montreal, Canada
Broad range of capabilities including sterile liquids and lyophilized products, OCLs, biologics etc.
CMO
One of the leading US player developing, manufacturing and marketing radiopharmaceutical products
Leadership position in some of the radiopharmaceutical products with high profitability
Strong portfolio of differentiated products including RUBY-FILL® and I-131 MIBG
RadioPharma
1
2
3
Generics
Focus on cost competitiveness and
regulated markets leading to superior
margins in industry
Vertically integrated operations with
formulations business
Well positioned in some of the key products
in chosen therapeutic areas of CNS, CVS
and anti-infectives
US focused formulations player with a growing presence in Japan, Australia and emerging markets
Focus on low competition generics
Front-end presence in US via 100% subsidiary Cadista
Leveraging low cost R&D out of India with strong pipeline of products
Solid Dosage Formulations
1
2
Active Pharmaceutical
Ingredients
16
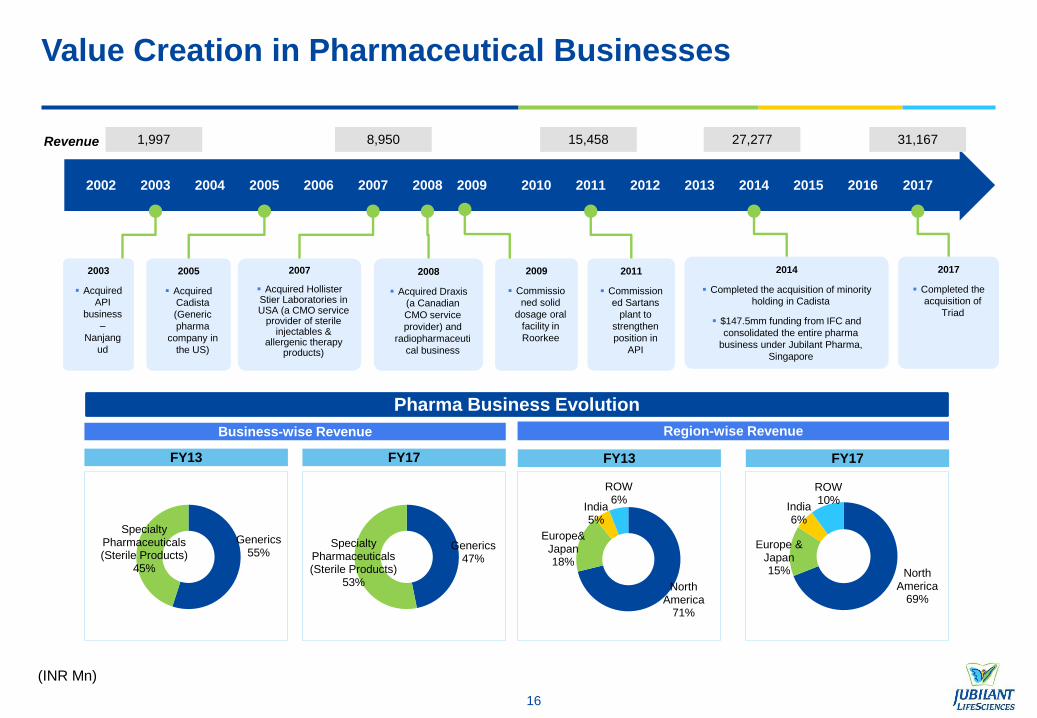
Value Creation in Pharmaceutical Businesses
2002 2003 2004 2005 2006 2007 2008 2009 2010 2011 2012 2013 2014 2015 2016
2003
Acquired
API
business
–
Nanjang
ud
2005
Acquired
Cadista
(Generic
pharma
company in
the US)
2007
Acquired Hollister Stier Laboratories in USA (a CMO service
provider of sterile injectables &
allergenic therapy products)
2008
Acquired Draxis
(a Canadian
CMO service
provider) and
radiopharmaceuti
cal business
2011
Commission
ed Sartans
plant to
strengthen
position in
API
2014
Completed the acquisition of minority
holding in Cadista
$147.5mm funding from IFC and
consolidated the entire pharma
business under Jubilant Pharma,
Singapore
2009
Commissio
ned solid
dosage oral
facility in
Roorkee
15,458Revenue 31,1678,9501,997
Generics47%
Specialty Pharmaceuticals (Sterile Products)
53% North America
71%
Europe& Japan18%
India5%
ROW6%
North America
69%
Europe & Japan15%
India6%
ROW10%
Pharma Business Evolution
Business-wise Revenue Region-wise Revenue
FY13 FY17 FY13 FY17
Generics55%
Specialty Pharmaceuticals (Sterile Products)
45%
2017
(INR Mn)
27,277
2017
Completed the
acquisition of
Triad

24%28%
Radiopharmaceuticals: North America market leadership in nuclear imaging products
Contract Manufacturing (CMO) of sterile injectables for large pharmaceuticals and biotech companies
Allergy Therapy Products: Focus on diagnostic allergenic extracts with 53% US Allergy market penetration
17
Overview
Pharmaceuticals
Overview
Specialty Pharma (Sterile Products) Generics
FY17
Revenue
Contribution
Reported YoY growth of 11% for FY17
Expect to launch new differentiated products going forward
Healthy order book position in the CMO business
Key
Highlights
28,850
31,167
27,756
FY16 FY17 9M'FY18
8,920 9,751
7,076
FY16 FY17 9M'FY18
Revenue (INR m)
EBITDA (INR m)
31%
Solid Dosage Formulations: Strong pipeline of 86 ANDAs filed and 30 ANDAs pending approvals as on December 31, 2017
APIs: Vertically integrated operations with API manufacturing for captive consumption as well as external sales
Indian Branded Pharmaceuticals: Recent foray with the launch of Cardiovascular and Diabetic division
Deep relationships in Generics industry for APIs
Front-end presence in US via 100% subsidiary Cadista
North America accounted for 74% of FY17 Solid Dosage Formulations revenue
EBITDA Margin
26%31%
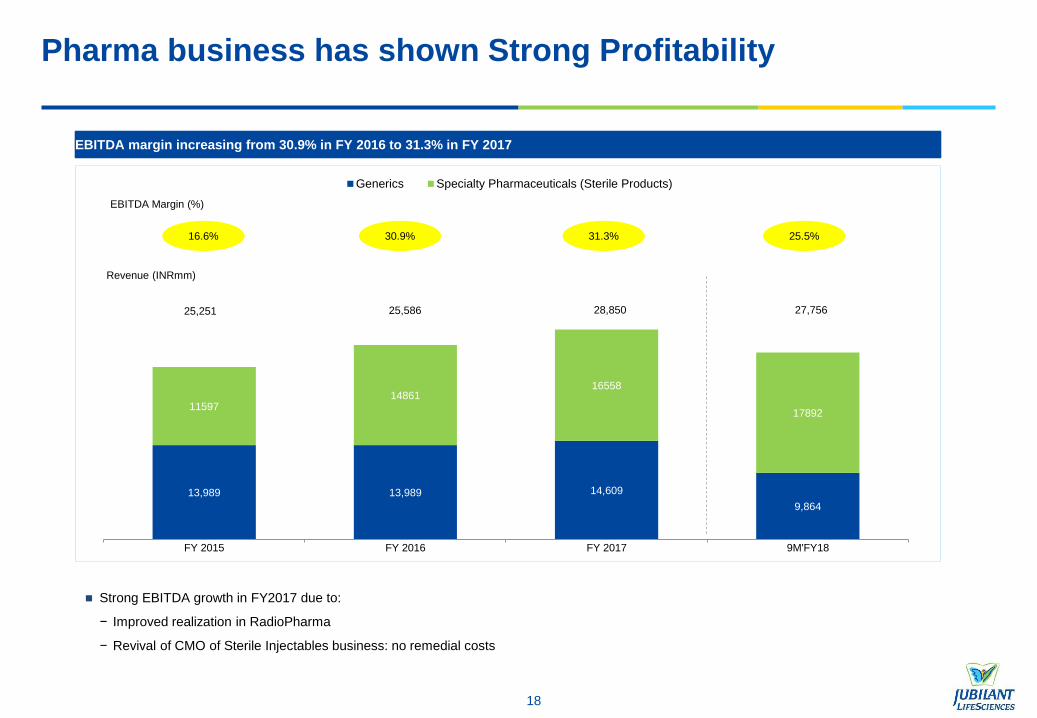
13,989 13,989 14,609
9,864
1159714861
16558
17892
FY 2015 FY 2016 FY 2017 9M'FY18
Generics Specialty Pharmaceuticals (Sterile Products)
18
Pharma business has shown Strong Profitability
EBITDA margin increasing from 30.9% in FY 2016 to 31.3% in FY 2017
Strong EBITDA growth in FY2017 due to:
− Improved realization in RadioPharma
− Revival of CMO of Sterile Injectables business: no remedial costs
16.6% 30.9% 31.3%
Revenue (INRmm)
EBITDA Margin (%)
25,251 25,586 28,850
25.5%
27,756
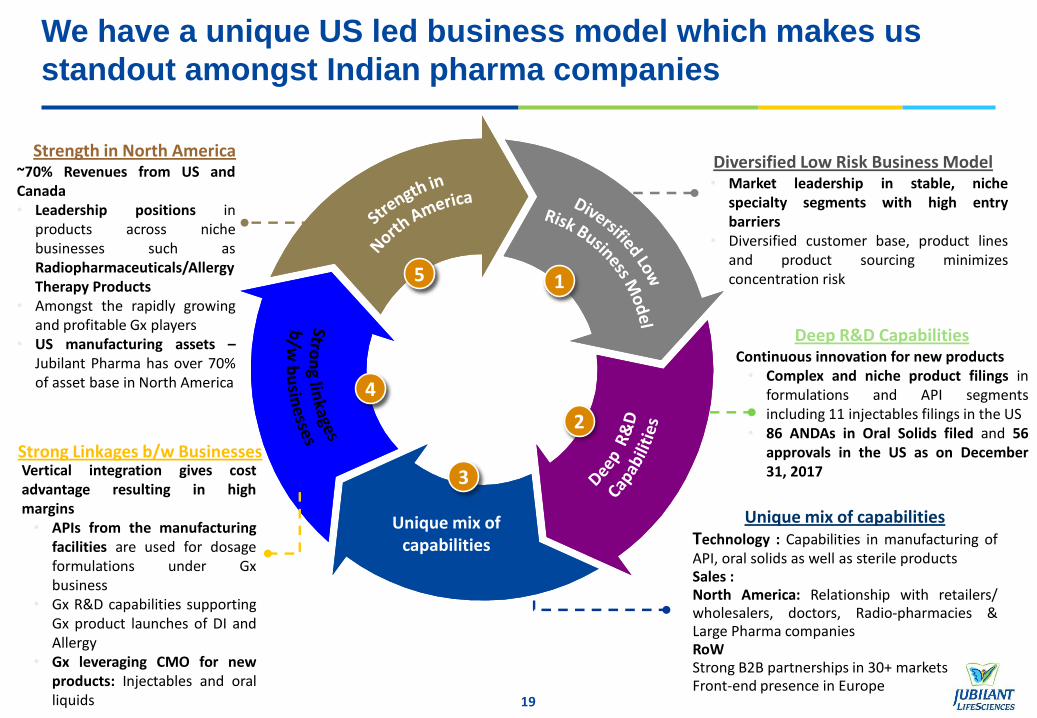
We have a unique US led business model which makes us
standout amongst Indian pharma companies
19
1
2
3
4
5
• Market leadership in stable, nichespecialty segments with high entrybarriers
• Diversified customer base, product linesand product sourcing minimizesconcentration risk
Deep R&D CapabilitiesContinuous innovation for new products• Complex and niche product filings in
formulations and API segmentsincluding 11 injectables filings in the US
• 86 ANDAs in Oral Solids filed and 56approvals in the US as on December31, 2017
Technology : Capabilities in manufacturing ofAPI, oral solids as well as sterile productsSales :North America: Relationship with retailers/wholesalers, doctors, Radio-pharmacies &Large Pharma companiesRoWStrong B2B partnerships in 30+ marketsFront-end presence in Europe
~70% Revenues from US andCanada• Leadership positions in
products across nichebusinesses such asRadiopharmaceuticals/AllergyTherapy Products
• Amongst the rapidly growingand profitable Gx players
• US manufacturing assets –Jubilant Pharma has over 70%of asset base in North America
Vertical integration gives costadvantage resulting in highmargins• APIs from the manufacturing
facilities are used for dosageformulations under Gxbusiness
• Gx R&D capabilities supportingGx product launches of DI andAllergy
• Gx leveraging CMO for newproducts: Injectables and oralliquids
1
2
3
4
5
Unique mix ofcapabilities
Diversified Low Risk Business Model
Unique mix of capabilities
Strong Linkages b/w Businesses
Strength in North America
20
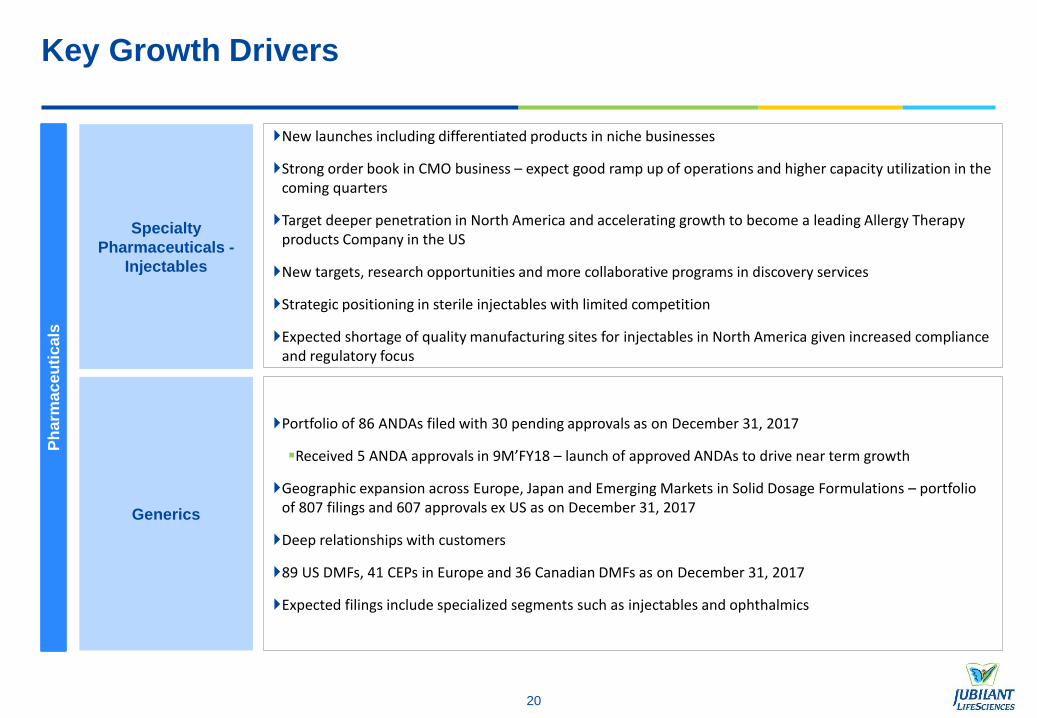
Key Growth Drivers
Generics
Portfolio of 86 ANDAs filed with 30 pending approvals as on December 31, 2017
Received 5 ANDA approvals in 9M’FY18 – launch of approved ANDAs to drive near term growth
Geographic expansion across Europe, Japan and Emerging Markets in Solid Dosage Formulations – portfolio of 807 filings and 607 approvals ex US as on December 31, 2017
Deep relationships with customers
89 US DMFs, 41 CEPs in Europe and 36 Canadian DMFs as on December 31, 2017
Expected filings include specialized segments such as injectables and ophthalmics
Specialty
Pharmaceuticals -
Injectables
New launches including differentiated products in niche businesses
Strong order book in CMO business – expect good ramp up of operations and higher capacity utilization in the coming quarters
Target deeper penetration in North America and accelerating growth to become a leading Allergy Therapy products Company in the US
New targets, research opportunities and more collaborative programs in discovery services
Strategic positioning in sterile injectables with limited competition
Expected shortage of quality manufacturing sites for injectables in North America given increased compliance and regulatory focus
Ph
arm
ac
eu
tic
als

Life Science Ingredients
21
22
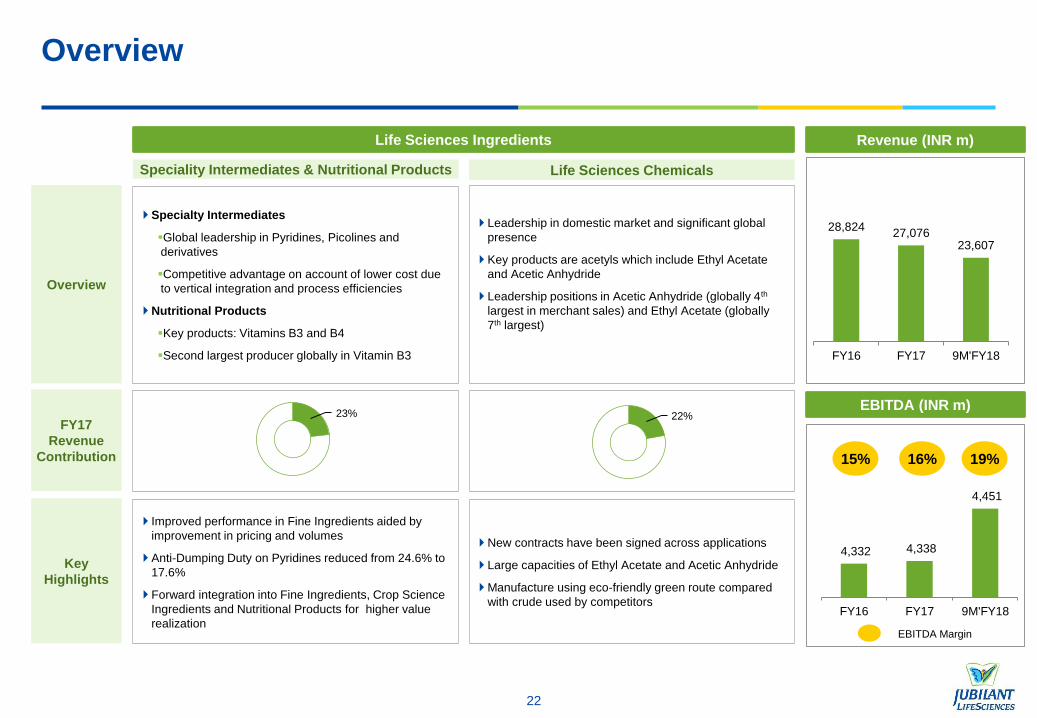
Overview
Life Sciences Ingredients
Overview
Speciality Intermediates & Nutritional Products Life Sciences Chemicals
FY17
Revenue
Contribution
22%
Leadership in domestic market and significant global
presence
Key products are acetyls which include Ethyl Acetate
and Acetic Anhydride
Leadership positions in Acetic Anhydride (globally 4th
largest in merchant sales) and Ethyl Acetate (globally
7th largest)
New contracts have been signed across applications
Large capacities of Ethyl Acetate and Acetic Anhydride
Manufacture using eco-friendly green route compared
with crude used by competitors
Key
Highlights
23%
Specialty Intermediates
Global leadership in Pyridines, Picolines and
derivatives
Competitive advantage on account of lower cost due
to vertical integration and process efficiencies
Nutritional Products
Key products: Vitamins B3 and B4
Second largest producer globally in Vitamin B3
Improved performance in Fine Ingredients aided by
improvement in pricing and volumes
Anti-Dumping Duty on Pyridines reduced from 24.6% to
17.6%
Forward integration into Fine Ingredients, Crop Science
Ingredients and Nutritional Products for higher value
realization
28,824 27,076
23,607
FY16 FY17 9M'FY18
4,332 4,338
4,451
FY16 FY17 9M'FY18
Revenue (INR m)
EBITDA (INR m)
15% 16%
EBITDA Margin
19%

23
Key Growth Drivers
Life Sciences
Chemicals
Higher capacity utilization to aid growth for Acetic Anhydride
Expanding geographic reach into Key Markets such as US and Europe
Cost advantages:
Efficient process
Volume advantage in procurement
Multimodal transportation and reverse logistics to optimize costs
Specialty
Intermediates and
Nutritional Products
Conversion of existing product specific plants to multi-purpose plants to meet enhanced customer demand requirements
New Product launches in Specialty Intermediate plants
Increased supply of Life Sciences intermediates for Pharma related applications
Increased focus on new, non-traditional geographies for Pyridine
Increased demand for higher value-added products in Fine Ingredients and Nutritional Products
Lif
e S
cie
nc
es
In
gre
die
nts
Financial Overview
24
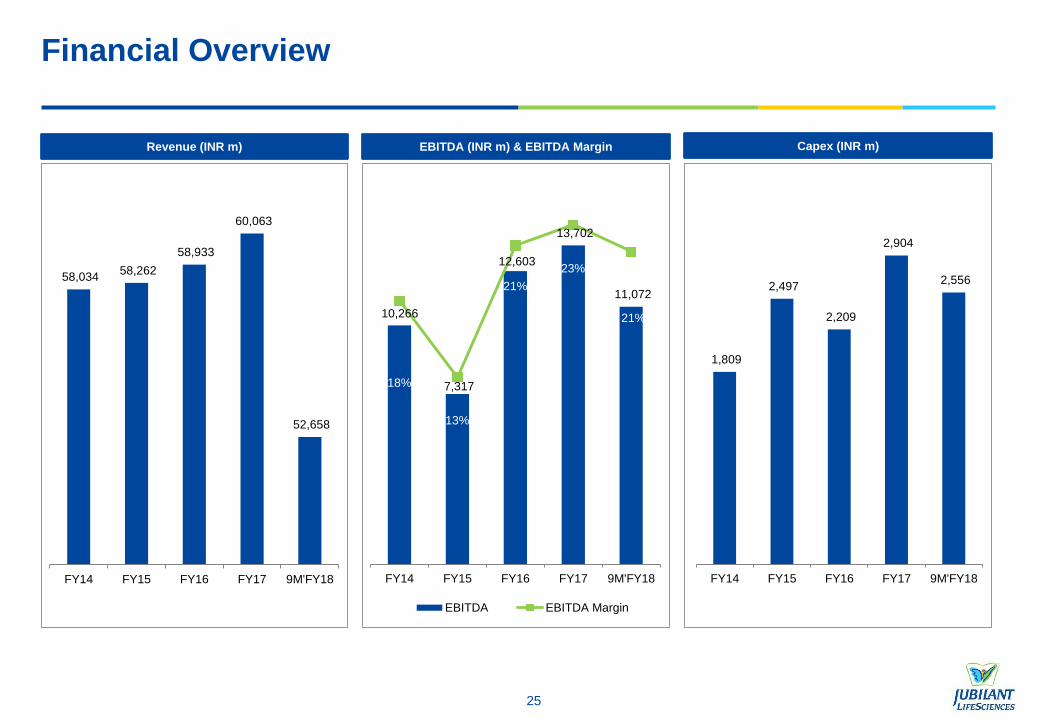
10,266
7,317
12,603
13,702
11,072
18%
13%
21%
23%
21%
FY14 FY15 FY16 FY17 9M'FY18
EBITDA EBITDA Margin
Financial Overview
25
58,034 58,262
58,933
60,063
52,658
FY14 FY15 FY16 FY17 9M'FY18
1,809
2,497
2,209
2,904
2,556
FY14 FY15 FY16 FY17 9M'FY18
Revenue (INR m) EBITDA (INR m) & EBITDA Margin Capex (INR m)

Pharma68%
India6%
USA & Canada
69%
Europe & Japan15%
ROW10%
Specialty Pharmaceuticals
- Injectables53%
Generics47%
Pharma Business: Overview
26
27,277 26,820
28,850
31,167
27,756
FY14 FY15 FY16 FY17 9M'FY18
6,102
4,447
8,920 9,751
7,076
FY14 FY15 FY16 FY17 9M'FY18
Revenue (INR m)
EBITDA (INR m)
Revenue by Segment (FY17) Revenue by Geography (FY17)
% of Total EBITDA (FY17)
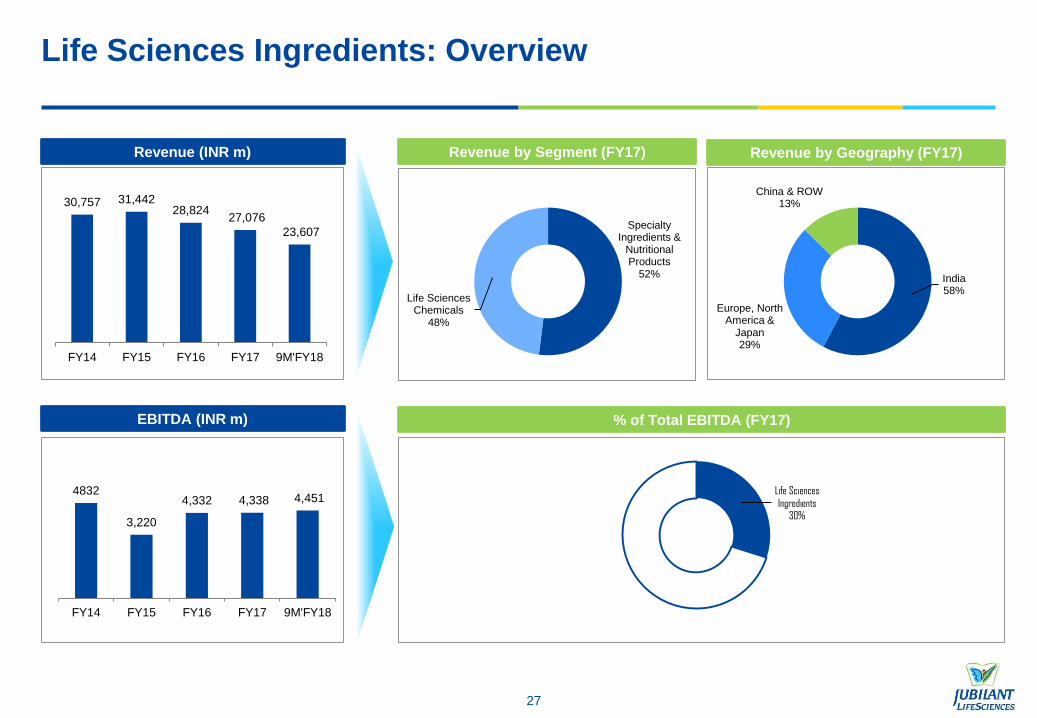
Life Sciences Ingredients
30%
India58%
Europe, North America &
Japan29%
China & ROW13%
Life Sciences Ingredients: Overview
27
30,757 31,44228,824
27,076
23,607
FY14 FY15 FY16 FY17 9M'FY18
4832
3,220
4,332 4,338 4,451
FY14 FY15 FY16 FY17 9M'FY18
Revenue (INR m)
EBITDA (INR m)
Revenue by Segment (FY17) Revenue by Geography (FY17)
% of Total EBITDA (FY17)
Specialty Ingredients &
Nutritional Products
52%
Life Sciences Chemicals
48%

INR
36%
US$ & Other Currencies
64%
45,344
40,845 39,040 39,901
37,146
41,900
36,248 35,009
36,585 34,458
Mar-16 Mar-17 Jun-17 Sep-17 Dec-17
Gross Debt Net Debt
Strong Balance Sheet
28
Debt Overview (INR m)
3.8x
6.0x
3.3x2.6x 2.4x
FY14 FY15 FY16 FY17 9M'FY18
Net Debt / EBITDA
Debt Breakdown by Currency (31-Dec-18)
• Reorganized debt portfolio in such a way that free cash
flows would be adequate for scheduled loan repayments
• Prepaid all rupee loans scheduled for repayment during next
two years
• Net Debt reduction of Rs. 1,428 Million in 9M’FY18 after Net
Debt reduction of Rs. 5,056 Million in FY17

29
Annual Results Analysis
29
30
Income Statement – FY17
30
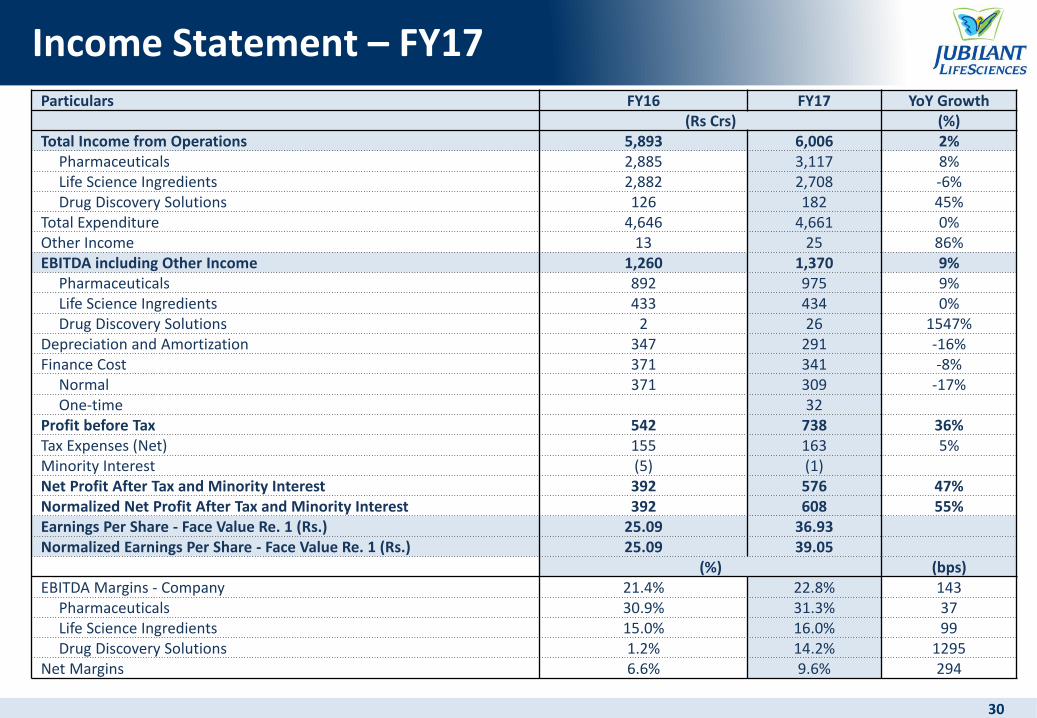
Particulars FY16 FY17 YoY Growth(Rs Crs) (%)
Total Income from Operations 5,893 6,006 2%Pharmaceuticals 2,885 3,117 8%Life Science Ingredients 2,882 2,708 -6%Drug Discovery Solutions 126 182 45%
Total Expenditure 4,646 4,661 0%Other Income 13 25 86%EBITDA including Other Income 1,260 1,370 9%
Pharmaceuticals 892 975 9%Life Science Ingredients 433 434 0%Drug Discovery Solutions 2 26 1547%
Depreciation and Amortization 347 291 -16%Finance Cost 371 341 -8%
Normal 371 309 -17%One-time 32
Profit before Tax 542 738 36%Tax Expenses (Net) 155 163 5%Minority Interest (5) (1)Net Profit After Tax and Minority Interest 392 576 47%Normalized Net Profit After Tax and Minority Interest 392 608 55%Earnings Per Share - Face Value Re. 1 (Rs.) 25.09 36.93 Normalized Earnings Per Share - Face Value Re. 1 (Rs.) 25.09 39.05
(%) (bps)EBITDA Margins - Company 21.4% 22.8% 143
Pharmaceuticals 30.9% 31.3% 37 Life Science Ingredients 15.0% 16.0% 99 Drug Discovery Solutions 1.2% 14.2% 1295
Net Margins 6.6% 9.6% 294
31
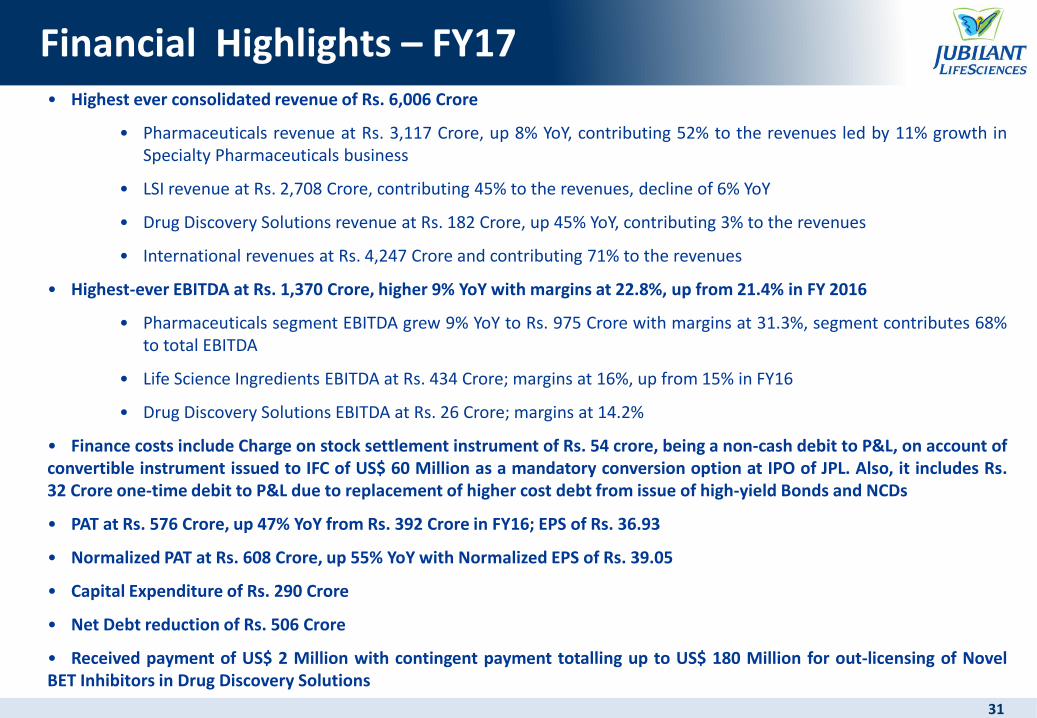
Financial Highlights – FY17• Highest ever consolidated revenue of Rs. 6,006 Crore
• Pharmaceuticals revenue at Rs. 3,117 Crore, up 8% YoY, contributing 52% to the revenues led by 11% growth inSpecialty Pharmaceuticals business
• LSI revenue at Rs. 2,708 Crore, contributing 45% to the revenues, decline of 6% YoY
• Drug Discovery Solutions revenue at Rs. 182 Crore, up 45% YoY, contributing 3% to the revenues
• International revenues at Rs. 4,247 Crore and contributing 71% to the revenues
• Highest-ever EBITDA at Rs. 1,370 Crore, higher 9% YoY with margins at 22.8%, up from 21.4% in FY 2016
• Pharmaceuticals segment EBITDA grew 9% YoY to Rs. 975 Crore with margins at 31.3%, segment contributes 68%to total EBITDA
• Life Science Ingredients EBITDA at Rs. 434 Crore; margins at 16%, up from 15% in FY16
• Drug Discovery Solutions EBITDA at Rs. 26 Crore; margins at 14.2%
• Finance costs include Charge on stock settlement instrument of Rs. 54 crore, being a non-cash debit to P&L, on account ofconvertible instrument issued to IFC of US$ 60 Million as a mandatory conversion option at IPO of JPL. Also, it includes Rs.32 Crore one-time debit to P&L due to replacement of higher cost debt from issue of high-yield Bonds and NCDs
• PAT at Rs. 576 Crore, up 47% YoY from Rs. 392 Crore in FY16; EPS of Rs. 36.93
• Normalized PAT at Rs. 608 Crore, up 55% YoY with Normalized EPS of Rs. 39.05
• Capital Expenditure of Rs. 290 Crore
• Net Debt reduction of Rs. 506 Crore
• Received payment of US$ 2 Million with contingent payment totalling up to US$ 180 Million for out-licensing of NovelBET Inhibitors in Drug Discovery Solutions
31

32
Segmental Revenue Analysis – FY 17
32
Segmental Revenue Analysis
Revenue (Rs. Crs.) Revenue
Mix (%)YoY
Growth %FY16 FY17
Pharmaceuticals 2,885 3,117 52% 8%
Generics 1,399 1,461 24% 4%
Specialty Pharmaceuticals (Sterile Products)
1,486 1,656 28% 11%
Life Science Ingredients 2,882 2,708 45% -6%
Specialty Intermediates and Nutritional Products
1,590 1,399 23% -12%
Life Science Chemicals 1,293 1,309 22% 1%
Drug Discovery Solutions 126 182 3% 45%
Income from Operations 5,893 6,006 100% 2%
Inter Divisional Sales (IDTs) 510 529 9% 4%
IDT as a % of Income 9% 9%
• Company reports highest-everrevenue of Rs. 6,006 Crore
• Volume increase of 5%
• Pharmaceuticals segment reportsrevenue of Rs 3,117 Crore, 8% YoYgrowth
• Healthy growth in all businesses inSpecialty Pharma
• USFDA approval received for keyproduct Rubyfill and long-termcontracts signed with distributors
• Volume growth in API business
• LSI segment posts income of Rs 2,708Crore, contributes 45% to totalrevenue
• Price increase in Fine Ingredients
• Volume growth in Life ScienceChemicals and Nutritional Products
• Drug Discovery segment revenuesdisplay robust growth of 45%
• Improved customer tractionwitnessed

3333
Pharma Business Highlights – FY17
• Revenues of Rs. 3,117 Crores, up 8% YoY
• Specialty Pharmaceuticals (Sterile Products) revenues grew 11% YoY led by growth in all key
businesses; contributed 53% to segment sales as against 52% in FY16
• Generics revenues grew 4% YoY, led by strong growth in APIs business
• USFDA inspections of Roorkee, Cadista, Radiopharmaceuticals, CMO Montreal and Spokane
facilities successfully completed
• EBITDA of Rs. 975 Crore; growth of 9% YoY with margins at 31.3%, aided by
improvement in Specialty Pharma (Sterile Products); Segment contributes to 68% of
the company’s EBITDA
• R&D spend during FY17 is Rs. 260 Crore – 8.4% to segment sales. R&D charged to
P&L is Rs. 123 Crore – 3.9% to segment sales
3434
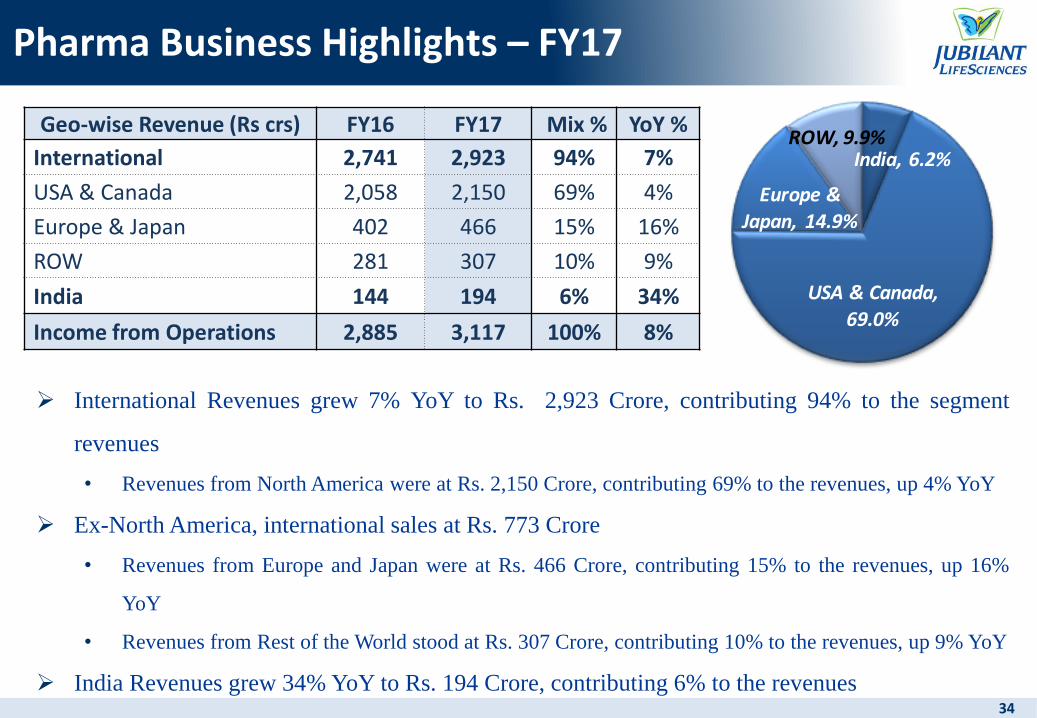
Pharma Business Highlights – FY17
International Revenues grew 7% YoY to Rs. 2,923 Crore, contributing 94% to the segment
revenues
• Revenues from North America were at Rs. 2,150 Crore, contributing 69% to the revenues, up 4% YoY
Ex-North America, international sales at Rs. 773 Crore
• Revenues from Europe and Japan were at Rs. 466 Crore, contributing 15% to the revenues, up 16%
YoY
• Revenues from Rest of the World stood at Rs. 307 Crore, contributing 10% to the revenues, up 9% YoY
India Revenues grew 34% YoY to Rs. 194 Crore, contributing 6% to the revenues
Geo-wise Revenue (Rs crs) FY16 FY17 Mix % YoY %
International 2,741 2,923 94% 7%
USA & Canada 2,058 2,150 69% 4%
Europe & Japan 402 466 15% 16%
ROW 281 307 10% 9%
India 144 194 6% 34%
Income from Operations 2,885 3,117 100% 8%
India, 6.2%
USA & Canada,
69.0%
Europe & Japan, 14.9%
ROW, 9.9%
35
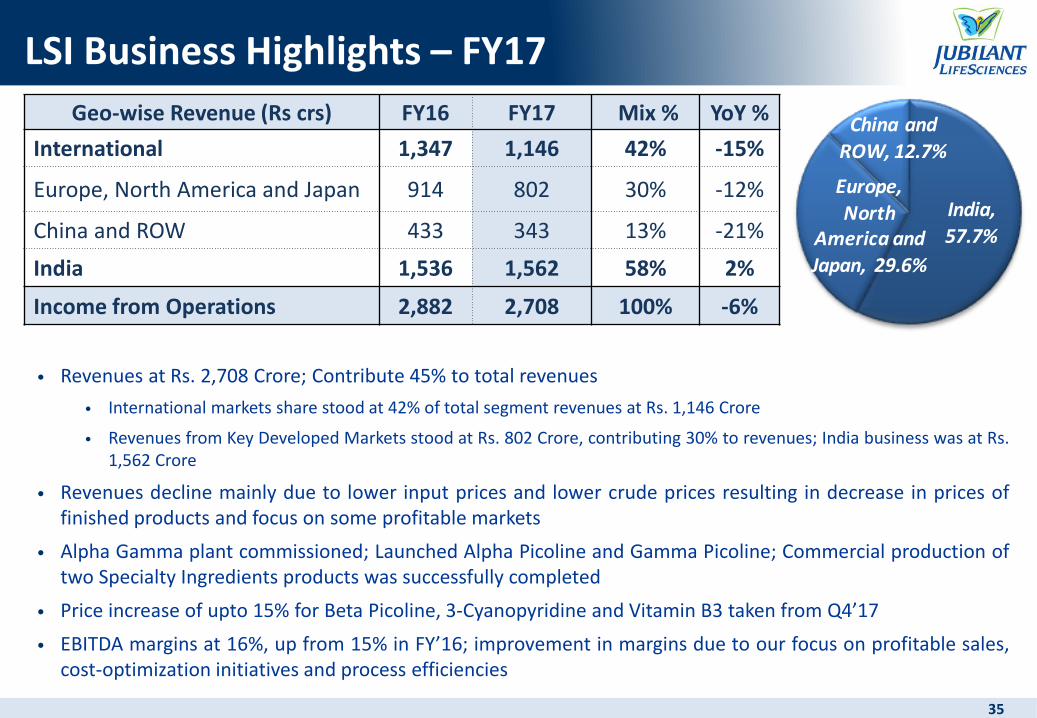
LSI Business Highlights – FY17
• Revenues at Rs. 2,708 Crore; Contribute 45% to total revenues
• International markets share stood at 42% of total segment revenues at Rs. 1,146 Crore
• Revenues from Key Developed Markets stood at Rs. 802 Crore, contributing 30% to revenues; India business was at Rs.1,562 Crore
• Revenues decline mainly due to lower input prices and lower crude prices resulting in decrease in prices offinished products and focus on some profitable markets
• Alpha Gamma plant commissioned; Launched Alpha Picoline and Gamma Picoline; Commercial production oftwo Specialty Ingredients products was successfully completed
• Price increase of upto 15% for Beta Picoline, 3-Cyanopyridine and Vitamin B3 taken from Q4’17
• EBITDA margins at 16%, up from 15% in FY’16; improvement in margins due to our focus on profitable sales,cost-optimization initiatives and process efficiencies
35
Geo-wise Revenue (Rs crs) FY16 FY17 Mix % YoY %
International 1,347 1,146 42% -15%
Europe, North America and Japan 914 802 30% -12%
China and ROW 433 343 13% -21%
India 1,536 1,562 58% 2%
Income from Operations 2,882 2,708 100% -6%
India,
57.7%
Europe,
North America and
Japan, 29.6%
China and
ROW, 12.7%

36
Drug Discovery Solutions Business Highlights – FY17• Revenues at Rs. 182 Crore, grew 45% YoY; Contributes 3% to total revenues
• EBITDA at Rs. 26 Crore, including out-licensing income of US$ 2 Million; Up from Rs. 2 Crore in FY 2016
• Proprietary Drug Discovery
Out-licensing of family of patents covering compounds that inhibit BRD4, a member of the BET(Bromodomain and Extra Terminal) for cancer treatment
i. We have entered into exclusive out-licensing agreement with Checkpoint Therapeutics for Novel BETInhibitors
ii. This includes upfront payment of US$ 2 Million and Contingent pre-clinical, clinical and regulatorypayments including commercial milestones totaling up to US$ 180 Million
iii. Jubilant will receive research funding and royalty payments on successful commercialization of thecompounds
iv. IND enabling studies for BRD4 is progressing well at Biosys and Chemsys
The pipeline of novel products is strong and the company is aggressively pursuing internal as well asexternal collaborations with academics to increase the portfolio of assets. We continue to evaluatefurther out licensing opportunities of some of our existing pipeline and one of the asset is under duediligence
Strategic investments in Drug Discovery venturesi. Received upfront payment of US$ 4.6 Million in Q4’16 and contingent payment up to US$ 18 Million based on
the achievement of certain pre-determined clinical and regulatory milestones from 10% interest as a limitedpartner in one of the venture funds specialized in seeding and investing in early stage drug discovery firms.These payments are on account of an acquisition by a large pharma company of one of their investeecompanies having assets in early stage clinical development
36

37
Expenditure Analysis – FY17
37
• Material Costs as percentage of sales lower due to better operational efficiencies, price
realizations, lower input prices and sales mix
• Excise Duty on sales and Power & Fuel as percentage of sales stable
• Employee benefits expense and Other Expenses increase in line with sales growth in Pharma
business
Expenses (Rs Crs) FY16 % of Sales FY17 % of Sales YoY Growth %
Material Cost 2,117 36% 2,000 33% -6%
Excise Duty on Sales 144 2% 145 2% 0%
Power & Fuel Expense 367 6% 334 6% -9%
Employee Benefits Expense 1,125 19% 1,231 20% 9%
Other Expenses 893 15% 952 16% 7%
Total Expenses 4,646 79% 4,661 78% 0%
38
Q3’FY18 and 9M’FY18 Results Analysis
38

39
Income Statement – Q3’FY18
39
Particulars Q3'FY17 Q2'FY18 Q3'FY18 YoY Growth QoQ Growth(Rs Crs) (%)
Total Revenue from Operations (Net of Excise) 1,458 1,642 2,068 42% 26%Pharmaceuticals 782 860 1,101 41% 28%Life Science Ingredients 633 738 922 46% 25%Drug Discovery Solutions 44 44 45 2% 2%
Total Expenditure 1,126 1,336 1,651 47% 24%Other Income 5 7 3 -37% -55%EBITDA from Operations
Pharmaceuticals 247 211 245 -1% 16%Life Science Ingredients 99 131 206 109% 57%Drug Discovery Solutions 6 5 3 -46% -33%
Corporate (Expenses)/Income (15) (14) (23)Total 337 332 431 28% 30%One time expenses 0 (19) (11)Reported EBITDA 337 313 420 25% 34%Depreciation and Amortization 73 79 82 13% 4%Finance Cost 98 66 77 -22% 17%
Profit before Tax 166 168 261 57% 55%
Tax Expenses (Net) 48 43 48 1% 13%Minority Interest (1) (3) 0 Net Profit After Tax and Minority Interest 119 128 213 78% 66%Normalised Profit after Tax 119 142 221 85% 55%Earnings Per Share - Face Value Re. 1 (Rs.) 7.66 8.23 13.64 Normalised Earnings Per Share 7.66 9.15 14.20
(%) (bps)EBITDA Margins from Operations 23.1% 20.2% 20.8% (228) 60
Pharmaceuticals 31.6% 24.5% 22.2% (942) (227)Life Science Ingredients 15.6% 17.7% 22.3% 676 459 Drug Discovery Solutions 13.3% 10.7% 7.0% (627) (369)
Net Margins 8.2% 7.8% 10.3% 209 246

40
Financial Highlights – Q3’FY18• Consolidated revenue at Rs. 2,068 Crore, up 42% YoY and 26% QoQ
• Pharmaceuticals revenue at Rs. 1,101 Crore, contributing 53% to the revenues, up 41% YoY and 28% QoQ
• Life Science Ingredients revenue at Rs. 922 Crore, contributing 45% to the revenues, up 46% YoY and 25%QoQ
• Drug Discovery Solutions revenue at Rs. 45 Crore, contributing 2% to the revenues, up 2% YoY and 2%QoQ
• International revenues at Rs. 1,482 Crore, contributing 72% to the revenues; growing 40% YoY
• EBITDA from Operations of Rs. 431 Crore, up 28% YoY and 30% QoQ with margins of 20.8%
• Pharmaceuticals EBITDA of Rs. 245 Crore with margins of 22.2%
• Life Science Ingredients EBITDA at Rs. 206 Crore; growth of 109% YoY and 57% QoQ; record margins at22.3%
• Drug Discovery Solutions EBITDA at Rs. 3 Crore, margins at 7.0%
• Finance costs lower 22% YoY at Rs. 77 Crore from Rs. 98 Crore in Q3’FY17 and higher 17% QoQ from Rs. 66Crore in Q2’FY18. Finance costs include borrowing costs of Rs. 57 Crore as against Rs. 89 Crore in Q3’FY17 and Rs.56 Crore in Q2’FY18 and charge on Stock Settlement Instrument of Rs. 20 Crore as against Rs. 10 Crore each inQ3’FY17 and Q2’FY18
• Highest-ever PAT at Rs. 213 Crore, up 78% YoY and 66% QoQ, with Net Margins at 10.3% and EPS of Rs. 13.64for Re. 1 FV; Normalized PAT after adjusting for one-time expenses stood at Rs. 221 Crore with EPS of Rs. 14.20
• Net Debt reduction of Rs. 159 Crore after incurring capex of Rs. 70 Crore40

41
Income Statement – 9M’FY18
41
Particulars 9M'FY17 9M'FY18 YoY Growth(Rs Crs) (%)
Total Revenue from Operations (Net of Excise) 4,263 5,266 24%Pharmaceuticals 2,300 2,776 21%Life Science Ingredients 1,832 2,361 29%Drug Discovery Solutions 131 130 -1%
Total Expenditure 3,223 4,205 30%Other Income 14 17 19%EBITDA from Operations
Pharmaceuticals 759 708 -7%Life Science Ingredients 318 445 40%Drug Discovery Solutions 20 8 -60%
Corporate (Expenses) /Income (43) (54)Total 1,055 1,107 5%One time expenses 0 (30)Reported EBITDA 1,055 1,078 2%Depreciation and Amortization 216 233 8%Finance Cost 261 212 -19%
Profit before Tax 578 633 10%
Tax Expenses (Net) 152 151 -1%Minority Interest 0 (6)Net Profit After Tax and Minority Interest 426 488 15%Normalised Profit after Tax 426 510 20%Earnings Per Share - Face Value Re. 1 (Rs.) 27.30 31.31Normalised Earnings Per Share 27.30 32.77
(%) (bps)EBITDA Margins from Operations 24.7% 21.0% (371)
Pharmaceuticals 33.0% 25.5% (751)Life Science Ingredients 17.4% 18.9% 149 Drug Discovery Solutions 15.5% 6.3% (914)
Net Margins 10.0% 9.3% (72)
42
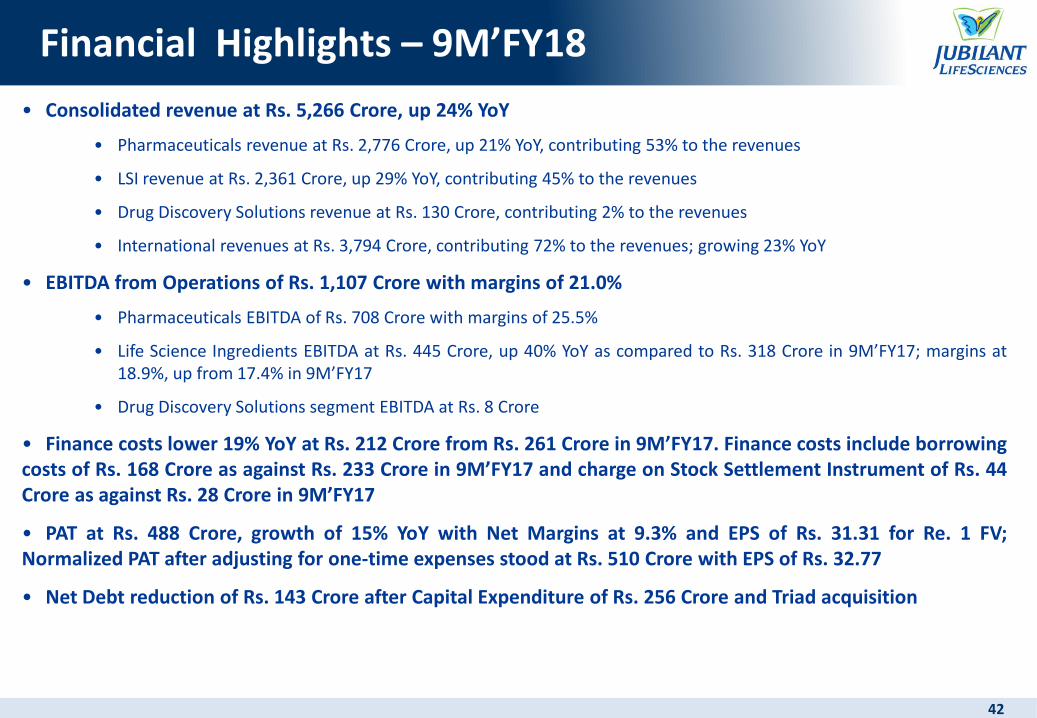
Financial Highlights – 9M’FY18
• Consolidated revenue at Rs. 5,266 Crore, up 24% YoY
• Pharmaceuticals revenue at Rs. 2,776 Crore, up 21% YoY, contributing 53% to the revenues
• LSI revenue at Rs. 2,361 Crore, up 29% YoY, contributing 45% to the revenues
• Drug Discovery Solutions revenue at Rs. 130 Crore, contributing 2% to the revenues
• International revenues at Rs. 3,794 Crore, contributing 72% to the revenues; growing 23% YoY
• EBITDA from Operations of Rs. 1,107 Crore with margins of 21.0%
• Pharmaceuticals EBITDA of Rs. 708 Crore with margins of 25.5%
• Life Science Ingredients EBITDA at Rs. 445 Crore, up 40% YoY as compared to Rs. 318 Crore in 9M’FY17; margins at18.9%, up from 17.4% in 9M’FY17
• Drug Discovery Solutions segment EBITDA at Rs. 8 Crore
• Finance costs lower 19% YoY at Rs. 212 Crore from Rs. 261 Crore in 9M’FY17. Finance costs include borrowingcosts of Rs. 168 Crore as against Rs. 233 Crore in 9M’FY17 and charge on Stock Settlement Instrument of Rs. 44Crore as against Rs. 28 Crore in 9M’FY17
• PAT at Rs. 488 Crore, growth of 15% YoY with Net Margins at 9.3% and EPS of Rs. 31.31 for Re. 1 FV;Normalized PAT after adjusting for one-time expenses stood at Rs. 510 Crore with EPS of Rs. 32.77
• Net Debt reduction of Rs. 143 Crore after Capital Expenditure of Rs. 256 Crore and Triad acquisition
42
4343
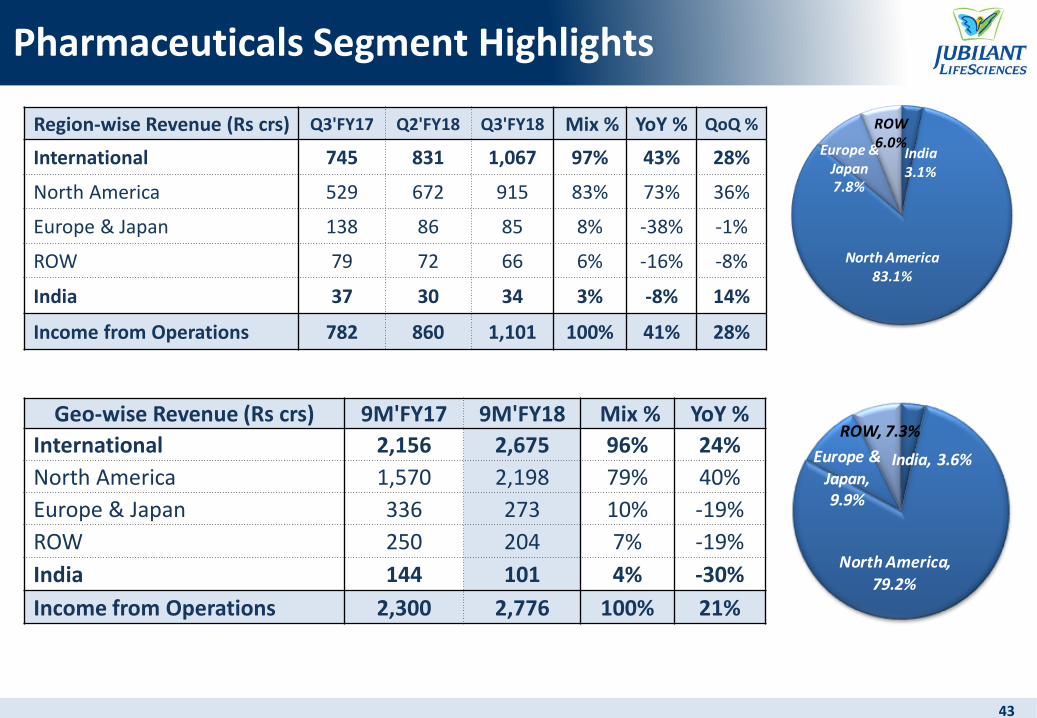
Pharmaceuticals Segment Highlights
Region-wise Revenue (Rs crs) Q3'FY17 Q2'FY18 Q3'FY18 Mix % YoY % QoQ %
International 745 831 1,067 97% 43% 28%
North America 529 672 915 83% 73% 36%
Europe & Japan 138 86 85 8% -38% -1%
ROW 79 72 66 6% -16% -8%
India 37 30 34 3% -8% 14%
Income from Operations 782 860 1,101 100% 41% 28%
India3.1%
North America83.1%
Europe & Japan7.8%
ROW6.0%
Geo-wise Revenue (Rs crs) 9M'FY17 9M'FY18 Mix % YoY %
International 2,156 2,675 96% 24%
North America 1,570 2,198 79% 40%
Europe & Japan 336 273 10% -19%
ROW 250 204 7% -19%
India 144 101 4% -30%
Income from Operations 2,300 2,776 100% 21%
India, 3.6%
North America,
79.2%
Europe & Japan, 9.9%
ROW, 7.3%

4444
Pharmaceuticals Segment Highlights
• Rubyfill installation completed in three sites in the USA during Q3’FY18
• Received approval for Drax Exametazime during the year; Expect to launch in FY19
• Received USFDA approval for new pulmonary indication in Draximage DTPA in Q3’FY18
• Ramp up of CMO business underway with strong order book of US$ 693 Million and addition of three new
clients during the year
• Increasing Lyophilization capacities due to increased demand in both CMO and Allergy Therapy Products
businesses
• Joint inspection of the API facility was completed by USFDA and Health Canada during the quarter. Received
a compliant rating from Health Canada
• Completed capacity addition in the API plant to meet higher demand going forward
• Increasing capacity in Solid Dosage Formulations to be completed in FY19 to meet increasing requirements in
EU, ROW and US markets
4545
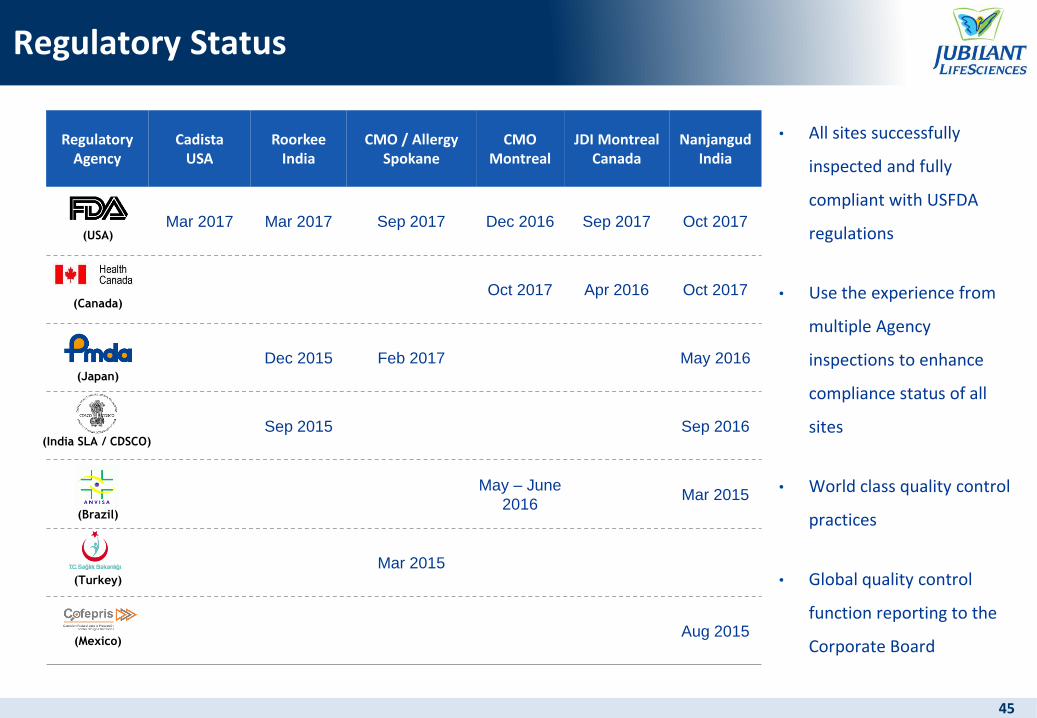
Regulatory Status
• All sites successfully
inspected and fully
compliant with USFDA
regulations
• Use the experience from
multiple Agency
inspections to enhance
compliance status of all
sites
• World class quality control
practices
• Global quality control
function reporting to the
Corporate Board
Regulatory Agency
Cadista USA
RoorkeeIndia
CMO / Allergy Spokane
CMO Montreal
JDI Montreal Canada
NanjangudIndia
Mar 2017 Mar 2017 Sep 2017 Dec 2016 Sep 2017 Oct 2017
Oct 2017 Apr 2016 Oct 2017
Dec 2015 Feb 2017 May 2016
Sep 2015 Sep 2016
May – June
2016Mar 2015
Mar 2015
Aug 2015
(USA)
(Canada)
(Japan)
(India SLA / CDSCO)
(Brazil)
(Turkey)
(Mexico)
4646
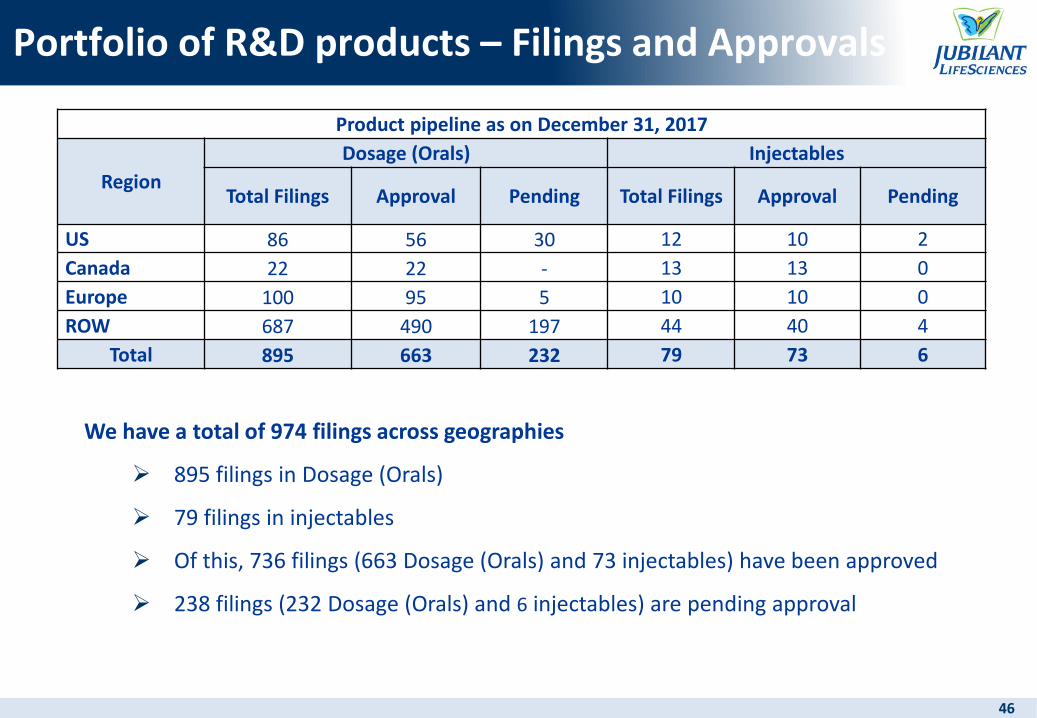
Portfolio of R&D products – Filings and Approvals
Product pipeline as on December 31, 2017
Region
Dosage (Orals) Injectables
Total Filings Approval Pending Total Filings Approval Pending
US 86 56 30 12 10 2
Canada 22 22 - 13 13 0
Europe 100 95 5 10 10 0
ROW 687 490 197 44 40 4
Total 895 663 232 79 73 6
We have a total of 974 filings across geographies
895 filings in Dosage (Orals)
79 filings in injectables
Of this, 736 filings (663 Dosage (Orals) and 73 injectables) have been approved
238 filings (232 Dosage (Orals) and 6 injectables) are pending approval

4747
Portfolio of R&D products – Filings and Approvals
Dosage (Orals) Filed 86 ANDAs in the US
• 56 ANDAs have been approved and 30 ANDAs are pending approval• Filed 3 ANDAs in 9M’FY 18
Made 809 filings in ROW markets including Canada, Europe and Japan• 607 filings have been approved and 202 filings are pending approval
In-licensing of two products in the US market
Injectable and Others Total 4 ANDAs filed and approvals for 2 have been received
Radiopharmaceuticals Filing status as on Dec 31, 2017:
• 8 approved registrations in the US• 13 registrations in Canada which are all approved• 10 registrations in Europe which are all approved• In ROW, we have a total of 44 registrations/licenses, of which 4 are pending for approval
Plan to launch 5 products in next three to four years’ time

48
LSI Segment Highlights
48
Region-wise Revenue (Rs crs) Q3'FY17 Q2'FY18 Q3'FY18 Mix % YoY % QoQ %
International 273 308 371 40% 36% 21%
Europe, North America and Japan 192 187 242 26% 27% 30%
ROW 81 121 129 14% 58% 7%
India 360 430 551 60% 53% 28%
Income from Operations 633 738 922 100% 46% 25%
Region-wise Revenue (Rs crs) 9M'FY17 9M'FY18 Mix % YoY %
International 810 992 42% 22%
Europe, North America and Japan 575 633 27% 10%
ROW 235 358 15% 52%
India 1,022 1,369 58% 34%
Income from Operations 1,832 2,361 100% 29%
India59.7%
Europe, North
America and Japan26.3%
ROW14.0%
India,
58.0%
Europe, North
America and
Japan, 26.8%
ROW, 15.2%
49
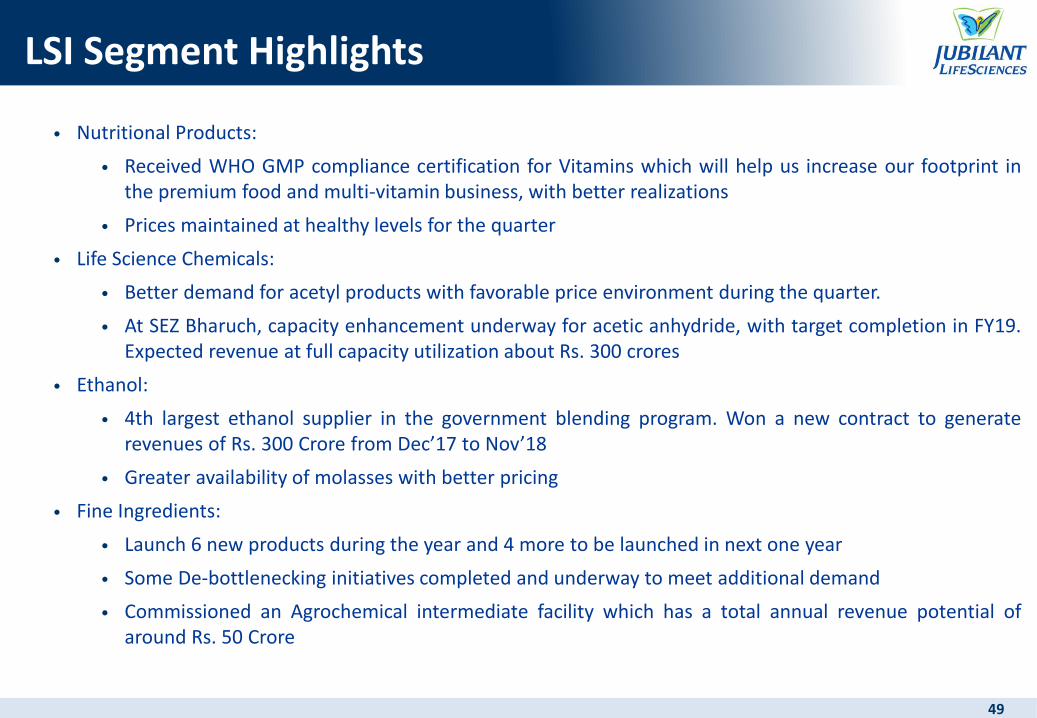
LSI Segment Highlights
• Nutritional Products:
• Received WHO GMP compliance certification for Vitamins which will help us increase our footprint inthe premium food and multi-vitamin business, with better realizations
• Prices maintained at healthy levels for the quarter
• Life Science Chemicals:
• Better demand for acetyl products with favorable price environment during the quarter.
• At SEZ Bharuch, capacity enhancement underway for acetic anhydride, with target completion in FY19.Expected revenue at full capacity utilization about Rs. 300 crores
• Ethanol:
• 4th largest ethanol supplier in the government blending program. Won a new contract to generaterevenues of Rs. 300 Crore from Dec’17 to Nov’18
• Greater availability of molasses with better pricing
• Fine Ingredients:
• Launch 6 new products during the year and 4 more to be launched in next one year
• Some De-bottlenecking initiatives completed and underway to meet additional demand
• Commissioned an Agrochemical intermediate facility which has a total annual revenue potential ofaround Rs. 50 Crore
49
50
Drug Discovery Solutions Segment Highlights
50
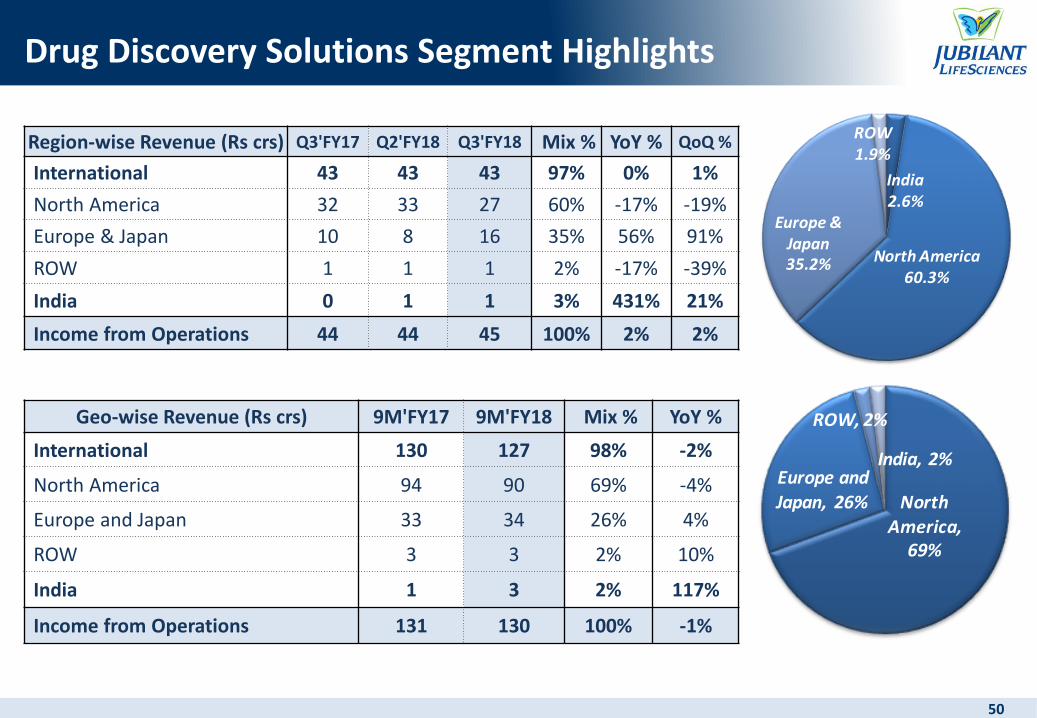
Region-wise Revenue (Rs crs) Q3'FY17 Q2'FY18 Q3'FY18 Mix % YoY % QoQ %
International 43 43 43 97% 0% 1%
North America 32 33 27 60% -17% -19%
Europe & Japan 10 8 16 35% 56% 91%
ROW 1 1 1 2% -17% -39%
India 0 1 1 3% 431% 21%
Income from Operations 44 44 45 100% 2% 2%
India2.6%
North America60.3%
Europe & Japan35.2%
ROW1.9%
Geo-wise Revenue (Rs crs) 9M'FY17 9M'FY18 Mix % YoY %
International 130 127 98% -2%
North America 94 90 69% -4%
Europe and Japan 33 34 26% 4%
ROW 3 3 2% 10%
India 1 3 2% 117%
Income from Operations 131 130 100% -1%
North
America, 69%
Europe and
Japan, 26%
ROW, 2%
India, 2%

51
Expenditure Analysis – Q3’FY18
51
• Material Costs as percentage of sales increase due to higher growth in LSI business• Power & Fuel as percentage of sales stable• Employee benefits expenses increase due to acquisition of Triad• Other Expenses increase due to increase in freight & forwarding and legal, professional &
consultancy charges• Total Finance costs higher QoQ due to increase in charge on stock settlement instrument, a non-
cash debit to P&L, on account of convertible instrument issued to IFC of US$ 58.2 Million as amandatory conversion option at IPO of JPL
Expenses (Rs Crs) Q3'FY17 % of Sales Q2'FY18% of Sales
Q3'FY18% of Sales
YoY Growth
%
QoQ Growth
%Material Cost and Change in Inventory 428 29% 556 34% 707 34% 65% 27%Purchases of stock-in-trade 61 4% 52 3% 79 4% 30% 53%Employee benefits expense 309 21% 369 22% 423 20% 37% 15%Power and fuel expense 83 6% 103 6% 120 6% 45% 16%Others 245 17% 256 16% 322 16% 31% 25%Total Expenses (Excluding Excise Duty)
1,126 77% 1,336 81% 1,651 80% 47% 24%
Depreciation and Amortization 73 5% 79 5% 82 4% 13% 4%Total Finance Costs 98 7% 66 4% 77 4% -22% 17%
Borrowing costs 89 6% 56 3% 57 3% -36% 1%Stock Settlement Instrument Charge 10 1% 10 1% 20 1% 111% 104%

52
Expenditure Analysis – 9M’FY18
52
• Material Costs as percentage of sales increase due to higher growth in LSI business• Power & Fuel as percentage of sales stable• Employee benefits expenses increase due to annual increments and acquisition of Triad• Other Expenses increase due to increase in freight & forwarding and legal, professional &
consultancy charges• Total Finance costs lower 19% YoY. This includes charge on stock settlement instrument, a non-
cash debit to P&L, on account of convertible instrument issued to IFC of US$ 58.2 Million as amandatory conversion option at IPO of JPL
Expenses (Rs Crs) 9M'FY17 % of Sales 9M'FY18 % of Sales YoY Growth %
Material Cost and Change in Inventory 1,266 30% 1,809 34% 43%
Purchases of stock-in-trade 143 3% 169 3% 18%
Employee benefits expense 906 21% 1,102 21% 22%
Power and fuel expense 241 6% 313 6% 30%
Others 667 16% 812 15% 22%
Total Expenses (Excluding Excise Duty) 3,223 76% 4,205 80% 30%
Depreciation and Amortization 216 5% 233 4% 8%
Total Finance Costs 261 6% 212 4% -19%
Borrowing costs 233 5% 168 3% -28%
Stock Settlement Instrument Charge 28 1% 44 1% 55%
53
Debt Profile
53
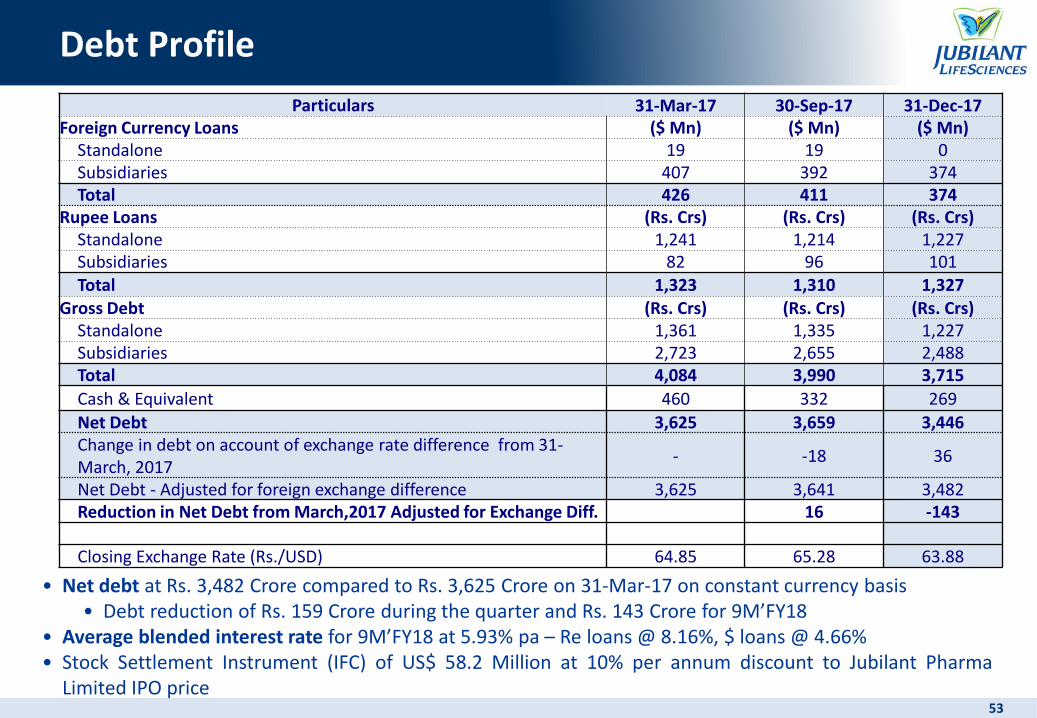
• Net debt at Rs. 3,482 Crore compared to Rs. 3,625 Crore on 31-Mar-17 on constant currency basis• Debt reduction of Rs. 159 Crore during the quarter and Rs. 143 Crore for 9M’FY18
• Average blended interest rate for 9M’FY18 at 5.93% pa – Re loans @ 8.16%, $ loans @ 4.66%• Stock Settlement Instrument (IFC) of US$ 58.2 Million at 10% per annum discount to Jubilant Pharma
Limited IPO price
Particulars 31-Mar-17 30-Sep-17 31-Dec-17Foreign Currency Loans ($ Mn) ($ Mn) ($ Mn)
Standalone 19 19 0 Subsidiaries 407 392 374 Total 426 411 374
Rupee Loans (Rs. Crs) (Rs. Crs) (Rs. Crs)Standalone 1,241 1,214 1,227 Subsidiaries 82 96 101 Total 1,323 1,310 1,327
Gross Debt (Rs. Crs) (Rs. Crs) (Rs. Crs)Standalone 1,361 1,335 1,227 Subsidiaries 2,723 2,655 2,488 Total 4,084 3,990 3,715
Cash & Equivalent 460 332 269
Net Debt 3,625 3,659 3,446Change in debt on account of exchange rate difference from 31-March, 2017
- -18 36
Net Debt - Adjusted for foreign exchange difference 3,625 3,641 3,482Reduction in Net Debt from March,2017 Adjusted for Exchange Diff. 16 -143
Closing Exchange Rate (Rs./USD) 64.85 65.28 63.88
54
Outlook
Very robust business performance driven by Specialty Pharmaceuticals – Injectables and LSI segment.We are confident of delivering outstanding performance going forward in Q4’FY18 and FY19:
• Specialty Pharmaceuticals - Injectables:
• Continue to deliver exceptional performance in Radiopharmaceuticals and Allergy TherapyProducts
• The strategic acquisition of Triad will help to sustain revenue growth in Specialty Injectables
• Healthy order book and new customer addition, supported by higher production, will deliverbetter results in CMO
• Generics: Muted growth outlook due to sustained pricing pressure in US formulations
• Life Science Ingredients:
• Current momentum in revenue growth expected to continue backed by healthy demand andfavorable pricing environment
• Growth in revenues from new product launches, new orders, new capacities coming onstream and debottlenecking of existing plants
• Drug Discovery Solutions: Focus on integrated programs and in-house proprietary research forout licensing of new molecules
We continue our efforts to generate higher operating cash flows and utilize the same for marginalexpansion and reduction of debt to further strengthen the balance sheet with improved financialratios
54

55
Our Vision & Promise
Visit Us:Web Site: www.jubl.com
Jubilant Life Sciences Limited, 1-A, Sector 16-A, NOIDA- 201301 UP, India
For Investors:Ravi AgrawalPh: +91-120-436 1002E-mail: [email protected]
Anupam JainPh: +91-120-436 1021E-mail: [email protected]