bse limited · –national stock exchange of india limited, ... limited, cadbury india limited,...
TRANSCRIPT
1
BSE Limited
Investor Presentation - May, 2017

2
1
Click
Disclaimer
This presentation and the discussion may contain certain words or phrases that are forward - looking statements,which are tentative, based on current expectations of the management of BSE Limited or any of its subsidiaries andassociate companies (“BSE”). Actual results may vary significantly from the forward-looking statements contained inthis presentations due to various risks and uncertainties. These risks and uncertainties include the effect of economicand political conditions in India and outside India, volatility in interest rates and in the securities market, newregulations and Government policies that may impact the businesses of BSE as well as the ability to implement itsstrategy.
The information contained herein is as of the date referenced and BSE does not undertake any obligation to updatethese statements. BSE has obtained all market data and other information from sources believed to be reliable or areits internal estimates, although its accuracy or completeness cannot be guaranteed. Competition numbers are basedon published results and management analysis. For purpose of comparison, following stock exchanges are considered– National Stock Exchange of India Limited, Metropolitan Stock Exchange of India Limited. The presentation relating tofinancial performance herein is reclassified/regrouped based on Management estimates and may not directlycorrespond to published data. The numbers have also been rounded off in the interest of easier understanding. Priorperiod figures have been regrouped/reclassified wherever necessary. All information in this presentation has beenprepared solely by the company and has not been independently verified by anyone else.
This presentation is for information purposes only and does not constitute an offer or recommendation to buy or sellany securities of BSE. Any action taken by you on the basis of the information contained herein is your responsibilityalone and BSE or its directors or employees will not be liable in any manner for the consequences of such action takenby you.
The distribution of this document in certain jurisdictions may be restricted by law and persons into whose possessionthis presentation comes should inform themselves about, and observe, any such restrictions.

3
1
Click
1
2
3
4
5
Overview
Business
State-of-the-art Infrastructure and Technology
Recent Initiatives & Growth Drivers
Performance Highlights
Index
4
1
Click
1
2
3
4
5
Overview
Business
State-of-the-art Infrastructure and Technology
Recent Initiatives & Growth Drivers
Performance Highlights
Index

5
Evolution Of The Exchange - Key Milestones
Date BSE Milestones
16th Mar 2017 BSE Partners with Sentifi for analysing and reporting social media updates
14th Mar 2017 BSE launches futures on S&P BSE SENSEX 50 for investors to achieve portfolio diversification.
3rd Feb 2017 BSE becomes India’s first listed Stock Exchange
16th Jan 2017 Commencement of Trading at India INX
9th Jan 2017Hon’ble Prime Minister of India, Shri Narendra Modi inaugurated India International Exchange (IFSC) Ltd, India’s 1st
International Exchange
7th Dec 2016Asia Index Private Limited launches S&P BSE SENSEX 50 Index to measure the performance of the 50 largest listed companies
at the BSE
9th Jul 2016Shri Arun Jaitley, Hon'ble Minister of Finance Unveiled the Commemorative Postage Stamp Celebrating 140 glorious years of
BSE
09th Jun 2016 BSE announces commencement of trading of Sovereign Gold Bonds
02nd Jan 1986 S&P BSE SENSEX , country's first equity index launched (Base Year:1978-79 =100)
31st Aug 1957 BSE granted permanent recognition under Securities Contracts (Regulation) Act (SCRA)
09th Jul 1875 The Native Share & Stock Broker's Association formed

6
BSE Group
BSE LTD.• NSE Symbol : BSE• Bloomberg Symbol : BSE IN• Reuters Symbol : BSEL.NS
* Pursuant to SEBI Regulations, BSE is required to bring down its stake in CDSL to no more than 24%. BSE has offered to divest 26.05% stake in CDSL in its proposed IPO through Offer for Sale.
BSE GROUP
Exchange
Central Depositary Services Ltd
Indian Clearing Corporation Ltd
Central Counter Party (CCP)
Central Securities Depository (CSD)
100%
BSE Ltd.
SERVICES
Market Place Technologies
Pvt Ltd.Market place Tech
Infra Services Pvt Ltd.
BSE Institute Ltd.
BSE Skills Ltd
BIL- Ryerson Technology Startup Incubator Foundation [Section 8 company] - 51%
Asia Index Pvt Ltd. BSE Sammaan CSR Limited
BSE CSR Integrated Foundation[Section 8 Company]
50.05%*
BFSI Sector Skill Council of India
[Section 8 company]
DOMESTIC IFSC-GIFT CITY
51.22%
100% 100%
CDSL Ventures Ltd.
CDSL Insurance Repository Ltd.
BSE - 80%
BSE Subsidiaries - 20%
ExchangeCentral Counter Party
(CCP )
BSE Investments Ltd.
India International Exchange (IFSC) Ltd.
India International Clearing Corporation
(IFSC) Limited
100%
100%100% 50% 100% 100%

7
Strong National & International Alliances
Technology Cross Listing
Index Business
Strategic Investments
T7 Trading System from Eurex Exchange, subsidiary of Deutsche Boerse
Deutsche Boerse : 4.75%, Board PresenceLIC : 4.75%, Board PresenceSBI : 4.75%
Cross Listing of Sensex with•Korea Stock Exchange•Dubai Gold &
Commodities Exchange•BRICS Alliance – Brazil,
Russia, China (Hong Kong), South Africa
Asia Index Private Limited, a joint venture with S&P Dow Jones Indices for development and marketing of index products

8
Trading Members
36%
Others35%
Foreign Investors
24%
Banks / Financial Institution
5%
Paid up Capital ₹ 10.76 crs. | Face Value per share ₹ 2/- each
As at March 31, 2017
SOME KEY SHAREHOLDERS
Foreign Investors
Smallcap World Fund, Inc. 4.98%
International Exchanges
Deutsche Boerse AG 4.75%
Indian Financial Institutions/ Banks * / Insurance
State Bank of India 4.75%
Life Insurance Corporation of India
4.68%
Foreign Investors
Nomura India Investment Fund Mother Fund
2.79%
GKFF Ventures 2.29%
Caldwell India Holding Inc. 2.19%
Acacia Banyan Partners Limited
1.88%
Indian Investors
Siddharth Balachandran 1.85%
Bajaj Holdings & Investment Ltd.
1.40%
Shareholding Pattern
As at March 31, 2017
9
NameOn BSE
Board sinceBio
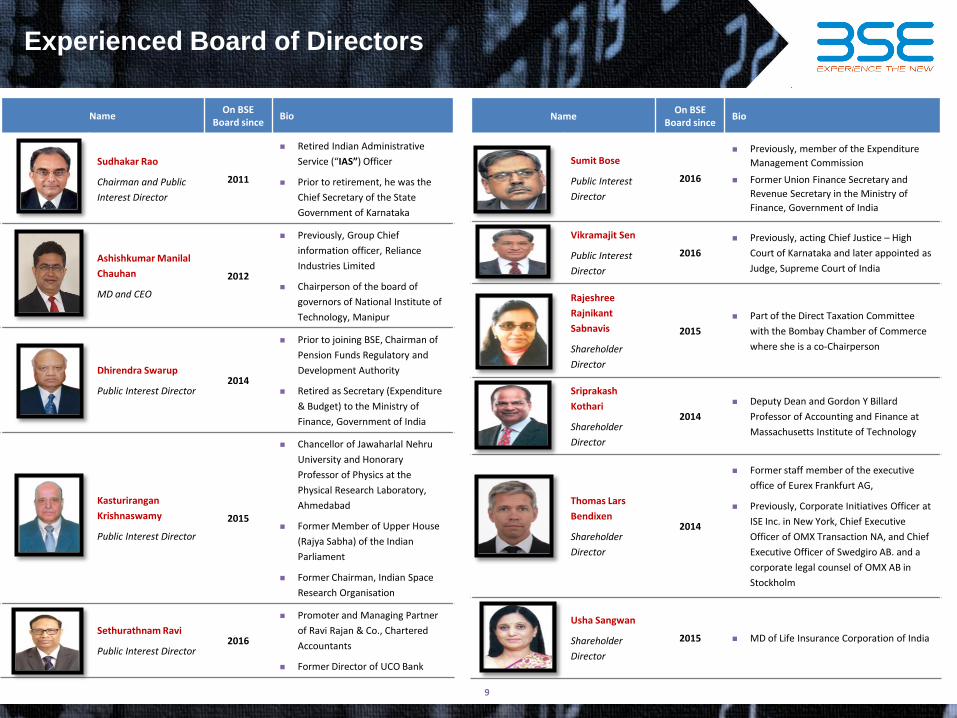
Sumit Bose
Public Interest
Director
2016
Previously, member of the Expenditure
Management Commission
Former Union Finance Secretary and
Revenue Secretary in the Ministry of
Finance, Government of India
Vikramajit Sen
Public Interest
Director
2016
Previously, acting Chief Justice – High
Court of Karnataka and later appointed as
Judge, Supreme Court of India
Rajeshree
Rajnikant
Sabnavis
Shareholder
Director
2015
Part of the Direct Taxation Committee
with the Bombay Chamber of Commerce
where she is a co-Chairperson
Sriprakash
Kothari
Shareholder
Director
2014
Deputy Dean and Gordon Y Billard
Professor of Accounting and Finance at
Massachusetts Institute of Technology
Thomas Lars
Bendixen
Shareholder
Director
2014
Former staff member of the executive
office of Eurex Frankfurt AG,
Previously, Corporate Initiatives Officer at
ISE Inc. in New York, Chief Executive
Officer of OMX Transaction NA, and Chief
Executive Officer of Swedgiro AB. and a
corporate legal counsel of OMX AB in
Stockholm
Usha Sangwan
Shareholder
Director
2015 MD of Life Insurance Corporation of India
Experienced Board of Directors
NameOn BSE
Board sinceBio
Sudhakar Rao
Chairman and Public
Interest Director
2011
Retired Indian Administrative
Service (“IAS”) Officer
Prior to retirement, he was the
Chief Secretary of the State
Government of Karnataka
Ashishkumar Manilal
Chauhan
MD and CEO
2012
Previously, Group Chief
information officer, Reliance
Industries Limited
Chairperson of the board of
governors of National Institute of
Technology, Manipur
Dhirendra Swarup
Public Interest Director2014
Prior to joining BSE, Chairman of
Pension Funds Regulatory and
Development Authority
Retired as Secretary (Expenditure
& Budget) to the Ministry of
Finance, Government of India
Kasturirangan
Krishnaswamy
Public Interest Director
2015
Chancellor of Jawaharlal Nehru
University and Honorary
Professor of Physics at the
Physical Research Laboratory,
Ahmedabad
Former Member of Upper House
(Rajya Sabha) of the Indian
Parliament
Former Chairman, Indian Space
Research Organisation
Sethurathnam Ravi
Public Interest Director2016
Promoter and Managing Partner
of Ravi Rajan & Co., Chartered
Accountants
Former Director of UCO Bank

10
Name Since Bio
Ashishkumar
Manilal Chauhan
MD and CEO
2009
B Tech in Mechanical Engineering from IIT
Bombay and a PGDM from IIM Kolkata
He is one of the founders of India's National
Stock Exchange (“NSE”) where he worked from
1992 to 2000. He is best known as the father of
modern financial derivatives in India due to his
work at NSE
Previously, Group Chief information officer,
Reliance Industries Limited
V.
Balasubramaniam
MD & CEO (INX)
2009
MD & CEO of India International Exchange IFSC
Ltd. (India Inx).He was the erstwhile Chief
Business Officer of BSE heading the business
development encompassing Equities, Equity
Derivatives, Debt, Interest Rate Futures,
Currency Derivatives, Mutual Fund Distribution
platform and SME platform.
Prior to joining BSE, employed with Mukand
Limited, Cadbury India Limited, Nuclear Power
Corporation and Reliance Group
Nehal Vora
Chief Regulatory
Officer
2009
Prior to joining BSE, worked with various
departments in SEBI
More than 19 years of experience in the area
of legal and compliance. He has previously
worked at the Securities and Exchange Board
of India (SEBI) for 10 years and as Director,
Law & Compliance at DSP Merrill Lynch Ltd
heading Broking and Investment Banking
Compliance
Name Since Bio
Nayan Mehta
Chief Financial
Officer
2012
Prior to joining BSE, Credit Analysis & Research Ltd. as
Joint General Manager (Accounts), CFO at Multi
Commodity Exchange of India Limited and has also
worked at the National Stock Exchange.
Represents BSE as the Senior Vice Chairman on the
Executive Board of the South Asian Federation of
Exchanges.
He represents BSE on the Boards of group companies
and joint ventures of BSE and as a member of the
Qualified Audit Review Committee of SEBI.
Neeraj Kulshrestha
Chief of Business
Operations
2015
Prior to BSE he was an Executive Director in Morgan
Stanley India for 10 years. He was earlier with National
Stock Exchange and has managed various functions
like Trading Operations, Inspection and Investigation,
Futures and Options Clearing and Trading. He was also
the CEO of India Index Services Ltd. and Dotex
International Ltd
Heads Trading, Listing , Membership Operations and
listing sales.
27 year experience in Capital markets, which includes
Securities Markets and General Insurance.
Kersi Tavadia
Chief Information
Officer
2010
Prior to joining BSE, employed with Log-in Utility and
InvestSmart Financial Services Limited
30 years of experience in the area of Application
Systems/ IT Infrastructure development and
management, managing all aspects of IT operations in
Financial Services, Capital markets and manufacturing
companies. He has played a leading role in
transforming BSE into the fastest exchange in the
country
Experienced Management Team

11
1
Click
1
2
3
4
5
Overview
Business
State-of-the-art Infrastructure and Technology
Recent Initiatives & Growth Drivers
Performance Highlights
Index

12
Diversified Lines of Business
Revenue Business
Listing Business
Primary Market
Market Business
Secondary Market BSE Star Mutual Funds platform
New Debt Segment
Data Business
Membership Post TradeInformation
Products
• IPO
• EQUITY
• SME
• BOND
• FPO
• BSE Hi-Tech
• Sovereign Gold Bonds
• Mutual Fund-NFO
• Equity Cash
• Small & Medium Enterprises
• Offer to Buy
• Offer for Sale
• Close Ended Mutual Funds
• Corporate Bonds
• Government Securities and Sovereign Gold Bonds
• Equity Derivatives
• Currency Derivatives
• Interest Rate Futures
• Securities lending & borrowing (through ICCL)
• ETF
Order placement platform
OTC Corporate Bond Reporting CP/CD
Trade Repository
Trading Members
Clearing Members
Self-clearing Members
Clearing and Settlement Services through ICCL
Depository Services through CDSL
Market Data
Corporate Data
Corporate Action through SWIFT
End of Day Products
Historical Data
Macro economic Indices
Supporting Business
Technology Index Products TrainingCorporate Social
Responsibility
S&P BSE SENSEX
Sectorial Indices
Sustainability Indices
Thematic Indices
Fixed Income Indices
Training
Certification
Skill Development
Technology Incubator & Accelerator Program
BSE CSR Samman IT services & solutions

13
Business – The Big Picture
Currency OptionsSecond largest globally with
21 million Number of Contracts Traded
Market CapitalizationTenth highest globally with
$ 1.9 trillion
Since April 2015, capital raised through BSE
$ 93 billion [₹ 5.98 trillion]
Currency FuturesThird largest globally with
21 million Number of Contracts Traded
Electronic Book TradesTenth highest globally with
33 millionDuring FY 16-17, BSE listed
2353Privately Placed Debt instruments
Capital Formation
During FY 17-18, BSE listed
213Privately Placed Debt instruments
Global Rankings (March 2017)
$ 31 billion[₹ 2 trillion]Raised through BSE’s electronic bond platform
Source : BSE & WFE

14
Business - Marketshare
15%
36%
17%
26%
85%89%
17%
38%
29%24%
80% 80%
EQUITY CASH CURRENCY DERIVATIVES
INTEREST RATE DERIVATIVES
DEBT / FIXED INCOME MUTUAL FUND STAR PLATFORM
SMALL & MEDIUM ENTERPRISES (SME)
FY15-16 FY16-17
* Marketshare in Mutual Fund StAR Platform represents the purchase / redemption orders executed during the year.** Marketshare in SME Segment represents number of companies listed in SME segment during the year.

15
Business - Equity Markets
Disclaimer
2,195 2,078
3,518
2,996
4,025
FY12-13 FY13-14 FY14-15 FY15-16 FY16-17
Average Daily Turnover - Equity (₹ crore)
12,94,034 14,47,054
29,26,201
16,66,756 15,80,041
FY12-13 FY13-14 FY14-15 FY15-16 FY16-17
Average Daily Number of Trades - Equity Significant increase in Transaction Charges Income inFY16-17 mainly due to differential charging oftransaction charges on select exclusive group ofsecurities with effect from 1st January, 2016 at the rateof 0.1% on value traded.
309 286
485 531
1,174
FY12-13 FY13-14 FY14-15 FY15-16 FY16-17
Transaction Charges Income - Equity (₹ million)
With effect from 3rd April, 2017, transaction charges onremaining securities levied on per trade basis instead ofad valorem basis followed earlier.

16
Business – Membership
Continuous interaction with members in normal course of business and through various programs
Promote Algorithmic Traders
BSE bears software license costs for algorithmic
trading and market access, infrastructure costs on
co-location rack space, among other costs
Investor Education Programs
Jointly established a series of investor education
programs with members and broker associations to
have open communication with members and
increase exposure to investors
Equity Cash
– Self-clearing Members
Equity Derivatives
– Trading Members
Currency Derivatives
– Trading Members
1337
1353
13611364
FY13-14 FY14-15 FY15-16 FY16-17
937
973
991 992
FY13-14 FY14-15 FY15-16 FY16-17
304
410
485516
FY13-14 FY14-15 FY15-16 FY16-17

17
Business – Currency Derivatives
- 2
16
45
FY13-14 FY14-15 FY15-16 FY16-17
Transaction Charges Income- Currency Derivatives (₹ million)
2,615 5,492
7,646 7,470 401
2,527
3,775 5,636
FY13-14 FY14-15 FY15-16 FY16-17
Average Daily Turnover - Currency Derivatives (₹ crore)
Currency Futures Currency Options
4,19,840 8,92,582
11,59,652 11,08,842 63,583
4,06,477
5,76,822 8,35,064
FY13-14 FY14-15 FY15-16 FY16-17
Average Daily Number of Contracts - Currency Derivatives
Currency Futures Currency Options
35,558 4,74,393
9,00,203 10,68,194 5,974 1,90,275
3,87,638
5,30,152
FY13-14 FY14-15 FY15-16 FY16-17
Open Interest (End of Year) - Currency Derivatives
Currency Futures Currency Options
18
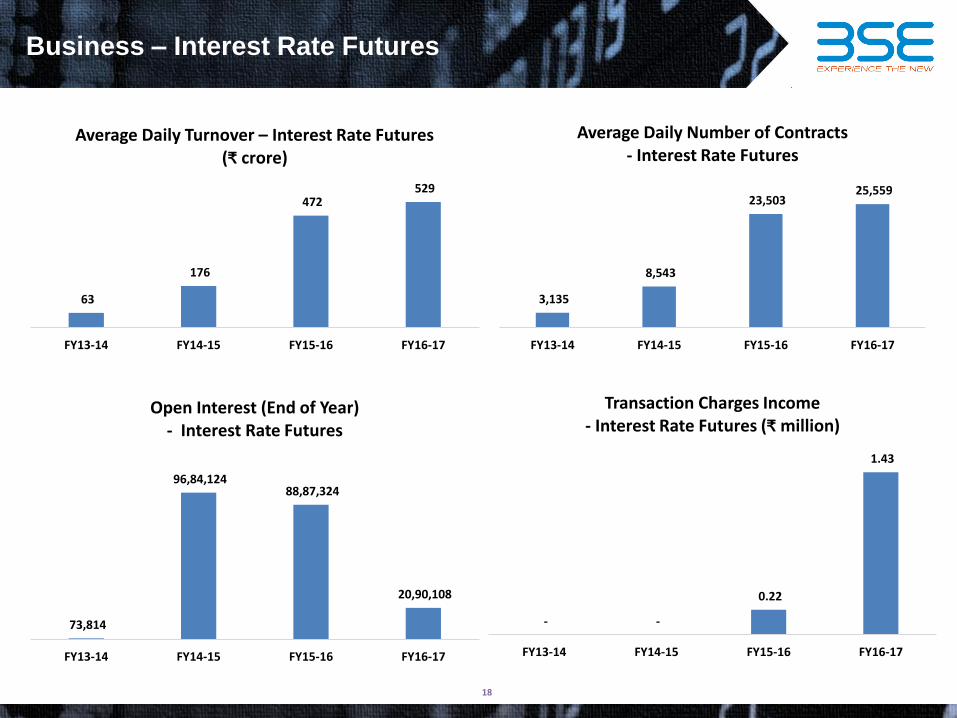
Business – Interest Rate Futures
63
176
472 529
FY13-14 FY14-15 FY15-16 FY16-17
Average Daily Turnover – Interest Rate Futures (₹ crore)
3,135
8,543
23,503 25,559
FY13-14 FY14-15 FY15-16 FY16-17
Average Daily Number of Contracts - Interest Rate Futures
73,814
96,84,124 88,87,324
20,90,108
FY13-14 FY14-15 FY15-16 FY16-17
Open Interest (End of Year) - Interest Rate Futures
- -
0.22
1.43
FY13-14 FY14-15 FY15-16 FY16-17
Transaction Charges Income - Interest Rate Futures (₹ million)

19
Business - Mutual Fund Distribution Platform-StAR MF
PLATFORM FEATURES
• Completely digital- Demat and Non-Demat/Mutual Fund transactions, while facilitating the benefits of Physical mode
• 24x7 order acceptance
• SGB enabled for MFDs
• 6 day order holding facility
• Paperless SIP
• Any day STP and SWP
• Paperless bank Mandate
CONNECTIVITY & USPs
• Unique overnight investments framework
• Multi-mode of platform access
• Completely digital and REAL Time Investors registration / onboarding
• Widely accepted by NDs / Custodians / Brokers / IFA Platform / New age Digital Distributors / IFAs,
• E-submission and online MFD Registration
Number of Mutual Fund Distributors as on May 25, 2017
3,448
Number of Mutual Fundsas on May 25, 2017
37
Number of Mutual Fund Schemes as on Apr 30, 2017
7,925

20
Business – Mutual Fund Distribution Platform-StAR MF (cont’d)
4,131 5,595 10,494
44,235
74,301
FY12-13 FY13-14 FY14-15 FY15-16 FY16-17
Total Turnover - Mutual Fund (₹ crore)
2,80,495 5,84,453
15,87,735
32,80,067
64,83,468
FY12-13 FY13-14 FY14-15 FY15-16 FY16-17
Number of Orders - Mutual Fund
Orders Processed every month
~ 10 lakh
SIPs added every month
~ 65,000
April 2017Transacted volume through BSE StAR MF
LIQUID SCHEMES
₹ 4,639 crore
OTHER SCHEMES
₹ 2,165 crore
Some Key Figures
21
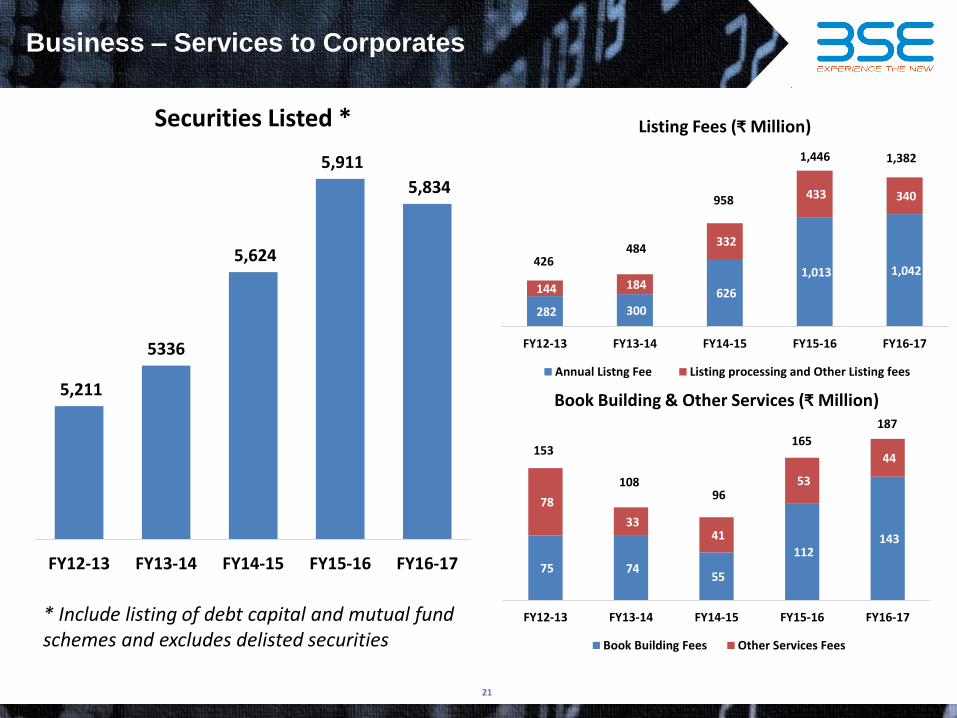
Business – Services to Corporates
5,211
5336
5,624
5,911
5,834
FY12-13 FY13-14 FY14-15 FY15-16 FY16-17
Securities Listed *
282 300
626
1,013 1,042
144 184
332
433 340
FY12-13 FY13-14 FY14-15 FY15-16 FY16-17
Listing Fees (₹ Million)
Annual Listng Fee Listing processing and Other Listing fees
958
1,446 1,382
75 74 55
112 143
78
33 41
53
44
FY12-13 FY13-14 FY14-15 FY15-16 FY16-17
Book Building & Other Services (₹ Million)
Book Building Fees Other Services Fees
426484
153
10896
165
187
* Include listing of debt capital and mutual fund schemes and excludes delisted securities

22
Business – Small & Medium Enterprises (SME)
17
43
89
131
178 181
FY12-13 FY13-14 FY14-15 FY15-16 FY16-17 24-05-2017
No. of Companies Listed (As on End of Year)
- - -
16
25
28
FY12-13 FY13-14 FY14-15 FY15-16 FY16-17 24-05-2017
No. of Companies Migrated to Main Board(As on End of Year)
61
1016
2731
13951589
265
FY12-13 FY13-14 FY14-15 FY15-16 FY16-17 24-05-2017
Total Turnover (₹ in Crore)
8
14
1820
23
FY12-13 FY13-14 FY14-15 FY15-16 FY16-17
Transaction Charges (₹ in Million)

23
Business - Data Business Products
Market Data
Equity Level 1 – Real-time & 1 minute Snapshots
Equity Level 2 – Real-time
Indices – Real-time & 1 minute Snapshots
Derivatives (Equity , Index , Currency & Interest Rate Derivatives) – Real-time
Corporate
Data
Corporate Announcement
Financial Results
Shareholding Pattern
Corporate Action - through SWIFT
End of day or Historical
Quotation files
Annual report
Daily Bulletin
Sector Classification
Trade and Order book data
Market Data products marketed by Deutsche Boerse outside India

24
BSE Hi-Tech is a platform that enables a young fast growing company to list on an exchange with
much easier criteria and gain access to capital from a larger base of sophisticated investors.
Positioning
Platform for well-established
companies, more
stable stocks
Platform for new age, high-tech /
innovativestocks that are more growth
oriented
Increased visibility with brand creation, researchcoverage and media coverage
Access to funds through well-established platformand mechanism
High credibility amongst all stakeholders Listing entails robust corporate governance and
internal controls and systems Sophisticated investors enabling better valuations Companies can attract global investors as FPIs Merger & acquisitions made easier and swifter with
company’s stock used as currency Compensating employees without affecting cash
flows through ESOPs becomes a powerful tool toattract and retain
THE INVESTOR
ADVANTAGE
A credible exit route for earlyinvestors
VC/PE investors can churn theirportfolio
The platform will offer a new assetclass to investors
Listing leads to better and timelydisclosures and thus also protectsthe interest of the investors
THE COMPANY ADVANTAGE
Business – BSE HI-TECH Platform

25
Business – India International Exchange (IFSC)
Asset Classes & Contracts
Equity Index Futures Sensex, Sensex 50
Equity Stock Futures Reliance Industries Limited. HDFC Bank Limited, Axis Bank Limited, Infosys Limited, Tata Consultancy Services Limited, Maruti Suzuki India Limited, Tata Motors Limited, ICICI Bank Limited, Larsen & Toubro Limited and State Bank of India Limited
Commodity Futures Gold, Silver and Copper
Note : Contracts would be introduced in other assets classes such as Currency Derivatives after necessary regulatory approvals. The above list represents the contracts currently being allowed for trading on the international exchange currently.
Commenced Operations from 16th January, 2017
Highest Number of trades in a day
7,141on 5th May 2017
Highest Turnover in a day
$ 102 Million on 5th May 2017
Exchange Daily Trading Hours
21.30 Hours 4.30 am to 5.00 pm and 5.30 pm to 2.30 am (Indian Standard Time)

26
Business – India International Exchange (IFSC) (cont’d)
11 54110
211
48637
335
26
34
0
100
200
300
400
500
600
700
800
900
Jan-17 Feb-17 Mar-17 Apr-17 May-17*
Total Turnover (US $ mn)
Index Futures Stock Futures Commodity Futures
1,217 5,76610,877
15,759
39,507
1,428
22,506
644
773
0
10,000
20,000
30,000
40,000
50,000
60,000
70,000
Jan-17 Feb-17 Mar-17 Apr-17 May-17*
Total Number of Trades
Index Futures Stock Futures Commodity Futures
* May-17 data upto May 24, 2017
110
11
855
54
274
62,786
17,831
10,877
1,2175,766

27
1
Click
1
2
3
4
5
Overview
Business
State-of-the-art Infrastructure and Technology
Recent Initiatives & Growth Drivers
Performance Highlights
Index

28
State-of-the-art Infrastructure & Technology
Technology is a key component of operations and business strategy and we regard it as an
important component of success
1. Includes Computer Technology Related Expenses and Spend on Technology Programme.
Screen based trading system
Available under license to members of the exchange as
well as their clients
All equity cash, equity derivatives and currency derivatives
trades are executed on BOLT+
Migrated various segments onto BOLT+
- Currency derivatives: Nov 2013
- Equity Derivatives: Feb 2014
- Equity Cash: Apr 2014
Technology Spend as % of Total Revenue1
All platforms are interconnected and operated through the same
network and workstation, which provides market participants a
seamless experience and efficient operation
Real-time risk management system that conducts real-time
calculations of members' margins and limits
Standard Portfolio Analysis of Risk ("SPAN") margin system, an
industry-standard margin system, used by over 30 exchanges
and clearing organizations worldwide, to evaluate the overall
risk in a portfolio and accurately match margins to risk
Entered into strategic technology alliance with Eurex in Mar 2013,
so as to deploy the Eurex new generation trading system, the T7,
for trading in various segments
Co-location services and high-speed Ethernet connections
offered to market participants to enable low latency trading
717 642
704
806
1,056
FY12-13 FY13-14 FY14-15 FY15-16 FY16-17
11%13% 13%12% 12%

29
BOLT PLUS ON WEB (BoW)
One Window with Multiple Utilities
Trading
• BSE
• NSE
• MCX
• NCDEX
Segments
• Equity – F&O –Currency – IRF - OFS – Mutual Fund – SLB –Debt – ITP
• Equity – F&O –Currency
• Commodities
• Commodities
For
• Dealers
• Investors
• Admin for HO
• Multiple Mini Admin for Regions & Branches
• RMS
Connectivity
• Leased Line
• Internet
Application for Desktop & Mobile
• Web links for 100 + Visual Operational Help Video’s
• Tip of the Day prompt on login –notifying what all can be done
• Member Branding through EXE
• Bolt + on Web (BoW) – FREE OF COST FOR ALL MEMBER
• Trade commencement in one day
• No Extra hardware like TAP-IML server required.
• Dual Market Depth Display• AMO – After Market Orders• Time base Square up for Intraday
transections and One click square up on M2M Alert.
• Corporate Information Analysis for Bonus, Rights, Dividend, Board
Meetings, Scheme • Top Gainers / Top Losers• Most Active by VOLUME / VALUE
• User define short keys -predefine Key Mapping Styles for ODIN-BOLT
• Auto upgrade notification • Easy mechanism to activate
locked User ID (just fetch Password)
• Market Movement with chart with user defined time frame
• NEWS Plus with RSS feeds and Twitter

30
New Trading Architecture – BOLT PLUS
Bolt Plus Live
•Products available for trading
-Currency Derivatives – 29th November, 2013
-Interest Rates Futures - 28th January,2014
-Equity Derivatives - 10th February,2014
-Equity – 7th April,2014
Member Access
• API based access
- Through existing IML API
- Advanced High performance APIs (ETI, MDI/EMDI)
Peripheral Systems connecting to BOLT Plus
• Reference Data, Risk Management, Surveillance, Clearing & Settlement, Data Warehouse
Performance Testing & Benchmarking
• Latency : < 6 µs (Gateway in to Gateway out)
- Network Latency for Colo Users: 18 µs
- Throughput Capacity: 5 lacs order per second
- Scalability: Horizontally scalable by adding partitions
30
Fastest Co-location
• BSE is the fastest Exchange in the world with a speed of 6 microseconds.• BSE provides the fastest Colocation service in India with round trip network latency of less than 20 microseconds.• At BSE Colocation, Exchange response for an order has round trip latency of less than 30 microseconds.• Market access across Equity, Equity Derivatives and Currency Derivatives segments.• Extension of Precision Time Protocol (PTP) from BSE’s Grandmaster clock to the Colocation enables members to synchronize with the Exchange
clock.• Equitable distribution of market data to all members by usage of same length cables for all members.• Full order book (EOBI) broadcast is provided to Colocation members.• State-of-the-art Data Centre services from NTT – Netmagic• Low latency 10 Gbps Solarflare NIC cards (Model No. : SFN7322F) will be provided to members by BSE.

31
1
Click
1
2
3
4
5
Overview
Business
State-of-the-art Infrastructure and Technology
Recent Initiatives & Growth Drivers
Performance Highlights
Index

32
Recent Initiatives & Growth Drivers
Recent Initiatives Growth Drivers
India International Exchange (IFSC)
Operations Commenced on 16th Jan, 2017
Index Futures, Stock Futures and Commodity Futures Contracts introduced
Introduction of new contracts in Index Derivatives, Stock Derivatives, Commodity Derivatives, Currency Derivatives, Interest Rate Derivatives and other contracts from time to time.
Utilization of the Exchange platform to raise funds at a global level. Listing of securities from across the globe on the Exchange. Admission to membership of brokerage and hedge firms from across
the globe. Introduction of appropriate fee structure based on the growth and
competition strategy.
Equity Segment
Introduction of transaction charges based on number of trades in place of ad valorem charges on equity scrips other than exclusive and non-liquid groups with effect from 3rd
April, 2017
Initiation of a virtuous cycle of higher liquidity and turnover in equity segment through increased participation of larger market participants in this segment.

33
Recent Initiatives Growth Drivers
Interest on Deposits & Margins in certain segments
Indian Clearing Corporation becomes the first securities clearing corporation in India to pay interest on margins and deposits in currency derivatives and equity derivatives segment with effect from 3rd April, 2017
Higher placement of margins and deposits at Indian Clearing Corporation to drive higher liquidity to currency derivatives and equity derivatives segment.
Mutual Fund StAR Platform
In discussion with various mutual funds and Association of Mutual Funds of India to introduce charging of fees.
Commencement of a steady source of revenue which would grow with increasing participation of investors in mutual funds.
Small & Medium Enterprises Segment
Ongoing thrust to encourage SME companies to list on Exchange
Increase in steady annual source of listing revenue. Growth in turnover on Exchange over time especially after migration
of SME companies to Main Board of the Exchange.
Recent Initiatives & Growth Drivers (cont’d)
34
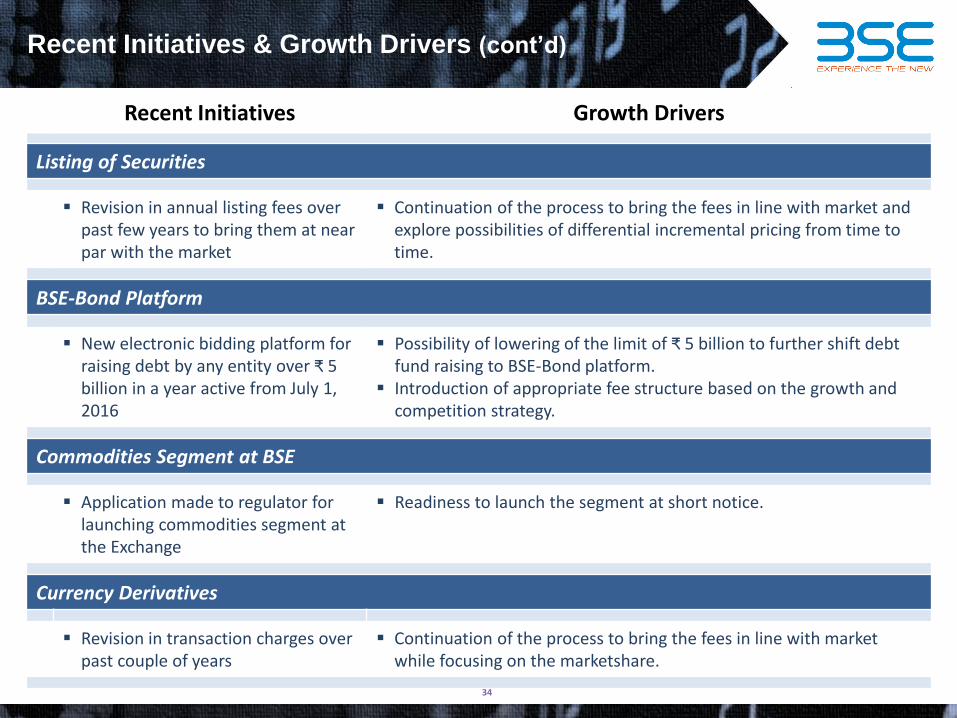
Recent Initiatives Growth Drivers
Listing of Securities
Revision in annual listing fees over past few years to bring them at near par with the market
Continuation of the process to bring the fees in line with market and explore possibilities of differential incremental pricing from time to time.
BSE-Bond Platform
New electronic bidding platform for raising debt by any entity over ₹ 5billion in a year active from July 1, 2016
Possibility of lowering of the limit of ₹ 5 billion to further shift debt fund raising to BSE-Bond platform.
Introduction of appropriate fee structure based on the growth and competition strategy.
Commodities Segment at BSE
Application made to regulator forlaunching commodities segment at the Exchange
Readiness to launch the segment at short notice.
Currency Derivatives
Revision in transaction charges over past couple of years
Continuation of the process to bring the fees in line with market while focusing on the marketshare.
Recent Initiatives & Growth Drivers (cont’d)

35
Macro-economic Factors – Underpenetrated Indian Markets
With 7-8% GDP growth rate, India is the preferred
investment destination
269 new FPIs registered with SEBI in April 2016
FPIs granted permanent registration compared to
approvals for 1 / 5 years earlier
Global Inflow of Funds
Historical preference for physical assets but that is changing with
increasing financial awareness
Increase in India equity indices has improved confidence
Tax breaks further incentivizing to invest
5% 14% 15% 20% 29% 42%
India China Brazil Indonesia W.Europe
US
India’s equity savings as a percentage of financial savings is substantially lower than other countries
Participation by Retail Investors
Room to introduce innovative derivative products like weather
derivatives, energy derivatives and credit derivatives
Potential easing of restriction of FIIs trading in currency futures
Alliances with exchanges from various countries to cross-list
equity-based products
Introduction of more agricultural commodities and other global
commodities for trading
New Products and Initiatives
India's population is estimated to surpass China's
population within a decade
60% % of India’s total population in working age category
Demographic Dividend
GST will lead to tax simplification which in turn will boost GDP
EPFO allowed to invest in equity markets – will boost equity investments in India
Government Initiatives
Correlated to market capitalization / activity which in turn is
linked to GDP
Scope for Market Cap / GDP ratio to increase to pre-financial crisis levels
Compared to other geographies, Market Cap / GDP ratio has room
for improvement
86%53%
96% 96%
55%
69%
61%
76%
73%
CY
06
CY
07
CY
08
CY
09
CY
10
CY
11
CY
12
CY
13
CY
14
CY
15
73% 99% 88%
India World Average BRICS
GDP Factor
147%
Source : World Bank & Care Research
Recent Initiatives & Growth Drivers (cont’d)

36
1
Click
1
2
3
4
5
Overview
Business
State-of-the-art Infrastructure and Technology
Recent Initiatives & Growth Drivers
Performance Highlights
Index

37
Transaction Charges Linked to
Market Activity Directly proportional to market activity levels
Income from Depository Services
Recurring as well as Linked to Market Activity
Includes recurring annual charges as well as custodian services, which are to an extent linked to market activity
Treasury Income on Clearing and Settlement Funds
Linked to Market Activity to an Extent
Linked to interest rates and, to an extent, market activity since that would lead to more margin being deposited by members
Other Securities Services Recurring Primarily consists of charges recovered from members for network connectivity
Services to Corporates Recurring
Mostly derived from listing income that is not impacted by market activity
Dependent on number of listed entities and hence is a recurring revenue stream
Potential for increase if amount charged is increased
Data Dissemination Fees Recurring Impacted primarily due to level of subscriptions and revision in pricing policies
Contributes only 4-5% in India compared to 10-25% in developed markets
Income From Investments and Deposits
Recurring Linked to interest rates
Other Income Recurring Mostly derived from rent and training institute etc., which are stable sources of income
Integrated Business Model
• Multiple contact points with members and market participants provides the ability to generate revenue from
multiple levels of the business
Primary Trading Clearing & Settlement Depository
1
2
3
4
5
6
7
8
Linked to Market Activity Recurring

38
March Year Ending (₹ in ) 2013 2014 2015 2016 2017
Transaction Charges 317 294 505 550 1,224
Income from Depository Services 905 871 1,046 1,227 1,458
Treasury Income on Clearing and Settlement Funds
339 439 532 413 405
Others 375 268 254 223 270
Securities Services 1,936 1,872 2,337 2,413 3,357
Services to Corporates 579 591 1,054 1,611 1,569
Data Dissemination Fees 224 204 221 224 247
Income From Investments and Deposits 2,356 2,183 2,226 2,102 2,380
Other Income 434 448 410 351 455
Total Income 5,529 5,298 6,248 6,701 8,008
% Growth -4.2% 17.9% 7.3% 19.5%
Figures as per restated IGAAP financials for FY12-13 to FY14-15 and Ind-AS financials for FY15-16 to FY16-17
Consolidated Profit & Loss
1
2
3
4
1 Increase in transaction charges in certain groupsof securities in Equity Segment & increase in average daily turnover In Equity Segment
Increase in annual listingFees & increase in number of securities listed
2
Increase in investmentincome mainly due to sale of bonds
3
Increase mainly due to Interest income on tax refunds during the year
4
Steady increase in Operational Income over past 5 years

39
Consolidated Profit & Loss (cont’d)
Total Income 5,529 5,298 6,248 6,701 8,008
Employee Expenses 772 854 999 1,074 1,415
Technology Cost & Technology Program 717 642 704 806 1,056
Regulatory Costs 240 250 607 544 415
Other Expenses 691 677 885 1,152 1,317
EBITDA 3,109 2,875 3,053 3,125 3,805
EBITDA Margin 56% 54% 49% 47% 48%
Depreciation & Amortization 283 324 588 537 540
Finance Expenses 25 4 6 3 10
Exceptional Items
Liquidity Enhancement Incentive Prog ("LEIPs") 955 613 343 172 -
Settlement Guarantee Fund ("SGF") - - - 514 208
Other Exceptional Items 24 - 165 -221 -
Profit before Tax & Minority/Assoc Share 1,822 1,934 1,951 2,120 3,047
Taxes 377 340 438 371 406
Minority / Associate Share 257 242 216 420 435
Net Profit 1,188 1,352 1,297 1,329 2,206
Net Profit Margin 21% 26% 21% 20% 28%
1
2
3
3
4
1 One time ex-gratia payments & additional cost incurred on International Exchange
Increase in technology program by ₹ 94 mn
2
Decrease due to change in regulations regarding contribution to SGF
3
Increase mainly due to higher provisioning toward receivables & additional costs incurred on International Exchange
4
Figures as per restated IGAAP financials for FY12-13 to FY14-15 and Ind-AS financials for FY15-16 to FY16-17
Higher profit and net profit margin due to growing operational income and decrease in exceptional items

40
Key Performance Indicators
Composition of Total Income
(₹ in Million)
Financial Overview – Consolidated
35%
36%
37%
36%
42%
10%
11%
17%
24%
19%
43%
41%
35%
31%
30%
8%
8%
7%
6%
6%
4%
4%
4%
3%
3%
FY12-13
FY13-14
FY14-15
FY15-16
FY16-17
Securities Services Listing Income Investment Income Other income Data dissemination fees
5,529 5,298 6,248 6,701 8,008
1,188 1,352 1,297 1,329
2,206 21%
26%
21% 20%
28%
-5%
0%
5%
10%
15%
20%
25%
30%
-
2,000
4,000
6,000
8,000
10,000
12,000
FY12-13 FY13-14 FY14-15 FY15-16 FY16-17
Total Revenue Net Profit Net Margin
Figures as per restated IGAAP financials for FY12-13 to FY14-15 and Ind-AS financials for FY15-16 to FY16-17

41
Financial Overview
Figures as per restated IGAAP financials for FY12-13 to FY14-15 and Ind-AS financials for FY15-16 to FY16-17# Dividend pay-out ratio is calculated based on Standalone Profit
22,889 23,708
24,609 25,229
26,624
FY12-13 FY13-14 FY14-15 FY15-16 FY16-17
Consolidated Net-worth (₹ million)
8 8 10 15
28
124%
66%
87%74%
93%
0%
20%
40%
60%
80%
100%
120%
140%
-
10
20
30
40
50
60
70
80
FY12-13 FY13-14 FY14-15 FY15-16 FY16-17
Dividend per share (₹) & Pay-out Ratio
Dividend Per Share Dividend Payout Ratio
22.48 25.57 23.77 24.35
40.41
FY12-13 FY13-14 FY14-15 FY15-16 FY16-17
Earnings per share (₹)
42
This document has been prepared exclusively for the benefit and internal use of the recipient and does not carry any right ofreproduction or disclosure. Neither this document nor any of its contents maybe used for any other purpose without the priorwritten consent of BSE Ltd. (the “Company”).
In preparing this document, the Company has relied upon and assumed, without any independent verification, the accuracy and completeness of all information utilized within this document. This document contains certain assumptions, which the Company considers reasonable at this time and which are subject to change. Any calculations or forecasts produced within this documentare indicative and subject to change. No representation or warranty is given by the Company as to the accuracy, reasonableness o rcompleteness of any idea and/or assumption utilized within this document.
Recipients should not construe any of the contents within this document as advice relating to business, financial, legal, taxation, or investment matters and are advised to consult their own business, financial, legal, taxation and other advisors . This document does not constitute an offer for sale, or an invitation to subscribe for, or purchase equity shares or other assets or securities of theCompany and the information contained herein shall not form the basis of any contract. This document is also not meant to be or to constitute any offer for any transaction.
THANK YOU
INVESTOR RELATIONS CONTACT :Yatin PadiaHead – Investor Relations +91 22 2272 8516 [email protected]