bses - delhi electricity distribution · pdf filebses - delhi electricity distribution company...
TRANSCRIPT
BSES - Delhi Electricity Distribution Company
Facts you should know
1
Cost Components of Distribution company (Discom)Cost Components of Distribution company (Discom)
2
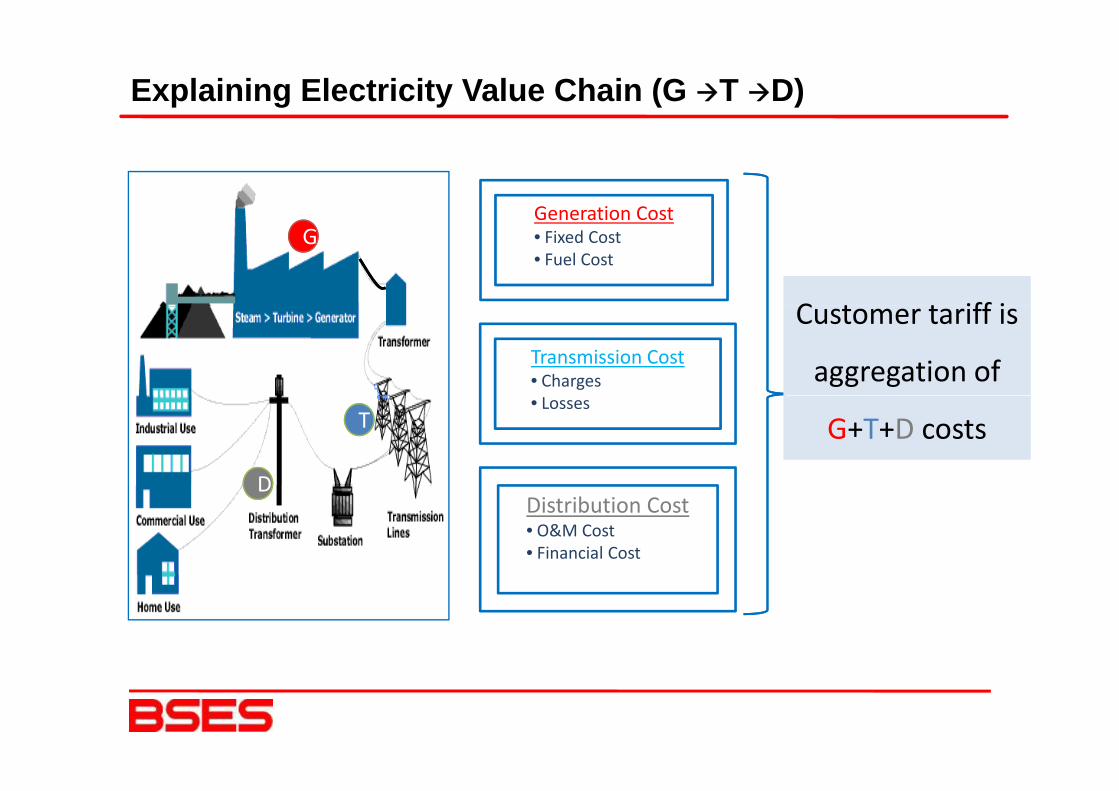
Explaining Electricity Value Chain (G T D)
Generation CostGeneration Cost• Fixed Cost• Fuel Cost
C t t iff i
GG
Transmission Cost• Charges
Customer tariff is
aggregation of • Losses
G+T+D costs
DD
TT
Distribution Cost• O&M Cost • Financial Cost
DD
3
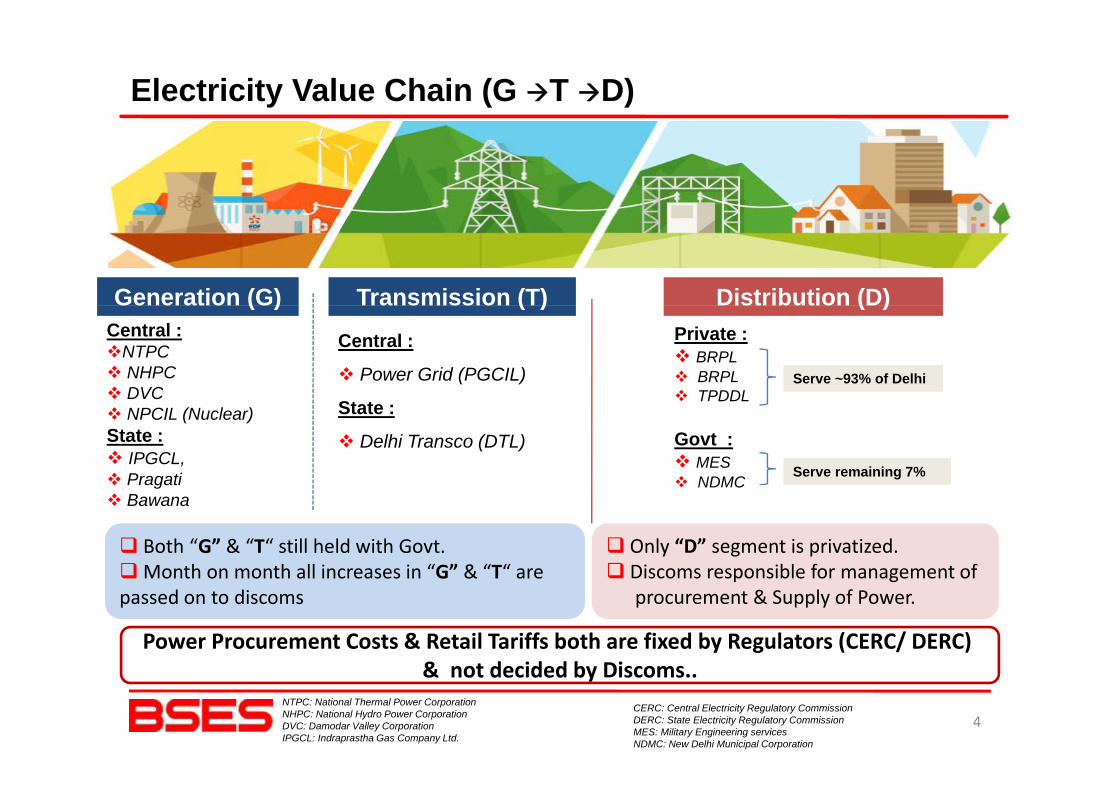
Electricity Value Chain (G T D)
Generation (G) Transmission (T) Distribution (D)( ) ( ) ( )Central :
NTPCNHPCDVC
Central :
Power Grid (PGCIL)
Private : BRPLBRPLTPDDL
Serve ~93% of DelhiDVCNPCIL (Nuclear)
State :IPGCL,Pragati
State :
Delhi Transco (DTL)
TPDDL
Govt :MES NDMC
Serve remaining 7%gBawana
NDMC
Both “G” & “T“ still held with Govt. Month on month all increases in “G” & “T“ are
Only “D” segment is privatized.Discoms responsible for management ofMonth on month all increases in G & T are
passed on to discomsDiscoms responsible for management of procurement & Supply of Power.
Power Procurement Costs & Retail Tariffs both are fixed by Regulators (CERC/ DERC) & t d id d b Di
4
& not decided by Discoms..CERC: Central Electricity Regulatory CommissionDERC: State Electricity Regulatory CommissionMES: Military Engineering servicesNDMC: New Delhi Municipal Corporation
NTPC: National Thermal Power CorporationNHPC: National Hydro Power CorporationDVC: Damodar Valley CorporationIPGCL: Indraprastha Gas Company Ltd.
Precarious state of BSES Discoms
1) Financial Cost (Incl Return) Financial & other Costs
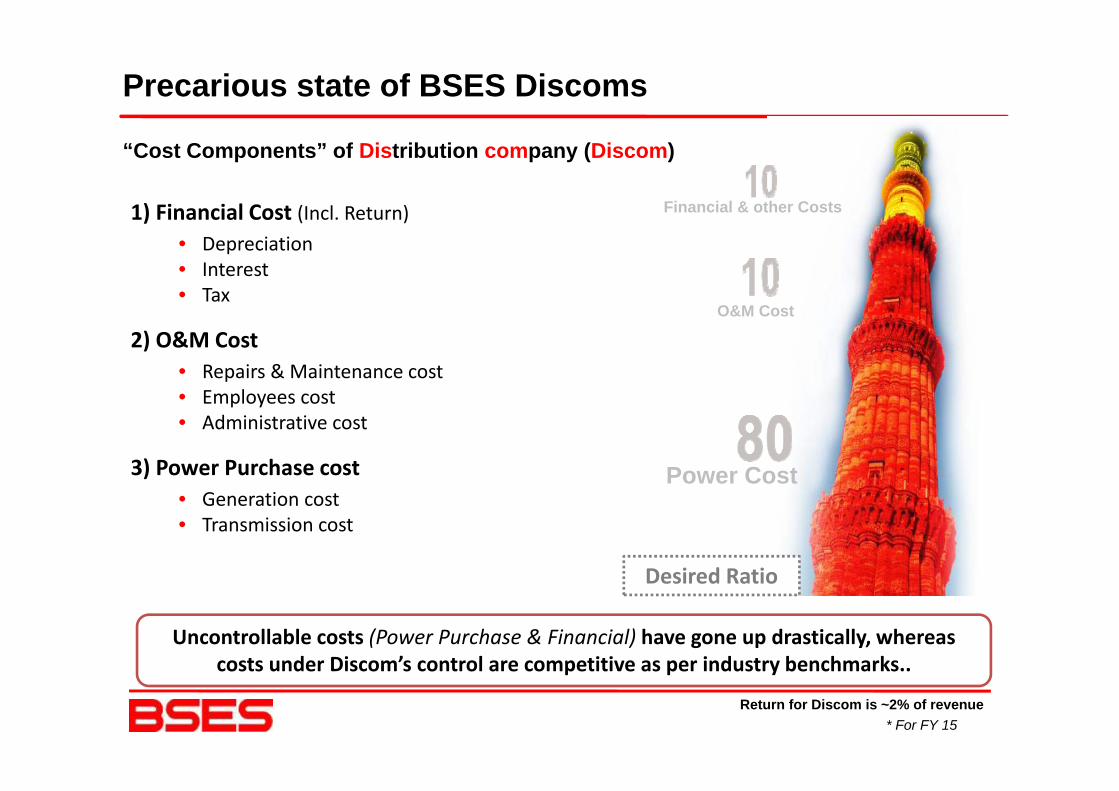
“Cost Components” of Distribution company (Discom)
1) Financial Cost (Incl. Return)• Depreciation• Interest• Tax
O&M C t
2) O&M Cost • Repairs & Maintenance cost• Employees cost
O&M Cost
• Employees cost• Administrative cost
3) Power Purchase cost Power Cost• Generation cost• Transmission cost
Desired RatioDesired Ratio
Uncontrollable costs (Power Purchase & Financial) have gone up drastically, whereas costs under Discom’s control are competitive as per industry benchmarks
Return for Discom is ~2% of revenue* For FY 15
costs under Discom s control are competitive as per industry benchmarks..
From where Delhi Sources its Power
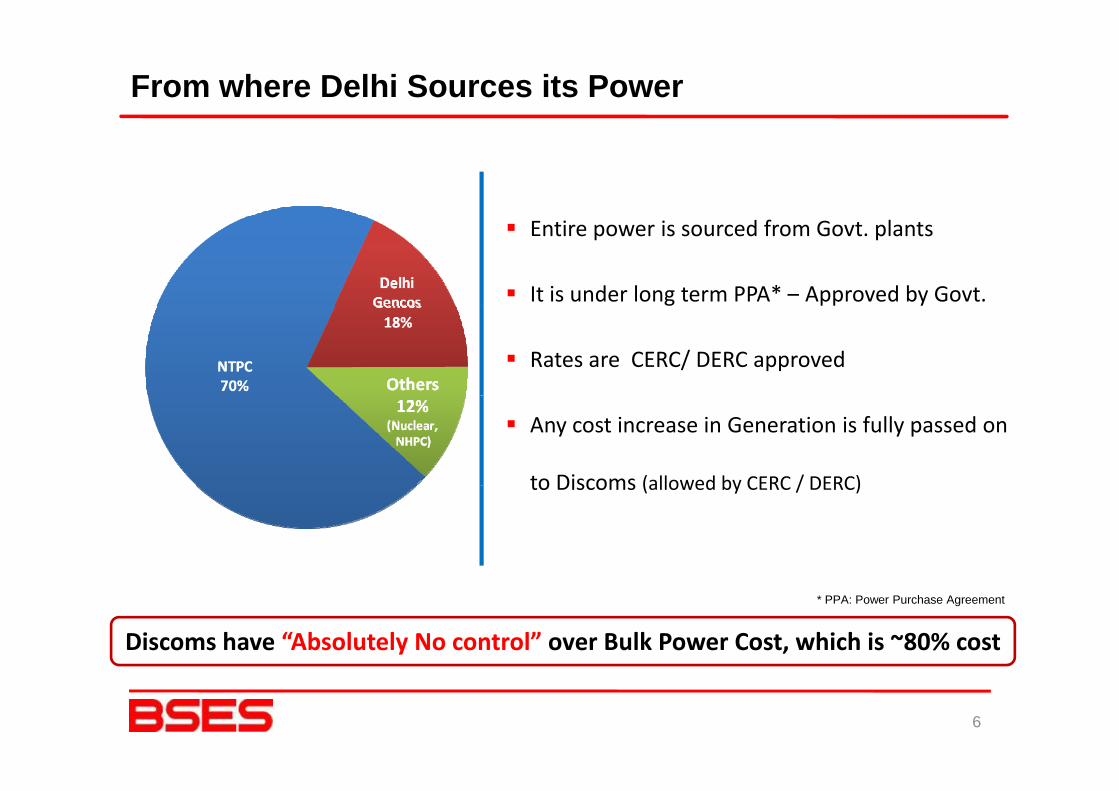
Entire power is sourced from Govt. plants
It is under long term PPA* – Approved by Govt.
Rates are CERC/ DERC approved
Any cost increase in Generation is fully passed on
to Discoms (allowed by CERC / DERC)to Discoms (allowed by CERC / DERC)
Discoms have “Absolutely No control” over Bulk Power Cost, which is ~80% cost
* PPA: Power Purchase Agreement
6
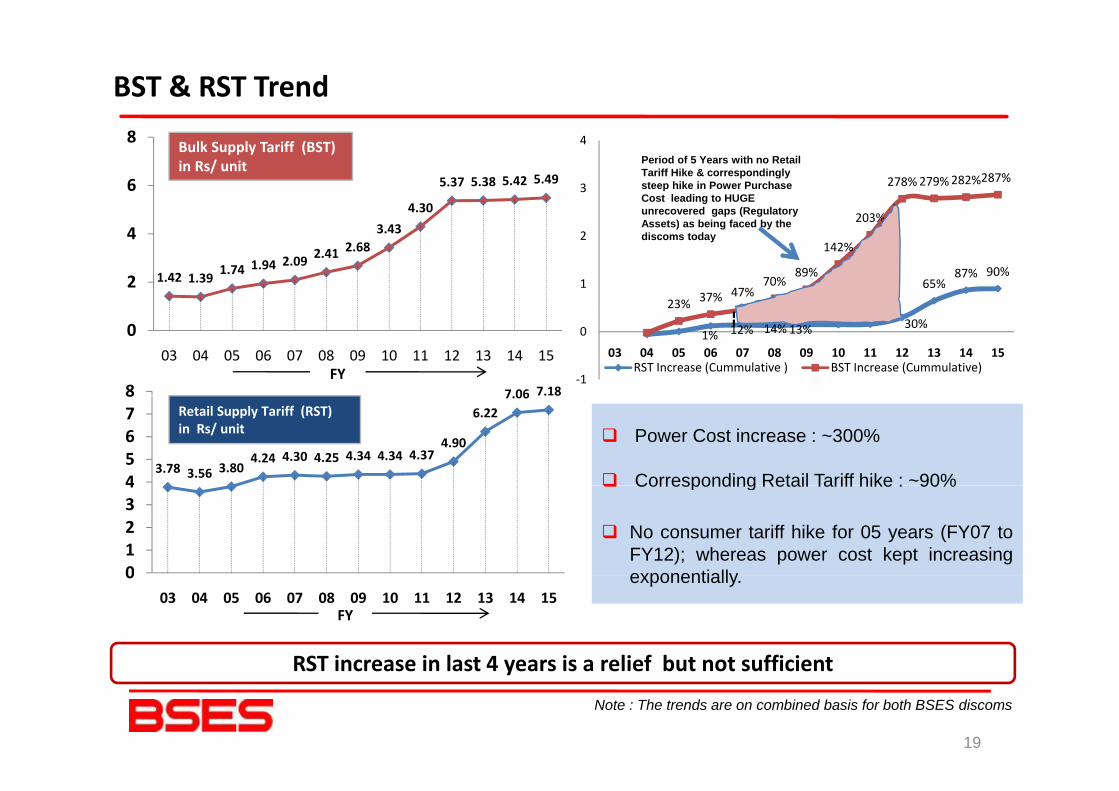
BST & RST Trend
203%
278%279%282%287%3
4Period of 5 Years with no Retail Tariff Hike & correspondingly steep hike in Power Purchase Cost leading to HUGE unrecovered gaps (Regulatory 4.30
5.37 5.38 5.42 5.496
8 Bulk Supply Tariff (BST) in Rs/ unit
15% 15% 16%
65%87% 90%
23% 37% 47%70%
89%
142%
203%
1
2
g p ( g yAssets) as being faced by the discoms today
1.42 1.39 1.74 1.94 2.09 2.41 2.683.43
2
4
1% 12% 14%13%
15% 15% 16%30%
23%
‐1
0
03 04 05 06 07 08 09 10 11 12 13 14 15RST Increase (Cummulative ) BST Increase (Cummulative)
7 06 7.188
003 04 05 06 07 08 09 10 11 12 13 14 15
FY
3.78 3.56 3.804.24 4.30 4.25 4.34 4.34 4.37
4.90
6.227.06 . 8
45678
Power Cost increase : ~300%
Corresponding Retail Tariff hike : ~90%
Retail Supply Tariff (RST)in Rs/ unit
01234 Corresponding Retail Tariff hike : 90%
No consumer tariff hike for 05 years (FY07 toFY12); whereas power cost kept increasingexponentially0
03 04 05 06 07 08 09 10 11 12 13 14 15FY
exponentially.
RST increase in last 4 years is a relief but not sufficient
Note : The trends are on combined basis for both BSES discoms
19
RST increase in last 4 years is a relief but not sufficient
(I R / it)
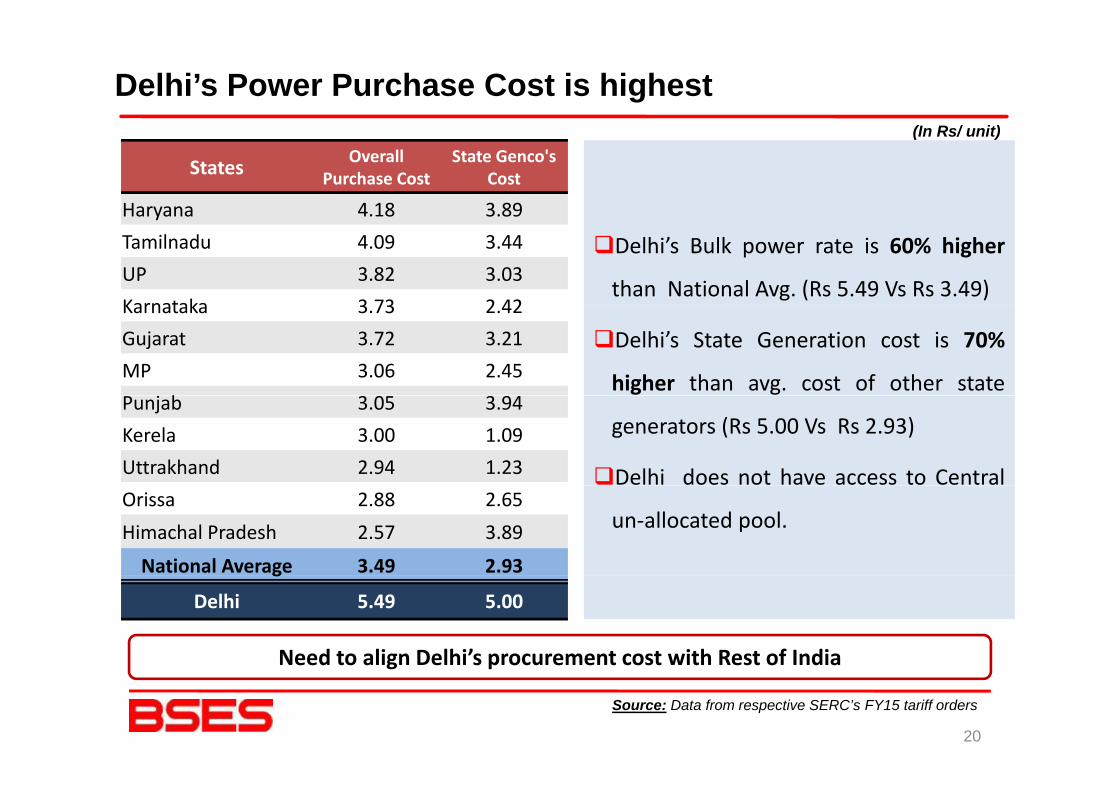
Delhi’s Power Purchase Cost is highest(In Rs/ unit)
States Overall Purchase Cost
State Genco'sCost
Haryana 4.18 3.89
Delhi’s Bulk power rate is 60% higher
than National Avg. (Rs 5.49 Vs Rs 3.49)
Haryana 4.18 3.89Tamilnadu 4.09 3.44UP 3.82 3.03Karnataka 3 73 2 42
Delhi’s State Generation cost is 70%
higher than avg. cost of other state
Karnataka 3.73 2.42Gujarat 3.72 3.21MP 3.06 2.45
bgenerators (Rs 5.00 Vs Rs 2.93)
Delhi does not have access to Central
Punjab 3.05 3.94Kerela 3.00 1.09Uttrakhand 2.94 1.23
un‐allocated pool.Orissa 2.88 2.65Himachal Pradesh 2.57 3.89
National Average 3.49 2.93
Need to align Delhi’s procurement cost with Rest of India
g
Delhi 5.49 5.00
Source: Data from respective SERC’s FY15 tariff orders
Need to align elhi s procurement cost with Rest of India
20
Power Tariff Vs Essential Commodities/ServicesPower Tariff Vs Essential Commodities/Services
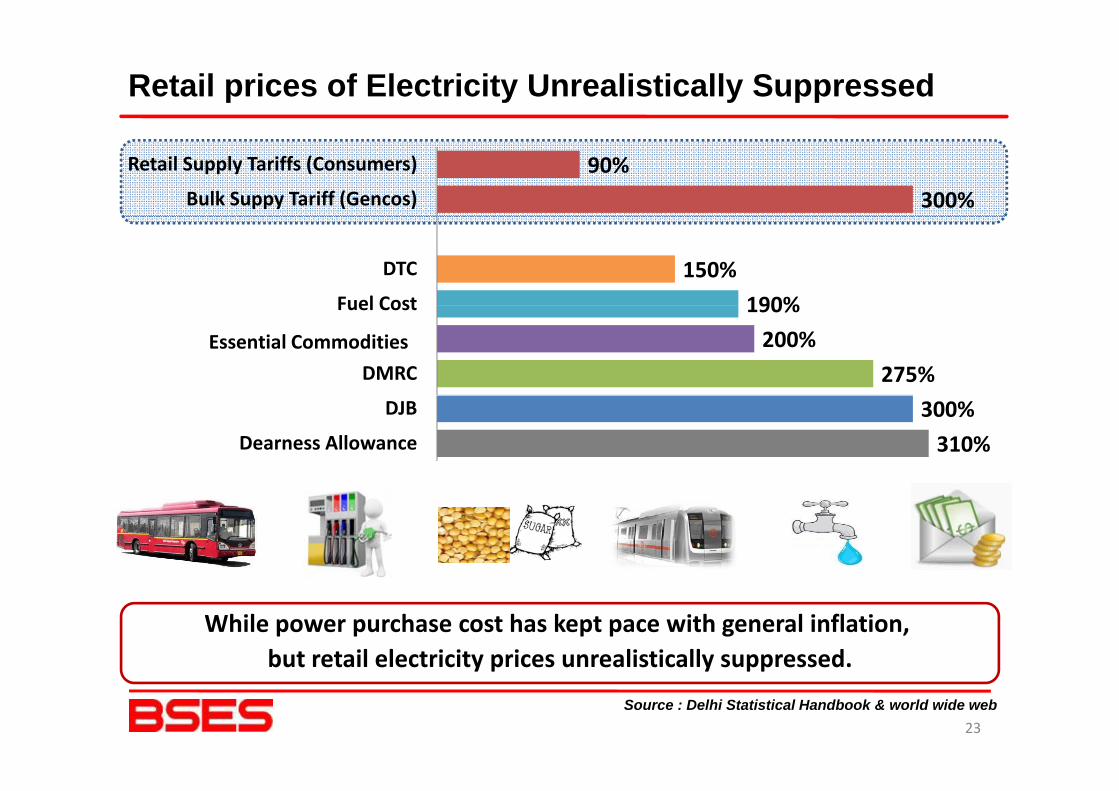
Retail prices of Electricity Unrealistically Suppressed
300%90%
Bulk Suppy Tariff (Gencos)
Retail Supply Tariffs (Consumers)
190%150%
Fuel Cost
DTC
275%200%
190%
DMRC
Essentail Commoditites
Fuel Cost
Essential Commodities
310%300%
Dearness Allowance
DJB
While power purchase cost has kept pace with general inflation, but retail electricity prices unrealistically suppressed.
23
but retail electricity prices unrealistically suppressed.
Source : Delhi Statistical Handbook & world wide web
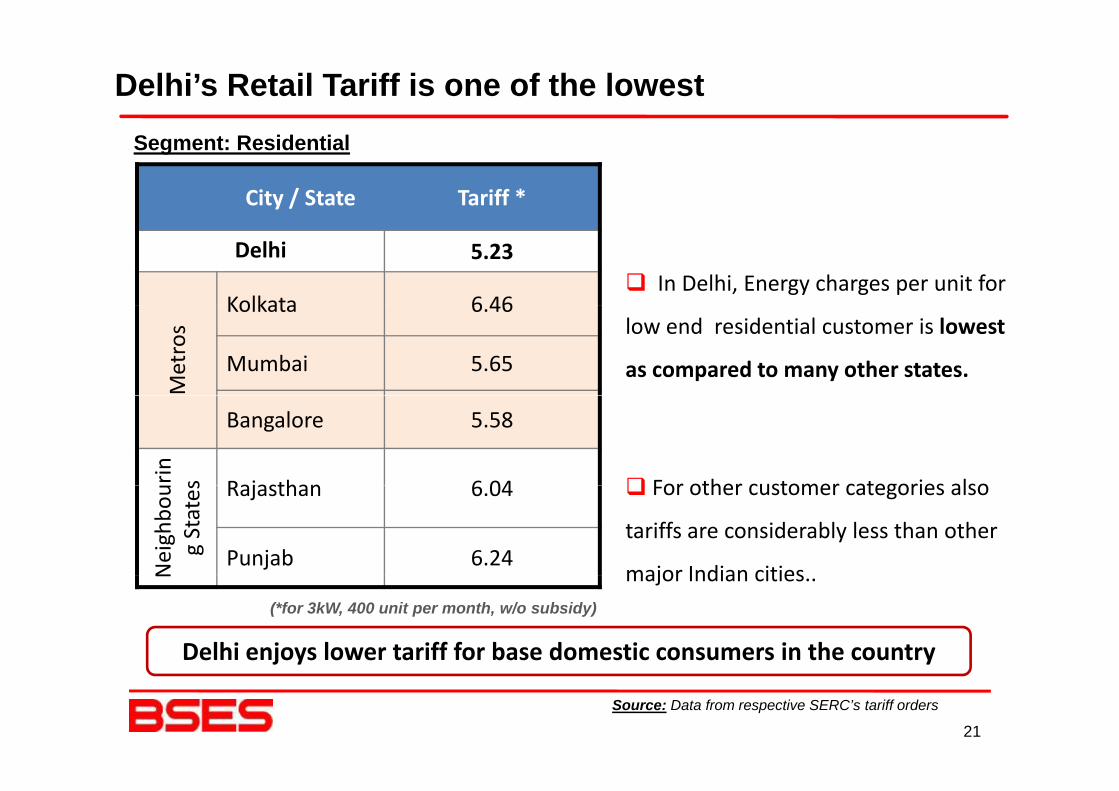
Delhi’s Retail Tariff is one of the lowest Segment: Residential
City / State Tariff *
In Delhi, Energy charges per unit for Delhi 5.23
Kolkata 6 46low end residential customer is lowest
as compared to many other states.
Metros
Kolkata 6.46
Mumbai 5.65
For other customer categories also
Bangalore 5.58
rin s Rajasthan 6 04 For other customer categories also
tariffs are considerably less than other
major Indian citiesNeighbo
ug States Rajasthan 6.04
Punjab 6.24major Indian cities..
Delhi enjoys lower tariff for base domestic consumers in the country
N
(*for 3kW, 400 unit per month, w/o subsidy)
Source: Data from respective SERC’s tariff orders
21
2DERCs unrealistic approach
ff din Tariff determination
12
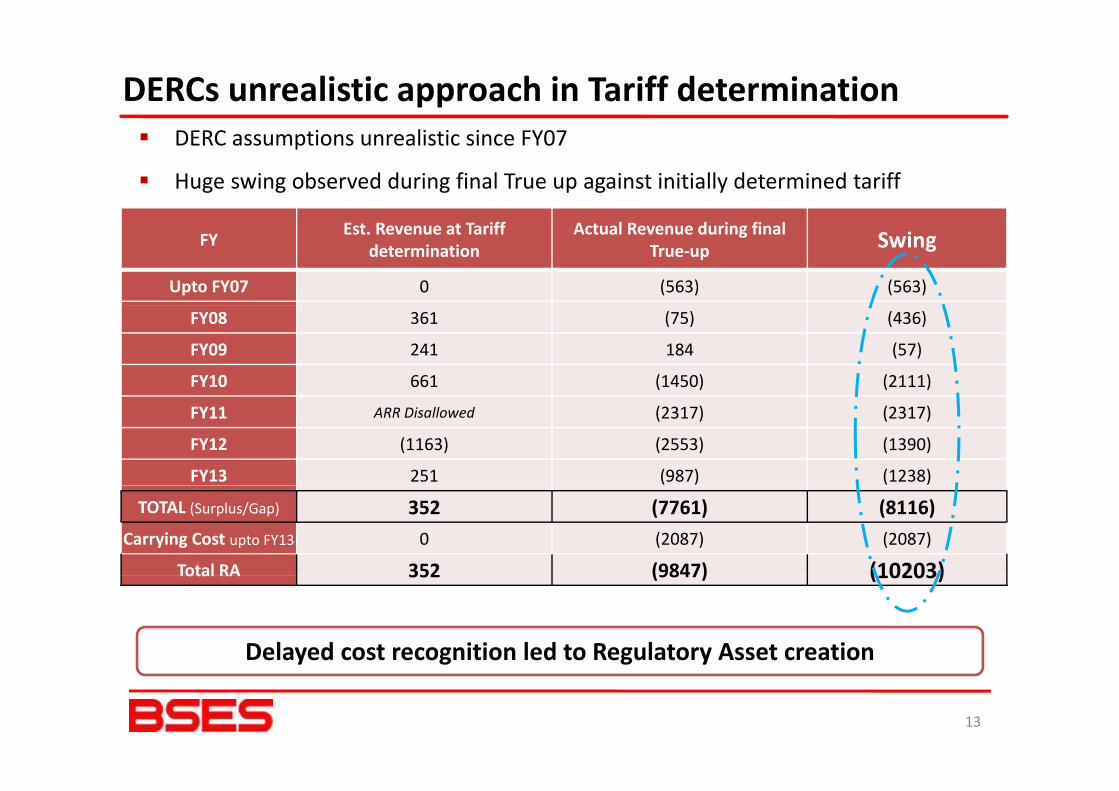
DERCs unrealistic approach in Tariff determinationDERC assumptions unrealistic since FY07
Huge swing observed during final True up against initially determined tariff
FY Est. Revenue at Tariff determination
Actual Revenue during final True‐up Swing
Upto FY07 0 (563) (563)
FY08 361 (75) (436)
FY09 241 184 (57)
FY10 661 (1450) (2111)
FY11 ARR Disallowed (2317) (2317)
FY12 (1163) (2553) (1390)
FY13 251 (987) (1238)
TOTAL (Surplus/Gap) 352 (7761) (8116)Carrying Cost upto FY13 0 (2087) (2087)
Total RA 352 (9847) (10203)Total RA 352 (9847) (10203)
Delayed cost recognition led to Regulatory Asset creation
13
Regulatory Asset build up & its impact
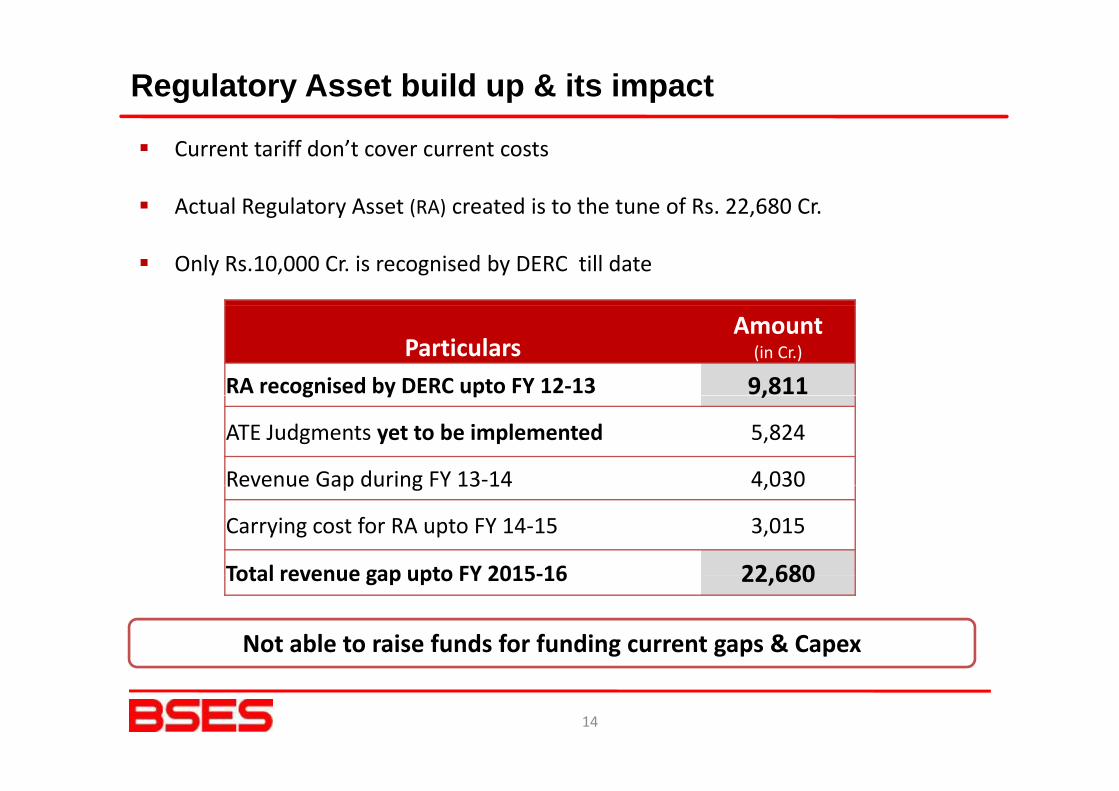
Current tariff don’t cover current costs
Actual Regulatory Asset (RA) created is to the tune of Rs. 22,680 Cr.g y ( ) ,
Only Rs.10,000 Cr. is recognised by DERC till date
ParticularsAmount
(in Cr.)
RA recognised by DERC upto FY 12‐13 9,811g y p ,
ATE Judgments yet to be implemented 5,824
Revenue Gap during FY 13‐14 4,030Revenue Gap during FY 13 14 4,030
Carrying cost for RA upto FY 14‐15 3,015
Total revenue gap upto FY 2015‐16 22 680Total revenue gap upto FY 2015‐16 22,680
Not able to raise funds for funding current gaps & Capex
14
3
Benefits to stakeholdersBenefits to stakeholders
15
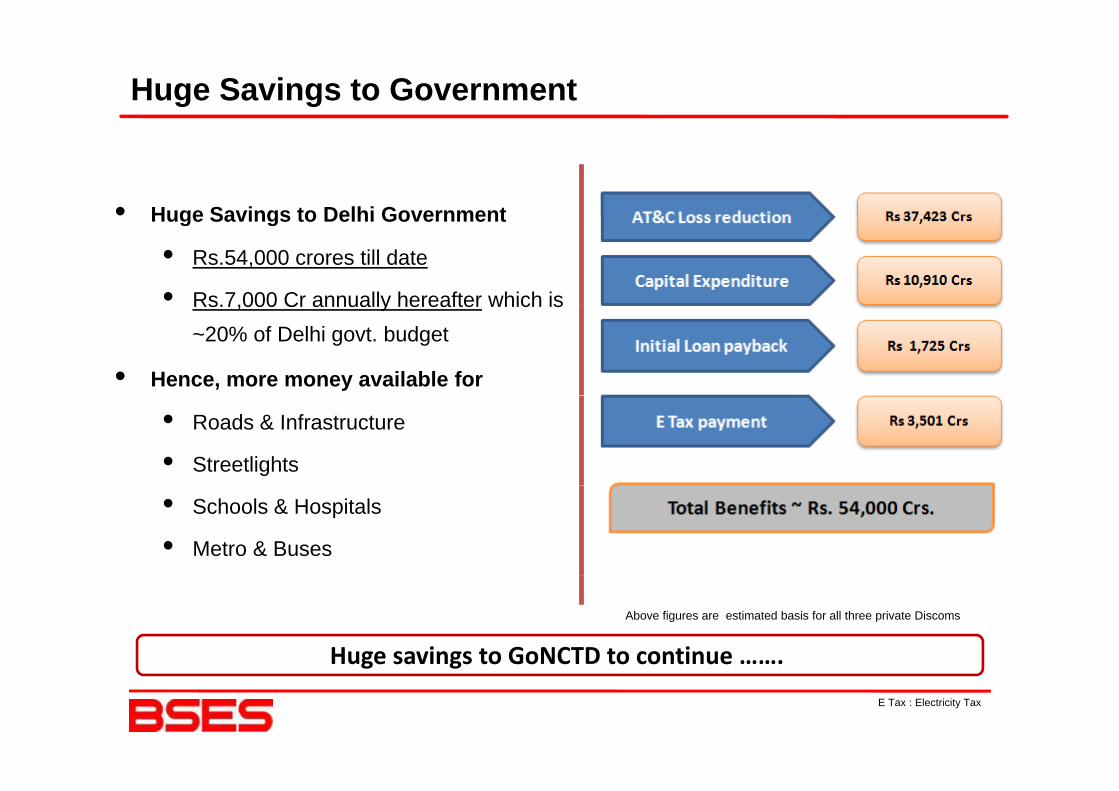
Huge Savings to Government
• Huge Savings to Delhi GovernmentHuge Savings to Delhi Government
• Rs.54,000 crores till date
• Rs.7,000 Cr annually hereafter which isRs.7,000 Cr annually hereafter which is ~20% of Delhi govt. budget
• Hence, more money available for
• Roads & Infrastructure
• Streetlights
• Schools & Hospitals
• Metro & Buses
Huge savings to GoNCTD to continue …….
Above figures are estimated basis for all three private Discoms
16
g g
E Tax : Electricity Tax
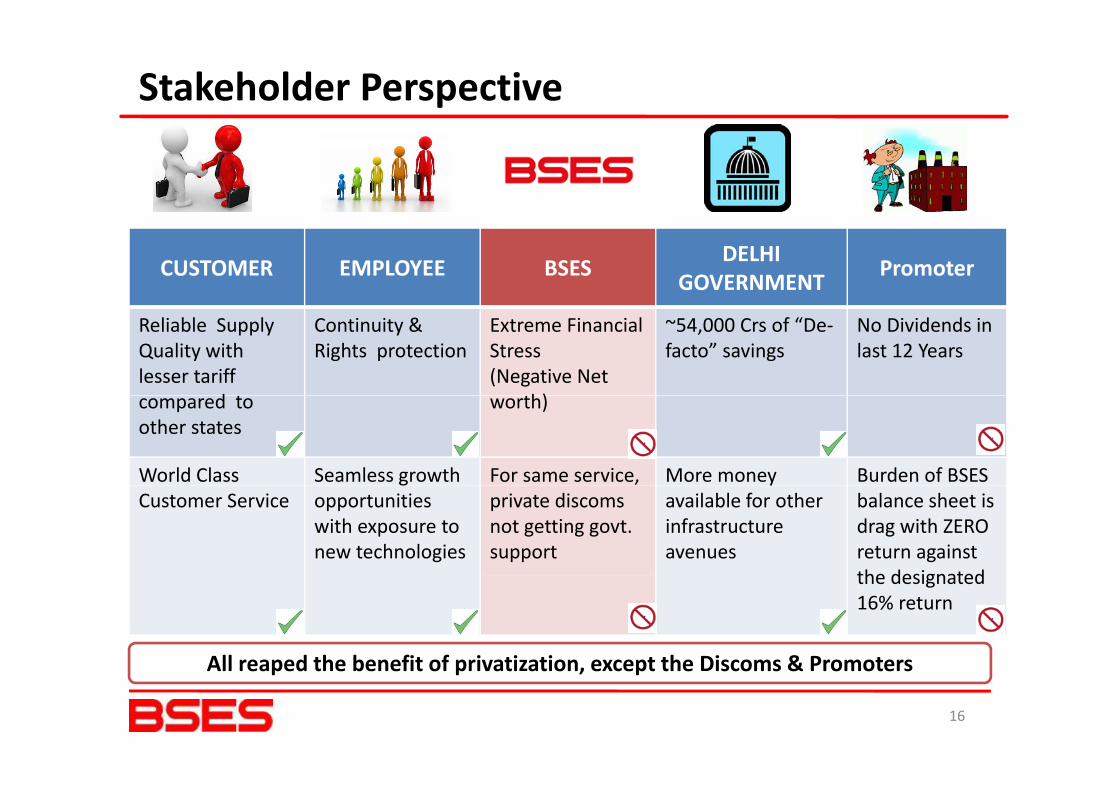
Stakeholder Perspective
CUSTOMER EMPLOYEE BSES DELHIGOVERNMENT Promoter
Reliable SupplyQuality with lesser tariff
d
Continuity & Rights protection
Extreme Financial Stress (Negative Net
h)
~54,000 Crs of “De‐facto” savings
No Dividends in last 12 Years
compared to other states
worth)
World Class Seamless growth For same service, More money Burden of BSES Customer Service
gopportunitieswith exposure to new technologies
private discoms not getting govt. support
yavailable for other infrastructure avenues
balance sheet is drag with ZEROreturn against the designatedthe designated 16% return
All reaped the benefit of privatization except the Discoms & Promoters
16
All reaped the benefit of privatization, except the Discoms & Promoters
D it “S t l T d” in absenceDespite “Spectacular Turnaround”, in absence of “Adequate Tariff”
Discoms are facing Financial Crisis
18
THANK YOU
19