bt group plc - sinet€¦ · · 2018-01-25– aim to help 10m people overcome social disadvantage...
TRANSCRIPT

BT Group plc 2016 Annual General Meeting
13 July 2016
BT Group plc Sir Michael Rake - Chairman

© British Telecommunications plc
Our investments are delivering for the UK
90% of the UK has access to fibre broadband
– on track to help Government hit its 95% target, and beyond
Further investment in UK infrastructure for the rest of this decade
– ambition for ultrafast broadband to pass 12m premises by 2020
– mobile 4G geographic coverage to 95% by 2020
We’re launching new products and services
– launch of BT Sport Europe in August 2015
– supporting corporate customers with new cloud-based services
We’re investing more in the customer experience
– we need to do better; we have ambitious goals

© British Telecommunications plc
We aim to be a sustainable and responsible business
Supporting charities and communities
– £94m raised for good causes this year
– our people spent 45,000 days volunteering
Creating a connected society
– aim to help 10m people overcome social disadvantage by 2020 through our services
Creating a culture of tech literacy
– aim to improve computer skills teaching for 5m children by 2020
Delivering environmental benefits
– our products reduce customers’ carbon emissions by 1.6:1

© British Telecommunications plc
And providing growing returns for our shareholders
9.6p proposed final dividend, up 12.9%, full year dividend of 14.0p, up 12.9%
Dividend per share
2009/10 2010/11 2011/12 2012/13 2013/14 2014/15 2015/16 2016/17 2017/18
+7% +12%
+14%
+15%
≥10%
6.9p 7.4p 8.3p
9.5p 10.9p
12.4p +14%
+13% 14.0p ≥10%

© British Telecommunications plc
Share price performance
1 Total Shareholder Return which includes dividends; to 30 June 2016
Last 5 financial years1 Since last AGM1
0%
-19%
-10%
-30%
-20%
-10%
0%
10%
20%
30%
40%
FTSE Sector BT
33%
51%
147%
0%
50%
100%
150%
FTSE Sector BT

© British Telecommunications plc
Financial objectives
Reduce net debt
Support pension fund
Deliver sustainable, profitable revenue growth
Grow EBITDA
Grow free cash flow
Invest in business
Pay progressive dividends

BT Group plc 2016 Annual General Meeting
13 July 2016

Q4/full year 2015/16 results
Group strategy & Outlook
Cost transformation & EE integration
TSO Openreach Wholesale & Ventures
Consumer EE Global
Services Business
& Public Sector
BT Group plc Gavin Patterson – Chief Executive

© British Telecommunications plc
A landmark year for BT
Delighted with acquisition of EE
Strong financial results
- best revenue performance for >7 years
Driven by the investments
we’re making

© British Telecommunications plc
FY 2015/16 results in line with outlook
Outlook1 FY 2015/16 results1
Underlying2 revenue ex transit Up 1% - 2% Up 2.0%
EBITDA3 Modest growth versus £6,271m in 2014/15
£6,319m, up 1%
Normalised free cash flow4 Around £2.8bn £2,837m
1 excludes the impact of EE 2 excludes specific items, foreign exchange movements and the effect of acquisitions and disposals 3 before specific items 4 before specific items, pension deficit payments and the cash tax benefit of pension deficit payments
BT excluding EE

© British Telecommunications plc
Over the last three years:
Significantly improved revenue1: from a 3% decline to 2% growth
Taken £3bn out of our gross costs, helping us to fund our investments
Increased cash flow2 by
>20% Brought fibre to 10m more homes and businesses
Successfully launched BT Sport, bringing it to >5m households
Launched BT Mobile and acquired EE, the UK’s leading mobile operator
1 Underlying revenue excluding transit 2 Normalised free cash flow, excluding EE

© British Telecommunications plc
0 2 4 6 8 10
MexicoAustraliaGermany
G20IndiaUSA
JapanSouth Korea
ChinaUK
Digital communications is a UK success story
No.1 of major European countries
Source: BCG UK eGDP, May 2015
% of GDP driven by internet (eGDP)
Competition of broadband
market by HHI
Most affordable
pricing1
Fixed broadband penetration
Avg. measured downstream bandwidth
Superfast coverage
Take-up of superfast
broadband
Source: Analysys Mason, International benchmarking report, September 2015
1st
2nd
4th
5th
3rd
Source: Ofcom ICMR 2015
1 ‘Weighted average’ bundled service pricing for a family household with multiple needs
out of 167 countries (ITU Development Index) 4th

© British Telecommunications plc
BT’s investments in Wales
£575m Total Gross Value Add impact (including indirect and induced effects)
£94m Total income of BT employees working in the nation
£700k Invested in sustainable and responsible business activities In Wales
87% superfast broadband coverage
Ultrafast G.fast trial now in Swansea
Every school has opportunity to get fibre broadband through Public Service Broadband Aggregation programme
BT employs 1 in every 6 employees working in the IT and communications sectors
Across Wales

© British Telecommunications plc
Our markets are converging
It means we’re in a stronger position to drive, and benefit from, key market trends
Data volumes are accelerating
Businesses are moving to the cloud Multinational companies globalisation
© British Telecommunications plc
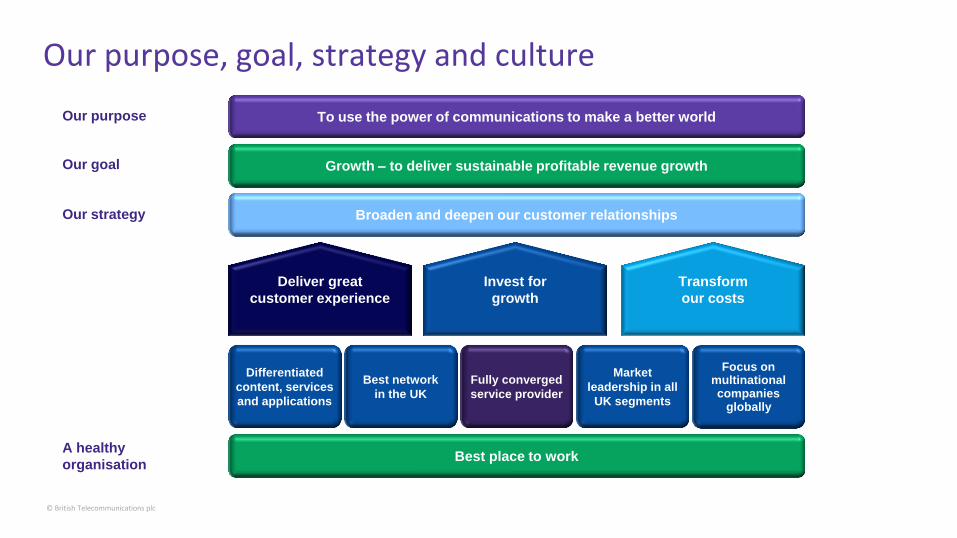
Our purpose, goal, strategy and culture
Transform
our costs
Differentiated
content, services
and applications
Best network
in the UK
Fully converged
service provider
Market
leadership in all
UK segments
Focus on multinational companies
globally
Our strategy
Growth – to deliver sustainable profitable revenue growth
Invest for
growth
Our goal
Deliver great
customer experience
Our purpose To use the power of communications to make a better world
Broaden and deepen our customer relationships
Best place to work A healthy
organisation

© British Telecommunications plc
60/60 targets met or exceeded for the last two years
Provision improvement ‒ 14/15 4.5% better than MSL
‒ 15/16 4.3% better than MSL
Repair improvement
‒ 14/15 8.5% better than MSL
‒ 15/16 3.4% better than MSL
A challenging year for customer service
Minimum Service Level (MSL) set by Ofcom

© British Telecommunications plc
We will focus on great customer experience
Rolling out more fibre
Fewer faults
Recruiting more engineers
Improving our network
More calls handled in the UK
Recruiting more customer care advisors
Improving digital capability
Making it easier to contact us if you need to
Reducing the need for customers to call us
Investing in training
Halving missed engineer appointments
Reducing repair rate from 48 to 24 hours
Doing more things right first time

© British Telecommunications plc
We will continue to drive cost transformation to support investment in service
Insourcing saves money, protects BT jobs, improves service
– nearly 15,000 jobs insourced since 2008/09
Improving back-office efficiency
– c.6,000 jobs created in Central Business Services unit in UK and overseas
Investing in customer service
– >900 new UK contact centre staff, hiring 1,600 more in Consumer and EE
– c.3,000 Openreach engineers hired in last 2 years
Cost saving opportunities
Flowthrough In plan Procurement Gross costsavings
Still > £1bn gross cost savings in next 2 years
>£1bn
Invest in growth opportunities
Profit contribution

© British Telecommunications plc
We will become a fully converged service provider
Seamless connectivity using the power of fixed and mobile networks on one common access platform
Seamless connectivity
One access platform
Fixed network
Mobile network

© British Telecommunications plc
We will have the best network in the UK
95%
4G geographic coverage by end-2020
– from an industry-leading 60% today 95%
Superfast availability by end-2017
– we want to go further
10m Ultrafast homes by end-2020
– with an ambition to reach 12m
300k Emergency Services Network
– we’ll be supporting 300k Emergency Services users
Ultrafast 12m
Superfast 90% 95%
Average download speed 4G v 3G, by operator
Moving from superfast to ultrafast
Source: Ofcom mobile broadband measurements, fieldwork November and December 2015.
0
10
20
30
All EE O2 Vodafone Three
4G 3GMbps

© British Telecommunications plc
We will have differentiated content, services and applications
Emergency Services Network Cloud of clouds
Converged communication services Cybersecurity
BT Sport BT TV New BT Smart Hub

© British Telecommunications plc
We will have a geographical focus
Market leadership in all UK segments
A focus on multinational companies globally
Consumers Businesses Service
provider business
Public sector
Wholesale
© British Telecommunications plc
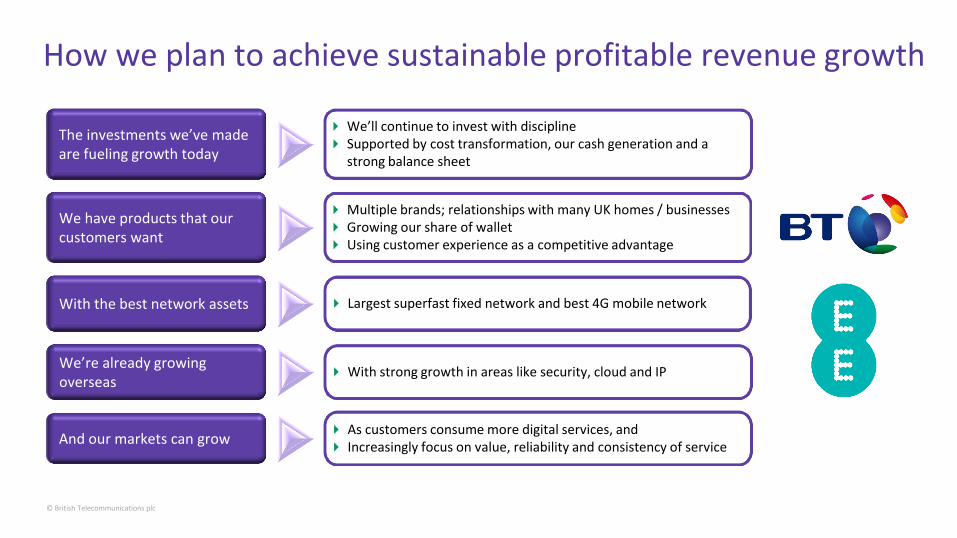
How we plan to achieve sustainable profitable revenue growth
And our markets can grow As customers consume more digital services, and Increasingly focus on value, reliability and consistency of service
We have products that our customers want
With the best network assets
We’re already growing overseas
The investments we’ve made are fueling growth today
Multiple brands; relationships with many UK homes / businesses Growing our share of wallet Using customer experience as a competitive advantage
Largest superfast fixed network and best 4G mobile network
With strong growth in areas like security, cloud and IP
We’ll continue to invest with discipline Supported by cost transformation, our cash generation and a
strong balance sheet

© British Telecommunications plc
BT Group plc

BT Group plc 2016 Annual General Meeting
13 July 2016

Resolution Description
1 Report and accounts
2 Remuneration report
3 Final Dividend
4-11 Re-election of directors
12-14 Elect Mike Inglis, Tim Höttges and Simon Lowth
15 Reappointment of auditors
16 Remuneration of auditors
17 Authority to allot shares
18 Authority to allot shares for cash*
19 Authority to purchase own shares*
20 14 days’ notice of meetings*
21 Authority for political donations
* Special Resolutions

For & Discretion Against Vote Withheld Overall
Res No. Description Total % Total % Total % Total
12 Elect Mike Inglis 6,970,212,655 99.81 9,514,834 0.14 3,975,961 0.06 6,983,703,450
13 Elect Tim Höttges 6,719,199,815 96.21 121,440,236 1.74 143,063,708 2.05 6,983,703,759
14 Elect Simon Lowth 6,960,814,321 99.67 18,768,737 0.27 4,117,957 0.06 6,983,701,015
15 Reappointment of auditors 6,790,960,459 97.24 190,448,066 2.73 2,294,506 0.03 6,983,703,031
16 Remuneration of auditors 6,893,709,960 98.71 86,965,886 1.25 3,035,239 0.04 6,983,711,085
17 Authority to allot shares 6,744,391,944 96.57 225,684,839 3.23 13,623,778 0.20 6,983,700,561
18 Authority to allot shares for
cash* 6,926,765,559 99.18 13,595,031 0.19 43,339,981 0.62 6,983,700,571
19 Authority to purchase own
shares* 6,860,318,779 98.23 80,909,016 1.16 42,483,346 0.61 6,983,711,141
20 14 days’ notice of meetings* 6,462,659,128 92.54 479,142,009 6.86 41,906,284 0.60 6,983,707,421
21 Authority for political donations 6,782,476,107 97.12 104,971,831 1.50 96,254,879 1.38 6,983,702,817
* Special Resolutions

BT Group plc 2016 Annual General Meeting
13 July 2016

Resolution Description
1 Report and accounts
2 Remuneration report
3 Final Dividend
4-11 Re-election of directors
12-14 Elect Mike Inglis, Tim Höttges and Simon Lowth
15 Reappointment of auditors
16 Remuneration of auditors
17 Authority to allot shares
18 Authority to allot shares for cash*
19 Authority to purchase own shares*
20 14 days’ notice of meetings*
21 Authority for political donations
* Special Resolutions

Poll on all Resolutions
Using your Admission Card/Proxy Card:
• If voting all shares “for”, place a cross (X) in “For” box
• If voting all shares “against”, place a cross (X) in “Against” box
• If withholding vote, place (X) in “Vote withheld” box
• If splitting vote, indicate the number of shares voting “for” “against” and “Vote withheld”
• Please sign the card
• Place completed card in ballot box as you leave
• Please ask a marshal if you have any questions

For & Discretion Against Vote Withheld Overall
Res No. Description Total % Total % Total % Total
12 Elect Mike Inglis 6,970,212,655 99.81 9,514,834 0.14 3,975,961 0.06 6,983,703,450
13 Elect Tim Höttges 6,719,199,815 96.21 121,440,236 1.74 143,063,708 2.05 6,983,703,759
14 Elect Simon Lowth 6,960,814,321 99.67 18,768,737 0.27 4,117,957 0.06 6,983,701,015
15 Reappointment of auditors 6,790,960,459 97.24 190,448,066 2.73 2,294,506 0.03 6,983,703,031
16 Remuneration of auditors 6,893,709,960 98.71 86,965,886 1.25 3,035,239 0.04 6,983,711,085
17 Authority to allot shares 6,744,391,944 96.57 225,684,839 3.23 13,623,778 0.20 6,983,700,561
18 Authority to allot shares for
cash* 6,926,765,559 99.18 13,595,031 0.19 43,339,981 0.62 6,983,700,571
19 Authority to purchase own
shares* 6,860,318,779 98.23 80,909,016 1.16 42,483,346 0.61 6,983,711,141
20 14 days’ notice of meetings* 6,462,659,128 92.54 479,142,009 6.86 41,906,284 0.60 6,983,707,421
21 Authority for political donations 6,782,476,107 97.12 104,971,831 1.50 96,254,879 1.38 6,983,702,817
* Special Resolutions

BT Group plc 2016 Annual General Meeting
13 July 2016

BT Group plc 2016 Annual General Meeting
13 July 2016
