budget 2010 - uk government web...
TRANSCRIPT

BUDGET 2010
June 2010HC 61
£45.00HC 61
BUDGET 2010
Return to an order of the House of Commons dated 22 June 2010
Copy of Economic and Fiscal Strategy Report and Financial Statement and Budget Report – June 2010 as laid before the
House of Commons by the Chancellor of the Exchequer when opening the Budget.
Mark HobanHer Majesty’s Treasury
22 June 2010
Ordered by the House of Commons to be printed 22 June 2010
LONDON: The Stationery Office
3742_00a Title Pages.indd 1 22/6/10 00:21:50

© Crown Copyright 2010
The text in this document (excluding the Royal Arms and other departmental or agency logos) may be reproduced free of charge in any format or medium providing it is reproduced accurately and not used in a misleading context. The material must be acknowledged as Crown copyright and the title of the document specified.
Where we have identified any third party copyright material you will need to obtain permission from the copyright holders concerned.
The Economic and Fiscal Strategy Report and the Financial Statement and Budget Report contain the Government’s assessment of the medium-term economic and budgetary position. They set out the Government’s tax and spending plans, including those for public investment, in the context of its overall approach to social, economic and environmental objectives. After approval for the purposes of Section 5 the European Communities (Amendment) Act 1993, these reports wil form the basis of submissions to the European Commission under Article 99 (ex Article 103) and Article 104 (ex Article 104c) of the Treaty establishing the European Community.
ISBN: 9780102966305 PU1000
Printed in the UK by The Stationery Office Limited on behalf of the Controller of Her Majesty’s Stationery Office
ID 2368528 06/10
Printed on paper containing 75% recycled fibre content minimum
3742_00a Title Pages.indd 2 22/6/10 00:21:50
ContentsPage
Executive summary 1
Budget Report
Chapter 1 Budget Report Deficit reduction 7 Enterprise 25 Fairness 31
Chapter 2 Budget policy decisions 39
Annex A Impact of tax and welfare changes on households 63
Annex B Financing 71
Office for Budget Responsibility: Budget forecast
Annex C Office for Budget Responsibility Budget forecast 77
List of abbreviations 107
List of tables 111
List of charts 112
Budget 2010

1Budget 2010
Executive SummaryThis Budget sets out a five-year plan to rebuild the British economy based on the Government’s values of responsibility, freedom and fairness. It shows how the Government will carry out Britain’s unavoidable deficit reduction plan in a way that strengthens and unites the country.
The British economy has become unbalanced. It has been too reliant on growth from a limited number of sectors and regions. Overcoming these challenges will require a new model of economic growth built on saving, investment and enterprise instead of debt. This Budget is the first step in transforming the economy and paving the way for sustainable, private sector led growth, balanced across regions and industries.
This Budget sets out the action the Government will take in three areas to rebalance the economy and provide the conditions for sustainable growth:
deficit reduction; •
enterprise; and •
fairness. •
Responsibility: deficit reductionThe most urgent task facing this country is to implement an accelerated plan to reduce the deficit. Reducing the deficit is a necessary precondition for sustained economic growth. To continue with the existing fiscal plans would put the recovery at risk, given the scale of the challenge. High levels of debt also put an unfair burden on future generations.
For the first time, the Government’s fiscal policy decisions have been based on independent forecasts for the economy and public finances. The Office for Budget Responsibility (OBR), in its pre-Budget forecast1, has confirmed that without further action to tackle the deficit:
public sector net borrowing would remain at 4 per cent of GDP in five years time, having •been above 5 per cent of GDP for six consecutive years, unprecedented in the post-war period;
the structural deficit would be 2.8 per cent of GDP in 2014-15, while the structural current •deficit would be 1.6 per cent; and
debt would still be rising in 2014-15 to 74.4 per cent of GDP, with annual debt interest •payments set to reach £67 billion in that year.
The Government has therefore set a forward-looking fiscal mandate to achieve cyclically-adjusted current balance by the end of the rolling, five-year forecast period. At this Budget, the end of the forecast period is 2015-16.
1 Office for Budget Responsibility pre-Budget forecast, Office for Budget Responsibility, June 2010.
2 Budget 2010
At this time of rapidly rising debt, the fiscal mandate will be supplemented by a target for public sector net debt as a percentage of GDP to be falling at a fixed date of 2015-16, ensuring that the public finances are restored to a sustainable path.
This Budget takes urgent action to eliminate the bulk of the structural deficit through plans for additional consolidation of £40 billion per year by 2014-15. These plans include:
£32 billion per year by 2014-15 from spending reductions. • This includes £30 billion of current spending reductions and no further reductions in capital spending beyond those already announced. The Budget announces the Spending Review will be on 20 October 2010;
as part of these spending reductions, the Budget announces £11 billion of welfare •reform savings designed to reward work and protect the most vulnerable, including adopting the Consumer Prices Index for the indexation of benefits, tax credits and public service pensions from April 2011. The Budget also announces a two year freeze In public sector pay, except for those earning less than £21,000 a year; and
£8 billion per year from net tax increases. This includes an increase in the main •standard rate of Value Added Tax (VAT) to 20 per cent and the standard and higher rate of Insurance Premium Tax (IPT) to 6 per cent and 20 per cent from 4 January 2011.
By 2014-15, 80 per cent of the additional consolidation measures set out in this Budget will be delivered through spending reductions.
The Budget and the plans the Government inherited represent a total consolidation of £113 billion per year by 2014-15 and £128 billion per year by 2015-16, of which £99 billion per year comes from spending reductions and £29 billion per year from net tax increases. By 2015-16, 77 per cent of the total consolidation will be delivered through spending reductions.
As a result of the action the Government is taking, the OBR projects in its Budget forecast that:
public sector net borrowing will decline to 1.1 per cent of GDP in 2015-16; •
the structural current deficit will be eliminated by 2014-15, with a projected surplus of •0.8 per cent of GDP in 2015-16; and
public sector net debt will peak at 70.3 per cent of GDP in 2013-14, before declining to •67.4 per cent of GDP in 2015-16.
The OBR’s judgement is that the policies set out in this Budget are consistent with a greater than 50 per cent chance of achieving the Government’s fiscal mandate and target for debt. The OBR’s central forecasts also show the mandate and debt target being met a year early in 2014-15.
The first section of Chapter 1 describes the source of the imbalances in the UK economy and the scale of the economic and fiscal challenge the country faces. It sets out the Government’s fiscal plans in more detail.
Freedom: enterpriseThe second element to rebalancing the economy is creating the conditions for enterprise and sustainable growth. If growth is to be sustainable, it needs to be based on an expansion in the private sector, not the public sector, and businesses across all regions and industries need the right conditions to be able to grow.
3Budget 2010
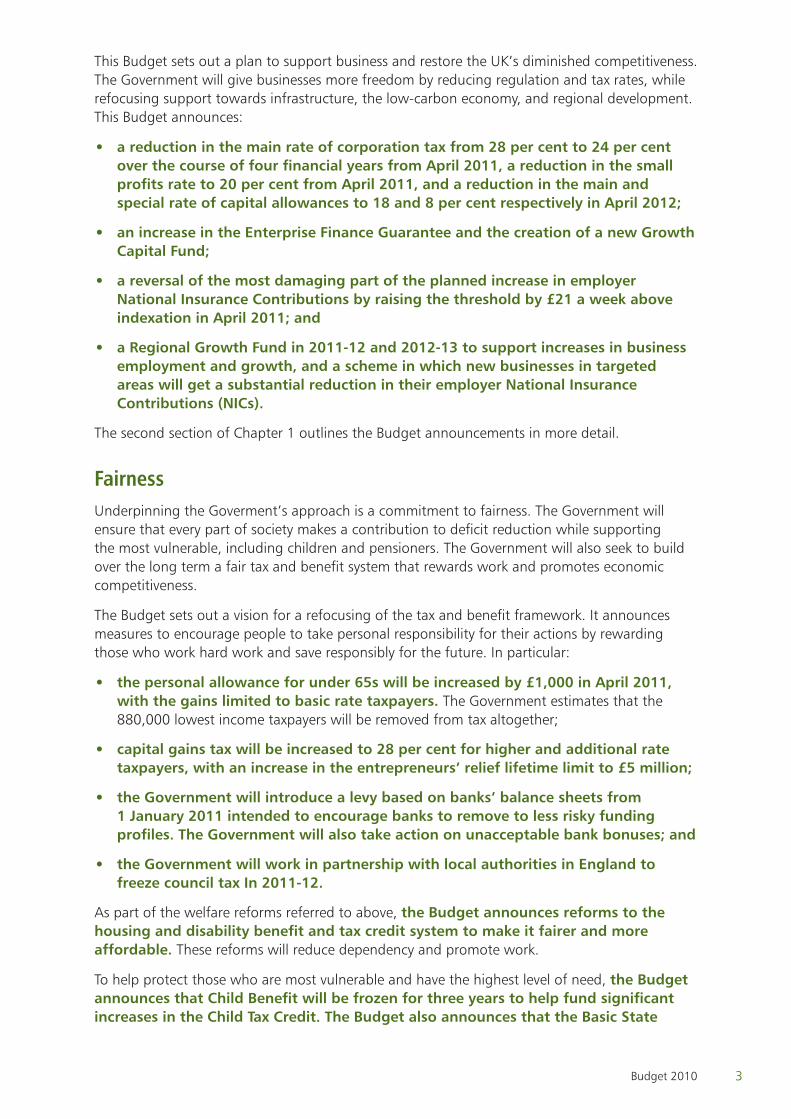
This Budget sets out a plan to support business and restore the UK’s diminished competitiveness. The Government will give businesses more freedom by reducing regulation and tax rates, while refocusing support towards infrastructure, the low-carbon economy, and regional development. This Budget announces:
a reduction in the main rate of corporation tax from 28 per cent to 24 per cent •over the course of four financial years from April 2011, a reduction in the small profits rate to 20 per cent from April 2011, and a reduction in the main and special rate of capital allowances to 18 and 8 per cent respectively in April 2012;
an increase in the Enterprise Finance Guarantee and the creation of a new Growth •Capital Fund;
a reversal of the most damaging part of the planned increase in employer •National Insurance Contributions by raising the threshold by £21 a week above indexation in April 2011; and
a Regional Growth Fund in 2011-12 and 2012-13 to support increases in business •employment and growth, and a scheme in which new businesses in targeted areas will get a substantial reduction in their employer National Insurance Contributions (NICs).
The second section of Chapter 1 outlines the Budget announcements in more detail.
FairnessUnderpinning the Goverment’s approach is a commitment to fairness. The Government will ensure that every part of society makes a contribution to deficit reduction while supporting the most vulnerable, including children and pensioners. The Government will also seek to build over the long term a fair tax and benefit system that rewards work and promotes economic competitiveness.
The Budget sets out a vision for a refocusing of the tax and benefit framework. It announces measures to encourage people to take personal responsibility for their actions by rewarding those who work hard work and save responsibly for the future. In particular:
the personal allowance for under 65s will be increased by £1,000 in April 2011, •with the gains limited to basic rate taxpayers. The Government estimates that the 880,000 lowest income taxpayers will be removed from tax altogether;
capital gains tax will be increased to 28 per cent for higher and additional rate •taxpayers, with an increase in the entrepreneurs’ relief lifetime limit to £5 million;
the Government will introduce a levy based on banks’ balance sheets from •1 January 2011 intended to encourage banks to remove to less risky funding profiles. The Government will also take action on unacceptable bank bonuses; and
the Government will work in partnership with local authorities in England to •freeze council tax In 2011-12.
As part of the welfare reforms referred to above, the Budget announces reforms to the housing and disability benefit and tax credit system to make it fairer and more affordable. These reforms will reduce dependency and promote work.
To help protect those who are most vulnerable and have the highest level of need, the Budget announces that Child Benefit will be frozen for three years to help fund significant increases in the Child Tax Credit. The Budget also announces that the Basic State
4 Budget 2010
Pension will be uprated by a triple guarantee of earnings, prices or 2.5 per cent, whichever is highest, from April 2011.
As a result of the Budget measures the richest will contribute the most to deficit reduction, and the impact on child poverty in 2012-13 is statistically insignificant.
The third section of Chapter 1 outlines the Budget announcements in more detail.
The Budget sets out a comprehensive list of all measures and announcements in Chapter 2.
Annex A of the document presents an analysis of the impact of the Government’s tax and welfare proposals on households.
Annex B sets out the debt management and financing framework.
Annex C to this document is the OBR’s Budget forecast
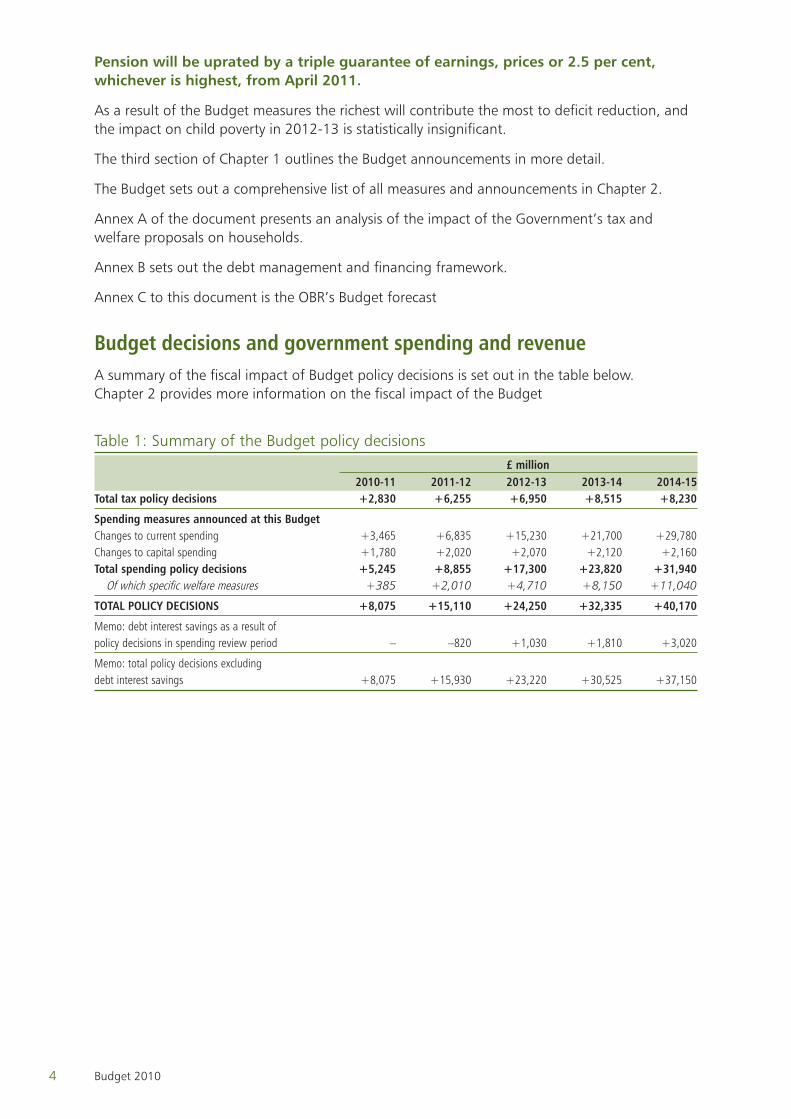
Budget decisions and government spending and revenueA summary of the fiscal impact of Budget policy decisions is set out in the table below. Chapter 2 provides more information on the fiscal impact of the Budget
Table 1: Summary of the Budget policy decisions £ million 2010-11 2011-12 2012-13 2013-14 2014-15Total tax policy decisions +2,830 +6,255 +6,950 +8,515 +8,230
Spending measures announced at this BudgetChanges to current spending +3,465 +6,835 +15,230 +21,700 +29,780Changes to capital spending +1,780 +2,020 +2,070 +2,120 +2,160Total spending policy decisions +5,245 +8,855 +17,300 +23,820 +31,940 Of which specific welfare measures +385 +2,010 +4,710 +8,150 +11,040
TOTAL POLICY DECISIONS +8,075 +15,110 +24,250 +32,335 +40,170
Memo: debt interest savings as a result of policy decisions in spending review period – –820 +1,030 +1,810 +3,020
Memo: total policy decisions excluding debt interest savings +8,075 +15,930 +23,220 +30,525 +37,150
5Budget 2010
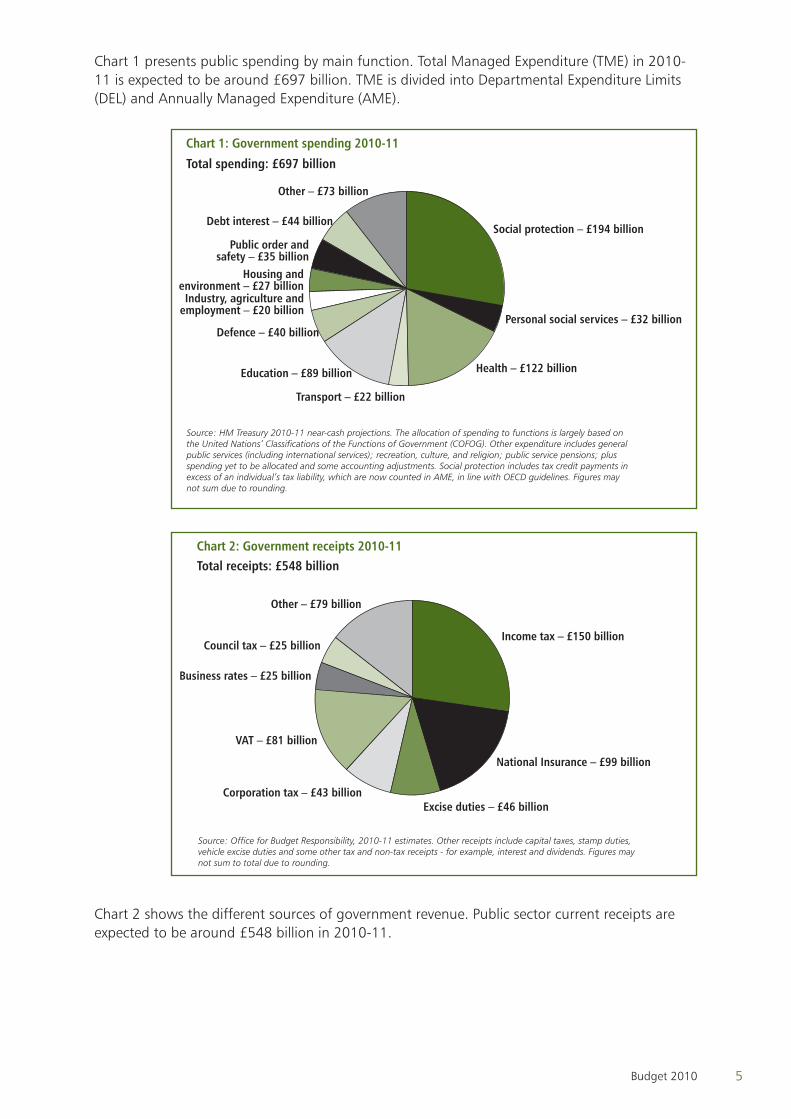
Chart 1 presents public spending by main function. Total Managed Expenditure (TME) in 2010-11 is expected to be around £697 billion. TME is divided into Departmental Expenditure Limits (DEL) and Annually Managed Expenditure (AME).
Chart 1: Government spending 2010-11
Total spending: £697 billion
Source: HM Treasury 2010-11 near-cash projections. The allocation of spending to functions is largely based on the United Nations’ Classifications of the Functions of Government (COFOG). Other expenditure includes general public services (including international services); recreation, culture, and religion; public service pensions; plus spending yet to be allocated and some accounting adjustments. Social protection includes tax credit payments in excess of an individual’s tax liability, which are now counted in AME, in line with OECD guidelines. Figures may not sum due to rounding.
Other – £73 billion
Debt interest – £44 billion
Public order and safety – £35 billion
Housing andenvironment – £27 billion
Industry, agriculture and employment – £20 billion
Defence – £40 billion
Education – £89 billion
Transport – £22 billion
Health – £122 billion
Personal social services – £32 billion
Social protection – £194 billion
Chart 2: Government receipts 2010-11Total receipts: £548 billion
Source: Office for Budget Responsibility, 2010-11 estimates. Other receipts include capital taxes, stamp duties, vehicle excise duties and some other tax and non-tax receipts - for example, interest and dividends. Figures may not sum to total due to rounding.
Other – £79 billion
Income tax – £150 billion
National Insurance – £99 billion
Excise duties – £46 billionCorporation tax – £43 billion
VAT – £81 billion
Business rates – £25 billion
Council tax – £25 billion
Chart 2 shows the different sources of government revenue. Public sector current receipts are expected to be around £548 billion in 2010-11.

6 Budget 2010

Budget Report
3742_00d_EFSR_Divider.indd 1 22/6/10 00:22:26

3742_00d_EFSR_Divider.indd 2 22/6/10 00:22:26
7Budget 2010
1 Budget Report
Deficit Reduction
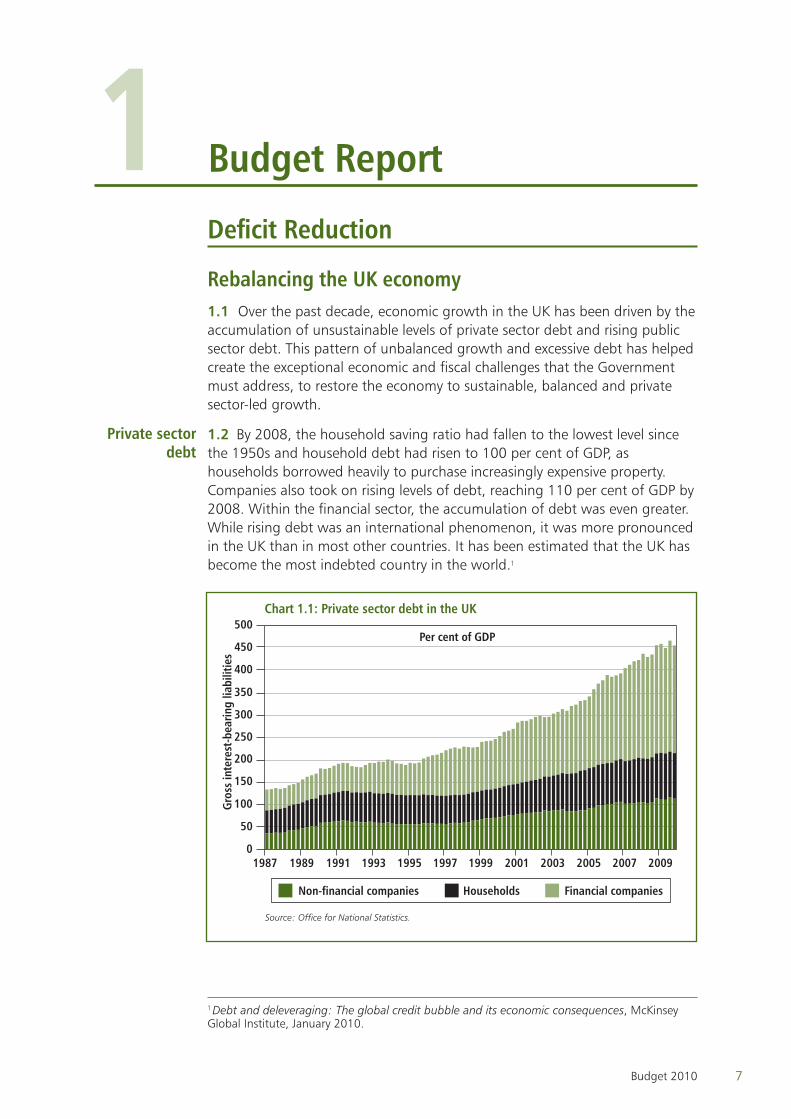
Rebalancing the UK economy Over the past decade, economic growth in the UK has been driven by the 1.1
accumulation of unsustainable levels of private sector debt and rising public sector debt. This pattern of unbalanced growth and excessive debt has helped create the exceptional economic and fiscal challenges that the Government must address, to restore the economy to sustainable, balanced and private sector-led growth.
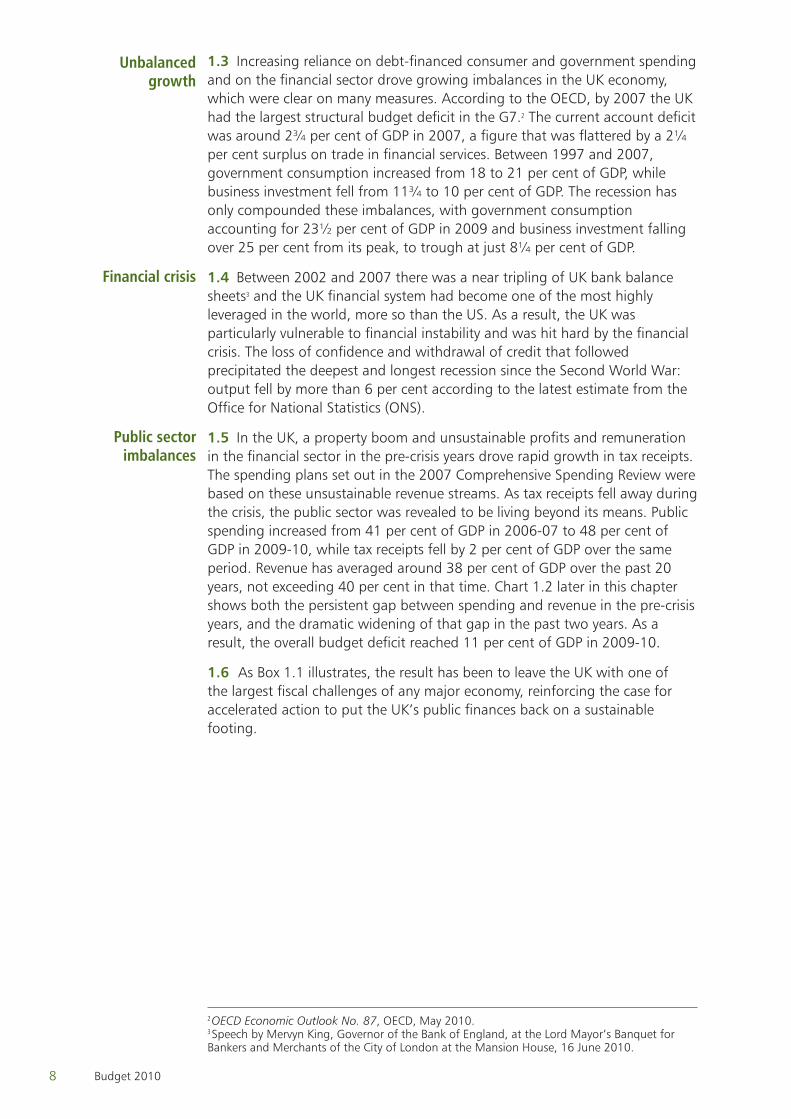
1.2 By 2008, the household saving ratio had fallen to the lowest level since the 1950s and household debt had risen to 100 per cent of GDP, as households borrowed heavily to purchase increasingly expensive property. Companies also took on rising levels of debt, reaching 110 per cent of GDP by 2008. Within the financial sector, the accumulation of debt was even greater. While rising debt was an international phenomenon, it was more pronounced in the UK than in most other countries. It has been estimated that the UK has become the most indebted country in the world.1
0
50
100
150
200
250
300
350
400
450
500
Financial companies
Households
Non-financial companies
200920072005200320011999199719951993199119891987
Chart 1.1: Private sector debt in the UK
Gro
ss in
tere
st-b
earin
g lia
bilit
ies
1987 1989 1991 1993 1995 1997 1999 2001 2003 2005 2007 2009
Source: Office for National Statistics.
Non-financial companies Households Financial companies
Per cent of GDP
1 Debt and deleveraging: The global credit bubble and its economic consequences, McKinsey Global Institute, January 2010.
Private sector debt
3742_01_Chapter_1.indd 7 22/6/10 00:22:41
8 Budget 2010
1.3 Increasing reliance on debt-financed consumer and government spending and on the financial sector drove growing imbalances in the UK economy, which were clear on many measures. According to the OECD, by 2007 the UK had the largest structural budget deficit in the G7.2 The current account deficit was around 2¾ per cent of GDP in 2007, a figure that was flattered by a 2¼ per cent surplus on trade in financial services. Between 1997 and 2007, government consumption increased from 18 to 21 per cent of GDP, while business investment fell from 11¾ to 10 per cent of GDP. The recession has only compounded these imbalances, with government consumption accounting for 23½ per cent of GDP in 2009 and business investment falling over 25 per cent from its peak, to trough at just 8¼ per cent of GDP.
1.4 Between 2002 and 2007 there was a near tripling of UK bank balance sheets3 and the UK financial system had become one of the most highly leveraged in the world, more so than the US. As a result, the UK was particularly vulnerable to financial instability and was hit hard by the financial crisis. The loss of confidence and withdrawal of credit that followed precipitated the deepest and longest recession since the Second World War: output fell by more than 6 per cent according to the latest estimate from the Office for National Statistics (ONS).
1.5 In the UK, a property boom and unsustainable profits and remuneration in the financial sector in the pre-crisis years drove rapid growth in tax receipts. The spending plans set out in the 2007 Comprehensive Spending Review were based on these unsustainable revenue streams. As tax receipts fell away during the crisis, the public sector was revealed to be living beyond its means. Public spending increased from 41 per cent of GDP in 2006-07 to 48 per cent of GDP in 2009-10, while tax receipts fell by 2 per cent of GDP over the same period. Revenue has averaged around 38 per cent of GDP over the past 20 years, not exceeding 40 per cent in that time. Chart 1.2 later in this chapter shows both the persistent gap between spending and revenue in the pre-crisis years, and the dramatic widening of that gap in the past two years. As a result, the overall budget deficit reached 11 per cent of GDP in 2009-10.
As Box 1.1 illustrates, the result has been to leave the UK with one of 1.6 the largest fiscal challenges of any major economy, reinforcing the case for accelerated action to put the UK’s public finances back on a sustainable footing.
2 OECD Economic Outlook No. 87, OECD, May 2010.3 Speech by Mervyn King, Governor of the Bank of England, at the Lord Mayor’s Banquet for Bankers and Merchants of the City of London at the Mansion House, 16 June 2010.
Unbalanced growth
Financial crisis
Public sector imbalances
3742_01_Chapter_1.indd 8 22/6/10 00:22:41
9Budget 2010
Box 1.1: The scale of the fiscal challenge
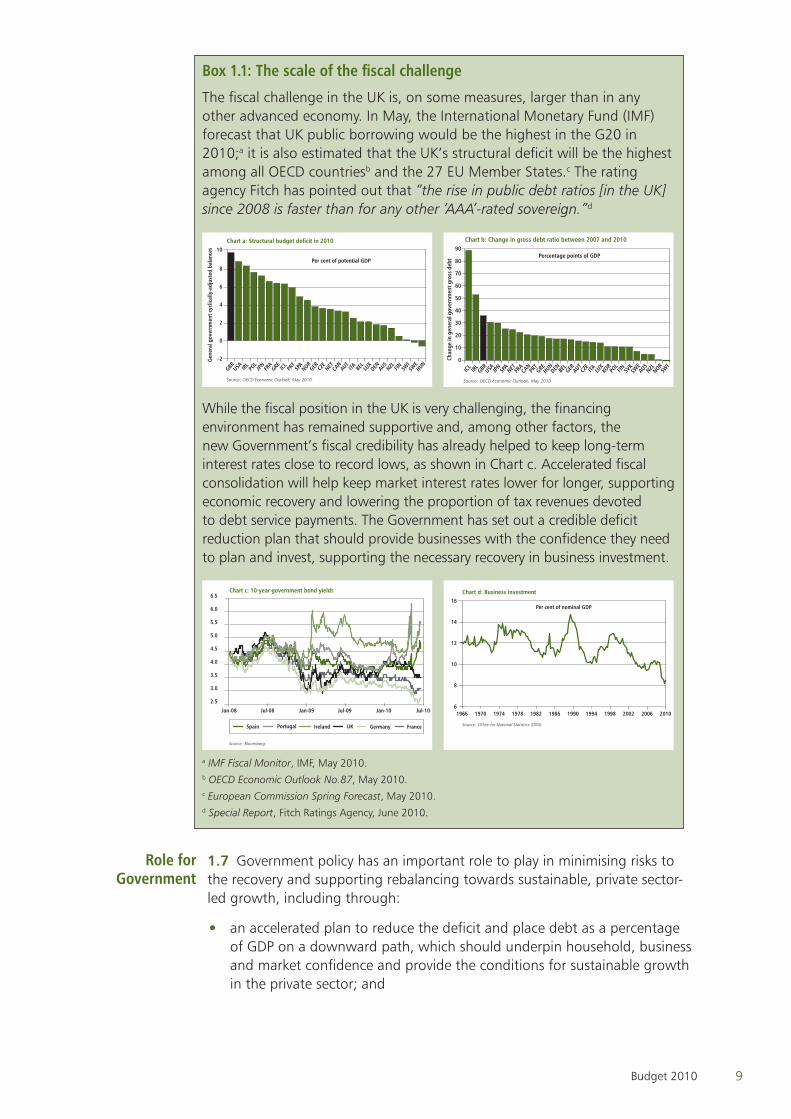
The fiscal challenge in the UK is, on some measures, larger than in any other advanced economy. In May, the International Monetary Fund (IMF)forecast that UK public borrowing would be the highest in the G20 in 2010;a it is also estimated that the UK’s structural deficit will be the highest among all OECD countriesb and the 27 EU Member States.c The rating agency Fitch has pointed out that “the rise in public debt ratios [in the UK] since 2008 is faster than for any other ‘AAA’-rated sovereign.”d
–2
0
2
4
6
8
10
HUNSW
ESW
IFINNZLAU
SDENLU
XBE
LITAAU
TCA
NNETCZ
EGERNOR
SPA
PRT
ICLGREFRA
JPN
POL
IRLUSAGBR
Chart a: Structural budget deficit in 2010
Source: OECD Economic Outlook, May 2010.
Per cent of potential GDP
Gen
eral
gov
ernm
ent c
yclic
ally
-adj
uste
d ba
lanc
es
0
10
20
30
40
50
60
70
80
90
SWI
NORNZLAU
SSW
ESV
KFINPO
LKO
RLU
XITACZ
EAU
TGERBE
LDENHUN
GREPRT
CAN
FRA
NETSPA
JPN
USAGBRIRLICL
Source: OECD Economic Outlook, May 2010.
Chart b: Change in gross debt ratio between 2007 and 2010
Percentage points of GDP
Chan
ge in
gen
eral
gov
ernm
ent g
ross
deb
t
While the fiscal position in the UK is very challenging, the financing environment has remained supportive and, among other factors, the new Government’s fiscal credibility has already helped to keep long-term interest rates close to record lows, as shown in Chart c. Accelerated fiscal consolidation will help keep market interest rates lower for longer, supporting economic recovery and lowering the proportion of tax revenues devoted to debt service payments. The Government has set out a credible deficit reduction plan that should provide businesses with the confidence they need to plan and invest, supporting the necessary recovery in business investment.
Chart c: 10-year government bond yields
Source: Bloomberg.
2.5
3.0
3.5
4.0
4.5
5.0
5.5
6.0
6.5
Jul-10Jan-10Jul-09Jan-09Jul-08Jan-08
Jan-08 Jul-08Jan-09
Jul-09Jan-10 Jul-10
UKSpain Portugal Ireland Germany France
6
8
10
12
14
16
1966 1970 1974 1978 1982 1986 1990 1994 1998 2002 2006 2010
Chart d: Business investment
Per cent of nominal GDP
Source: Office for National Statistics (ONS).
a IMF Fiscal Monitor, IMF, May 2010. b OECD Economic Outlook No.87, May 2010.c European Commission Spring Forecast, May 2010.d Special Report, Fitch Ratings Agency, June 2010.
1.7 Government policy has an important role to play in minimising risks to the recovery and supporting rebalancing towards sustainable, private sector-led growth, including through:
an accelerated plan to reduce the deficit and place debt as a percentage •of GDP on a downward path, which should underpin household, business and market confidence and provide the conditions for sustainable growth in the private sector; and
Role for Government
3742_01_Chapter_1.indd 9 22/6/10 00:22:43
10 Budget 2010
action to prevent the build-up of systemic macroeconomic and financial •risks, which will help ensure that the economy is no longer reliant on unsustainable, debt-financed activities.
The Government’s macroeconomic strategy will help provide a stable 1.8 economic foundation for private sector growth. Measures to promote enterprise will reduce regulation and tax rates and refocus support towards infrastructure, the low-carbon economy, and regional development. Measures to create a fair tax system will reward work and promote economic competitiveness. The Government’s policies in these areas are discussed in the enterprise and fairness sections of this chapter.
Box 1.2: Economic performance
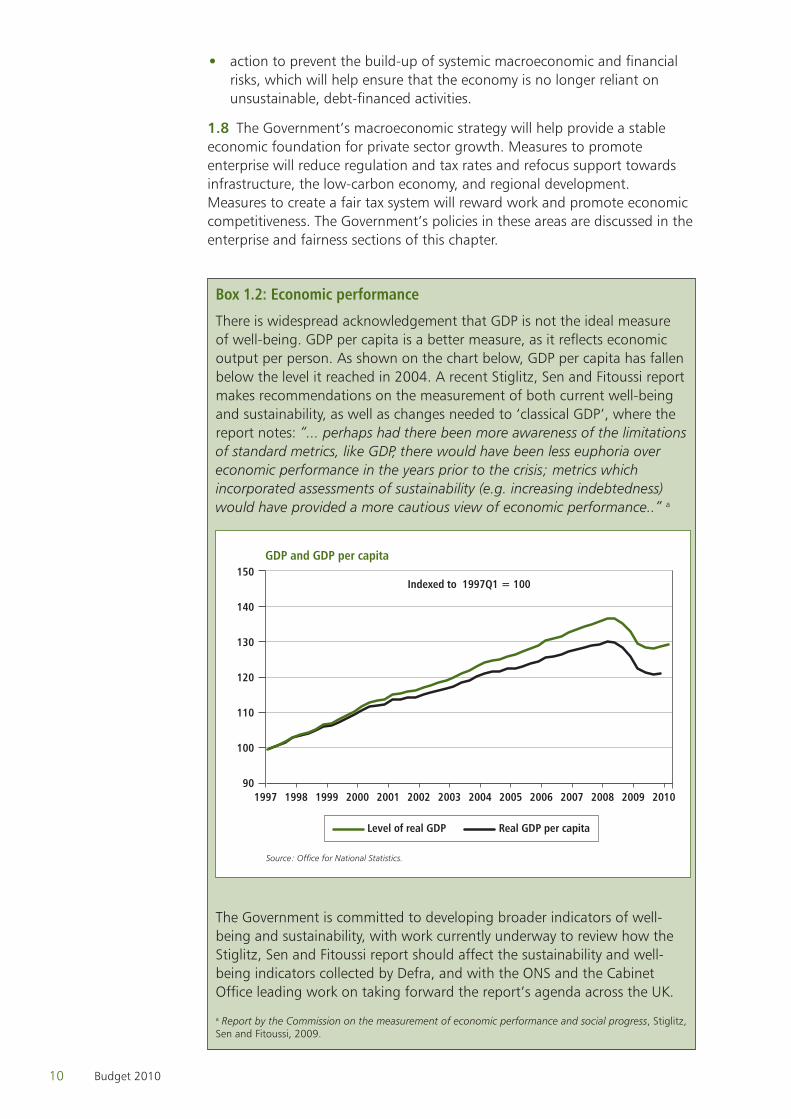
There is widespread acknowledgement that GDP is not the ideal measure of well-being. GDP per capita is a better measure, as it reflects economic output per person. As shown on the chart below, GDP per capita has fallen below the level it reached in 2004. A recent Stiglitz, Sen and Fitoussi report makes recommendations on the measurement of both current well-being and sustainability, as well as changes needed to ‘classical GDP’, where the report notes: “... perhaps had there been more awareness of the limitations of standard metrics, like GDP, there would have been less euphoria over economic performance in the years prior to the crisis; metrics which incorporated assessments of sustainability (e.g. increasing indebtedness) would have provided a more cautious view of economic performance..” a
GDP and GDP per capita
90
100
110
120
130
140
150
1997 1998 1999 2000 2001 2002 2003 2004 2005 2008
Indexed to 1997Q1 = 100
Source: Office for National Statistics.
Level of real GDP Real GDP per capita
2006 2007 2009 2010
The Government is committed to developing broader indicators of well-being and sustainability, with work currently underway to review how the Stiglitz, Sen and Fitoussi report should affect the sustainability and well-being indicators collected by Defra, and with the ONS and the Cabinet Office leading work on taking forward the report’s agenda across the UK.
a Report by the Commission on the measurement of economic performance and social progress, Stiglitz, Sen and Fitoussi, 2009.
3742_01_Chapter_1.indd 10 22/6/10 00:22:43
11Budget 2010
Macroeconomic strategyProviding the right macroeconomic conditions will help correct the 1.9
imbalance between the public and private sectors that built up over the past decade, underpinning a sustainable recovery that is more evenly balanced across regions and industries.
Fiscal policy framework
1.10 The current, historically high level of public borrowing risks undermining fairness, growth and economic stability in the UK. Borrowing must be brought under control and debt as a percentage of GDP must be placed on a downward path, as:
reducing public sector borrowing will underpin private sector confidence •and reduce competition for funds for private sector investment, supporting growth and job creation over the medium term;
failure to address rising public sector debt in the UK risks pushing up long- •term interest rates, which would affect not just the Government, but also families and businesses through the higher costs of loans and mortgages. The IMF has estimated that every ten percentage points of additional debt could raise interest rates by around ½ percentage point and reduce long-term economic growth by around ¼ percentage point.4 Public spending on debt interest is unproductive and squeezes out spending on public services;
reducing the deficit and so placing debt as a percentage of GDP on a •downward path provides scope to absorb the impact of future economic shocks; and
public borrowing is, in essence, taxation deferred, and it would be •irresponsible and unfair to accumulate substantial debts to fund spending that benefits today’s generation at the expense of subsequent generations.
1.11 This Budget sets out a comprehensive set of policies to bring the public finances back under control. It demonstrates the Government’s determination to reduce public sector borrowing and debt, promoting domestic and international confidence in the sustainability of the public finances, including by:
creating the new Office for Budget Responsibility (OBR), which introduces •independence, greater transparency and credibility to the economic and fiscal forecasts on which fiscal policy is based;
setting fiscal policy to restore the public finances to a sustainable position; and •
a clear and measurable fiscal mandate, which will guide fiscal policy •decisions over the medium term.
1.12 The Government’s fiscal policy decisions will be based on independent forecasts for the economy and public finances, prepared by the OBR. The OBR has already transparently laid out the full scale of the fiscal challenge. The Chancellor has also asked the OBR to judge whether the Government’s fiscal policy is consistent with a greater than 50 per cent chance of achieving the fiscal mandate. The establishment of the OBR places the UK at the forefront of
4 IMF Fiscal Monitor, November 2009 and May 2010.
Role of fiscal consolidation
Fiscal policy
The Office for Budget
Responsibility
3742_01_Chapter_1.indd 11 22/6/10 00:22:43
12 Budget 2010
institutional reform internationally. The IMF has advocated the benefits of such a model.5
For this Budget, the OBR has operated on an interim basis. The Terms 1.13 of Reference for the interim OBR were agreed on 8 June 2010 and published on the OBR’s website.6 The OBR will be put on a permanent footing once the necessary legislation has been enacted. The OBR’s pre-Budget forecast was published on 14 June 2010.7 Full details of the OBR’s Budget forecast are provided in Annex C.
For this Budget, the National Audit Office (NAO) has examined the 1.14 process by which the interim OBR’s forecasts have been arrived at. The Comptroller and Auditor General’s report confirms that, based on the NAO’s criteria, “the key economic and fiscal assumptions underpinning the interim Office for Budget Responsibility’s forecasts have been independently arrived at.”8
1.15 The Budget announces the Government’s forward-looking fiscal mandate to achieve cyclically-adjusted current balance by the end of the rolling, five-year forecast period. At this Budget, the end of the forecast period is 2015-16.
At this time of rapidly rising debt, the fiscal mandate will be 1.16 supplemented by a target for public sector net debt as a percentage of GDP to be falling at a fixed date of 2015-16, ensuring that the public finances are restored to a sustainable path. The Government has asked the OBR to assess whether policy is consistent with a greater than 50 per cent chance of meeting the target for debt.
This fiscal mandate, supplemented by the target for debt, will guide 1.17 fiscal policy decisions over the medium term, ensuring that the Government sets plans consistent with accelerating the reduction in the structural deficit so that debt as a percentage of GDP is restored to a sustainable, downward path. This will help reduce the risk of pushing up long-term interest rates and provide scope to absorb the impact of future economic shocks.
1.18 The fiscal mandate is based on:
the current balance, to protect the most productive public investment •expenditure; and
a cyclically-adjusted aggregate, to allow some fiscal flexibility at a time of •economic uncertainty.
The fiscal mandate applies to the end of the five-year forecast period, 1.19 set at this Budget as 2015-16. In the future, when the forecast period moves forward a year, the deficit target will continue to apply in the final year, so anchoring the Government’s medium-term fiscal stance.
The forward-looking fiscal mandate addresses a key failing of the 1.20 framework that was in place from 1997 to 2008: the formulation of the golden rule adopted during this period required the Government to balance the current budget over the economic cycle. This resulted in an approach that
5 Code of good practices on fiscal transparency, IMF, 2007.6 http://budgetresponsibility.independent.gov.uk.7 Pre-Budget forecast, Office for Budget Responsibility, June 2010.8 Examination concerning the forecasts prepared by the interim Office for Budget Responsibility for the emergency Budget, National Audit Office, June 2010.
Fiscal mandate
Design of mandate
3742_01_Chapter_1.indd 12 22/6/10 00:22:43
13Budget 2010
proved too backward looking, especially at the end of the economic cycle, allowing persistent fiscal deficits when growth was strong, on the basis of past surpluses.
Under the framework in place from 1997 to 2008, the Government 1.21 determined the dating of the economic cycle over which the golden rule applied, calling the credibility of the framework into question. The OBR will be responsible for key judgements relevant to achieving the fiscal mandate, in particular the cyclical position of the economy, which determines the structural position of the public finances.
The previous golden rule and sustainable investment rule were 1.22 suspended following the financial crisis. The first replacement, the temporary operating rule, was criticised as insufficiently specific to guide the fiscal position back to sustainability. The second replacement, the Fiscal Responsibility Act 2010, was insufficiently rigorous – public sector net borrowing was only required to be 5½ per cent of GDP by 2013-14.
The Government’s fiscal mandate requires that the cyclically-adjusted 1.23 current budget be returned to balance over the five-year forecast period. The target for debt is a fixed requirement for debt as a percentage of GDP to be falling in 2015-16, which will not move forward with the five-year forecast period, ensuring that the public finances are restored to a sustainable path.
The choices of a five-year rolling forecast period for the fiscal mandate, 1.24 supplemented by the fixed date for the debt target, reflect the exceptional environment in which the Government must address the fiscal challenge. They are designed to ensure that fiscal consolidation is delivered over a realistic and credible timescale. Once the public finances are closer to balance the period over which cyclically-adjusted current balance must be achieved could safely be shortened in order to create a tighter constraint. In addition, once the exceptional rise in debt has been addressed, a new target for debt as a percentage of GDP will be set, taking account of the OBR’s assessment of the long-term sustainability of the public finances.
1.25 The Stability and Growth Pact (SGP) provides a framework for fiscal policy in the European Union. The Excessive Deficit Procedure of the SGP recommends the Government reduce the Treaty deficit below 3 per cent of GDP by 2014-15. The OBR’s pre-Budget forecast showed the plans inherited by this Government leaving a Treaty deficit of 4.0 per cent of GDP in 2014-15. The plans set out in this Budget are consistent with reducing the Treaty deficit below 3 per cent of GDP by 2014-15 and placing the Treaty debt ratio on a downward path from 2013-14.
Macro-prudential policy framework
The recent crisis shows that price stability alone is not sufficient to 1.26 ensure wider economic and financial stability. During the years preceding the crisis, there was no single body or organisation with responsibility for addressing the build-up of systemic risks in the financial sector. As outlined in the Chancellor’s Mansion House speech of 16 June 2010,9 the Government is therefore introducing a new system of regulation, which will give the Bank of England control of macro-prudential regulation and oversight of micro-
9 Available at www.hm-treasury.gov.uk
Future approach
Stability and Growth Pact
3742_01_Chapter_1.indd 13 22/6/10 00:22:43
14 Budget 2010
prudential regulation. This new regulatory structure will ensure that there is clear responsibility for monitoring and acting upon the build-up of systemic risks. The Government has also established an independent commission on banking, chaired by Sir John Vickers. This commission will consider the structure of the UK banking sector and make recommendations to the Cabinet Committee on Banking Reform by the end of September 2011.
Monetary policy framework
While price stability has not proved sufficient for wider economic 1.27 stability, it remains a necessary condition. The Government is therefore fully committed to maintaining price stability. The Chancellor has decided that the independent Monetary Policy Committee (MPC) of the Bank of England will continue to target 2 per cent inflation, as measured by the 12-month increase in the Consumer Prices Index (CPI).
Deficit reductionScale of the fiscal challenge
Compared with the March Budget forecast, the OBR estimates that a 1.28 lower proportion of the UK’s budget deficit results from the cyclical position of the economy and a greater proportion reflects an underlying structural deficit. The OBR’s pre-Budget forecast estimated that the cyclically-adjusted or ‘structural’ deficit in 2010-11 was 0.6 per cent of GDP higher than estimated in the March Budget.
The OBR’s pre-Budget forecast showed that, without further action to 1.29 tackle the deficit:
public sector net borrowing would remain at 4 per cent of GDP in five •years time, having been above 5 per cent of GDP for six consecutive years, unprecedented in the post-war period;
the structural deficit would be 2.8 per cent of GDP in 2014-15, while the •structural current deficit would be 1.6 per cent; and
debt would still be rising in 2014-15 to 74.4 per cent of GDP, with debt •interest payments set to reach £67 billion in that year.
The OBR’s pre-Budget forecast used market expectations for short-term 1.30 and long-term interest rates. The OBR recognised that those market rates reflected investors’ expectations about the measures to be introduced in the Budget and the possible response of the Monetary Policy Committee to further consolidation. As a result, the OBR made clear in its pre-Budget forecast, “in present conditions the likely result is that these economic forecasts are biased upwards: to the extent that market expectations factor in tighter fiscal policy than assumed in these projections, then following the fiscal path assumed here would lead to higher interest rates and so lower economic activity than set out in this projection.”10
10 Pre-Budget forecast, Office for Budget Responsibility, June 2010.
3742_01_Chapter_1.indd 14 22/6/10 00:22:43
15Budget 2010
Approach to deficit reduction
1.31 The Government’s fiscal consolidation plans have been designed with growth and fairness in mind, as far as possible:
protecting the most productive public investment expenditure; •
avoiding punitive increases in tax rates on capital and labour; and •
reforming the welfare system to reward work. •
The greatest contribution to the Government’s fiscal consolidation 1.32 will come from public spending reductions, rather than tax increases. This approach is consistent with OECD and IMF research, which suggests that fiscal consolidation efforts that largely rely on spending restraint promote growth.11 Tax measures can be an effective tool for reducing the deficit quickly, allowing for phased reductions in public spending. The Government’s consolidation plans therefore involve a rising contribution from public spending over the forecast period.
1.33 This Budget delivers additional consolidation on top of the plans set in the March Budget for the period to 2014-15, with additional spending reductions of £32 billion a year by 2014-15 and additional net tax increases of £8 billion. This results in plans for a total consolidation of £128 billion per year by 2015-16, consisting of total reductions in spending of £99 billion and a net increase in taxes of £29 billion.
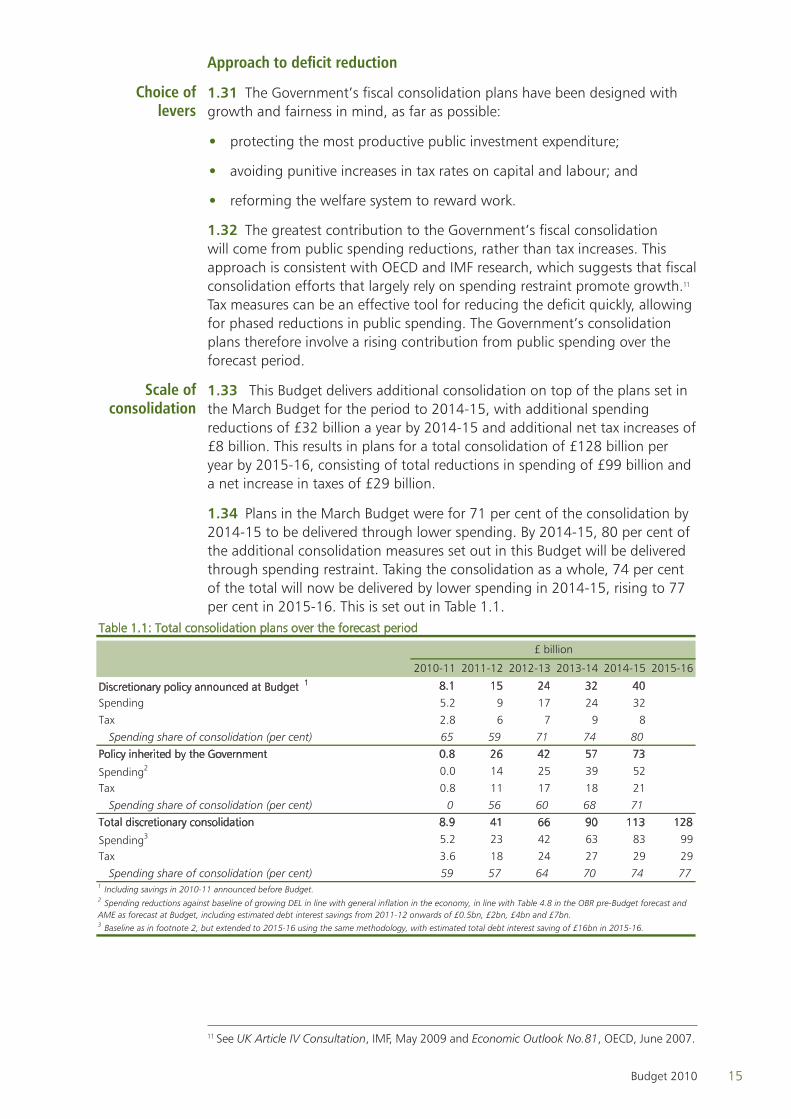
Plans in the March Budget were for 71 per cent of the consolidation by 1.34 2014-15 to be delivered through lower spending. By 2014-15, 80 per cent of the additional consolidation measures set out in this Budget will be delivered through spending restraint. Taking the consolidation as a whole, 74 per cent of the total will now be delivered by lower spending in 2014-15, rising to 77 per cent in 2015-16. This is set out in Table 1.1.
Table 1.1: Total consolidation plans over the forecast period
2010-11 2011-12 2012-13 2013-14 2014-15 2015-16
Discretionary policy announced at Budget 1 8.1 15 24 32 40
Spending 5.2 9 17 24 32
Tax 2.8 6 7 9 8
Spending share of consolidation (per cent) 65 59 71 74 80
Policy inherited by the Government 0.8 26 42 57 73
Spending2 0.0 14 25 39 52
Tax 0.8 11 17 18 21
Spending share of consolidation (per cent) 0 56 60 68 71
Total discretionary consolidation 8.9 41 66 90 113 128
Spending3 5.2 23 42 63 83 99
Tax 3.6 18 24 27 29 29
Spending share of consolidation (per cent) 59 57 64 70 74 77
3 Baseline as in footnote 2, but extended to 2015-16 using the same methodology, with estimated total debt interest saving of £16bn in 2015-16.
2 Spending reductions against baseline of growing DEL in line with general inflation in the economy, in line with Table 4.8 in the OBR pre-Budget forecast and AME as forecast at Budget, including estimated debt interest savings from 2011-12 onwards of £0.5bn, £2bn, £4bn and £7bn.
1 Including savings in 2010-11 announced before Budget.
£ billion
11 See UK Article IV Consultation, IMF, May 2009 and Economic Outlook No.81, OECD, June 2007.
Choice of levers
Scale of consolidation
3742_01_Chapter_1.indd 15 22/6/10 00:22:43
16 Budget 2010
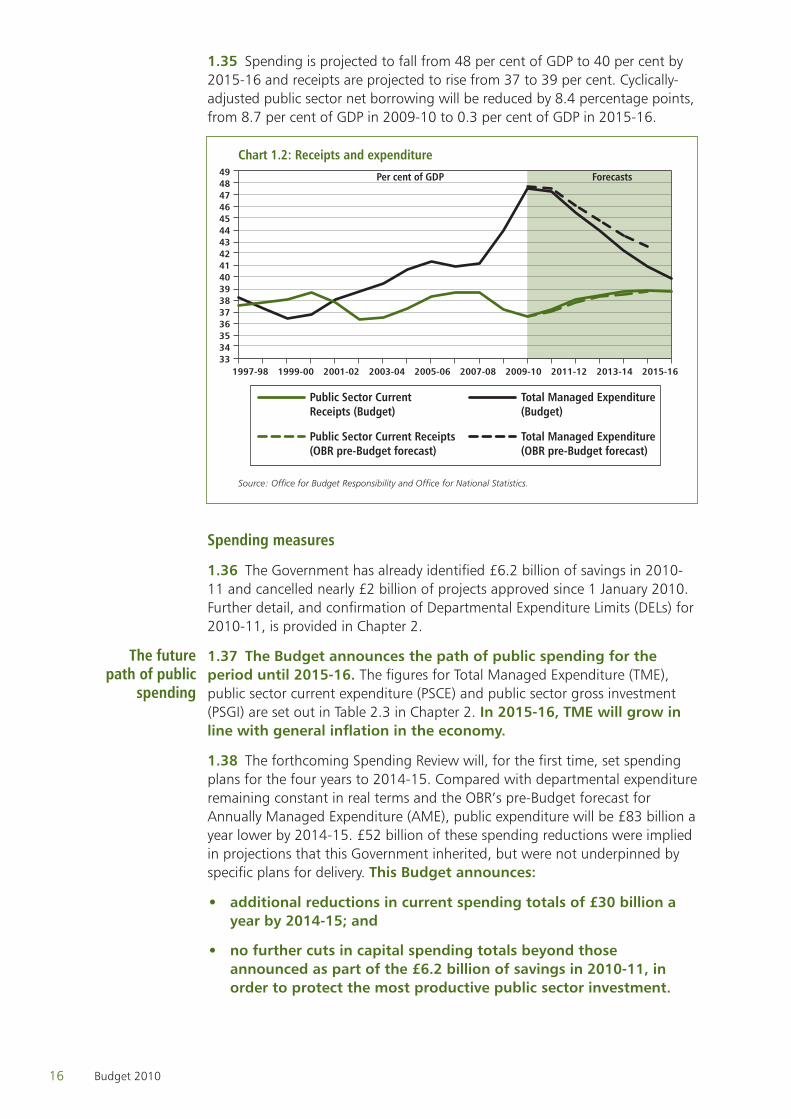
Spending is projected to fall from 48 per cent of GDP to 40 per cent by 1.35 2015-16 and receipts are projected to rise from 37 to 39 per cent. Cyclically-adjusted public sector net borrowing will be reduced by 8.4 percentage points, from 8.7 per cent of GDP in 2009-10 to 0.3 per cent of GDP in 2015-16.
3334353637383940414243444546474849
TME (pre-Budget forecast)
Public Sector Current Receipts (pre-Budget forecast)
Total Managed Expenditure (June Budget)
Public Sector Current Receipts (June Budget)
2015-162013-142011-122009-102007-082005-062003-042001-021999-001997-98
Chart 1.2: Receipts and expenditure
Source: Office for Budget Responsibility and Office for National Statistics.
Public Sector CurrentReceipts (Budget)
Total Managed Expenditure (Budget)
Public Sector Current Receipts(OBR pre-Budget forecast)
Total Managed Expenditure(OBR pre-Budget forecast)
Per cent of GDP Forecasts
Spending measures
The Government has already identified £6.2 billion of savings in 2010-1.36 11 and cancelled nearly £2 billion of projects approved since 1 January 2010. Further detail, and confirmation of Departmental Expenditure Limits (DELs) for 2010-11, is provided in Chapter 2.
1.37 The Budget announces the path of public spending for the period until 2015-16. The figures for Total Managed Expenditure (TME), public sector current expenditure (PSCE) and public sector gross investment (PSGI) are set out in Table 2.3 in Chapter 2. In 2015-16, TME will grow in line with general inflation in the economy.
The forthcoming Spending Review will, for the first time, set spending 1.38 plans for the four years to 2014-15. Compared with departmental expenditure remaining constant in real terms and the OBR’s pre-Budget forecast for Annually Managed Expenditure (AME), public expenditure will be £83 billion a year lower by 2014-15. £52 billion of these spending reductions were implied in projections that this Government inherited, but were not underpinned by specific plans for delivery. This Budget announces:
additional reductions in current spending totals of £30 billion a •year by 2014-15; and
no further cuts in capital spending totals beyond those •announced as part of the £6.2 billion of savings in 2010-11, in order to protect the most productive public sector investment.
The future path of public
spending
3742_01_Chapter_1.indd 16 22/6/10 00:22:44
17Budget 2010
• This Budget announces that the 2010 Spending Review will be published on 20 October 2010. An engagement programme will launch on 24 June 2010, giving public sector workers and members of the public an opportunity to feed in their ideas for how to reduce spending while protecting the quality of public services.
1.39 The Spending Review will set DELs for every department and for the devolved administrations.12 It will also announce plans for any further savings and reforms in significant elements of AME, including social security, tax credits and public service pensions.13 The Budget sets firm and fixed envelopes for the areas of current and capital spending included within the Spending Review. These are published in Table 2.3 in Chapter 2.
To promote transparency and understanding of the broad magnitude 1.40 of spending changes, Table 2.3 presents indicative figures for the overall level of current and capital DEL spending in the years to 2015-16. These are based on the OBR’s Budget forecast for AME, as set out in Annex C, which takes account of specific AME measures announced so far. Based on these implied DEL figures, and once the Government’s commitments on protecting health and overseas aid are taken into account, other departments could see average real cuts to their budgets of around 25 per cent over the four years. This compares with the average real cuts of around 20 per cent for unprotected departments implied by the March Budget.14 The final split between AME and DEL will be decided at the Spending Review, and any further AME savings will reduce the size of cuts to departmental budgets.
1.41 The Budget also announces significant measures on public sector pay and welfare reform that contribute to spending consolidation. Savings from these measures will help to protect the quality of public services as overall public spending is reduced.
The Government announces a two-year pay freeze for public 1.42 sector workforces, except for workers earning less than £21,000 a year who will receive an increase of at least £250 per year in these years. This will save £3.3 billion a year by 2014-15. An independent commission chaired by John Hutton will undertake a fundamental, structural review of public service pension provision by Budget 2011 and consider the case for short-term savings in the Spending Review period, by September 2010.
Spending on social security and tax credits has increased by 45 per 1.43 cent, around £60 billion, in real terms over the past 10 years. Welfare reform measures in this Budget reduce overall expenditure on social security, saving £11 billion in 2014-15. The Government will adopt the CPI for the indexation of benefits, tax credits and public service pensions from April 2011. The Government will also introduce measures to control spending on tax credits, housing benefit and disability benefits. Alongside these reforms, it is introducing measures to protect pensioners and low-income families with children. Further details are set out in the fairness
12 For further information, see The Spending Review Framework, HM Treasury, June 2010.13 Central government debt interest, BBC domestic services, National Lottery and net expenditure transfers to EU institutions will be excluded from the Spending Review process, as they are either self-financing or not directly within Government control.14 This included commitments to protect resource spending on NHS, overseas aid, schools, 16-19 education, Sure Start, and police numbers.
The Spending Review process
The Spending Review
envelope
Budget spending measures
3742_01_Chapter_1.indd 17 22/6/10 00:22:44
18 Budget 2010
section of this chapter. The Government is also reviewing how the CPI can be used for the indexation of taxes and duties while protecting revenues.
Tax measures
1.44 The Budget announces tax measures to reduce the deficit and reform the tax system:
the standard rate of Value Added Tax (VAT) will increase from •17.5 per cent to 20 per cent from 4 January 2011. VAT is a sustainable source of revenue and is less distortionary than other major tax bases. The incresase will raise £13.5 billion a year, on a scorecard basis, by 2014-15. Following this increase, the main rate of VAT will remain below the European Union average. This Budget makes no changes to the VAT zero rating for household essentials, nor to the reduced rate of VAT; and
in line with the increase in the VAT rate, • the higher rate of Insurance Premium Tax (IPT) will increase on 4 January 2011, from 17.5 per cent to 20 per cent, while the standard rate will increase from 5 per cent to 6 per cent. This will raise £0.5 billion a year by 2014-15.
1.45 As set out in more detail in the fairness and enterprise sections of this chapter, the Budget also announces wider changes to the tax system. These include reform and rebalancing of business taxes, including the introduction of a bank levy, and an increase to the personal allowance, in part financed by an increase in capital gains tax.
Taken together, the tax measures announced in this Budget rebalance 1.46 the tax system to increase its overall economic efficiency, improve its sustainability and support a fair reduction in the deficit. In total, the net tax contribution in this Budget is £8 billion a year by 2014-15.
Economic and fiscal forecastEconomic forecast
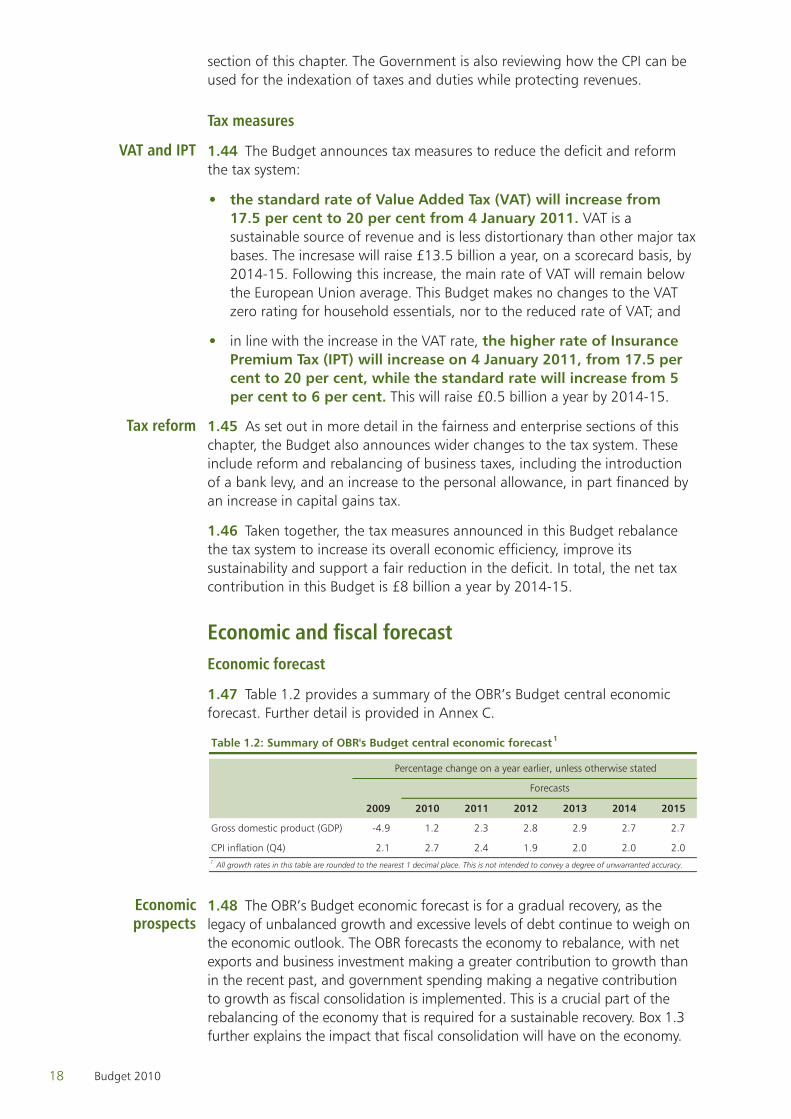
Table 1.2 provides a summary of the OBR’s Budget central economic 1.47 forecast. Further detail is provided in Annex C.
Table 1.2: Summary of OBR's Budget central economic forecast1
2009 2010 2011 2012 2013 2014 2015
Gross domestic product (GDP) -4.9 1.2 2.3 2.8 2.9 2.7 2.7
CPI inflation (Q4) 2.1 2.7 2.4 1.9 2.0 2.0 2.01 All growth rates in this table are rounded to the nearest 1 decimal place. This is not intended to convey a degree of unwarranted accuracy.
Percentage change on a year earlier, unless otherwise stated
Forecasts
1.48 The OBR’s Budget economic forecast is for a gradual recovery, as the legacy of unbalanced growth and excessive levels of debt continue to weigh on the economic outlook. The OBR forecasts the economy to rebalance, with net exports and business investment making a greater contribution to growth than in the recent past, and government spending making a negative contribution to growth as fiscal consolidation is implemented. This is a crucial part of the rebalancing of the economy that is required for a sustainable recovery. Box 1.3 further explains the impact that fiscal consolidation will have on the economy.
VAT and IPT
Tax reform
Economic prospects
3742_01_Chapter_1.indd 18 22/6/10 00:22:44
19Budget 2010
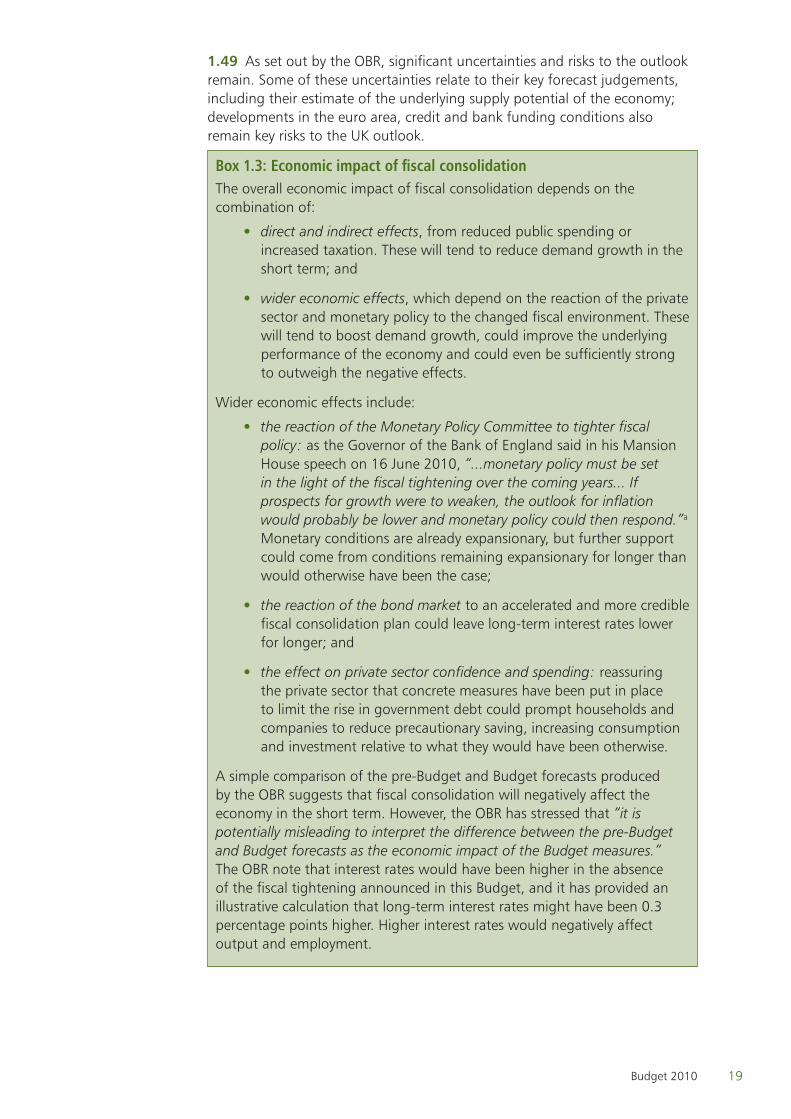
As set out by the OBR, significant uncertainties and risks to the outlook 1.49 remain. Some of these uncertainties relate to their key forecast judgements, including their estimate of the underlying supply potential of the economy; developments in the euro area, credit and bank funding conditions also remain key risks to the UK outlook.
Box 1.3: Economic impact of fiscal consolidationThe overall economic impact of fiscal consolidation depends on the combination of:
direct and indirect effects • , from reduced public spending or increased taxation. These will tend to reduce demand growth in the short term; and
wider economic effects • , which depend on the reaction of the private sector and monetary policy to the changed fiscal environment. These will tend to boost demand growth, could improve the underlying performance of the economy and could even be sufficiently strong to outweigh the negative effects.
Wider economic effects include:
the reaction of the Monetary Policy Committee to tighter fiscal •policy: as the Governor of the Bank of England said in his Mansion House speech on 16 June 2010, “...monetary policy must be set in the light of the fiscal tightening over the coming years... If prospects for growth were to weaken, the outlook for inflation would probably be lower and monetary policy could then respond.”a Monetary conditions are already expansionary, but further support could come from conditions remaining expansionary for longer than would otherwise have been the case;
the reaction of the bond market • to an accelerated and more credible fiscal consolidation plan could leave long-term interest rates lower for longer; and
the effect on private sector confidence and spending: • reassuring the private sector that concrete measures have been put in place to limit the rise in government debt could prompt households and companies to reduce precautionary saving, increasing consumption and investment relative to what they would have been otherwise.
A simple comparison of the pre-Budget and Budget forecasts produced by the OBR suggests that fiscal consolidation will negatively affect the economy in the short term. However, the OBR has stressed that “it is potentially misleading to interpret the difference between the pre-Budget and Budget forecasts as the economic impact of the Budget measures.” The OBR note that interest rates would have been higher in the absence of the fiscal tightening announced in this Budget, and it has provided an illustrative calculation that long-term interest rates might have been 0.3 percentage points higher. Higher interest rates would negatively affect output and employment.
3742_01_Chapter_1.indd 19 22/6/10 00:22:44
20 Budget 2010
As the OBR makes clear, its forecasts are surrounded by a significant degree of risk and uncertainty. A key benefit of taking decisive action on fiscal consolidation is to reduce the risks associated with failing to correct the fiscal position, in particular that high levels of public debt could trigger a sudden loss of market confidence, leading to higher market interest rates. Since the end of March, the spread of government bond yields over German bunds has increased sharply in those countries where market concerns about fiscal credibility have heightened: by around 1½ percentage points on average in Spain, Portugal and Ireland. In the UK, the change has been close to zero. A simple comparison of forecasts would not reflect the significant economic benefit of reducing the risk of such adverse outcomes. a Available at www.bankofengland.co.uk
1.50 The OBR’s forecast is based on the judgement that the current level of trend output is lower than assumed in the March Budget, and the negative output gap is therefore smaller. Their projection for trend growth is also lower, at around 2¼ per cent over the next three years, slowing to just over 2 per cent from 2014. That compares with 2¾ per cent a year assumed for the March Budget economy forecast and 2½ per cent underpinning the public finance projections.
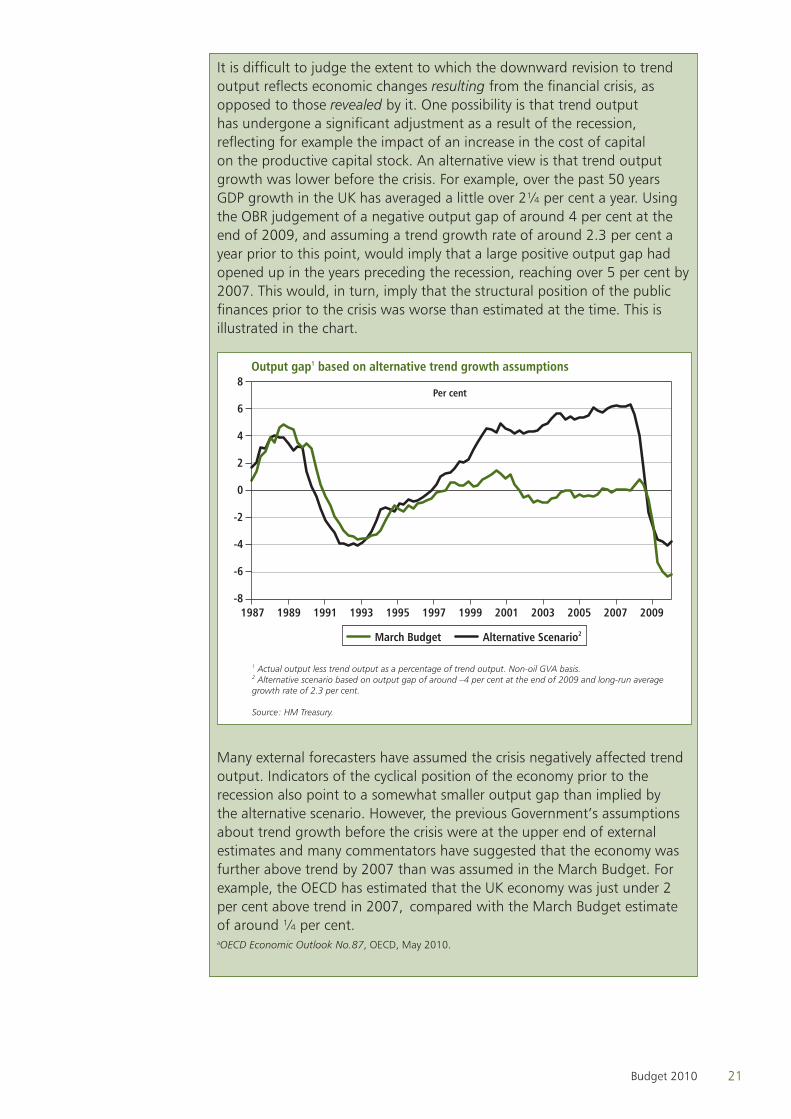
Box 1.4: Output gap assessmentThe depth of the recession means there is great uncertainty about what has happened to ‘trend’ or ‘potential’ output over the recent past. Previous official estimates assumed that the financial crisis had brought about a downward adjustment to potential output. In particular, the March Budget estimated that trend growth would average just under 1 per cent between mid-2007 and mid-2010, before reverting to a pre-crisis projection of 2¾ per cent. As shown by the chart below, this implied a negative output gap of just over 6 per cent at the end of 2009. The OBR’s central judgement is that a range of indicators point to a smaller negative output gap of around 4 per cent at the end of 2009, and that the current level of trend output is therefore lower than assumed for the March Budget.
Trend output
3742_01_Chapter_1.indd 20 22/6/10 00:22:44
21Budget 2010
It is difficult to judge the extent to which the downward revision to trend output reflects economic changes resulting from the financial crisis, as opposed to those revealed by it. One possibility is that trend output has undergone a significant adjustment as a result of the recession, reflecting for example the impact of an increase in the cost of capital on the productive capital stock. An alternative view is that trend output growth was lower before the crisis. For example, over the past 50 years GDP growth in the UK has averaged a little over 2¼ per cent a year. Using the OBR judgement of a negative output gap of around 4 per cent at the end of 2009, and assuming a trend growth rate of around 2.3 per cent a year prior to this point, would imply that a large positive output gap had opened up in the years preceding the recession, reaching over 5 per cent by 2007. This would, in turn, imply that the structural position of the public finances prior to the crisis was worse than estimated at the time. This is illustrated in the chart.
Output gap1 based on alternative trend growth assumptions
-8
-6
-4
-2
0
2
4
6
8Per cent
Alternative Scenario2March Budget
1 Actual output less trend output as a percentage of trend output. Non-oil GVA basis. 2 Alternative scenario based on output gap of around –4 per cent at the end of 2009 and long-run averagegrowth rate of 2.3 per cent.
Source: HM Treasury.
1987 1989 1991 1993 1995 1997 1999 2001 2003 2005 2007 2009
Many external forecasters have assumed the crisis negatively affected trend output. Indicators of the cyclical position of the economy prior to the recession also point to a somewhat smaller output gap than implied by the alternative scenario. However, the previous Government’s assumptions about trend growth before the crisis were at the upper end of external estimates and many commentators have suggested that the economy was further above trend by 2007 than was assumed in the March Budget. For example, the OECD has estimated that the UK economy was just under 2 per cent above trend in 2007, compared with the March Budget estimate of around ¼ per cent. aOECD Economic Outlook No.87, OECD, May 2010.
3742_01_Chapter_1.indd 21 22/6/10 00:22:44
22 Budget 2010
Fiscal forecast
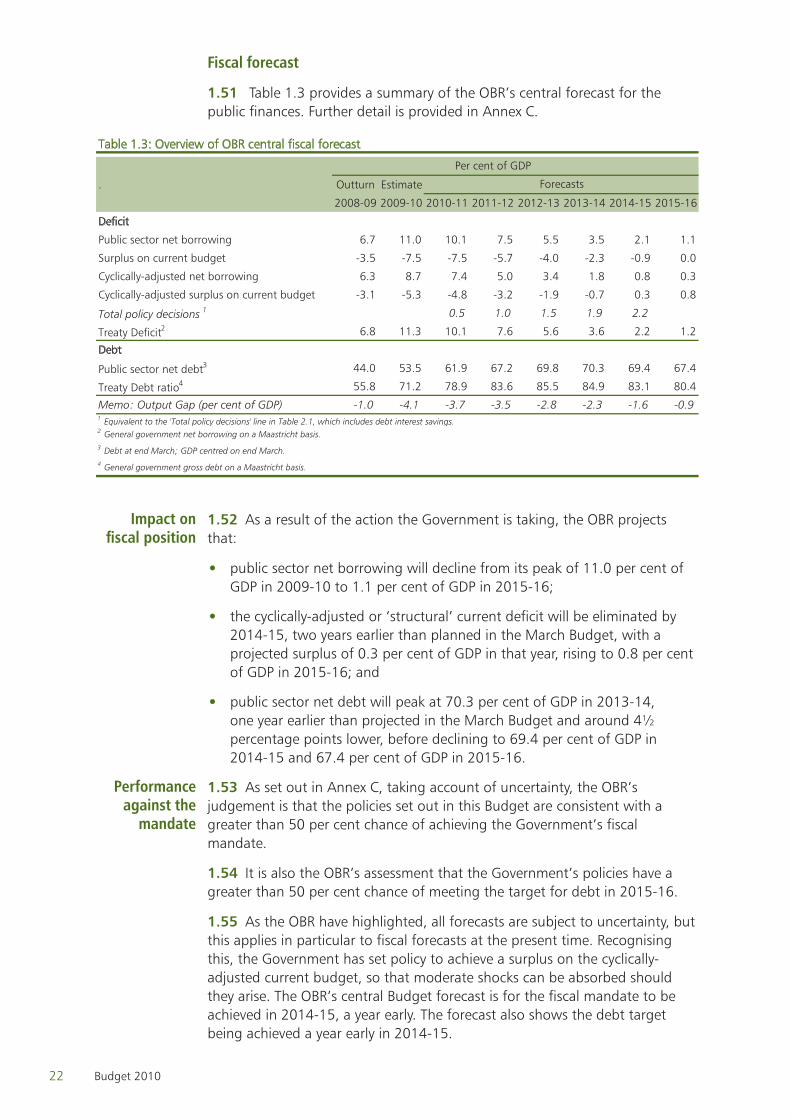
Table 1.3 provides a summary of the OBR’s central forecast for the 1.51 public finances. Further detail is provided in Annex C.
Table 1.3: Overview of OBR central fiscal forecast
. Outturn Estimate
2008-09 2009-10 2010-11 2011-12 2012-13 2013-14 2014-15 2015-16
Deficit
Public sector net borrowing 6.7 11.0 10.1 7.5 5.5 3.5 2.1 1.1
Surplus on current budget -3.5 -7.5 -7.5 -5.7 -4.0 -2.3 -0.9 0.0
Cyclically-adjusted net borrowing 6.3 8.7 7.4 5.0 3.4 1.8 0.8 0.3
Cyclically-adjusted surplus on current budget -3.1 -5.3 -4.8 -3.2 -1.9 -0.7 0.3 0.8
Total policy decisions 1 0.5 1.0 1.5 1.9 2.2
Treaty Deficit2 6.8 11.3 10.1 7.6 5.6 3.6 2.2 1.2
Debt
Public sector net debt3 44.0 53.5 61.9 67.2 69.8 70.3 69.4 67.4
Treaty Debt ratio4 55.8 71.2 78.9 83.6 85.5 84.9 83.1 80.4
Memo: Output Gap (per cent of GDP) -1.0 -4.1 -3.7 -3.5 -2.8 -2.3 -1.6 -0.91 Equivalent to the 'Total policy decisions' line in Table 2.1, which includes debt interest savings.2 General government net borrowing on a Maastricht basis. 3 Debt at end March; GDP centred on end March.4 General government gross debt on a Maastricht basis.
Per cent of GDP
Forecasts
1.52 As a result of the action the Government is taking, the OBR projects that:
public sector net borrowing will decline from its peak of 11.0 per cent of •GDP in 2009-10 to 1.1 per cent of GDP in 2015-16;
the cyclically-adjusted or ‘structural’ current deficit will be eliminated by •2014-15, two years earlier than planned in the March Budget, with a projected surplus of 0.3 per cent of GDP in that year, rising to 0.8 per cent of GDP in 2015-16; and
public sector net debt will peak at 70.3 per cent of GDP in 2013-14, •one year earlier than projected in the March Budget and around 4½ percentage points lower, before declining to 69.4 per cent of GDP in 2014-15 and 67.4 per cent of GDP in 2015-16.
1.53 As set out in Annex C, taking account of uncertainty, the OBR’s judgement is that the policies set out in this Budget are consistent with a greater than 50 per cent chance of achieving the Government’s fiscal mandate.
It is also the OBR’s assessment that the Government’s policies have a 1.54 greater than 50 per cent chance of meeting the target for debt in 2015-16.
As the OBR have highlighted, all forecasts are subject to uncertainty, but 1.55 this applies in particular to fiscal forecasts at the present time. Recognising this, the Government has set policy to achieve a surplus on the cyclically-adjusted current budget, so that moderate shocks can be absorbed should they arise. The OBR’s central Budget forecast is for the fiscal mandate to be achieved in 2014-15, a year early. The forecast also shows the debt target being achieved a year early in 2014-15.
Impact on fiscal position
Performance against the
mandate
3742_01_Chapter_1.indd 22 22/6/10 00:22:44
23Budget 2010
Source: Office for Budget Responsibility and HM Treasury.Note: The March Budget forecast extended to 2014-15 and assumed further consolidation to 2016-17. This Budget forecasts to 2015-16.
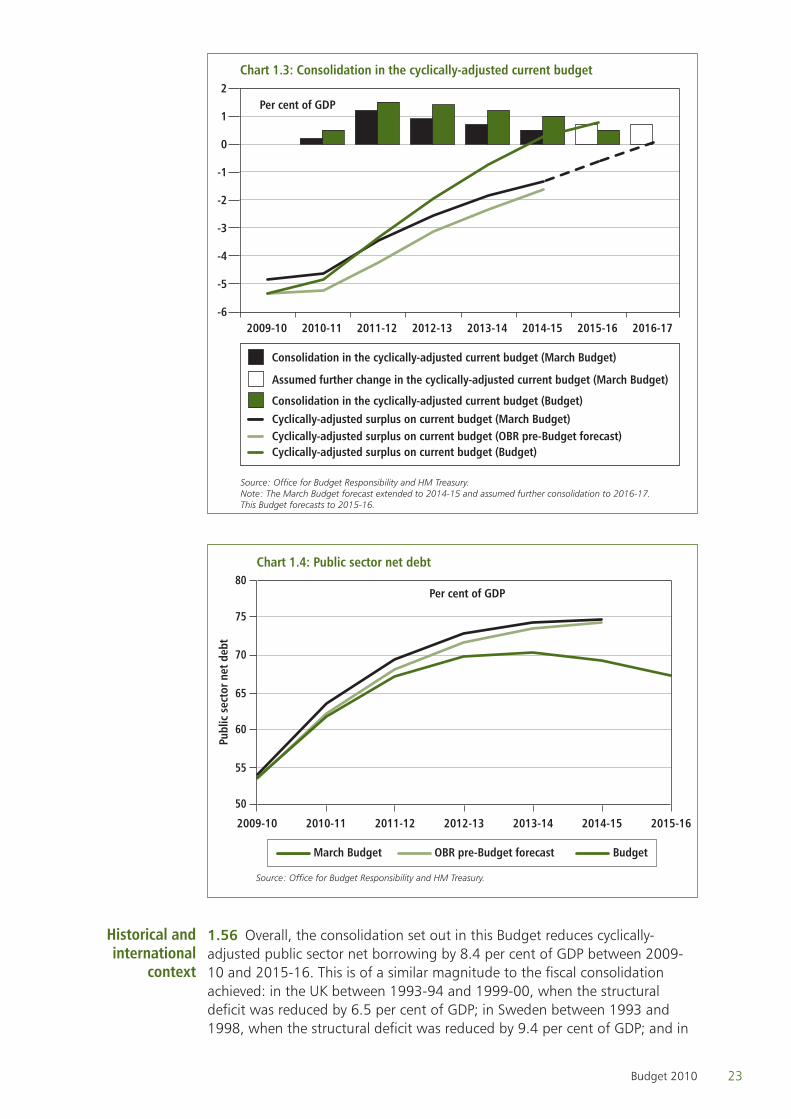
Chart 1.3: Consolidation in the cyclically-adjusted current budget
Per cent of GDP
Consolidation in the cyclically-adjusted current budget (March Budget)
Cyclically-adjusted surplus on current budget (March Budget)Cyclically-adjusted surplus on current budget (OBR pre-Budget forecast)Cyclically-adjusted surplus on current budget (Budget)
Assumed further change in the cyclically-adjusted current budget (March Budget)
Consolidation in the cyclically-adjusted current budget (Budget)
-6
-5
-4
-3
-2
-1
0
1
2
2016-172015-162014-152013-142012-132011-122010-112009-10
Source: Office for Budget Responsibility and HM Treasury.
Chart 1.4: Public sector net debt
50
55
60
65
70
75
80Per cent of GDP
March Budget OBR pre-Budget forecast Budget
2009-10 2010-11 2011-12 2012-13 2013-14 2014-15 2015-16
Publ
ic s
ecto
r net
deb
t
1.56 Overall, the consolidation set out in this Budget reduces cyclically-adjusted public sector net borrowing by 8.4 per cent of GDP between 2009-10 and 2015-16. This is of a similar magnitude to the fiscal consolidation achieved: in the UK between 1993-94 and 1999-00, when the structural deficit was reduced by 6.5 per cent of GDP; in Sweden between 1993 and 1998, when the structural deficit was reduced by 9.4 per cent of GDP; and in
Historical and international
context
3742_01_Chapter_1.indd 23 22/6/10 00:22:45
24 Budget 2010
Canada between 1992 and 1999, when the structural deficit was reduced by 7.5 per cent of GDP.15
The Government’s plans bring the UK into line with international 1.57 agreements on the need for fiscal consolidation, including the June 2010 G20 Finance Ministers’ conclusion that “those countries with serious fiscal challenges need to accelerate the pace of consolidation.”16 The path set for fiscal policy in this Budget is also consistent with the UK meeting its recommendation under the European Union’s Excessive Deficit Procedure to reduce the Treaty deficit below 3 per cent of GDP in 2014-15. The Budget judgement will also restore the Treaty debt ratio to a downward path from 2013-14.
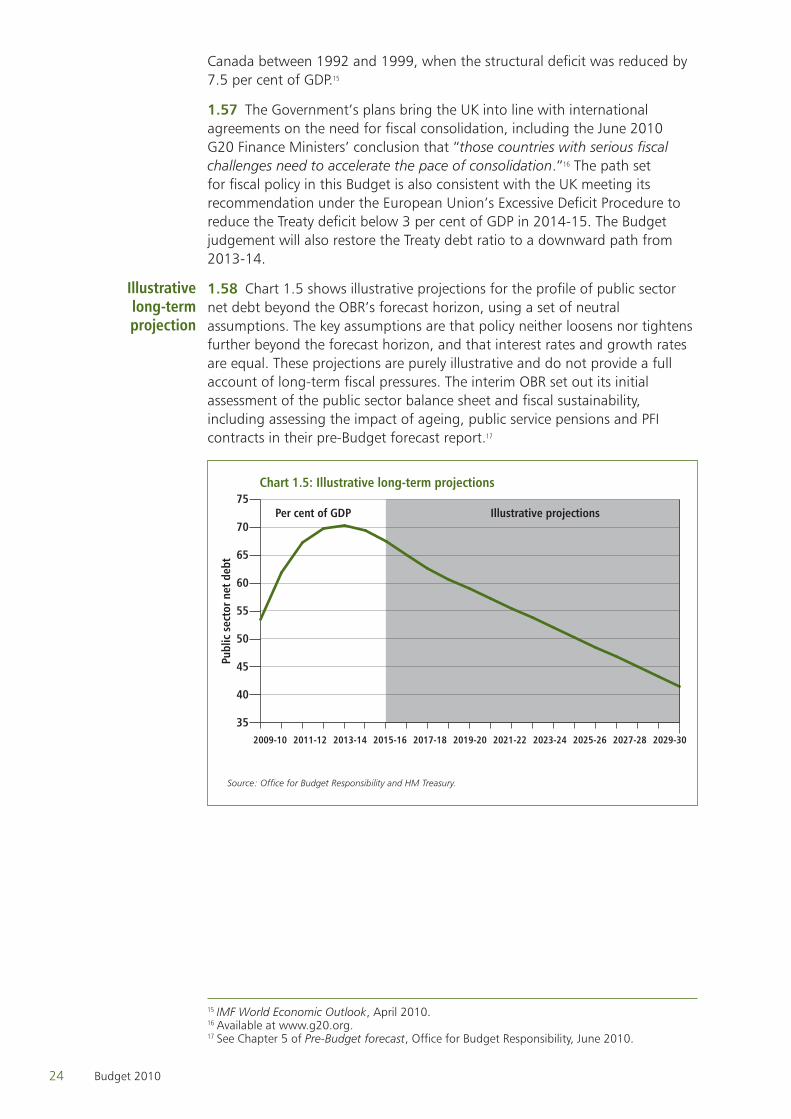
1.58 Chart 1.5 shows illustrative projections for the profile of public sector net debt beyond the OBR’s forecast horizon, using a set of neutral assumptions. The key assumptions are that policy neither loosens nor tightens further beyond the forecast horizon, and that interest rates and growth rates are equal. These projections are purely illustrative and do not provide a full account of long-term fiscal pressures. The interim OBR set out its initial assessment of the public sector balance sheet and fiscal sustainability, including assessing the impact of ageing, public service pensions and PFI contracts in their pre-Budget forecast report.17
Chart 1.5: Illustrative long-term projections
Source: Office for Budget Responsibility and HM Treasury.
Illustrative projectionsPer cent of GDP
Publ
ic s
ecto
r net
deb
t
35
40
45
50
55
60
65
70
75
2029-302027-282025-262023-242021-222019-202017-182015-162013-142011-122009-10
15 IMF World Economic Outlook, April 2010.16 Available at www.g20.org.17 See Chapter 5 of Pre-Budget forecast, Office for Budget Responsibility, June 2010.
Illustrative long-term projection
3742_01_Chapter_1.indd 24 22/6/10 00:22:45
25Budget 2010
EnterpriseOver recent years, the UK has become less competitive and the 1.59
economy has become more dependent on growth in the public sector. The World Economic Forum’s Global Competitiveness Index showed the UK’s ranking falling from seventh to thirteenth place between 1997 and 2009-10.18 If growth is to be balanced and sustainable, it needs to be based on an expansion in the private sector, not the public sector, and UK businesses need an environment which helps them compete in a global market place.
The measures in this Budget are intended to give businesses the 1.60 confidence to invest for the long term, and to reduce the burden of tax and regulation. They aim to encourage firms to create new jobs and to help those out of work back into the labour market. Where small businesses continue to have problems accessing finance, measures in this Budget are designed to address this. This Budget also helps to create the right incentives for building a sustainable low-carbon economy, and for attracting private sector investment in the UK’s infrastructure. This Budget seeks to make sure that all parts of the UK benefit from sustainable economic growth, especially those regions most dependent on public sector employment.
Competitiveness1.61 The Government aims to create the most competitive corporate tax system in the G20. As a first step, this Budget announces a major package of reforms to reduce corporation tax rates. This Government will:
reduce the main rate of corporation tax from 28 per cent to •24 per cent over the course of four financial years from April 2011. This will give the UK the lowest rate of corporation tax in the G7 and the fifth lowest rate in the G20;
reduce the small profits rate • 19 to 20 per cent, instead of the planned increase to 22 per cent, from April 2011;
reduce the capital allowances main rate from 20 per cent to •18 per cent, and the special rate from 10 per cent to 8 per cent from April 2012. This will ensure allowances remain broadly aligned with economic depreciation rates. The manufacturing sector as a whole will pay less corporation tax as a result of the Government’s reforms;
reduce the Annual Investment Allowance from £100,000 to •£25,000 from April 2012. It is expected that over 95 per cent of businesses will still have all their annual investment covered by this allowance;
reform Controlled Foreign Company (CFC) rules • , a key priority for UK multinationals. New CFC rules will be legislated in spring 2012 allowing time to consider carefully how to make the rules more competitive, to enhance long-term stability and to provide adequate protection of the UK tax base. Consultation will take place over the summer on interim
18 The Global Competitiveness Report 2009-2010, World Economic Forum, September 2009 and The Global Competitiveness Report 1997, World Economic Forum, May 199719 Formerly known as the small companies’ rate.
Roadmap for corporate tax
reform
3742_01_Chapter_1.indd 25 22/6/10 00:22:45
26 Budget 2010
improvements, to be legislated in spring 2011, to make the current rules easier to operate and where possible increase competitiveness;
move to a more territorial basis for taxing the profits of foreign •branches, and consult in summer 2010 on options for retaining foreign branch loss relief as part of this, reforming the rules in spring 2011; and
consult with business to review the taxation of intellectual •property, the support R&D tax credits provide for innovation and the proposals of the Dyson Review.20
The Government understands the importance of the whole corporate 1.62 tax system to business and will set out a more detailed programme for reform in the autumn. This will allow it to take a considered approach to implementing tax reforms and to listen to the needs of business through greater consultation. The Government will provide greater certainty for business by committing to principles for corporate tax reforms. In particular, it intends to develop its view that in general a broad tax base, a low rate and a more territorial approach will improve competitiveness. It will establish a business forum, chaired by the Exchequer Secretary to the Treasury, to consult with multinational businesses on the UK’s tax competitiveness, including the long-term aims of reform of the corporate tax system.
1.63 Alongside these reforms, the Government will introduce a levy based on banks’ balance sheets from 1 January 2011, intended to encourage banks to move to less risky funding profiles. The Government believes that banks should make a fair contribution in respect of the potential risks they pose to the UK financial system and wider economy. Final details of the levy will be published later this year, following consultation. The levy will result in a rebalancing of the burden of taxation between banking and other sectors.
1.64 Tax competitiveness is not just about rates and incidence of tax. Predictability, stability and simplicity are also important. Alongside this Budget, the Government is publishing proposals to improve the way tax policy is made to support these objectives.21 The Government also confirms its intention to create an independent Office of Tax Simplification and will announce further details shortly.
1.65 The volume and complexity of regulation can damage UK competitiveness. The Government has announced that it will reduce regulatory costs by introducing a one-in-one-out system for new regulations. The Department for Business, Innovation and Skills will publish more detail in July 2010. The Government’s plans for reducing burdens include:
fundamentally reviewing all regulation scheduled for introduction over the •coming year. These regulations will not be implemented until they have been reviewed and re-agreed by the Reducing Regulation Committee;
imposing sunset clauses on regulations. • Regulations will cease to be law after seven years unless Parliament has confirmed they are
20 Ingenious Britain: Making the UK the leading high tech exporter in Europe, James Dyson, March 201021 Tax policy making: a new approach, HM Treasury and HMRC, June 2010
Bank levy
Tax policy making
Deregulation
3742_01_Chapter_1.indd 26 22/6/10 00:22:45
27Budget 2010
still necessary and proportionate, or they were explicitly set to have a longer timeframe;
requiring each relevant Department to start immediately a review •of the employment laws for which they are responsible to ensure maximum flexibility, protect fairness and promote competitiveness. Changes to employment law will be made as part the Government’s one-in-one-out approach to regulatory reform; and
working with European partners to ensure that new proposals for EU •regulation are rigorously costed at an early stage, and that existing legislation is reviewed with the aim of reducing the burden on European businesses.
Employment and enterprise1.66 The Government will promote employment by reducing the cost of retaining and hiring staff. The Government inherited plans for National Insurance rates to increase by 1 per cent in April 2011. The negative effect of the employer rate rise will be largely reversed by increasing the threshold for employer National Insurance Contributions (NICs) by £21 a week above indexation. As a result, the number of employees for whom employers pay no NICs will rise by 650,000. This will benefit a number of sectors, including manufacturing.
1.67 Business rates can be a significant cost, particularly for smaller businesses. The Government has already legislated to freeze payments of certain significant backdated business rates bills until April 2011, including for businesses in ports. To resolve this issue, it will bring forward legislation to cancel such bills for newly assessed properties that were split from a larger rateable property. Legislation will also now be laid for a temporary increase in the level of small business rate relief, for one year from October 2010. It is estimated that over half a million businesses across England will benefit.
1.68 As part of introducing greater transparency in the way that it does business, the Government plans to promote small business procurement by publishing central Government tenders online and free of charge. This facility will be made available by the end of 2010.
1.69 The Government remains committed to a review of IR35 and small business tax and will release further details shortly.
Business financeSmall and medium-sized enterprises (SMEs) are fundamental to the 1.70
economic recovery and to tackling unemployment. However, some SMEs continue to have problems accessing the affordable finance they need. To address this, the Government is announcing measures to help SMEs access the funds that they need.
1.71 The Government is clear that UK banks need to promote lending to SMEs. The banking industry has today published a new set of principles that the high street banks will follow when lending to SMEs. The Government will
National Insurance
Contributions
Business rates
Procurement and SMEs
Small business tax review
Bank lending to SMEs
3742_01_Chapter_1.indd 27 22/6/10 00:22:45
28 Budget 2010
also be working with the banking industry on the disclosure of regional lending data.
1.72 The Enterprise Finance Guarantee (EFG) supports lending to viable small businesses that lack sufficient collateral or the financial track record to access a normal commercial loan. To ensure that more businesses have access to credit as the economy recovers, the EFG facility for this year is being increased by £200 million to support additional lending of up to £700 million for small businesses until 31 March 2011. In addition, a processing target of 20 business days will be introduced for all major lenders participating in the EFG. This will provide certainty for businesses about how long their applications will take to process.
1.73 The Government will create the Growth Capital Fund. This is to address the Rowlands Review findings that, for some fast-growing SMEs, capital for growth is not being provided by the market and that this problem was exacerbated by the recession.22 To support small businesses with high growth potential, a new Enterprise Capital Fund is being launched. This new Fund will form part of the existing £237 million programme of Enterprise Capital Funds and will provide an extra £37.5 million in equity finance. It will be funded through a £25 million Government contribution and £12.5 million in private co-investment.
1.74 The Government wants to ensure that the banking system and financial markets meet the needs of the economy over the long term. This Budget therefore announces that the Government will publish a Green Paper on business finance before the summer recess. The paper will consider the broad range of finance options for businesses of different sizes including bank lending, equity and corporate debt. It will invite views from business, investors and lenders on priorities and approaches to enhancing the access of credit-worthy businesses to appropriate sources of finance.
Low-carbon economyClimate change is one of the most serious threats that the world faces. 1.75
The Prime Minister has pledged to make this the greenest government ever, including reducing the Government’s own emissions by 10 per cent between mid-May 2010 and mid-May 2011.
The Government is committed to playing its part in moving to a low-1.76 carbon economy. The transition will change the shape of industry, growth and jobs. As part of this, the UK needs £200 billion of investment to 2020 to provide secure low-carbon energy. This will require reform of the energy market and action to attract additional private sector funding.
1.77 Alongside wider market reforms, the Government will assess how the energy tax framework can provide the right incentives for investment. In the autumn, the Government will publish proposals to reform the climate change levy in order to provide more certainty and support to the carbon price. Subject to consultation, the Government intends to bring forward relevant legislation in Finance Bill 2011.
22 The Provision of Growth Capital to UK Small and Medium-Sized Enterprises, BIS, November 2009
Enterprise Finance
Guarantee
SME non-bank finance
Green Paper on business
finance
Carbon price
3742_01_Chapter_1.indd 28 22/6/10 00:22:45
29Budget 2010
1.78 The Government is also determined to address other barriers to investment in the low-carbon economy. Following the Spending Review, the Government will put forward detailed proposals on the creation of a Green Investment Bank to help the UK meet the low-carbon investment challenge. The Government is considering a wide range of options for the scope and structure of the Green Investment Bank. The options will be evaluated for effectiveness, fiscal affordability and transparency.
1.79 The Government will establish a Green Deal for households through legislation in the Energy Security and Green Economy Bill, to help individuals invest in home energy efficiency improvements that can pay for themselves from the savings in energy bills. These improvements provide substantial and cost-effective carbon reductions but the initial cost can be significant, especially for low-income households. The Government will also continue to work on green financial products to provide individuals with opportunities to invest in the infrastructure necessary to support the green economy.
These measures are expected to have positive environmental impacts 1.80 by enabling investment in low-carbon infrastructure and technologies. The environmental impact of Budget measures will be assessed in more detail as proposals are developed.
Infrastructure1.81 The Government recognises the important role investment in infrastructure plays in supporting economic growth and UK competitiveness. As the Government acts to reduce the fiscal deficit, it will continue to encourage increased funding for infrastructure projects from the private sector. It will target public sector investment in infrastructure on those projects with the greatest economic benefit for which private sector capital is not available.
As set out in the deficit reduction section of this chapter, apart from 1.82 the capital element of the £6.2 billion savings in 2010-11 (worth £2 billion a year until 2015-16), the Government will make no further cuts in public sector gross investment compared with the plans that it inherited. Instead it will undertake a fundamental review of all capital spending plans to ensure they are affordable and to identify the areas of spending that will achieve the greatest economic returns.
1.83 This Budget confirms the establishment of Infrastructure UK (IUK) to lead work within HM Treasury to enable greater private sector investment in infrastructure, and improve the Government’s long-term planning and delivery. In the autumn, the Government will publish a national infrastructure plan that will set out goals for UK infrastructure. This will include priority public and private sector investments and proposals for delivering and supporting investment on a cross-sector basis. IUK will also carry out an investigation into how to reduce the cost of delivery of civil engineering works for major infrastructure projects. This will be chaired by Terry Hill (Chair of Transport Market, Arup).
1.84 The Government will not introduce a tax on landlines. Instead, it will drive private sector investment in superfast broadband by making regulatory changes to reduce the cost of roll-out. The Government will also fund three pilots to bring superfast broadband to hard-to-reach areas while
Green Investment
Bank
Green Deal for households
Infrastructure investment
Infrastructure UK
Digital infrastructure
3742_01_Chapter_1.indd 29 22/6/10 00:22:45
30 Budget 2010
working towards a universal broadband service at two Megabits per second. These will be funded by a portion of the Digital Switchover underspend within the TV licence fee.
1.85 The Government recognises the importance of a stable and fair UK oil and gas tax regime that provides certainty for businesses. It will take forward discussions with the industry to ensure the regime encourages continuing investment and the exploitation of remaining resources.
Growth in all parts of the UKThe Government is determined that all parts of the UK benefit from 1.86
sustainable economic growth, and that the private sector recovery is particularly strong in areas that are currently overly dependent on the public sector. The difference in real gross value added per capita growth rates between the Greater South East23 and all other English regions widened towards the end of the last decade, from 0.6 per cent (1989-2002) to 0.7 per cent (2002-2008).
1.87 The Government’s strategy to support private sector enterprise in all parts of the UK aims:
to encourage the creation of private sector jobs in regions reliant on •public sector employment, through reducing the cost to new businesses of employing staff. The Government will shortly announce details of a scheme to help new businesses in targeted areas of the UK that need it most. During a three year qualifying period, new businesses which start up in these areas will get a substantial reduction in their employer National Insurance Contributions (NICs). Within the qualifying period, these employers will not have to pay the first £5,000 of Class 1 employer NICs due in the first twelve months of employment. This will apply for each of the first 10 employees hired in the first year of business and operate in selected countries and regions24. Subject to meeting the necessary legal requirements, the scheme is intended to start no later than September 2010. Any new business set up from 22 June 2010 which meets the criteria set out in the forthcoming announcement will benefit from the scheme; and
to help areas and communities particularly affected by reductions in public •spending make the transition to private sector-led growth and prosperity, the Government will create a Regional Growth Fund in 2011-12 and 2012-13. This Fund will operate in England only and support increases in business employment and growth. The Devolved Administrations will be encouraged to undertake similar action.
1.88 The Government will publish a consultation paper, in autumn 2010, on rebalancing the Northern Ireland economy. This will include examining proposals for economic enterprise zones, possible mechanisms for changing the corporation tax rate and other economic reform options. The Government will consult the Northern Ireland Executive fully as the paper is prepared.
23 London, the South East and the East of England.24 The measure would apply in Scotland, Northern Ireland and Wales, and the following English regions: the North West, North East, Yorkshire and Humber, West Midlands, East Midlands and South West.
UK oil and gas fiscal regime
Regional growth
Northern Ireland
3742_01_Chapter_1.indd 30 22/6/10 00:22:45
31Budget 2010
1.89 The Government will enable locally-elected leaders, working with business, to lead local economic development. As part of this change, Regional Development Agencies will be abolished through the Public Bodies Bill. A White Paper later in the summer will set out details of these proposals. As part of this, the Government will:
support the creation of strong local enterprise partnerships • , particularly those based around England’s major cities and other natural economic areas, to enable improved coordination of public and private investment in transport, housing, skills, regeneration and other areas of economic development;
consider the most appropriate framework of incentives for local •authorities to support growth, including exploring options for business rate and council tax incentives, which would allow local authorities to reinvest the benefits of growth into local communities; and
as part of the shift to a more locally driven planning regime, • promote the role for a simplified planning consents process in specific areas where there is potential or need for business growth, through use of Local Development Orders.
FairnessThe Government is committed to creating a fair and responsible tax and 1.90
benefit system that rewards work and promotes economic competitiveness.
To achieve these objectives the tax and benefit framework must 1.91 incentivise work and tackle welfare dependency. More than five million households are currently dependent on benefits, and spending on social security and tax credits has increased by 45 per cent, around £60 billion, in real terms over the past 10 years.25 Despite these levels of spending, performance in tackling poverty and inequality has stalled or deteriorated. The Government believes this is neither fair nor affordable. A fair and responsible benefit system supports those in most need, without creating dependency for those who would be better off in work. A fair tax system should reward work for those on lower incomes while ensuring that those on higher incomes pay their fair share of tax.
This Budget sets out immediate tax and benefit reforms to address these 1.92 challenges. This Budget announces measures to: support low and middle-income earners; tackle welfare dependency and unaffordable spending; support the most vulnerable; and encourage personal responsibility. The measures set out in this Budget will reduce overall expenditure and tackle unfair payments while recognising the needs of pensioners and low-income families with children.
25 Public Expenditure Statistical Analysis 1995-2010 and the June Budget for the 2009-10 outturns. The 10 years in question are 1999-2000 to 2009-10 and the figures are in 2010-11 prices using a GDP deflator.
Local enterprise
partnerships
3742_01_Chapter_1.indd 31 22/6/10 00:22:45
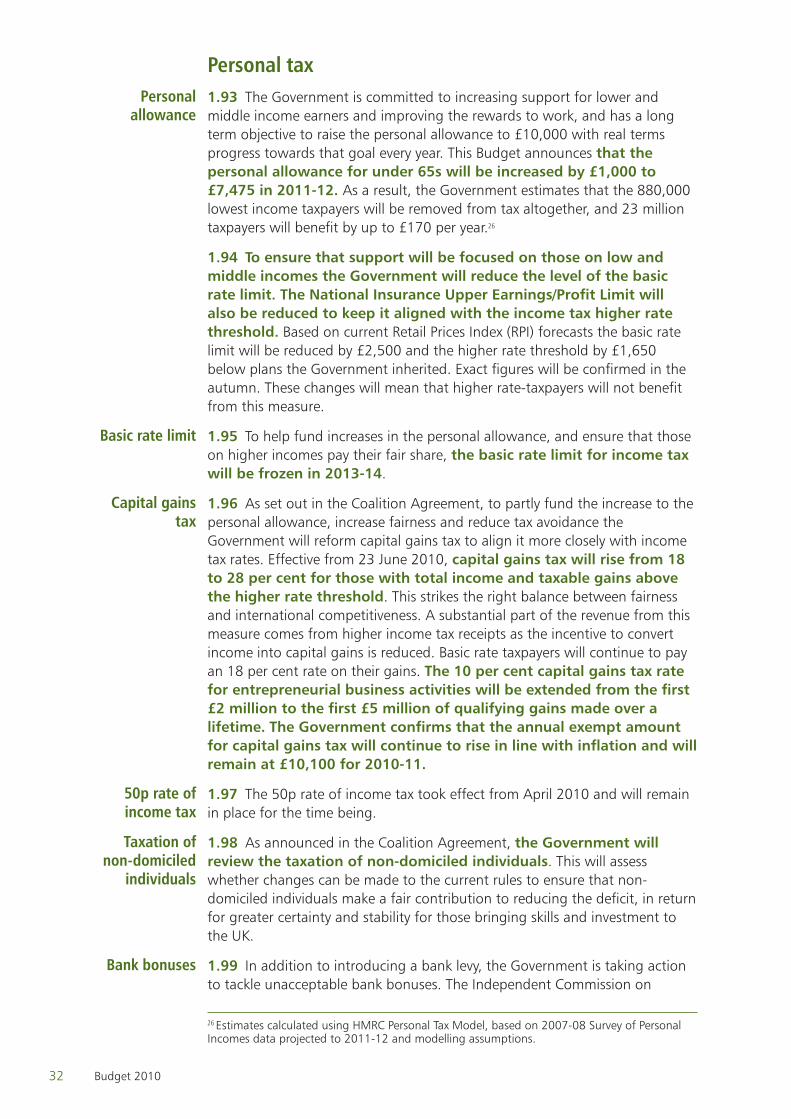
32 Budget 2010
Personal tax1.93 The Government is committed to increasing support for lower and middle income earners and improving the rewards to work, and has a long term objective to raise the personal allowance to £10,000 with real terms progress towards that goal every year. This Budget announces that the personal allowance for under 65s will be increased by £1,000 to £7,475 in 2011-12. As a result, the Government estimates that the 880,000 lowest income taxpayers will be removed from tax altogether, and 23 million taxpayers will benefit by up to £170 per year.26
To ensure that support will be focused on those on low and 1.94 middle incomes the Government will reduce the level of the basic rate limit. The National Insurance Upper Earnings/Profit Limit will also be reduced to keep it aligned with the income tax higher rate threshold. Based on current Retail Prices Index (RPI) forecasts the basic rate limit will be reduced by £2,500 and the higher rate threshold by £1,650 below plans the Government inherited. Exact figures will be confirmed in the autumn. These changes will mean that higher rate-taxpayers will not benefit from this measure.
1.95 To help fund increases in the personal allowance, and ensure that those on higher incomes pay their fair share, the basic rate limit for income tax will be frozen in 2013-14.
1.96 As set out in the Coalition Agreement, to partly fund the increase to the personal allowance, increase fairness and reduce tax avoidance the Government will reform capital gains tax to align it more closely with income tax rates. Effective from 23 June 2010, capital gains tax will rise from 18 to 28 per cent for those with total income and taxable gains above the higher rate threshold. This strikes the right balance between fairness and international competitiveness. A substantial part of the revenue from this measure comes from higher income tax receipts as the incentive to convert income into capital gains is reduced. Basic rate taxpayers will continue to pay an 18 per cent rate on their gains. The 10 per cent capital gains tax rate for entrepreneurial business activities will be extended from the first £2 million to the first £5 million of qualifying gains made over a lifetime. The Government confirms that the annual exempt amount for capital gains tax will continue to rise in line with inflation and will remain at £10,100 for 2010-11.
1.97 The 50p rate of income tax took effect from April 2010 and will remain in place for the time being.
1.98 As announced in the Coalition Agreement, the Government will review the taxation of non-domiciled individuals. This will assess whether changes can be made to the current rules to ensure that non-domiciled individuals make a fair contribution to reducing the deficit, in return for greater certainty and stability for those bringing skills and investment to the UK.
1.99 In addition to introducing a bank levy, the Government is taking action to tackle unacceptable bank bonuses. The Independent Commission on
26 Estimates calculated using HMRC Personal Tax Model, based on 2007-08 Survey of Personal Incomes data projected to 2011-12 and modelling assumptions.
Personal allowance
Basic rate limit
Capital gains tax
50p rate of income tax
Taxation of non-domiciled
individuals
Bank bonuses
3742_01_Chapter_1.indd 32 22/6/10 00:22:45
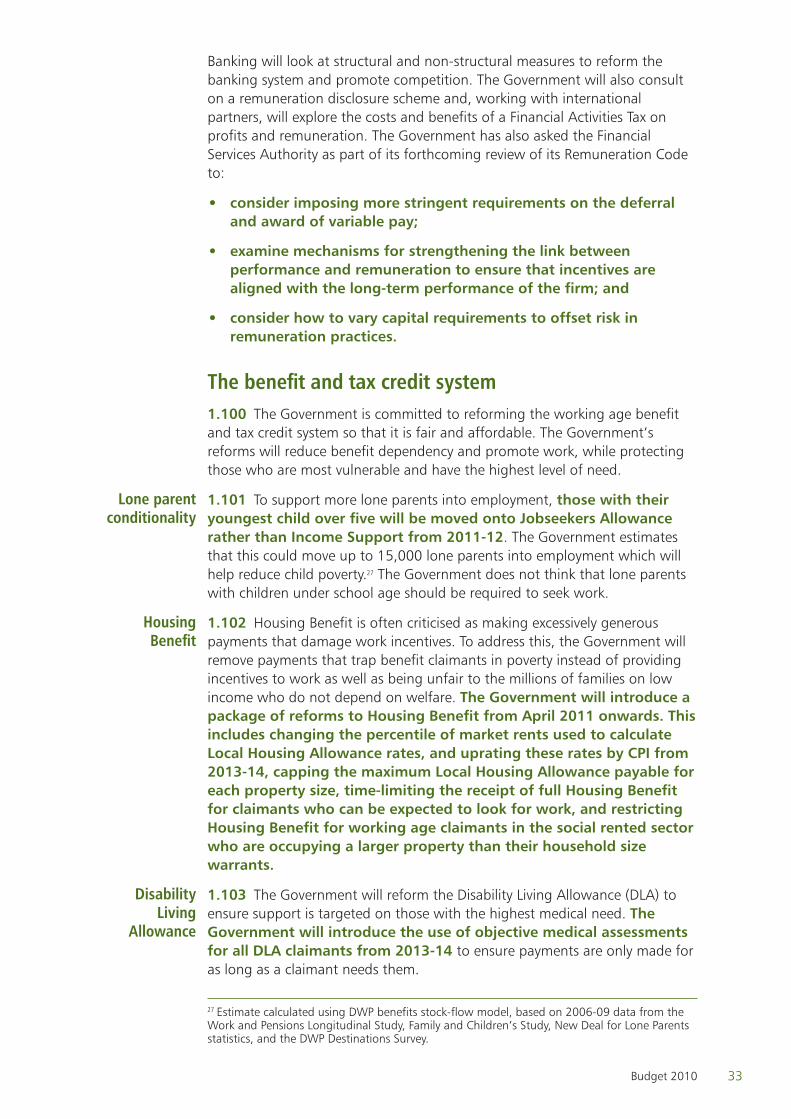
33Budget 2010
Banking will look at structural and non-structural measures to reform the banking system and promote competition. The Government will also consult on a remuneration disclosure scheme and, working with international partners, will explore the costs and benefits of a Financial Activities Tax on profits and remuneration. The Government has also asked the Financial Services Authority as part of its forthcoming review of its Remuneration Code to:
consider imposing more stringent requirements on the deferral •and award of variable pay;
examine mechanisms for strengthening the link between •performance and remuneration to ensure that incentives are aligned with the long-term performance of the firm; and
consider how to vary capital requirements to offset risk in •remuneration practices.
The benefit and tax credit systemThe Government is committed to reforming the working age benefit 1.100
and tax credit system so that it is fair and affordable. The Government’s reforms will reduce benefit dependency and promote work, while protecting those who are most vulnerable and have the highest level of need.
1.101 To support more lone parents into employment, those with their youngest child over five will be moved onto Jobseekers Allowance rather than Income Support from 2011-12. The Government estimates that this could move up to 15,000 lone parents into employment which will help reduce child poverty.27 The Government does not think that lone parents with children under school age should be required to seek work.
1.102 Housing Benefit is often criticised as making excessively generous payments that damage work incentives. To address this, the Government will remove payments that trap benefit claimants in poverty instead of providing incentives to work as well as being unfair to the millions of families on low income who do not depend on welfare. The Government will introduce a package of reforms to Housing Benefit from April 2011 onwards. This includes changing the percentile of market rents used to calculate Local Housing Allowance rates, and uprating these rates by CPI from 2013-14, capping the maximum Local Housing Allowance payable for each property size, time-limiting the receipt of full Housing Benefit for claimants who can be expected to look for work, and restricting Housing Benefit for working age claimants in the social rented sector who are occupying a larger property than their household size warrants.
1.103 The Government will reform the Disability Living Allowance (DLA) to ensure support is targeted on those with the highest medical need. The Government will introduce the use of objective medical assessments for all DLA claimants from 2013-14 to ensure payments are only made for as long as a claimant needs them.
27 Estimate calculated using DWP benefits stock-flow model, based on 2006-09 data from the Work and Pensions Longitudinal Study, Family and Children’s Study, New Deal for Lone Parents statistics, and the DWP Destinations Survey.
Lone parent conditionality
Housing Benefit
Disability Living
Allowance
3742_01_Chapter_1.indd 33 22/6/10 00:22:46
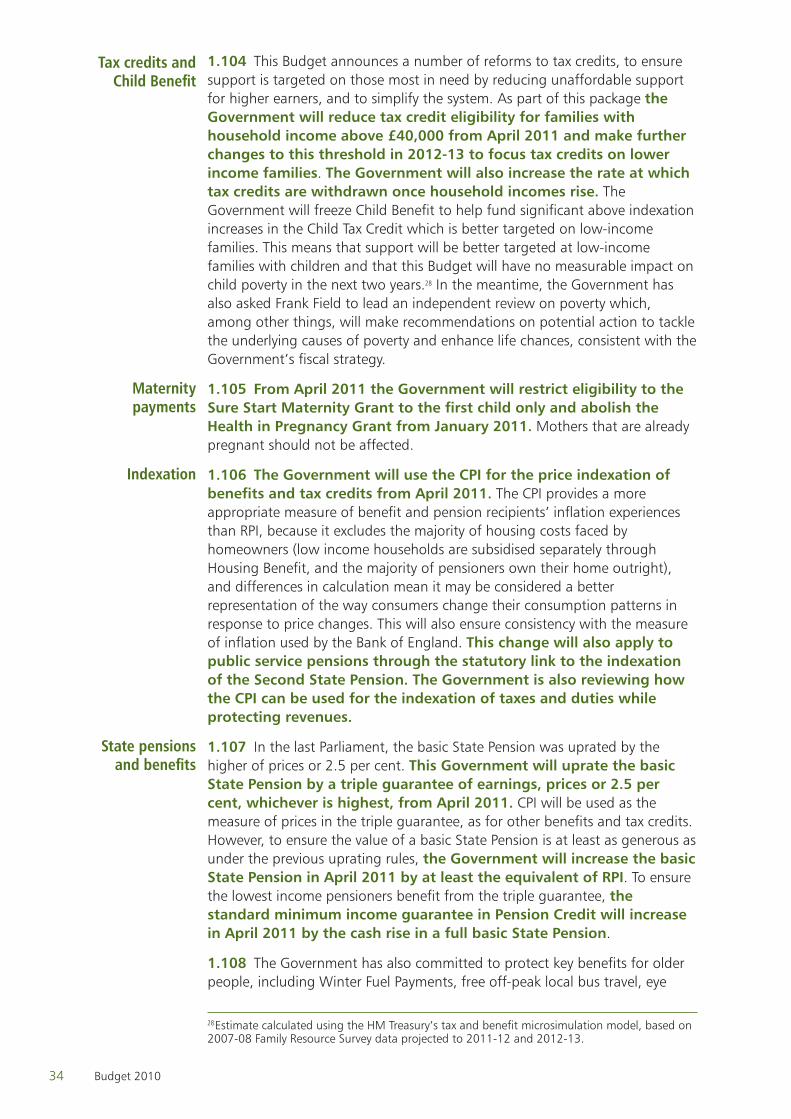
34 Budget 2010
1.104 This Budget announces a number of reforms to tax credits, to ensure support is targeted on those most in need by reducing unaffordable support for higher earners, and to simplify the system. As part of this package the Government will reduce tax credit eligibility for families with household income above £40,000 from April 2011 and make further changes to this threshold in 2012-13 to focus tax credits on lower income families. The Government will also increase the rate at which tax credits are withdrawn once household incomes rise. The Government will freeze Child Benefit to help fund significant above indexation increases in the Child Tax Credit which is better targeted on low-income families. This means that support will be better targeted at low-income families with children and that this Budget will have no measurable impact on child poverty in the next two years.28 In the meantime, the Government has also asked Frank Field to lead an independent review on poverty which, among other things, will make recommendations on potential action to tackle the underlying causes of poverty and enhance life chances, consistent with the Government’s fiscal strategy.
1.105 From April 2011 the Government will restrict eligibility to the Sure Start Maternity Grant to the first child only and abolish the Health in Pregnancy Grant from January 2011. Mothers that are already pregnant should not be affected.
1.106 The Government will use the CPI for the price indexation of benefits and tax credits from April 2011. The CPI provides a more appropriate measure of benefit and pension recipients’ inflation experiences than RPI, because it excludes the majority of housing costs faced by homeowners (low income households are subsidised separately through Housing Benefit, and the majority of pensioners own their home outright), and differences in calculation mean it may be considered a better representation of the way consumers change their consumption patterns in response to price changes. This will also ensure consistency with the measure of inflation used by the Bank of England. This change will also apply to public service pensions through the statutory link to the indexation of the Second State Pension. The Government is also reviewing how the CPI can be used for the indexation of taxes and duties while protecting revenues.
1.107 In the last Parliament, the basic State Pension was uprated by the higher of prices or 2.5 per cent. This Government will uprate the basic State Pension by a triple guarantee of earnings, prices or 2.5 per cent, whichever is highest, from April 2011. CPI will be used as the measure of prices in the triple guarantee, as for other benefits and tax credits. However, to ensure the value of a basic State Pension is at least as generous as under the previous uprating rules, the Government will increase the basic State Pension in April 2011 by at least the equivalent of RPI. To ensure the lowest income pensioners benefit from the triple guarantee, the standard minimum income guarantee in Pension Credit will increase in April 2011 by the cash rise in a full basic State Pension.
The Government has also committed to protect key benefits for older 1.108 people, including Winter Fuel Payments, free off-peak local bus travel, eye
28 Estimate calculated using the HM Treasury’s tax and benefit microsimulation model, based on 2007-08 Family Resource Survey data projected to 2011-12 and 2012-13.
Tax credits and Child Benefit
Maternity payments
Indexation
State pensions and benefits
3742_01_Chapter_1.indd 34 22/6/10 00:22:46
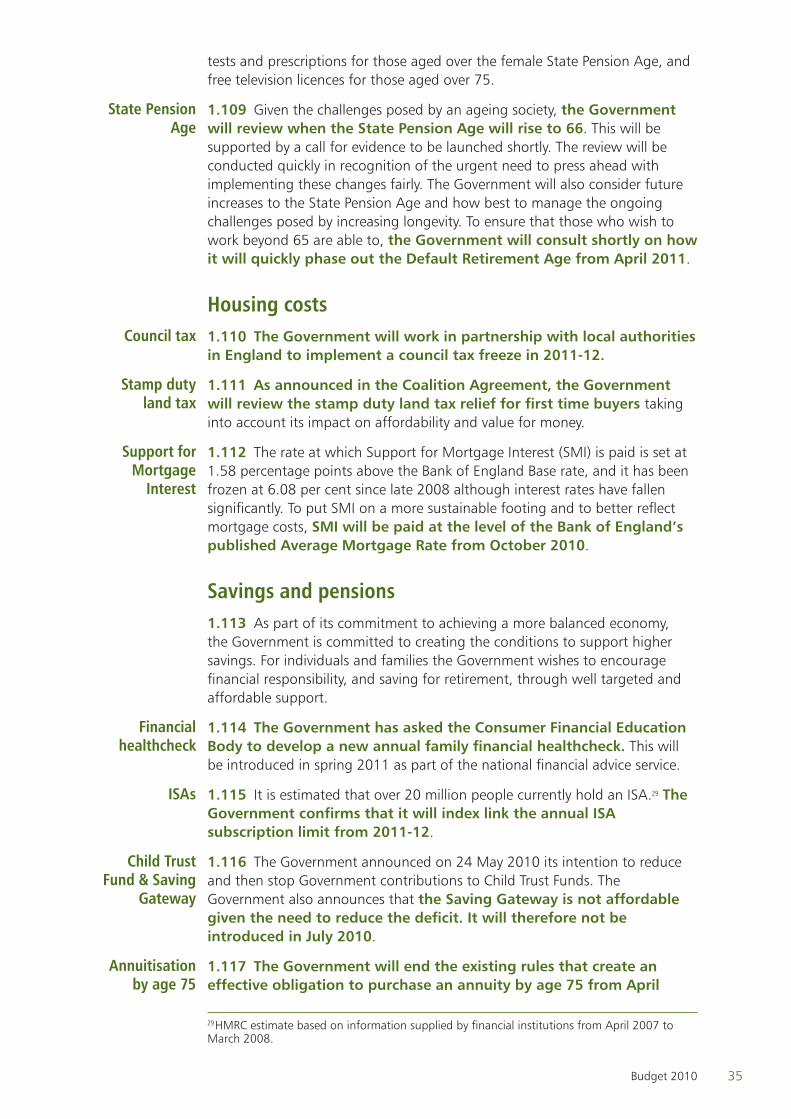
35Budget 2010
tests and prescriptions for those aged over the female State Pension Age, and free television licences for those aged over 75.
1.109 Given the challenges posed by an ageing society, the Government will review when the State Pension Age will rise to 66. This will be supported by a call for evidence to be launched shortly. The review will be conducted quickly in recognition of the urgent need to press ahead with implementing these changes fairly. The Government will also consider future increases to the State Pension Age and how best to manage the ongoing challenges posed by increasing longevity. To ensure that those who wish to work beyond 65 are able to, the Government will consult shortly on how it will quickly phase out the Default Retirement Age from April 2011.
Housing costs1.110 The Government will work in partnership with local authorities in England to implement a council tax freeze in 2011-12.
1.111 As announced in the Coalition Agreement, the Government will review the stamp duty land tax relief for first time buyers taking into account its impact on affordability and value for money.
1.112 The rate at which Support for Mortgage Interest (SMI) is paid is set at 1.58 percentage points above the Bank of England Base rate, and it has been frozen at 6.08 per cent since late 2008 although interest rates have fallen significantly. To put SMI on a more sustainable footing and to better reflect mortgage costs, SMI will be paid at the level of the Bank of England’s published Average Mortgage Rate from October 2010.
Savings and pensionsAs part of its commitment to achieving a more balanced economy, 1.113
the Government is committed to creating the conditions to support higher savings. For individuals and families the Government wishes to encourage financial responsibility, and saving for retirement, through well targeted and affordable support.
1.114 The Government has asked the Consumer Financial Education Body to develop a new annual family financial healthcheck. This will be introduced in spring 2011 as part of the national financial advice service.
1.115 It is estimated that over 20 million people currently hold an ISA.29 The Government confirms that it will index link the annual ISA subscription limit from 2011-12.
1.116 The Government announced on 24 May 2010 its intention to reduce and then stop Government contributions to Child Trust Funds. The Government also announces that the Saving Gateway is not affordable given the need to reduce the deficit. It will therefore not be introduced in July 2010.
1.117 The Government will end the existing rules that create an effective obligation to purchase an annuity by age 75 from April
29 HMRC estimate based on information supplied by financial institutions from April 2007 to March 2008.
State Pension Age
Council tax
Stamp duty land tax
Support for Mortgage
Interest
Financial healthcheck
ISAs
Child Trust Fund & Saving
Gateway
Annuitisation by age 75
3742_01_Chapter_1.indd 35 22/6/10 00:22:46
36 Budget 2010
2011 to enable individuals to make more flexible use of their pension savings. The Government will shortly launch a consultation on the detail of this change and will introduce transitional measures for those yet to secure a retirement income who will reach 75 in the meantime.
1.118 The Government will continue with plans it inherited to raise revenues from restricting pensions tax relief. The Government is committed to protecting the public finances by introducing reforms that raise no less revenue than existing plans. However, it believes that the approach legislated for in Finance Act 2010 could have unwelcome consequences for pension saving, bring significant complexity to the tax system, and damage UK business and competitiveness. An alternative approach involving reform of existing allowances, principally of a significantly reduced annual allowance, might better meet the Governments objectives. Provisional analysis suggests that an annual allowance in the range of £30,000 to £45,000 would raise the necessary yield. The Government wishes to engage employers, pension schemes, experts and other interested parties to determine the best design of a regime.
Excise dutiesThe Government is committed to fair excise duties that contribute to 1.119
deficit reduction while also encouraging personal responsibility.
1.120 The Government confirms the across the board increase in cider duty rates of 10 per cent above inflation announced in the March Budget will be reversed from 30 June 2010. Secondary legislation will be introduced shortly to increase tax on cheap, strong ciders. The Government will also review alcohol taxation and pricing and will report in the autumn. There will be no increases in the rate of duty on beer, wine or spirits at this Budget but the Government will continue with the plans it inherited to increase the rates by 2 per cent above inflation each year to 2014-15.
1.121 The Chancellor has asked the Office for Budget Responsibility to undertake an assessment over the summer of the effect of oil price fluctuations on the public finances. Informed by this assessment, the Government will examine options for the design of a fair fuel stabiliser.
1.122 Reflecting the Coalition commitment to investigate measures to help with fuel costs in remote rural areas, the Government is considering the case for introducing a fuel duty discount in remote rural areas. This includes possible pilot schemes in Scotland.
1.123 The Government will explore changes to the aviation tax system, including switching from a per-passenger to a per-plane duty, which could encourage fuller planes. Major changes will be subject to public consultation.
Tax complianceThe Government is committed to maximising tax compliance by 1.124
delivering a tax system that is predictable, stable and simple. The Government
Pensions tax relief
Alcohol duty
Fair fuel stabiliser
Remote rural areas
Air transport
3742_01_Chapter_1.indd 36 22/6/10 00:22:46
37Budget 2010
has published proposals to improve the way in which tax policy is made and delivered.30
In support of this approach, the Government will make every effort 1.125 to improve tax compliance and protect revenues. This year, HMRC will use debt collection agencies to collect £140 million of additional tax revenue from existing tax debts.
1.126 The Government is committed to tackling tax avoidance and intends to develop strategic responses to address long-standing avoidance risks. Further details on specific measures can be found in Chapter 2. As part of this work, the Government will examine whether, as one element of strengthened defences, there is a case for developing a General Anti-Avoidance Rule.
30 Tax policy making: a new approach, HM Treasury and HMRC, June 2010
Tax avoidance
3742_01_Chapter_1.indd 37 22/6/10 00:22:46

38 Budget 2010
3742_01_Chapter_1.indd 38 22/6/10 00:22:46
39Budget 2010
Budget policy decisions2Chapter 1 explains how the measures and other decisions announced 2.1
in this Budget advance the Government’s long-term goals. This chapter summarises measures and decisions announced since the Government took office, with their estimated effect on government revenues and spending to 2014-15. This chapter has three sections:
Section 2a sets out the cost or yield of all Budget decisions with a fiscal •impact (Table 2.1) and provides a brief description of the main Budget measures1, including measures announced since 11 May 2010;
Section 2b sets out measures that were announced in the March 2010 •Budget or earlier that have not yet come into effect, and which the Government confirms will be implemented. The effect of these measures on the public finances is summarised in Table 2.4; and
Section 2c sets out information on the Civil List. •
Section 2a – Budget policy decisionsBudget policy decisions are taken on tax measures, national insurance 2.2
contributions (NICs) measures, measures that affect Annually Managed Expenditure (AME), and changes to Departmental Expenditure Limits (DEL). Measures that are financed from existing DEL provisions are not included. Measures that impact on the next spending review period when departmental budgets have not been set will be absorbed within the Government’s spending envelope for 2011-12 onwards.
On 14 June 2010, the Office for Budget Responsibility (OBR) published 2.3 an independent forecast of the public finances and the economy, incorporating all policy measures introduced or announced by the previous Government. Alongside the Budget, the OBR have published a further forecast incorporating policy measures announced at the Budget. To produce the Budget forecast, the OBR has scrutinised the Government’s assessment of the direct cost or yield of Budget policy decisions that affect the economy and public finance forecasts and has made an assessment of the indirect effects of Budget measures on the economy.
1 The number in brackets after each measure refers to the line in Table 2.1 or Table 2.4 where its costs or yield is shown.
3742_02_Chapter_2.indd 39 22/6/10 00:23:00
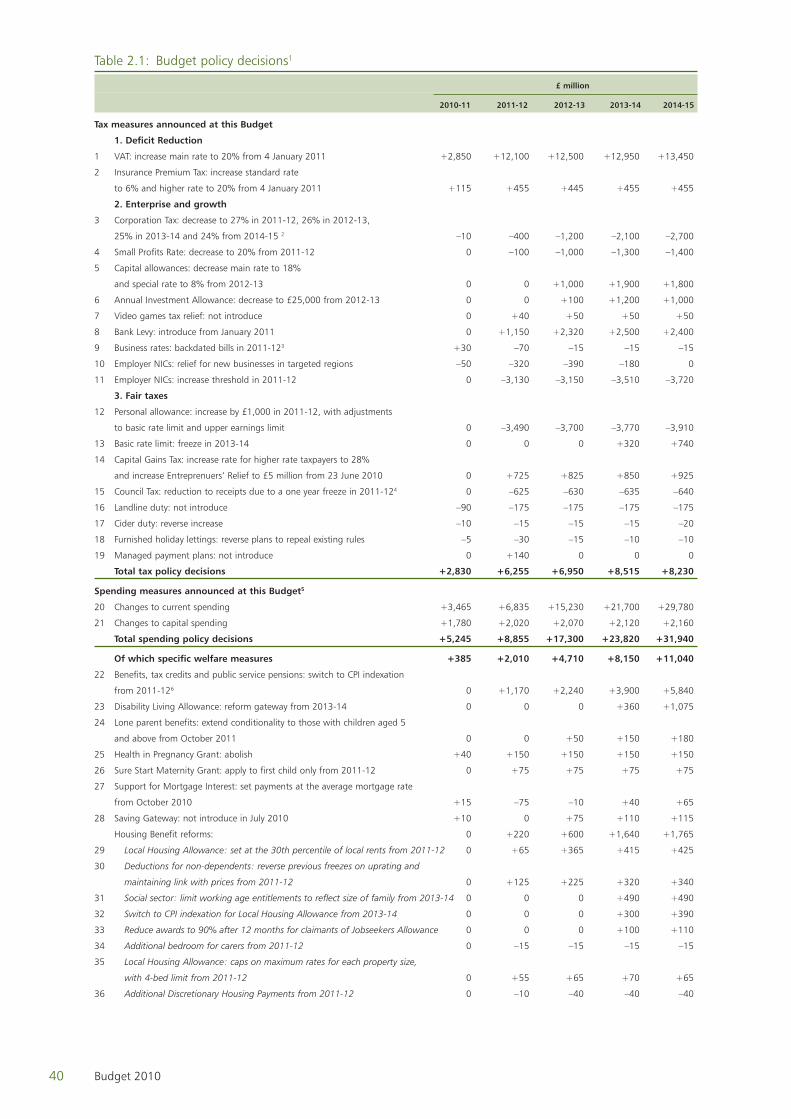
40 Budget 2010
Table 2.1: Budget policy decisions1
£ million
2010-11 2011-12 2012-13 2013-14 2014-15
Tax measures announced at this Budget
1. Deficit Reduction
1 VAT: increase main rate to 20% from 4 January 2011 +2,850 +12,100 +12,500 +12,950 +13,450
2 Insurance Premium Tax: increase standard rate
to 6% and higher rate to 20% from 4 January 2011 +115 +455 +445 +455 +455
2. Enterprise and growth
3 Corporation Tax: decrease to 27% in 2011-12, 26% in 2012-13,
25% in 2013-14 and 24% from 2014-15 2 –10 –400 –1,200 –2,100 –2,700
4 Small Profits Rate: decrease to 20% from 2011-12 0 –100 –1,000 –1,300 –1,400
5 Capital allowances: decrease main rate to 18%
and special rate to 8% from 2012-13 0 0 +1,000 +1,900 +1,800
6 Annual Investment Allowance: decrease to £25,000 from 2012-13 0 0 +100 +1,200 +1,000
7 Video games tax relief: not introduce 0 +40 +50 +50 +50
8 Bank Levy: introduce from January 2011 0 +1,150 +2,320 +2,500 +2,400
9 Business rates: backdated bills in 2011-123 +30 –70 –15 –15 –15
10 Employer NICs: relief for new businesses in targeted regions –50 –320 –390 –180 0
11 Employer NICs: increase threshold in 2011-12 0 –3,130 –3,150 –3,510 –3,720
3. Fair taxes
12 Personal allowance: increase by £1,000 in 2011-12, with adjustments
to basic rate limit and upper earnings limit 0 –3,490 –3,700 –3,770 –3,910
13 Basic rate limit: freeze in 2013-14 0 0 0 +320 +740
14 Capital Gains Tax: increase rate for higher rate taxpayers to 28%
and increase Entreprenuers’ Relief to £5 million from 23 June 2010 0 +725 +825 +850 +925
15 Council Tax: reduction to receipts due to a one year freeze in 2011-124 0 –625 –630 –635 –640
16 Landline duty: not introduce –90 –175 –175 –175 –175
17 Cider duty: reverse increase –10 –15 –15 –15 –20
18 Furnished holiday lettings: reverse plans to repeal existing rules –5 –30 –15 –10 –10
19 Managed payment plans: not introduce 0 +140 0 0 0
Total tax policy decisions +2,830 +6,255 +6,950 +8,515 +8,230
Spending measures announced at this Budget5
20 Changes to current spending +3,465 +6,835 +15,230 +21,700 +29,780
21 Changes to capital spending +1,780 +2,020 +2,070 +2,120 +2,160
Total spending policy decisions +5,245 +8,855 +17,300 +23,820 +31,940
Of which specific welfare measures +385 +2,010 +4,710 +8,150 +11,040
22 Benefits, tax credits and public service pensions: switch to CPI indexation
from 2011-126 0 +1,170 +2,240 +3,900 +5,840
23 Disability Living Allowance: reform gateway from 2013-14 0 0 0 +360 +1,075
24 Lone parent benefits: extend conditionality to those with children aged 5
and above from October 2011 0 0 +50 +150 +180
25 Health in Pregnancy Grant: abolish +40 +150 +150 +150 +150
26 Sure Start Maternity Grant: apply to first child only from 2011-12 0 +75 +75 +75 +75
27 Support for Mortgage Interest: set payments at the average mortgage rate
from October 2010 +15 –75 –10 +40 +65
28 Saving Gateway: not introduce in July 2010 +10 0 +75 +110 +115
Housing Benefit reforms: 0 +220 +600 +1,640 +1,765
29 Local Housing Allowance: set at the 30th percentile of local rents from 2011-12 0 +65 +365 +415 +425
30 Deductions for non-dependents: reverse previous freezes on uprating and
maintaining link with prices from 2011-12 0 +125 +225 +320 +340
31 Social sector: limit working age entitlements to reflect size of family from 2013-14 0 0 0 +490 +490
32 Switch to CPI indexation for Local Housing Allowance from 2013-14 0 0 0 +300 +390
33 Reduce awards to 90% after 12 months for claimants of Jobseekers Allowance 0 0 0 +100 +110
34 Additional bedroom for carers from 2011-12 0 –15 –15 –15 –15
35 Local Housing Allowance: caps on maximum rates for each property size,
with 4-bed limit from 2011-12 0 +55 +65 +70 +65
36 Additional Discretionary Housing Payments from 2011-12 0 –10 –40 –40 –40
3742_02_Chapter_2.indd 40 22/6/10 00:23:00
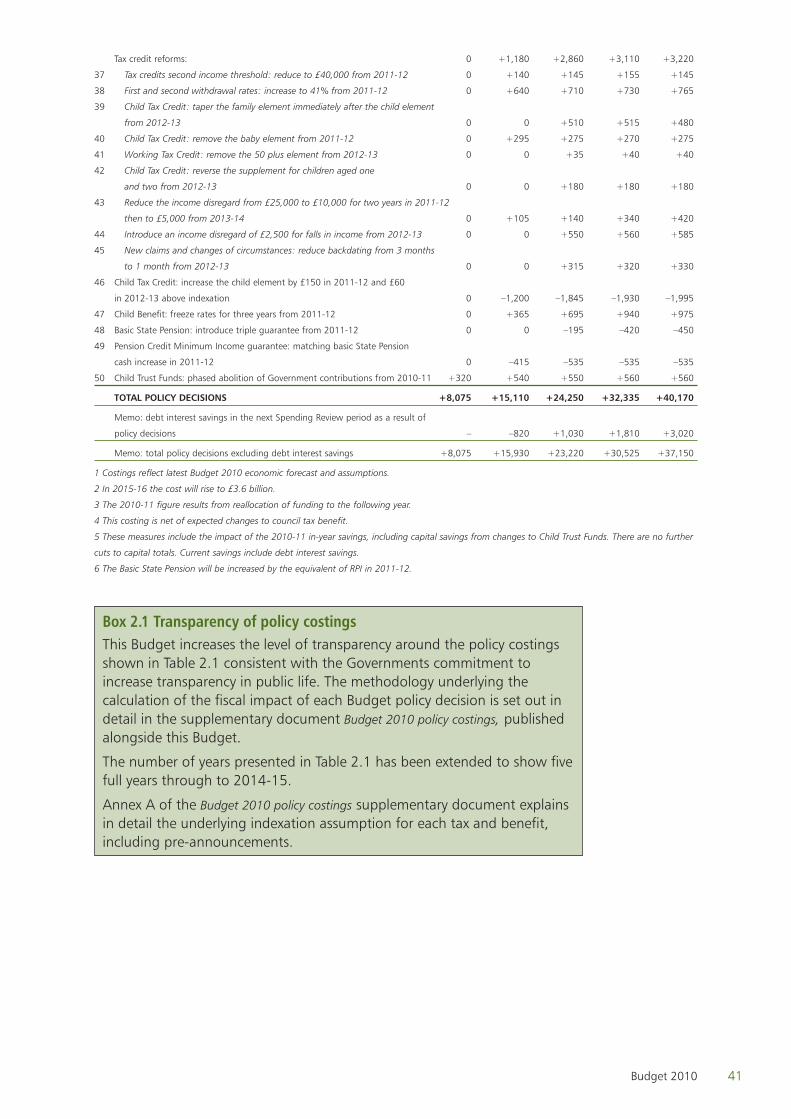
41Budget 2010
Tax credit reforms: 0 +1,180 +2,860 +3,110 +3,220
37 Tax credits second income threshold: reduce to £40,000 from 2011-12 0 +140 +145 +155 +145
38 First and second withdrawal rates: increase to 41% from 2011-12 0 +640 +710 +730 +765
39 Child Tax Credit: taper the family element immediately after the child element
from 2012-13 0 0 +510 +515 +480
40 Child Tax Credit: remove the baby element from 2011-12 0 +295 +275 +270 +275
41 Working Tax Credit: remove the 50 plus element from 2012-13 0 0 +35 +40 +40
42 Child Tax Credit: reverse the supplement for children aged one
and two from 2012-13 0 0 +180 +180 +180
43 Reduce the income disregard from £25,000 to £10,000 for two years in 2011-12
then to £5,000 from 2013-14 0 +105 +140 +340 +420
44 Introduce an income disregard of £2,500 for falls in income from 2012-13 0 0 +550 +560 +585
45 New claims and changes of circumstances: reduce backdating from 3 months
to 1 month from 2012-13 0 0 +315 +320 +330
46 Child Tax Credit: increase the child element by £150 in 2011-12 and £60
in 2012-13 above indexation 0 –1,200 –1,845 –1,930 –1,995
47 Child Benefit: freeze rates for three years from 2011-12 0 +365 +695 +940 +975
48 Basic State Pension: introduce triple guarantee from 2011-12 0 0 –195 –420 –450
49 Pension Credit Minimum Income guarantee: matching basic State Pension
cash increase in 2011-12 0 –415 –535 –535 –535
50 Child Trust Funds: phased abolition of Government contributions from 2010-11 +320 +540 +550 +560 +560
TOTAL POLICY DECISIONS +8,075 +15,110 +24,250 +32,335 +40,170
Memo: debt interest savings in the next Spending Review period as a result of
policy decisions – –820 +1,030 +1,810 +3,020
Memo: total policy decisions excluding debt interest savings +8,075 +15,930 +23,220 +30,525 +37,150
1 Costings reflect latest Budget 2010 economic forecast and assumptions.
2 In 2015-16 the cost will rise to £3.6 billion.
3 The 2010-11 figure results from reallocation of funding to the following year.
4 This costing is net of expected changes to council tax benefit.
5 These measures include the impact of the 2010-11 in-year savings, including capital savings from changes to Child Trust Funds. There are no further
cuts to capital totals. Current savings include debt interest savings.
6 The Basic State Pension will be increased by the equivalent of RPI in 2011-12.
Box 2.1 Transparency of policy costingsThis Budget increases the level of transparency around the policy costings shown in Table 2.1 consistent with the Governments commitment to increase transparency in public life. The methodology underlying the calculation of the fiscal impact of each Budget policy decision is set out in detail in the supplementary document Budget 2010 policy costings, published alongside this Budget.
The number of years presented in Table 2.1 has been extended to show five full years through to 2014-15.
Annex A of the Budget 2010 policy costings supplementary document explains in detail the underlying indexation assumption for each tax and benefit, including pre-announcements.
3742_02_Chapter_2.indd 41 22/6/10 00:23:00
42 Budget 2010
Public spending
Comprehensive Spending Review 2007 Departmental Expenditure Limits
The allocation of Departmental Expenditure Limits (DEL) for 2008-09, 2.4 2009-10 and 2010-11 is shown in Table 2.2. In line with previous practice, resource and capital DEL reflects the latest available information and includes an allowance for shortfall reflecting likely underspends against departmental provisions.
The DEL budgets shown in Table 2.2 reflect:2.5
policy decisions contained in this Budget; •
reductions to 2010-11 DEL budgets as a result of the £6.2 billion savings •package;
technical classification changes arising from the implementation of the •Alignment (or ‘Clear Line of Sight’) project. These classification changes, which are largely a consequence of removing transactions previously recorded as non-cash from the DEL boundary, have the effect of reducing DEL in all years. However, the adjustments have no impact on the purchasing power of departments or the planned level of expenditure, nor do they impact on the fiscal aggregates; and
other classification or budgetary changes, which have no impact on •National Accounts definitions.
Waste and inefficiency 2.6 The Government will deliver £6.2 billion of savings in 2010-11 to start to tackle the budget deficit and to bear down on waste and inefficiency across the public sector.
2.7 The Efficiency and Reform Group (ERG) has been set up within the Cabinet Office drawing on expertise within Government. It will support departments in renegotiating contracts and will oversee an immediate freeze on unnecessary spending on consultancy, advertising and new ICT spend over £1 million.
£6.2billion savings
Efficiency and Reform Group
3742_02_Chapter_2.indd 42 22/6/10 00:23:00
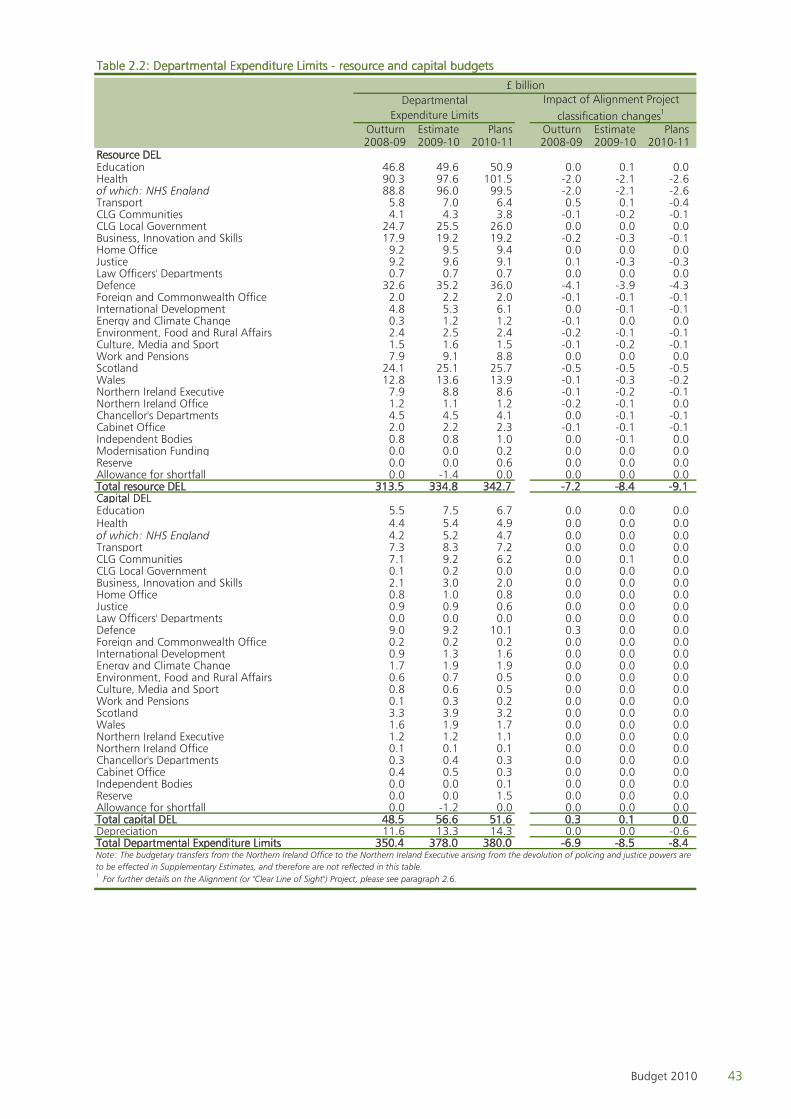
43Budget 2010
Table 2.2: Departmental Expenditure Limits - resource and capital budgets
Outturn Estimate Plans Outturn Estimate Plans2008-09 2009-10 2010-11 2008-09 2009-10 2010-11
Resource DELEducation 46.8 49.6 50.9 0.0 0.1 0.0Health 90.3 97.6 101.5 -2.0 -2.1 -2.6of which: NHS England 88.8 96.0 99.5 -2.0 -2.1 -2.6Transport 5.8 7.0 6.4 0.5 0.1 -0.4CLG Communities 4.1 4.3 3.8 -0.1 -0.2 -0.1CLG Local Government 24.7 25.5 26.0 0.0 0.0 0.0Business, Innovation and Skills 17.9 19.2 19.2 -0.2 -0.3 -0.1Home Office 9.2 9.5 9.4 0.0 0.0 0.0Justice 9.2 9.6 9.1 0.1 -0.3 -0.3Law Officers' Departments 0.7 0.7 0.7 0.0 0.0 0.0Defence 32.6 35.2 36.0 -4.1 -3.9 -4.3Foreign and Commonwealth Office 2.0 2.2 2.0 -0.1 -0.1 -0.1International Development 4.8 5.3 6.1 0.0 -0.1 -0.1Energy and Climate Change 0.3 1.2 1.2 -0.1 0.0 0.0Environment, Food and Rural Affairs 2.4 2.5 2.4 -0.2 -0.1 -0.1Culture, Media and Sport 1.5 1.6 1.5 -0.1 -0.2 -0.1Work and Pensions 7.9 9.1 8.8 0.0 0.0 0.0Scotland 24.1 25.1 25.7 -0.5 -0.5 -0.5Wales 12.8 13.6 13.9 -0.1 -0.3 -0.2Northern Ireland Executive 7.9 8.8 8.6 -0.1 -0.2 -0.1Northern Ireland Office 1.2 1.1 1.2 -0.2 -0.1 0.0Chancellor's Departments 4.5 4.5 4.1 0.0 -0.1 -0.1Cabinet Office 2.0 2.2 2.3 -0.1 -0.1 -0.1Independent Bodies 0.8 0.8 1.0 0.0 -0.1 0.0Modernisation Funding 0.0 0.0 0.2 0.0 0.0 0.0Reserve 0.0 0.0 0.6 0.0 0.0 0.0Allowance for shortfall 0.0 -1.4 0.0 0.0 0.0 0.0Total resource DEL 313.5 334.8 342.7 -7.2 -8.4 -9.1Capital DELEducation 5.5 7.5 6.7 0.0 0.0 0.0Health 4.4 5.4 4.9 0.0 0.0 0.0of which: NHS England 4.2 5.2 4.7 0.0 0.0 0.0Transport 7.3 8.3 7.2 0.0 0.0 0.0CLG Communities 7.1 9.2 6.2 0.0 0.1 0.0CLG Local Government 0.1 0.2 0.0 0.0 0.0 0.0Business, Innovation and Skills 2.1 3.0 2.0 0.0 0.0 0.0Home Office 0.8 1.0 0.8 0.0 0.0 0.0Justice 0.9 0.9 0.6 0.0 0.0 0.0Law Officers' Departments 0.0 0.0 0.0 0.0 0.0 0.0Defence 9.0 9.2 10.1 0.3 0.0 0.0Foreign and Commonwealth Office 0.2 0.2 0.2 0.0 0.0 0.0International Development 0.9 1.3 1.6 0.0 0.0 0.0Energy and Climate Change 1.7 1.9 1.9 0.0 0.0 0.0Environment, Food and Rural Affairs 0.6 0.7 0.5 0.0 0.0 0.0Culture, Media and Sport 0.8 0.6 0.5 0.0 0.0 0.0Work and Pensions 0.1 0.3 0.2 0.0 0.0 0.0Scotland 3.3 3.9 3.2 0.0 0.0 0.0Wales 1.6 1.9 1.7 0.0 0.0 0.0Northern Ireland Executive 1.2 1.2 1.1 0.0 0.0 0.0Northern Ireland Office 0.1 0.1 0.1 0.0 0.0 0.0Chancellor's Departments 0.3 0.4 0.3 0.0 0.0 0.0Cabinet Office 0.4 0.5 0.3 0.0 0.0 0.0Independent Bodies 0.0 0.0 0.1 0.0 0.0 0.0Reserve 0.0 0.0 1.5 0.0 0.0 0.0Allowance for shortfall 0.0 -1.2 0.0 0.0 0.0 0.0Total capital DEL 48.5 56.6 51.6 0.3 0.1 0.0Depreciation 11.6 13.3 14.3 0.0 0.0 -0.6Total Departmental Expenditure Limits 350.4 378.0 380.0 -6.9 -8.5 -8.4
1 For further details on the Alignment (or "Clear Line of Sight") Project, please see paragraph 2.6.
£ billionDepartmental
Expenditure LimitsImpact of Alignment Project
classification changes1
Note: The budgetary transfers from the Northern Ireland Office to the Northern Ireland Executive arising from the devolution of policing and justice powers are to be effected in Supplementary Estimates, and therefore are not reflected in this table.
3742_02_Chapter_2.indd 43 22/6/10 00:23:00

44 Budget 2010
Review of spending commitments2.8 All significant items of spending inherited by the Government, which were agreed between 1 January 2010 and the election, have now been reviewed. Of these items, 12 have been cancelled, which carry a total lifetime cost of nearly £2 billion. A further 12, that would have cost £8.5 billion over their lifetime, have been suspended to be considered at the Spending Review.
2.9 The Government inherited very substantial commitments whose funding was dependent on underspending this year through the End of Year Flexibility system or additional funding from the Reserve. This level of underspending is not expected to materialise and the Government is reviewing EYF commitments.
Asset sales2.10 In addition to launching the sale of High Speed 1, as part of a wider programme of asset commercialisation over the next 12 months the Government will:
facilitate a capital injection into the Royal Mail Group; •
resolve the future of the Tote in a way that secures value for the taxpayer •while recognising the support the Tote currently provides the racing industry;
announce its decision on selling part of the student loan portfolio, •including looking at the options for early repayment for individuals, in light of Lord Browne’s review of higher education finance;
release the 800MHz and 2.6GHz spectrum to support super-fast mobile •services. A decision on the approach will be made before recess; and
explore with other shareholders the options for a potential sale process in •NATS.
At the conclusion of the Spending Review, decisions will be made on the 2.11 future capacity at the Dartford Crossing, and the possibilities for letting out a concession.
The Spending Envelope and Spending Review2.12 Table 2.3 sets out the path for Total Managed Expenditure (TME), Public Sector Current Expenditure (PSCE) and Public Sector Gross Investment (PSGI) to 2015-16. TME will fall in real terms by 4 per cent over the period; PSCE will fall by 1 per cent; and PSGI will fall by 31 per cent. (20) (21)
2.13 The Spending Review will be published on 20 October 2010 and will set out spending plans for the years 2011-12 to 2014-15.
Table 2.3 shows the fixed envelopes for the current and capital spending 2.14 included within the Spending Review. The final allocation between DEL and AME – and the allocation of DEL between departments – will be set at the Spending Review.
Spending re-approvals
Review of EYF commitments
and DEL Reserve
Asset sales
Path of spending
Spending Review
3742_02_Chapter_2.indd 44 22/6/10 00:23:00
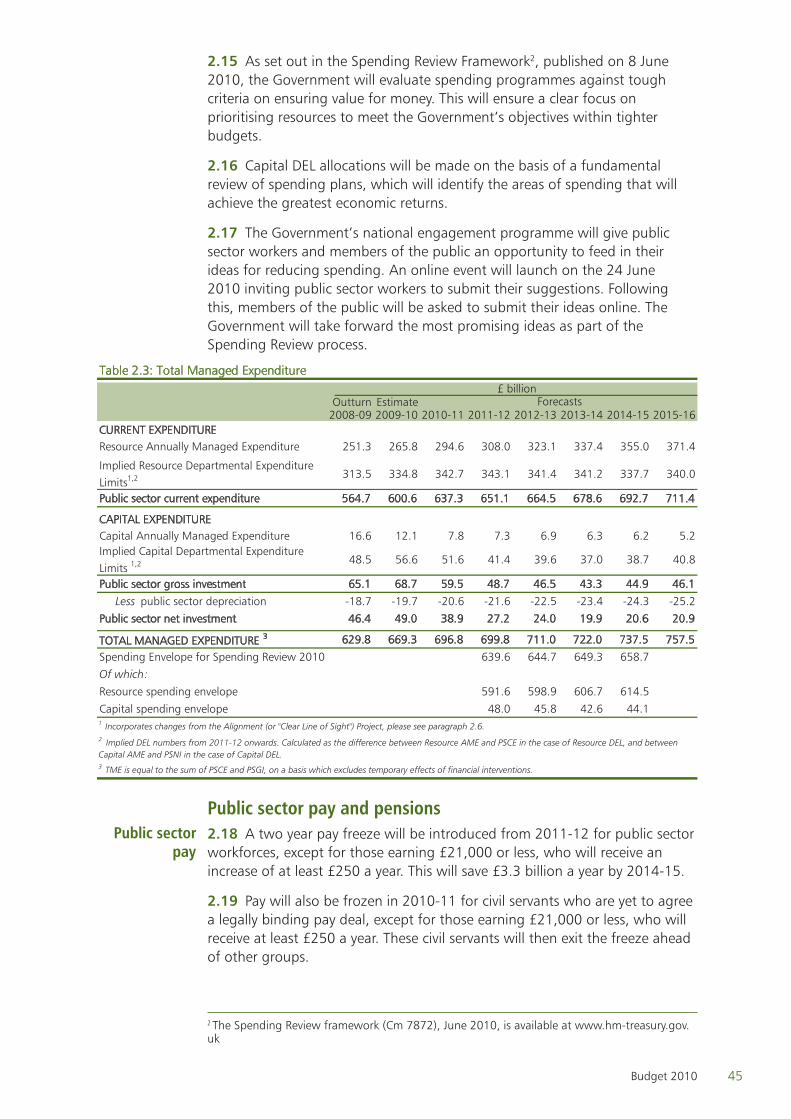
45Budget 2010
As set out in the Spending Review Framework2.15 2, published on 8 June 2010, the Government will evaluate spending programmes against tough criteria on ensuring value for money. This will ensure a clear focus on prioritising resources to meet the Government’s objectives within tighter budgets.
Capital DEL allocations will be made on the basis of a fundamental 2.16 review of spending plans, which will identify the areas of spending that will achieve the greatest economic returns.
The Government’s national engagement programme will give public 2.17 sector workers and members of the public an opportunity to feed in their ideas for reducing spending. An online event will launch on the 24 June 2010 inviting public sector workers to submit their suggestions. Following this, members of the public will be asked to submit their ideas online. The Government will take forward the most promising ideas as part of the Spending Review process.
Table 2.3: Total Managed Expenditure
Outturn Estimate2008-09 2009-10 2010-11 2011-12 2012-13 2013-14 2014-15 2015-16
CURRENT EXPENDITUREResource Annually Managed Expenditure 251.3 265.8 294.6 308.0 323.1 337.4 355.0 371.4
Implied Resource Departmental Expenditure Limits1,2 313.5 334.8 342.7 343.1 341.4 341.2 337.7 340.0
Public sector current expenditure 564.7 600.6 637.3 651.1 664.5 678.6 692.7 711.4
CAPITAL EXPENDITURECapital Annually Managed Expenditure 16.6 12.1 7.8 7.3 6.9 6.3 6.2 5.2Implied Capital Departmental Expenditure Limits 1,2 48.5 56.6 51.6 41.4 39.6 37.0 38.7 40.8
Public sector gross investment 65.1 68.7 59.5 48.7 46.5 43.3 44.9 46.1
Less public sector depreciation -18.7 -19.7 -20.6 -21.6 -22.5 -23.4 -24.3 -25.2
Public sector net investment 46.4 49.0 38.9 27.2 24.0 19.9 20.6 20.9
TOTAL MANAGED EXPENDITURE 3 629.8 669.3 696.8 699.8 711.0 722.0 737.5 757.5
Spending Envelope for Spending Review 2010 639.6 644.7 649.3 658.7
Of which:
Resource spending envelope 591.6 598.9 606.7 614.5
Capital spending envelope 48.0 45.8 42.6 44.1
3 TME is equal to the sum of PSCE and PSGI, on a basis which excludes temporary effects of financial interventions.
1 Incorporates changes from the Alignment (or "Clear Line of Sight") Project, please see paragraph 2.6.
£ billionForecasts
2 Implied DEL numbers from 2011-12 onwards. Calculated as the difference between Resource AME and PSCE in the case of Resource DEL, and between Capital AME and PSNI in the case of Capital DEL.
Public sector pay and pensions2.18 A two year pay freeze will be introduced from 2011-12 for public sector workforces, except for those earning £21,000 or less, who will receive an increase of at least £250 a year. This will save £3.3 billion a year by 2014-15.
Pay will also be frozen in 2010-11 for civil servants who are yet to agree 2.19 a legally binding pay deal, except for those earning £21,000 or less, who will receive at least £250 a year. These civil servants will then exit the freeze ahead of other groups.
2 The Spending Review framework (Cm 7872), June 2010, is available at www.hm-treasury.gov.uk
Public sector pay
3742_02_Chapter_2.indd 45 22/6/10 00:23:00
46 Budget 2010
2.20 An independent commission chaired by John Hutton, formerly Secretary of State for Work and Pensions, will undertake a fundamental structural review of public service pension provision by Budget 2011 and consider the case for short-term savings in the Spending Review period by September 2010.
Other measures 2.21 The Government has clearly stated that it will not join or prepare to join the euro in this Parliament. Government departments have been instructed to cease all work relating to euro preparations and not to spend money on euro compatibility in procurement. Staff engaged in this work are being transferred to other duties.
Personal tax and benefits2.22 The personal allowance for under 65s will increase by £1,000 to £7,475 in 2011-12, with a corresponding decrease in the levels at which the 40 per cent higher rate of tax and the two per cent rate of NICs are paid, to ensure that the majority of higher rate taxpayers will pay the same total level of tax and National Insurance Contributions as previously planned. (12)
2.23 The basic rate limit for income tax will be frozen in 2013-14. (13)
2.24 The secondary NICs threshold will be increased by £21 per week in addition to indexation from April 2011. (11)
2.25 The Pay As You Earn (PAYE) system is a fundamental part of the UK tax system. The Government wishes to explore how it could be improved in order to reduce costs and make the system easier for employers and HMRC to administer. As an initial step, the Government intends to consult with employers and payroll providers on mechanisms that could support more frequent or real time PAYE data.
2.26 The Government will defer implementation of Managed Payment Plans, which would allow taxpayers to pay self-assessed income tax and corporation tax in a series of monthly instalments either side of the theoretical due date. (Budget 2009) (19)
2.27 The Government will restrict the generosity of pensions tax relief. The Government is committed to protecting the public finances by introducing reforms that raise no less revenue than has already been accounted for in the public finances over the forecast period, and in steady-state in subsequent years. It believes an alternative approach to the high income excess relief charge legislated for in Finance Act 2010, involving reform of existing allowances, principally a significantly reduced annual allowance, might better meet the Government’s objectives. Provisional analysis suggests that an annual allowance in the range of £30,000 of £45,000 would raise the necessary yield. The Government intends to introduce legislation in the Finance Bill after the Budget to bring in powers to repeal the measure legislated for in Finance Act 2010. (j) (k)
2.28 The capital allowance rules for foster carers will be amended to ensure that they operate consistently and as intended for all carers. Legislation will be in the Finance Bill introduced in the autumn and will take effect from Royal Assent.
Public service pensions
Euro preparations
Income tax personal
allowances
Basic rate limit
Employer NICS
PAYE
Managed Payment Plans
Pensions tax – annual
allowance
Tax rules for foster carers
3742_02_Chapter_2.indd 46 22/6/10 00:23:01
47Budget 2010
2.29 Legislation will be in the Finance Bill introduced in the autumn to provide HMRC with a power to make regulations to amend the rules on the collection of income tax deducted at source from interest and similar payments.
2.30 As announced in the Coalition Agreement, the Government will review the taxation of non-domiciled individuals.
2.31 Legislation will be in the Finance Bill introduced after the Budget to address the tax and NICs consequences of the new expenses scheme for Members of Parliament. It will consolidate existing tax and NICs treatments following the introduction of the Parliamentary Standards Act 2009 and the provision in that act for expenses to be administered by the Independent Parliamentary Standards Authority rather than the House Authorities. The legislation will take effect for income tax purposes from 7 May 2010.
Tax credits and benefits2.32 From April 2011, the Consumer Prices Index (CPI) will be used for the indexation of all benefits, tax credits and public service pensions. (22)
2.33 From April 2011, the basic State Pension will be uprated by a triple guarantee of earnings, prices or 2.5 per cent, whichever is highest. CPI will be used as the measure of prices in the triple guarantee but the basic State Pension will be uprated by the equivalent of RPI in April 2011. (48)
The Government will review the date at which the State Pension Age 2.34 rises to 66. This will be supported by a call for evidence.
2.35 The Government will consult shortly on how it will quickly phase out the Default Retirement Age from April 2011.
2.36 In April 2011, the standard minimum income guarantee in Pension Credit will increase by the cash rise in a full basic State Pension. (49)
2.37 From April 2011, the second income threshold for the family element of the Child Tax Credit will reduce from £50,000 to £40,000 and from April 2012, the family element of the Child Tax Credit will be withdrawn immediately after the child element. (37) (39)
From April 2011, the first and second withdrawal rates for tax credits 2.38 will increase to 41 per cent. (38)
From April 2011, the baby element will be removed from the Child Tax 2.39 Credit and from April 2012, the 50 plus element will be removed from the Working Tax Credit. (40) (41)
In April 2011, the child element of the Child Tax Credit will increase by 2.40 £150 above CPI indexation and in April 2012 it will increase by £60 above indexation. (46)
The Government will not introduce the £4 supplement in the Child 2.41 Tax Credit for each child aged one and two from April 2012, which was announced at the March 2010 Budget. (42)
Interest: deduction of
tax
Non-domiciled individuals
Expenses paid to MPs
Benefits uprating
State Pension
Default Retirement Age
Pension Credit
Tax credits
3742_02_Chapter_2.indd 47 22/6/10 00:23:01
48 Budget 2010
From April 2011, the level of in-year rises of income that will be 2.42 disregarded from calculations of tax credit entitlement will decrease from £25,000 to £10,000 and from April 2013, this will be decreased further to £5,000. (43)
From April 2012, the period for which a tax credit claim and certain 2.43 changes of circumstances can be backdated will be reduced from three months to one month. (45)
From April 2012, a disregard of £2,500 will be introduced in the tax 2.44 credits system for in-year falls in income. (44)
2.45 From January 2011, the Health in Pregnancy Grant will be abolished. (25)
From April 2011, payment of a SureStart Maternity Grant will be 2.46 restricted to a first child (or children where the first is a multiple birth). (26)
2.47 The rates of Child Benefit for the first and subsequent children will be frozen for three years from April 2011. (47)
2.48 As announced on 24 May 2010, the Government will reduce and then stop Government contributions to Child Trust Funds. (50)
2.49 From October 2010, the standard interest rate used to calculate Support for Mortgage Interest payments will be set at a level equal to the Bank of England’s published monthly Average Mortgage Rate. (27)
2.50 From October 2011, Local Housing Allowance rates will be set at the 30th percentile of local rents. (29)
Deductions for non-dependents will be uprated in April 2011 on the 2.51 basis of prices. This will reverse the freeze in these rates since 2001-02. (30)
From 2013-14, Local Housing Allowance rates will be uprated in line 2.52 with CPI. (32)
From April 2013, housing entitlements for working age people in the 2.53 social sector will reflect family size. (31)
Housing Benefit awards will be reduced to 90 per cent of the initial 2.54 award after 12 months for claimants receiving Jobseekers Allowance. This will be introduced in April 2013. (33)
From April 2011, Housing Benefit claimants with a disability and a non-2.55 resident carer will be entitled to funding for an extra bedroom. (34)
From April 2011, Local Housing Allowance Rates will be capped at £250 2.56 per week for a one bedroom property, £290 per week for a two bedroom property, £340 per week for a three bedroom property and £400 per week for four bedrooms or more. (35)
The Government contribution to Discretionary Housing Payments will be 2.57 increased by £10 million in 2011-12 and £40 million in each year from 2012-13. (36)
2.58 From 2013-14, an objective medical assessment will be introduced for Disability Living Allowance. (23)
Maternity payments
Child Benefit
Child Trust Funds
Support for Mortgage
Interest
Housing Benefit
Disability benefits
3742_02_Chapter_2.indd 48 22/6/10 00:23:01
49Budget 2010
2.59 From October 2011, lone parents whose youngest child is aged 5 or above will be eligible for Jobseekers Allowance rather than Income Support, and existing customers will be transferred from Income Support to Jobseekers Allowance from April 2012. (24)
Other measures2.60 The existing rules that create an effective obligation to purchase an annuity by age 75 will end from April 2011. A consultation on the detail of this change will be launched shortly. Legislation for transitional arrangements will be in the Finance Bill introduced after the Budget for those yet to secure an income who will reach 75 in the meantime.
2.61 The Government will not introduce the Saving Gateway in July 2010. (28)
2.62 The Government has asked the Consumer Financial Education Body to develop an annual family financial healthcheck, which will be delivered as part of the new national financial advice service. The healthcheck will be launched in spring 2011.
Capital, assets and property2.63 Effective from 23 June 2010, capital gains tax will rise from 18 to 28 per cent for those with total taxable gains and income above the higher rate threshold. Basic rate taxpayers will continue to pay an 18 per cent rate on their gains. Legislation will be in the Finance Bill introduced after the Budget. (14)
Effective from 23 June 2010, the lifetime limit for entrepreneurs relief 2.64 will be extended from £2 million to £5 million. Legislation will be in the Finance Bill introduced after the Budget. (14)
The Annual Exempt Amount for capital gains tax will remain at £10,100 2.65 for 2010-11 and will continue to rise in line with inflation.
2.66 The Government will review the effectiveness of the stamp duty land tax relief for first time buyers.
Business and financial services2.67 The Government has set out the roadmap for corporate tax reform, with further details to follow in the autumn.
The main rate of corporation tax will be reduced from 28 per cent to 24 2.68 per cent over four years. A one per cent reduction will be implemented from 1 April 2011. Legislation will be in the Finance Bill introduced after the Budget, with further reductions in subsequent Finance Bills. (3)
The small profits rate of corporation tax will be reduced from 21 per 2.69 cent to 20 per cent with effect from 1 April 2011, rather than rising to 22 per cent as inherited by the Government. (4)
Lone parents
Annuitisation by age 75
Saving Gateway
Annual family financial
healthcheck
Capital gains tax reform
Stamp duty land tax
Corporate tax reform
3742_02_Chapter_2.indd 49 22/6/10 00:23:01
50 Budget 2010
The Government will move to a more territorial basis for taxing the 2.70 profits of foreign branches, and will consult in summer on options for retaining foreign branch loss relief as part of this. The Government plans to reform the rules in Finance Bill 2011.
The Government is committed to reforming the Controlled Foreign 2.71 Company (CFC) rules and will consult on interim improvements to the current rules to be introduced in Finance Bill 2011.
The Government will consult with business in autumn 2010 to review 2.72 the taxation of Intellectual Property and the support R&D tax credits provide for innovation. (t)
The Government is committed to simplifying the capital gains rules for 2.73 groups of companies to a Finance Bill 2011 timetable.
2.74 The Government remains committed to a review of IR35 and small business tax and will release further details shortly.
2.75 From April 2012, the rate of capital allowances on the general pool of plant and machinery will be reduced from 20 per cent to 18 per cent, and the rate of allowance on the special rate pool of plant and machinery will be reduced from 10 per cent to 8 per cent. (5)
The Annual Investment Allowance will be reduced from £100,000 to 2.76 £25,000 from April 2012. (6)
2.77 The Government will not introduce the tax relief for the UK video games industry. (7)
2.78 A bank levy based on banks’ balance sheets will be introduced, following consultation, effective from 1 January 2011. It is proposed that the levy will be set at a rate of 0.07 per cent, with a lower initial rate of 0.04 per cent in 2011. (8)
2.79 The Government will explore the costs and benefits of a Financial Activities Tax. The Government has asked the FSA to consider a number of factors in its forthcoming review of its Remuneration Code. Alongside this the Government will consult on a remuneration disclosure regime.
2.80 As announced on 16 June 2010, the Government has established an independent commission on banking, chaired by Sir John Vickers.
2.81 The Government will hold discussions with industry and formal consultations on a range of issues concerning the asset management sector, including UCITS IV3 implementation, introducing a tax transparent contractual fund vehicle, taxation of Investment Trust Companies and Funds Investing in Non-Reporting Funds (FINROF) regulations, and Stamp Duty Reserve Tax (SDRT) Schedule 19 in the context of investments in underlying funds.
2.82 Legislation will be introduced to cancel backdated business rates bills eligible for the 8-year schedule of payments scheme, for newly assessed properties that were split from a larger rateable property. (9)
3 Undertakings for Collective Trusts in Transferrable Securities directive.
Small business tax review
Capital allowances
Video games tax relief
Bank levy
Bank remuneration
Independent commission on
banking
Asset management
Backdated business rates
3742_02_Chapter_2.indd 50 22/6/10 00:23:01
51Budget 2010
2.83 With effect from 4 January 2011, the standard rate of Insurance Premium Tax (IPT) will increase to 6 per cent and the higher rate of IPT will increase to 20 per cent. Legislation will be in the Finance Bill introduced after the Budget. (2)
2.84 The Government will not extend life insurance deficiency relief to the additional rates of tax. Instead the deficiency relief rules will continue as at present and will reduce tax due on income subject to the higher rate and dividend upper rate of tax only.
2.85 The proposal inherited by the Government to repeal the special tax rules for furnished holiday lettings will not be implemented. Instead, the Government will consult over the summer on a proposal to ensure the tax rules meet EU legal requirements in a fiscally responsible way, by changing the eligibility thresholds and restricting the use of loss relief. Any changes will take effect from April 2011, and in the meantime the current rules continue to apply for the 2010-11 tax year. (18)
2.86 Regulation previously scheduled for introduction over the coming year will not be introduced unless it has been reviewed and re-agreed by the Reducing Regulation Committee. Sunset clauses will be applied to new regulation so they end after seven years unless Parliament has confirmed they are still necessary. Budget announces that departments will immediately start to review employment law as committed to in the coalition agreement. The Government will influence the EU to adopt its new approach.
2.87 A new Enterprise Capital Fund of £37.5 million will be introduced to provide additional equity finance for small businesses.
The Enterprise Finance Guarantee will be increased to provide £200m in 2.88 additional lending for small businesses until 31 March 2011.
The Government will publish a Green Paper on business finance before 2.89 the summer recess.
Value Added Tax2.90 The standard rate of VAT will increase from 17.5 per cent to 20 per cent with effect from 4 January 2011 and anti-forestalling legislation will be introduced, effective from 22 June 2010. Legislation will be in the Finance Bill introduced after the Budget. (1)
Rates under the flat rate scheme for small businesses will be increased 2.91 from 4 January 2011, to reflect this change in the standard rate.
The threshold for businesses to be obliged to make VAT payments on 2.92 account (currently an annual VAT liability of £2million) will be increased to maintain the status quo of the scheme. The Government will legislate for this next year.
The effective rate of five per cent for imported works of art, certain 2.93 antiques, collections and collectors pieces will be maintained by changing the percentage of the value on which standard rate VAT is payable.
Insurance Premium Tax
Life insurance – deficiency
relief
Furnished holiday lettings
Better regulation
Business finance
Value Added Tax
3742_02_Chapter_2.indd 51 22/6/10 00:23:01
52 Budget 2010
2.94 Recognising the efficiencies that can be achieved by organisations such as charities sharing services and the potential VAT barrier that exists, the Government has started discussions with charities and other affected sectors to consider options for implementing the EU cost sharing exemption. It will continue those discussions and launch a formal consultation in the autumn.
Excise duties2.95 The Government will reverse the increase in cider rates of 10 per cent above inflation, from 30 June 2010, which was previously announced in the March 2010 Budget. This will bring it in line with increases to other alcohol rates. (17)
The Government will review the taxation and pricing of alcohol to 2.96 ensure it tackles binge drinking without unfairly penalising responsible drinkers, pubs and important local industries.
2.97 Technical changes will be made in the Finance Bill introduced in the autumn to the definition of cigarettes to take account of the recently revised EU tobacco directive.
2.98 The proposal inherited by the Government for a landline duty will not be implemented. (16)
2.99 As announced in the Coalition Agreement, the Government will review the taxation of the National Lottery.
Environment and transport 2.100 The Chancellor has asked the Office for Budget Responsibility to undertake an assessment over the summer of the effect of oil price fluctuations on the public finances. Informed by this assessment, the Government will examine options for the design of a fair fuel stabiliser.
2.101 Reflecting the coalition commitment to investigate measures to help with fuel costs in remote rural areas, the Government is considering the case for introducing a fuel duty discount in remote rural areas. This includes possible pilot schemes in Scotland.
2.102 In the autumn, the Government will publish proposals to reform the climate change levy in order to provide more certainty and support to the carbon price. Subject to consultation, the Government intends to bring forward relevant legislation in Finance Bill 2011.
Charities2.103 The Government will continue to explore with voluntary sector representatives ways to improve the Gift Aid system and encourage charitable giving.
2.104 The Government will replace the current rules on substantial charity donors and HMRC will consult informally on draft clauses in the summer, with a view to publishing final legislation in the autumn.
Shared services
Alcohol duty
Tobacco duty
Landline duty
National Lottery
Fair fuel stabiliser
Rural fuel duty
Carbon price
Charitable giving
Substantial donors
3742_02_Chapter_2.indd 52 22/6/10 00:23:01
53Budget 2010
Local, regional and devolved administrations2.105 The Government will work in partnership with local authorities to implement a freeze in council tax in England in 2011-12. The Government will clarify in due course the terms under which local authorities that commit to freeze or reduce their council tax will be compensated. (15)
2.106 To ensure the fiscal risks around local authority borrowing decisions are better understood, the Government will monitor lending from the Public Works Loans Board more closely, and consider the approach taken in Scotland to increase transparency around borrowing undertaken more than two years in advance of expenditure.
2.107 The Government reaffirms its commitment to implement the proposals of the Calman Commission in Scotland. The Government will also review the control and use of accumulated and future revenues from the Fossil Fuel Levy in Scotland.
2.108 The Government will publish a consultation paper in autumn 2010, on rebalancing the Northern Ireland economy. This will include options to promote enterprise in Northern Ireland and will examine mechanisms for changing the corporation tax rate as well as economic and public service reform.
2.109 To support private sector enterprise and investment in those regions that are particularly reliant on the public sector Government will:
announce a three year scheme to exempt new businesses in targeted areas •from up to £5,000 of class 1 employer National Insurance Contributions payments, for each of their first ten employees hired in their first year of business. Subject to meeting the necessary legal requirements, the Government aims to have the scheme established by September 2010. Any qualifying new business set up from today will also benefit; (10)
create a Regional Growth Fund to fund regional capital projects in 2011- •12 and 2012-13; and
the Government will publish a White Paper later in the summer setting out •its plans for a new approach to sub-national growth.
Tax compliance2.110 Legislation will be in the Finance Bill introduced after the Budget, with effect from Budget day, to prevent avoidance of corporation tax using accounting ‘derecognition’ rules in relation to loans and derivatives.
2.111 Legislation will be introduced, with effect from Budget day, to prevent tax avoidance involving the creation for corporate investors of a credit for UK tax where no UK tax has been paid.
2.112 The Government will now consult on introducing a power for HMRC to require financial security where PAYE & NICs are at serious risk of non payment, rather than legislate in the upcoming Finance Bill as announced at the March 2010 Budget. (ac)
Council tax
Local authority prudential borrowing
Scotland
Northern Ireland
Regional growth
Accounting derecognition
Alternative Investment
Funds
Financial securities
3742_02_Chapter_2.indd 53 22/6/10 00:23:01
54 Budget 2010
2.113 An anti-avoidance rule that applies when a transfer of business sidesteps the rules for non-profit funds with unrecognised profits will be legislated for in the Finance Bill introduced after the Budget. Additionally, legislation will be in the Finance Bill introduced in the autumn to modify the tax rules that apply to Overseas Life Insurance Companies and the application of the transfer of business rules when non-profit business is transferred to a non-EEA country.
2.114 The Government will engage informally with interested parties to explore whether there is a case for developing a General Anti-Avoidance Rule (GAAR). This will be part of wider work on improvements to the tax policy making process.4
2.115 The Government will consult on bringing Inheritance tax (IHT) on trusts within the Disclosure of Tax Avoidance Schemes regime.
2.116 The Government will examine whether changes to the rules on stamp duty land tax on high value property transactions are needed to prevent avoidance in this area.
Section 2b – Measures announced at the March 2010 Budget or earlier
This section sets out measures announced by the previous Government 2.117 at the March 2010 Budget or earlier that have not yet come into effect, and which the Government confirms will be implemented and legislated for. The fiscal event at which each policy was initially announced is in brackets.
The Government will publish a Finance Bill after the Budget to ensure 2.118 swift Royal Assent for its key priorities. Given the exceptional circumstances this year, and in order to clear inherited measures in a manner consistent with proper Parliamentary scrutiny, a further Finance Bill will be introduced in the autumn. This Bill will be published in draft for comment in July and will contain those measures as specified in this chapter.
Table 2.4 shows the cost or yield of all measures announced at the 2.119 March 2010 Budget or earlier which take effect from April 2011 or later. These numbers were incorporated into the pre-Budget forecast published by the OBR on 14 June 2010. Where the Government is not proceeding with a previous announcement, Table 2.1 shows the impact on the public finances.
4 Tax policy making: a new approach, HM Treasury June 2010.
Life insurance
GAAR
IHT on trusts
Stamp duty land tax
3742_02_Chapter_2.indd 54 22/6/10 00:23:01
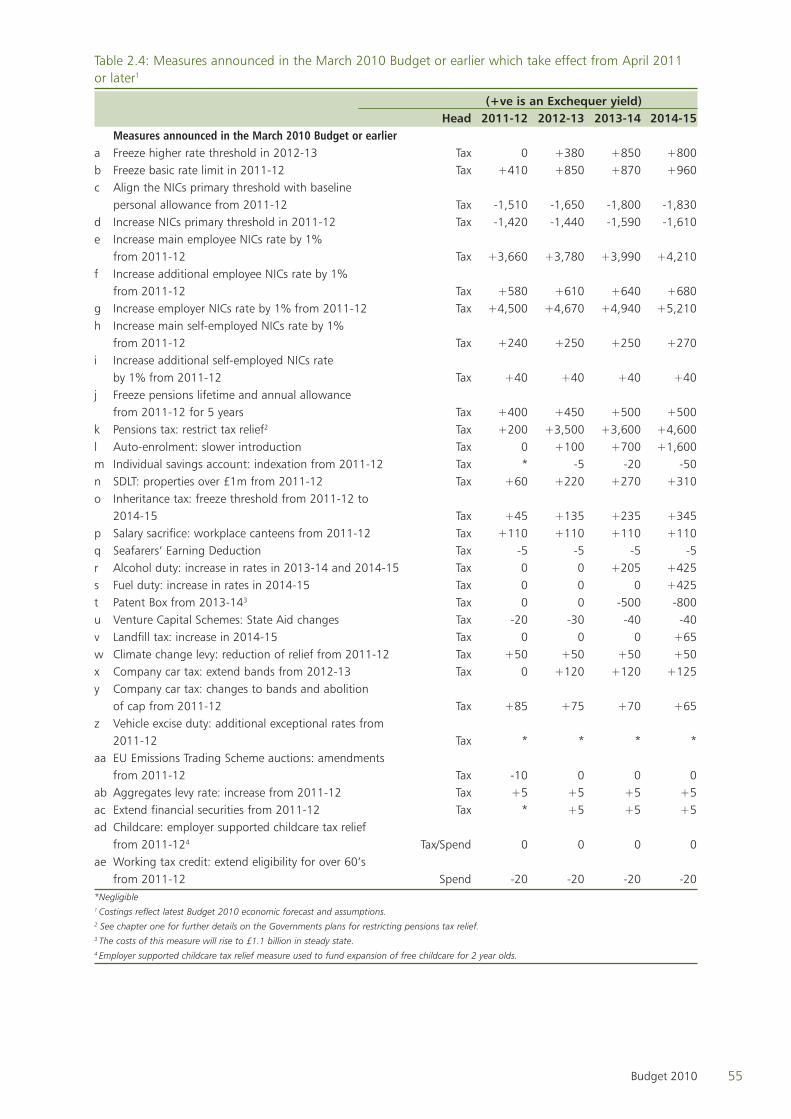
55Budget 2010
Table 2.4: Measures announced in the March 2010 Budget or earlier which take effect from April 2011 or later1
(+ve is an Exchequer yield) Head 2011-12 2012-13 2013-14 2014-15 Measures announced in the March 2010 Budget or earliera Freeze higher rate threshold in 2012-13 Tax 0 +380 +850 +800b Freeze basic rate limit in 2011-12 Tax +410 +850 +870 +960c Align the NICs primary threshold with baseline personal allowance from 2011-12 Tax -1,510 -1,650 -1,800 -1,830d Increase NICs primary threshold in 2011-12 Tax -1,420 -1,440 -1,590 -1,610e Increase main employee NICs rate by 1% from 2011-12 Tax +3,660 +3,780 +3,990 +4,210f Increase additional employee NICs rate by 1% from 2011-12 Tax +580 +610 +640 +680g Increase employer NICs rate by 1% from 2011-12 Tax +4,500 +4,670 +4,940 +5,210h Increase main self-employed NICs rate by 1% from 2011-12 Tax +240 +250 +250 +270i Increase additional self-employed NICs rate by 1% from 2011-12 Tax +40 +40 +40 +40j Freeze pensions lifetime and annual allowance from 2011-12 for 5 years Tax +400 +450 +500 +500k Pensions tax: restrict tax relief2 Tax +200 +3,500 +3,600 +4,600l Auto-enrolment: slower introduction Tax 0 +100 +700 +1,600m Individual savings account: indexation from 2011-12 Tax * -5 -20 -50n SDLT: properties over £1m from 2011-12 Tax +60 +220 +270 +310o Inheritance tax: freeze threshold from 2011-12 to 2014-15 Tax +45 +135 +235 +345p Salary sacrifice: workplace canteens from 2011-12 Tax +110 +110 +110 +110q Seafarers’ Earning Deduction Tax -5 -5 -5 -5r Alcohol duty: increase in rates in 2013-14 and 2014-15 Tax 0 0 +205 +425s Fuel duty: increase in rates in 2014-15 Tax 0 0 0 +425t Patent Box from 2013-143 Tax 0 0 -500 -800u Venture Capital Schemes: State Aid changes Tax -20 -30 -40 -40v Landfill tax: increase in 2014-15 Tax 0 0 0 +65w Climate change levy: reduction of relief from 2011-12 Tax +50 +50 +50 +50x Company car tax: extend bands from 2012-13 Tax 0 +120 +120 +125y Company car tax: changes to bands and abolition of cap from 2011-12 Tax +85 +75 +70 +65z Vehicle excise duty: additional exceptional rates from 2011-12 Tax * * * *aa EU Emissions Trading Scheme auctions: amendments from 2011-12 Tax -10 0 0 0ab Aggregates levy rate: increase from 2011-12 Tax +5 +5 +5 +5ac Extend financial securities from 2011-12 Tax * +5 +5 +5ad Childcare: employer supported childcare tax relief from 2011-124 Tax/Spend 0 0 0 0ae Working tax credit: extend eligibility for over 60’s from 2011-12 Spend -20 -20 -20 -20*Negligible1 Costings reflect latest Budget 2010 economic forecast and assumptions.2 See chapter one for further details on the Governments plans for restricting pensions tax relief.3 The costs of this measure will rise to £1.1 billion in steady state.4 Employer supported childcare tax relief measure used to fund expansion of free childcare for 2 year olds.
3742_02_Chapter_2.indd 55 22/6/10 00:23:01
56 Budget 2010
2.120 The Government has inherited a number of measures which made changes to income tax and NICs rates and thresholds in 2011-12 and 2012-13. In 2011-12, these would have increased the personal allowance for under 65s by £130 below indexation and frozen the basic rate limit. The measures announced in this Budget now supercede these decisions (see paragraphs 2.22 and 2.23). In addition, as previously announced in 2011-12, the NICs primary threshold will increase and NICs rates will be increased by one per cent (2009 Pre-Budget Report). In 2012-13 the higher rate threshold (the level at which 40 per cent tax begins to be paid) will be frozen (2009 Pre-Budget Report). (a-i)
2.121 From April 2011, people aged over 60 will qualify for Working Tax Credit if they work at least 16 hours a week, rather than 30 as currently. (March 2010 Budget) (ae)
2.122 Legislation was included in Finance Act 2010 to restrict the tax exemption for workplace canteens by removing the exemption when used in conjunction with salary sacrifice or flexible benefit arrangements. This will take effect from April 2011. (2009 Pre-Budget Report) (p)
2.123 From April 2011, the weekly amount that parents joining an Employer-Supported Childcare scheme will be able to claim exempt of income tax and disregarded of NICs will remain at £55 for basic rate taxpayers, but will be reduced to £28 and £22 per week for higher and additional rate taxpayers respectively. All current users will continue to enjoy the same exemption and disregards beyond April 2011. (2009 Pre-Budget Report) (ad)
2.124 The Government is supportive of auto-enrolment. It has committed to reviewing private pension reforms and will be announcing details of a review shortly. (I)
2.125 An additional five per cent rate of stamp duty land tax will take effect for residential transactions worth over £1 million from 6 April 2011. (March 2010 Budget) (n)
2.126 The inheritance tax allowance will be frozen at its 2010-11 level of £325,000 until 2014-15. (March 2010 Budget). (o)
2.127 The Government intends to include nitrous oxide gases from nitric acid production in the EU Emission Trading System from 2011. (March 2010 Budget) (aa)
2.128 The standard rate of landfill tax will increase by £8 per tonne each year from 1 April 2011 until at least 2014. There will be a floor under the standard rate at £80 per tonne, so that the rate will not fall below £80 per tonne from April 2014 until at least 2020. (March 2010 Budget) (v)
New qualifying criteria for lower rated wastes will be legislated in the 2.129 Finance Bill introduced in the autumn, to come into effect on 1 April 2011. (March 2010 Budget)
2.130 The rate of aggregates levy will increase from £2.00 per tonne to £2.10 per tonne on 1 April 2011. (March 2010 Budget) (ab)
Income tax and NICs
Working Tax Credit
Workplace canteens
Employer-Supported Childcare
Auto-enrolment
Stamp duty land tax
Inheritance tax
EU Emission Trading System
Landfill tax
Aggregates levy
3742_02_Chapter_2.indd 56 22/6/10 00:23:01
57Budget 2010
The Government is seeking EU State aid approval to extend the 2.131 Aggregates Levy Credit Scheme in Northern Ireland for a further ten years from 31 March 2011. Legislation will be in the Finance Bill introduced in the autumn. (March 2010 Budget)
2.132 From 1 April 2011, the discount from the climate change levy obtained by participating in a climate change agreement will be reduced from 80 to 65 per cent. (2009 Pre-Budget Report) (v)
The rates of climate change levy will be raised in line with inflation on 2.133 1 April 2011. (March 2010 Budget)
2.134 Under plans the Government has inherited, fuel duty is scheduled to rise by one pence per litre above indexation in April 2014. (s)
2.135 The Government will reform company tax so that it continues to provide an incentive to purchase the lowest emitting vehicles on the market. From April 2011, the basic threshold for the 15 per cent band of company car tax will be reduced by 5 grams of carbon dioxide emitted per kilometre (g CO2 per km), so that this band applies to cars emitting between 121 and 129g CO2 per km. The percentage of list price subject to tax will continue to increase by one percentage point with every 5g CO2 per km increase in emissions, to a maximum of 35 per cent. The cap on car list prices used to calculate the taxable benefit arising from company cars will also be abolished on this date, as will discounts for early uptake Euro 4-standard diesel cars, higher-emitting hybrid cars and alternative fuel company cars. (Budget 2009) (x)
From April 2012, the 10 per cent band for cars emitting 120g CO2.136 2 per km or less will be removed, and the system of bands will be extended so that they increase by one percentage point with every 5g CO2 per km increase in emissions, from 10 per cent. This 10 per cent band will apply to cars that emit 99g of CO2 per km or less. (2009 Pre-Budget Report) (w)
2.137 Legislation will be in the Finance Bill introduced in the autumn for an enhanced capital allowance for zero-carbon goods vehicles. This will apply to vehicles purchased from April 2010, and will be in place for five years. (March 2010 Budget)
2.138 From April 2011, exceptional rates of vehicle excise duty will be introduced for certain heavy goods vehicles, to ensure consistency with EU regulations. The number and value of exceptional rates will be announced after the necessary exchange rate data becomes available in October. Legislation will be in the Finance Bill introduced in the autumn. (March 2010 Budget) (y)
2.139 The Government will continue with the plans it inherited to increase alcohol duty rates by two per cent above inflation each year to 2014-15. (r)
2.140 Legislation will be in the Finance Bill introduced in the autumn to abolish the condition requiring that any intellectual property (IP) deriving from the R&D undertaken by a company which is a small or medium enterprise (SME) be owned by the company making the claim. Legislation will be effective for any expenditure incurred in an accounting period ending on or after 9 December 2009. (2009 Pre-Budget Report)
Climate change levy
Fuel duty
Company car tax
Zero-carbon goods vehicles
HGV VED
Alcohol duty
R&D tax credits IP conditions
3742_02_Chapter_2.indd 57 22/6/10 00:23:01
58 Budget 2010
2.141 Seafarers earnings deduction will be extended to EU/EEA resident seafarers from April 2011. Legislation will be in the Finance Bill introduced in the autumn. (2009 Pre-Budget Report) (q)
2.142 Legislation will be in the Finance Bill introduced in the autumn to implement changes required as a condition for the State aid approval of the Enterprise Investment Scheme (EIS), Venture Capital Trusts (VCTs) and Enterprise Management Incentives (EMI). The changes will generally have effect from a date to be appointed, with the exception of the eligible shares changes for VCTs, which will not affect monies raised by the VCT before that date. (2009 Pre-Budget Report) (u)
2.143 Secondary legislation will be introduced as soon as possible to extend the scope of the Ultra High Pressure High Temperature field allowance. (2009 Pre Budget Report)
Legislation will be in the Finance Bill introduced in the autumn to 2.144 enable chargeable gains reinvestment relief to apply when a group company makes the reinvestment. (March 2010 Budget)
Other changes to the UK oil and gas fiscal regime previously 2.145 announced will be legislated for in 2011. (2009 Pre Budget Report)
2.146 Those aspects of corporation tax group relief rules that cover consortium relief will be amended to allow EU and EEA-resident companies engaged in UK consortia to pass on relief for the losses of those consortia to their UK-resident group companies. At the same time, the Government is strengthening rules designed to ensure that access to consortium relief is given only in proper proportion to the member company’s involvement in the consortium. Legislation will be in the Finance Bill introduced in the autumn and both changes will have effect from the day on which draft legislation is published. (March 2010 Budget)
2.147 Legislation will be in the Finance Bill introduced in the autumn to end uncertainty over the treatment of certain company distributions. Following a detailed review of distributions law, it was found that the prevailing practice of treating most distributions as income for corporation tax purposes (and not subject to the chargeable gains rules) was not correct. The legislation will restore previous expectations about the way distributions are taxed.
2.148 Legislation will be in the Finance Bill introduced in the autumn to extend foster care relief to shared lives carers, and to extend the income tax exemption for adopters to guardians, with effect from April 2010. This legislation will also ensure that from 9 December 2009, there will have been no loss of capital gains tax private residence relief where adult placement carers use part of their home exclusively for the accommodation of an adult in care. (2009 Pre-Budget Report and March 2010 Budget)
2.149 With effect from 1 April 2011, legislation will be introduced in Finance Bill 2011 to reform and simplify the associated company rules as they apply to the small profits rate of corporation tax. (March 2010 Budget)
2.150 The level of small business rate relief in England will be temporarily increased for one year, from 1 October 2010, giving full relief for eligible businesses occupying premises with a rateable value of up to £6,000 and tapering relief to £12,000. (March 2010 Budget)
Seafarers earnings
deduction
Venture Capital Schemes
UK oil and gas fiscal regime
Consortium relief
Capital distributions
Shared lives carers
Associated company rules
Small business rate relief
3742_02_Chapter_2.indd 58 22/6/10 00:23:01
59Budget 2010
2.151 From 2011-12 the Individual Savings Account (ISA) subscription limits will be indexed. (March 2010 Budget) (m)
Changes will be made to pensions tax legislation in the Finance Bill 2.152 introduced in the autumn to enable the National Employment Savings Trust (NEST) to register as a pension scheme for tax purposes. Further legislation will be introduced in Finance Bill 2011 to remove tax charges on late contributions following auto-enrolment and to amend the tax rules on unauthorised borrowing by registered pension schemes. (March 2010 Budget)
2.153 From 6 April 2010, where a settlor is liable to income tax on trust income at a lower rate of tax than that paid by the trustees, the settlor must pay this refund back to the trustees. These repayments will be disregarded for inheritance tax purposes. Legislation will be in the Finance Bill introduced in the autumn. (March 2010 Budget)
Legislation will be in the Finance Bill introduced in the autumn, which 2.154 will apply retrospectively to 6 April 2006, to help trusts specifically set up to compensate asbestos victims, but which have been unable to access tax efficient structures for the benefit of victims. (March 2010 Budget)
2.155 Legislation will be in the Finance Bill introduced in the autumn to make changes to the worldwide debt cap. (March 2010 Budget)
2.156 Changes will be made in the Finance Bill introduced in the autumn to allow UK-REITs to issue optional stock dividends as part of their property income distribution requirement. (March 2010 Budget)
2.157 Legislation will be in the Finance Bill introduced in the autumn to correct an unintended anomaly affecting the amount of tax credit claimable where films are produced over more than one accounting period. Legislation will be effective for accounting periods ending on or after 9 December 2009. (2009 Pre-Budget Report)
2.158 The Government confirms that it will proceed with the establishment of a Growth Capital Fund to provide growth capital in the £2-10 million range to fast-growing SMEs currently not served by the market. (2009 Pre-Budget Report)
2.159 From 31 January 2011, VAT will be applied at the standard rate to certain postal services provided by the Universal Service Provider (Royal Mail), restricting the exemption to those services which Royal Mail is obliged to provide. The zero rating for passenger transport services will also be updated to reflect the status of the provider of a passenger transport service made in conjunction with postal services. Legislation will be in the Finance Bill introduced in the autumn. (March 2010 Budget)
The scope of the zero rate for aircraft will be amended in the Finance 2.160 Bill introduced in the autumn, from one based on the aircraft’s weight and usage to one based on the status of the customer, with the zero rate applying to aircraft bought by airlines operating for reward chiefly on international routes. As a minor change from the previous announcement, this will now take place from 1 January 2011. (March 2010 Budget)
Savings and assets
Trusts
Debt cap
UK-REITs
Film tax credit
Growth Capital Fund
VAT measures
3742_02_Chapter_2.indd 59 22/6/10 00:23:01
60 Budget 2010
From 1 January 2011, the scope of the VAT special rules for natural gas 2.161 (which simplify the VAT treatment for businesses making wholesale supplies of gas) will be adjusted, and the rules (which also apply to electricity) will be extended to include heating and cooling networks. Legislation will be in the Finance Bill introduced in the autumn. (March 2010 Budget)
Legislation will be in the Finance Bill introduced in the autumn to 2.162 protect revenues tied up in “Lennartz” schemes in existence at 22 January 2010, where the assets are used partly for business and partly for non-business purposes. From 1 January 2011, the use of Lennartz arrangements for certain assets (land and property, ships and aircraft) used partly for business and partly for private purposes will be withdrawn. (March 2010 Budget)
2.163 Legislation will be in the Finance Bill introduced in the autumn to complete the harmonisation of interest charged by HMRC across different tax regimes. (March 2010 Budget)
Legislation will be in the Finance Bill introduced in the autumn to 2.164 modernise compliance checking powers for excise duties. (March 2010 Budget)
Legislation will be in the Finance Bill introduced in the autumn to 2.165 complete the modernisation of HMRC’s late filing and late payment penalty regimes. (March 2010 Budget)
Legislation will be in the Finance Bill introduced in the autumn to deal 2.166 with claims to recover overpaid stamp duty land tax and petroleum revenue tax. (March 2010 Budget)
The March 2010 Budget announced action to tackle arrangements 2.167 using trusts and other vehicles to reward employees which seek to avoid, defer or reduce liabilities of employees and directors to income tax and NICs or to avoid restrictions on pensions tax relief. Legislation will take effect from April 2011. The Government confirms that Employer Financed Retirement Benefit Schemes (EFRBS) are within the scope of this measure. (March 2010 Budget)
Section 2c – The Civil ListThe Civil List is paid from the Consolidated Fund each year to enable 2.168
The Queen to discharge Her duties as Head of State. It meets the central staff costs and running expenses of Her Majesty’s official Household.
Under the Civil List Act 1972, the Royal Trustees – that is, the Prime 2.169 Minister, the Chancellor and the Queen’s Treasurer – must report on Civil List expenditure at least every ten years (see HC140). In addition, the Royal Household now publishes annual accounts, professionally audited for the Treasury.
The report shows that the Royal Household has been a careful 2.170 housekeeper since the last report of 2000. That report left the annual payments of the Civil List unchanged at £7.9 million a year and envisaged that these would be supplemented by drawings from the Civil List Reserve which had been built up since 1990. The Civil List Reserve will be down to £8 million by the end of 2010.
Tax compliance
3742_02_Chapter_2.indd 60 22/6/10 00:23:02
61Budget 2010
The Royal Trustees’ Report details the expenditure of Civil List funds 2.171 over the decade since 2000. It also shows the plans for 2011, as below. Expenditure will be slightly lower with no change in Civil List funding.
Table 2.5: Civil list (estimated and planned)
20101 20112
Costs Basic expenditure 14.5 14.5 Net capital expenditure 0.2 0.2Pension lump sum payment3 0.4 – Transfers of expenditure now planned – 0.2 15.1 14.9Financed by Civil List 7.9 7.9 Drawing from Civil List Reserve 7.2 7.0 15.1 14.9
Civil List Reserve at the end of the year 8.0 1.01 Figures for 2010 are actuals to April 2010 and reforecasts for the remainder of the year2 Estimates3 The pension lump sum payment is to accelerate funding of the pension scheme deficit
Beyond 2011, the Government intends to develop a new consolidated 2.172 means of supporting The Queen in Her public duties. The current arrangements for supporting the Royal Household, established in 1972, need to be replaced. There will be a simple modern means to provide consolidated finance for The Queen’s future expenses as head of state in an efficient, dignified and accountable fashion.
The Government also intends a significant improvement in 2.173 accountability. At the moment, the Permanent Secretary to the Treasury has responsibility for the audit of the Civil List. These accounts are already published. From 2012, the Comptroller and Auditor General will operate as audit contractor and the accounts will be laid before the House. Civil List expenditure will be subject to the same audit scrutiny as any Government department – including, if it so decides, by the Public Accounts Committee.
3742_02_Chapter_2.indd 61 22/6/10 00:23:02

62 Budget 2010
3742_02_Chapter_2.indd 62 22/6/10 00:23:02
63Budget 2010
Impact of tax and welfare changes on householdsATransparent policy making
The document, A.1 Tax policy making: a new approach, published at Budget, sets out the Government’s commitment to improving tax policy making. It is vital that all policy decisions are properly scrutinised. This requires greater transparency about the impact of changes and this chapter is intended to help interested parties understand the impact on households of tax and welfare proposals. For future fiscal events the Government will consider how best to present the impact of changes on households consistent with these aims of transparency.
Impact of direct tax and tax credit changesThis section sets out the impact on individuals of the personal tax A.2
changes announced in this Budget; and on families of the tax credit changes announced in this Budget. The examples in the tables below are necessarily simplified, however they serve as a guide to changes in tax paid and tax credits received at different income levels.
The amounts set out in the tables below are based on the OBR’s latest A.3 independent projections for CPI and RPI and the actual amounts will vary depending on actual levels of CPI and RPI over the relevant periods.
A.4 Table A1 below shows income tax and National Insurance Contributions (NICs) paid for individuals under the age of 65 at different income levels. It shows the amount currently being paid; the amount that would have been paid in 2011-12 under the plans this Government has inherited; and the amount that will be paid in 2011-12 and 2012-13 following the changes announced in this Budget.
Income tax and National
Insurance Contributions
3742_03_Annex_A.indd 63 22/6/10 00:23:14
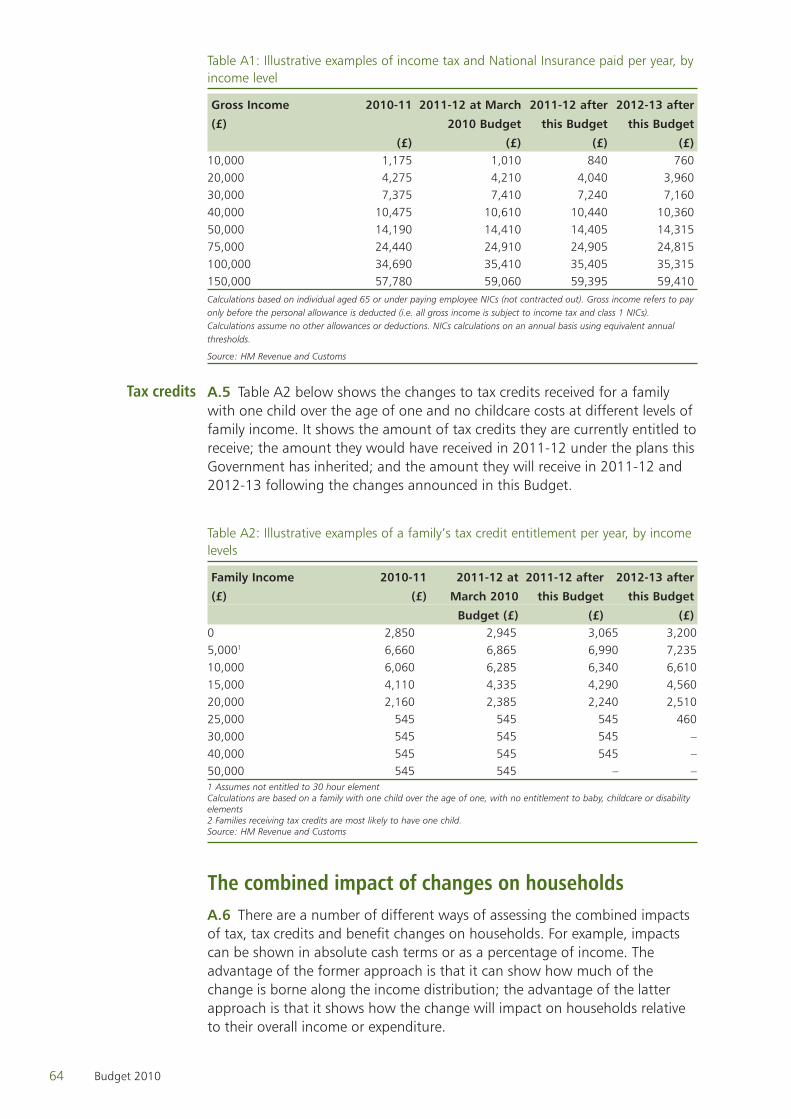
64 Budget 2010
Table A1: Illustrative examples of income tax and National Insurance paid per year, by income level
Gross Income 2010-11 2011-12 at March 2011-12 after 2012-13 after
(£) 2010 Budget this Budget this Budget
(£) (£) (£) (£)10,000 1,175 1,010 840 76020,000 4,275 4,210 4,040 3,96030,000 7,375 7,410 7,240 7,16040,000 10,475 10,610 10,440 10,36050,000 14,190 14,410 14,405 14,31575,000 24,440 24,910 24,905 24,815100,000 34,690 35,410 35,405 35,315150,000 57,780 59,060 59,395 59,410Calculations based on individual aged 65 or under paying employee NICs (not contracted out). Gross income refers to pay only before the personal allowance is deducted (i.e. all gross income is subject to income tax and class 1 NICs). Calculations assume no other allowances or deductions. NICs calculations on an annual basis using equivalent annual thresholds.
Source: HM Revenue and Customs
A.5 Table A2 below shows the changes to tax credits received for a family with one child over the age of one and no childcare costs at different levels of family income. It shows the amount of tax credits they are currently entitled to receive; the amount they would have received in 2011-12 under the plans this Government has inherited; and the amount they will receive in 2011-12 and 2012-13 following the changes announced in this Budget.
Table A2: Illustrative examples of a family’s tax credit entitlement per year, by income levels
Family Income 2010-11 2011-12 at 2011-12 after 2012-13 after
(£) (£) March 2010 this Budget this Budget
Budget (£) (£) (£)0 2,850 2,945 3,065 3,200 5,0001 6,660 6,865 6,990 7,235 10,000 6,060 6,285 6,340 6,610 15,000 4,110 4,335 4,290 4,560 20,000 2,160 2,385 2,240 2,510 25,000 545 545 545 460 30,000 545 545 545 – 40,000 545 545 545 –50,000 545 545 – –1 Assumes not entitled to 30 hour element Calculations are based on a family with one child over the age of one, with no entitlement to baby, childcare or disability elements2 Families receiving tax credits are most likely to have one child.Source: HM Revenue and Customs
The combined impact of changes on households There are a number of different ways of assessing the combined impacts A.6
of tax, tax credits and benefit changes on households. For example, impacts can be shown in absolute cash terms or as a percentage of income. The advantage of the former approach is that it can show how much of the change is borne along the income distribution; the advantage of the latter approach is that it shows how the change will impact on households relative to their overall income or expenditure.
Tax credits
3742_03_Annex_A.indd 64 22/6/10 00:23:14
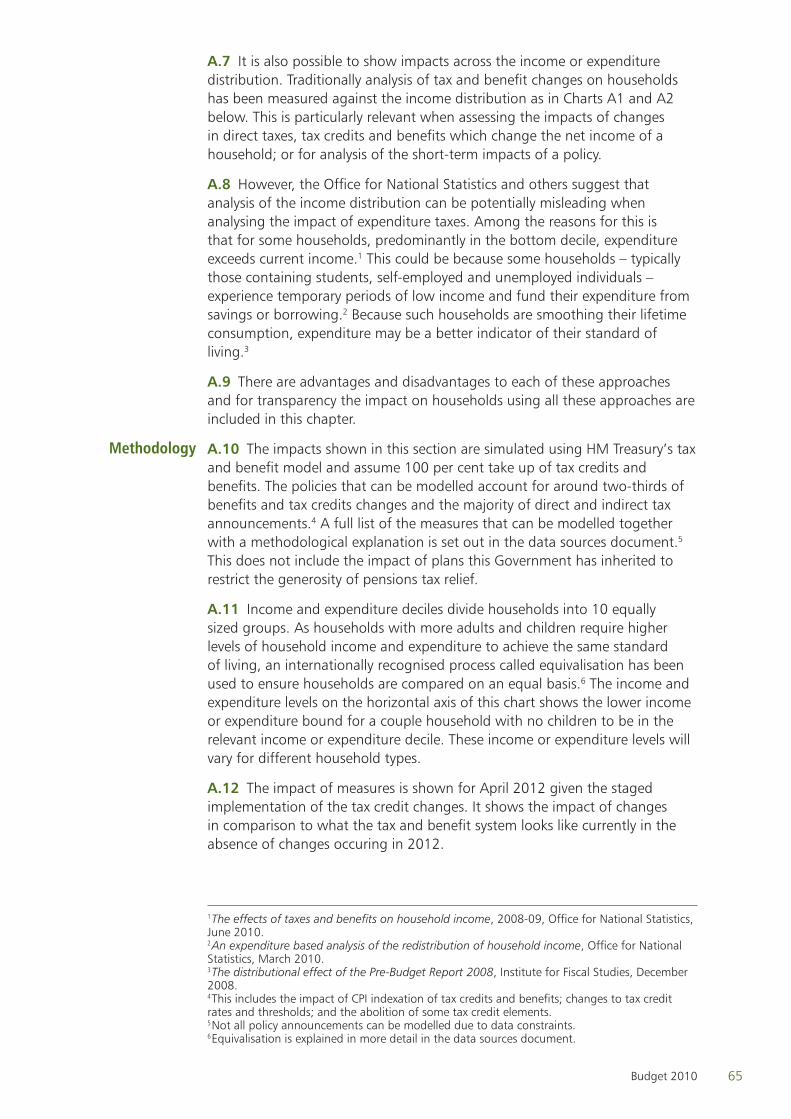
65Budget 2010
It is also possible to show impacts across the income or expenditure A.7 distribution. Traditionally analysis of tax and benefit changes on households has been measured against the income distribution as in Charts A1 and A2 below. This is particularly relevant when assessing the impacts of changes in direct taxes, tax credits and benefits which change the net income of a household; or for analysis of the short-term impacts of a policy.
However, the Office for National Statistics and others suggest that A.8 analysis of the income distribution can be potentially misleading when analysing the impact of expenditure taxes. Among the reasons for this is that for some households, predominantly in the bottom decile, expenditure exceeds current income.1 This could be because some households – typically those containing students, self-employed and unemployed individuals – experience temporary periods of low income and fund their expenditure from savings or borrowing.2 Because such households are smoothing their lifetime consumption, expenditure may be a better indicator of their standard of living.3
There are advantages and disadvantages to each of these approaches A.9 and for transparency the impact on households using all these approaches are included in this chapter.
A.10 The impacts shown in this section are simulated using HM Treasury’s tax and benefit model and assume 100 per cent take up of tax credits and benefits. The policies that can be modelled account for around two-thirds of benefits and tax credits changes and the majority of direct and indirect tax announcements.4 A full list of the measures that can be modelled together with a methodological explanation is set out in the data sources document.5 This does not include the impact of plans this Government has inherited to restrict the generosity of pensions tax relief.
Income and expenditure deciles divide households into 10 equally A.11 sized groups. As households with more adults and children require higher levels of household income and expenditure to achieve the same standard of living, an internationally recognised process called equivalisation has been used to ensure households are compared on an equal basis.6 The income and expenditure levels on the horizontal axis of this chart shows the lower income or expenditure bound for a couple household with no children to be in the relevant income or expenditure decile. These income or expenditure levels will vary for different household types.
The impact of measures is shown for April 2012 given the staged A.12 implementation of the tax credit changes. It shows the impact of changes in comparison to what the tax and benefit system looks like currently in the absence of changes occuring in 2012.
1 The effects of taxes and benefits on household income, 2008-09, Office for National Statistics, June 2010.2 An expenditure based analysis of the redistribution of household income, Office for National Statistics, March 2010.3 The distributional effect of the Pre-Budget Report 2008, Institute for Fiscal Studies, December 2008.4 This includes the impact of CPI indexation of tax credits and benefits; changes to tax credit rates and thresholds; and the abolition of some tax credit elements.5 Not all policy announcements can be modelled due to data constraints.6 Equivalisation is explained in more detail in the data sources document.
Methodology
3742_03_Annex_A.indd 65 22/6/10 00:23:14
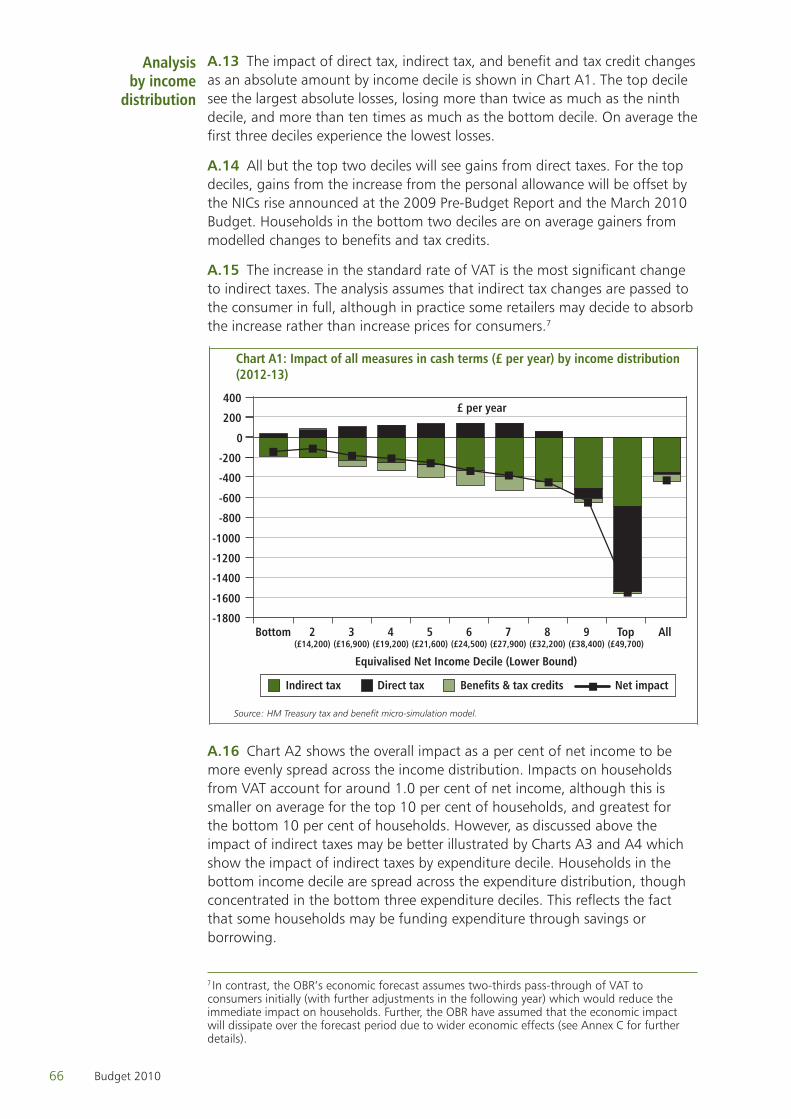
66 Budget 2010
A.13 The impact of direct tax, indirect tax, and benefit and tax credit changes as an absolute amount by income decile is shown in Chart A1. The top decile see the largest absolute losses, losing more than twice as much as the ninth decile, and more than ten times as much as the bottom decile. On average the first three deciles experience the lowest losses.
All but the top two deciles will see gains from direct taxes. For the top A.14 deciles, gains from the increase from the personal allowance will be offset by the NICs rise announced at the 2009 Pre-Budget Report and the March 2010 Budget. Households in the bottom two deciles are on average gainers from modelled changes to benefits and tax credits.
The increase in the standard rate of VAT is the most significant change A.15 to indirect taxes. The analysis assumes that indirect tax changes are passed to the consumer in full, although in practice some retailers may decide to absorb the increase rather than increase prices for consumers.7
Source: HM Treasury tax and benefit micro-simulation model.
AllTop(£49,700)
9(£38,400)
8(£32,200)
7(£27,900)
6(£24,500)
5(£21,600)
4(£19,200)
3(£16,900)
2(£14,200)
Bottom
Equivalised Net Income Decile (Lower Bound)
Benefits & tax creditsDirect tax Net impactIndirect tax
Chart A1: Impact of all measures in cash terms (£ per year) by income distribution(2012-13)
-1800
-1600
-1400
-1200
-1000
-800
-600
-400
-200
0
200
400£ per year
Chart A2 shows the overall impact as a per cent of net income to be A.16 more evenly spread across the income distribution. Impacts on households from VAT account for around 1.0 per cent of net income, although this is smaller on average for the top 10 per cent of households, and greatest for the bottom 10 per cent of households. However, as discussed above the impact of indirect taxes may be better illustrated by Charts A3 and A4 which show the impact of indirect taxes by expenditure decile. Households in the bottom income decile are spread across the expenditure distribution, though concentrated in the bottom three expenditure deciles. This reflects the fact that some households may be funding expenditure through savings or borrowing.
7 In contrast, the OBR’s economic forecast assumes two-thirds pass-through of VAT to consumers initially (with further adjustments in the following year) which would reduce the immediate impact on households. Further, the OBR have assumed that the economic impact will dissipate over the forecast period due to wider economic effects (see Annex C for further details).
Analysis by income
distribution
3742_03_Annex_A.indd 66 22/6/10 00:23:15
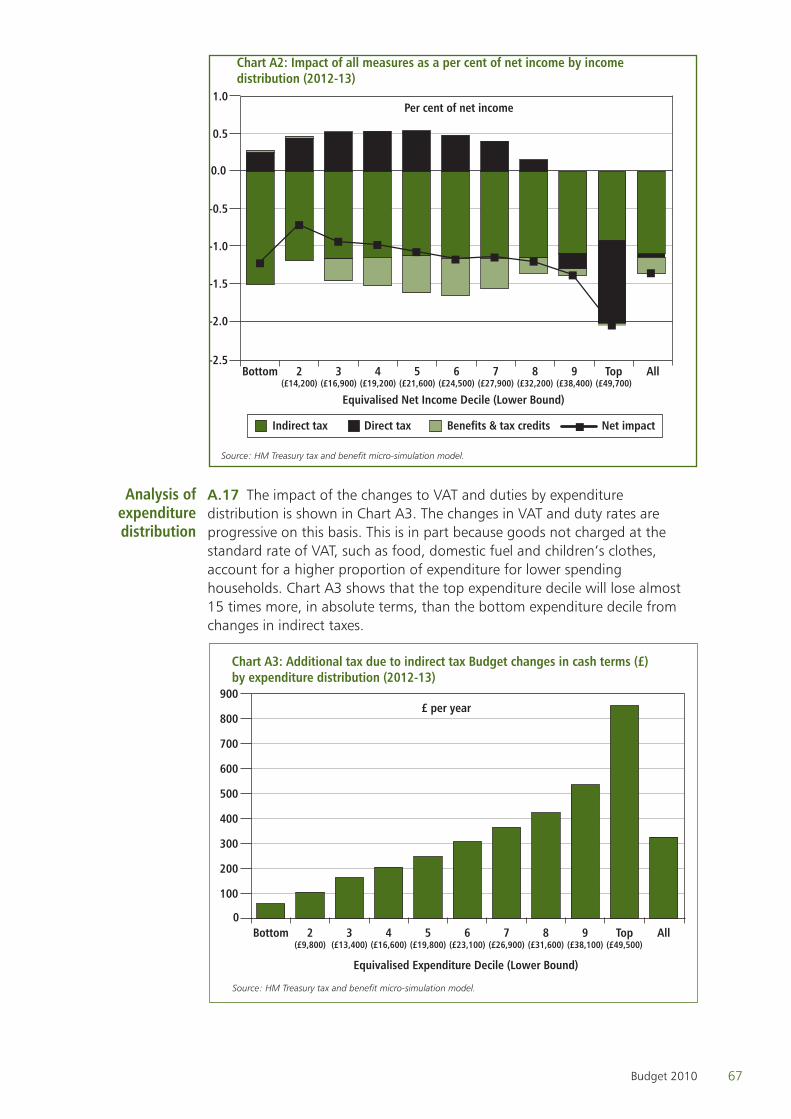
67Budget 2010
-2.0
-1.5
-1.0
-0.5
0.0
0.5
1.0
AllTop(£49,700)
9(£38,400)
8(£32,200)
7(£27,900)
6(£24,500)
5(£21,600)
4(£19,200)
3(£16,900)
2(£14,200)
Bottom
Source: HM Treasury tax and benefit micro-simulation model.
Equivalised Net Income Decile (Lower Bound)
Per cent of net income
Benefits & tax creditsDirect tax Net impactIndirect tax
Chart A2: Impact of all measures as a per cent of net income by incomedistribution (2012-13)
-2.5
A.17 The impact of the changes to VAT and duties by expenditure distribution is shown in Chart A3. The changes in VAT and duty rates are progressive on this basis. This is in part because goods not charged at the standard rate of VAT, such as food, domestic fuel and children’s clothes, account for a higher proportion of expenditure for lower spending households. Chart A3 shows that the top expenditure decile will lose almost 15 times more, in absolute terms, than the bottom expenditure decile from changes in indirect taxes.
Chart A3: Additional tax due to indirect tax Budget changes in cash terms (£) by expenditure distribution (2012-13)
0
100
200
300
400
500
600
700
800
900
AllTop(£49,500)
9(£38,100)
8(£31,600)
7(£26,900)
6(£23,100)
5(£19,800)
4(£16,600)
3(£13,400)
2(£9,800)
Bottom
£ per year
Source: HM Treasury tax and benefit micro-simulation model.
Equivalised Expenditure Decile (Lower Bound)
Analysis of expenditure distribution
3742_03_Annex_A.indd 67 22/6/10 00:23:15
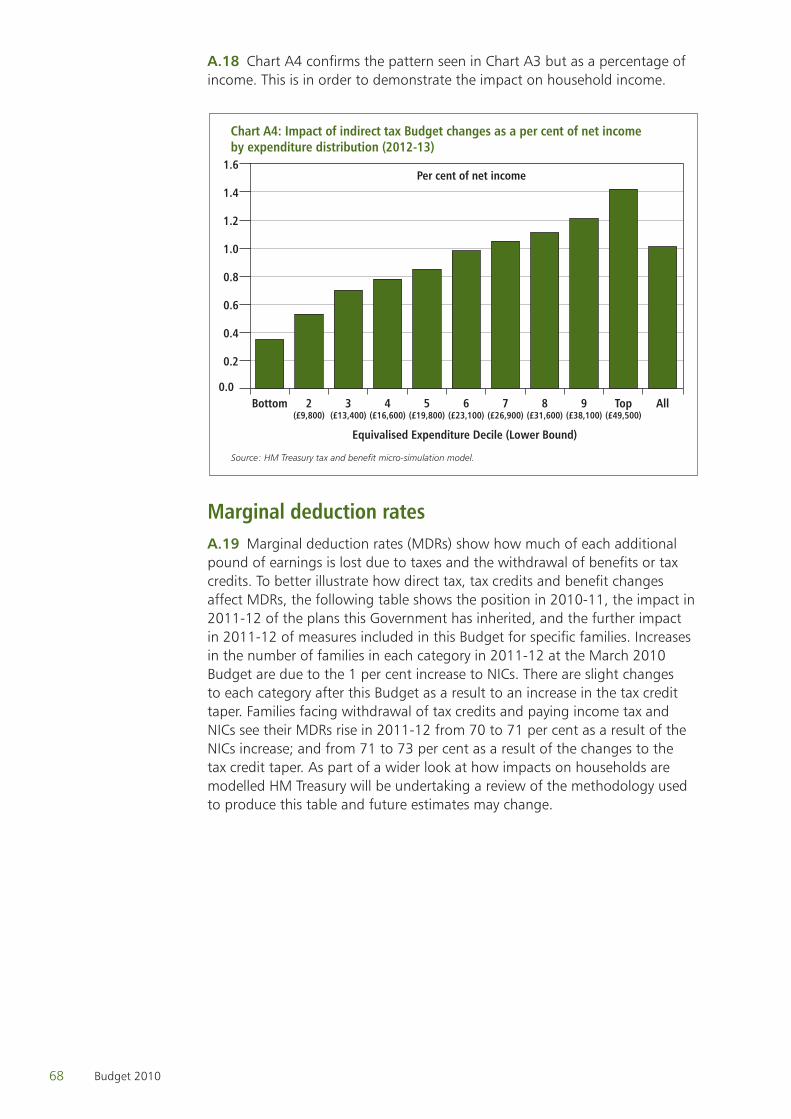
68 Budget 2010
Chart A4 confirms the pattern seen in Chart A3 but as a percentage of A.18 income. This is in order to demonstrate the impact on household income.
Chart A4: Impact of indirect tax Budget changes as a per cent of net incomeby expenditure distribution (2012-13)
0.0
0.2
0.4
0.6
0.8
1.0
1.2
1.4
1.6
AllTop(£49,500)
9(£38,100)
8(£31,600)
7(£26,900)
6(£23,100)
5(£19,800)
4(£16,600)
3(£13,400)
2(£9,800)
Bottom
Source: HM Treasury tax and benefit micro-simulation model.
Equivalised Expenditure Decile (Lower Bound)
Per cent of net income
Marginal deduction ratesMarginal deduction rates (MDRs) show how much of each additional A.19
pound of earnings is lost due to taxes and the withdrawal of benefits or tax credits. To better illustrate how direct tax, tax credits and benefit changes affect MDRs, the following table shows the position in 2010-11, the impact in 2011-12 of the plans this Government has inherited, and the further impact in 2011-12 of measures included in this Budget for specific families. Increases in the number of families in each category in 2011-12 at the March 2010 Budget are due to the 1 per cent increase to NICs. There are slight changes to each category after this Budget as a result to an increase in the tax credit taper. Families facing withdrawal of tax credits and paying income tax and NICs see their MDRs rise in 2011-12 from 70 to 71 per cent as a result of the NICs increase; and from 71 to 73 per cent as a result of the changes to the tax credit taper. As part of a wider look at how impacts on households are modelled HM Treasury will be undertaking a review of the methodology used to produce this table and future estimates may change.
3742_03_Annex_A.indd 68 22/6/10 00:23:15
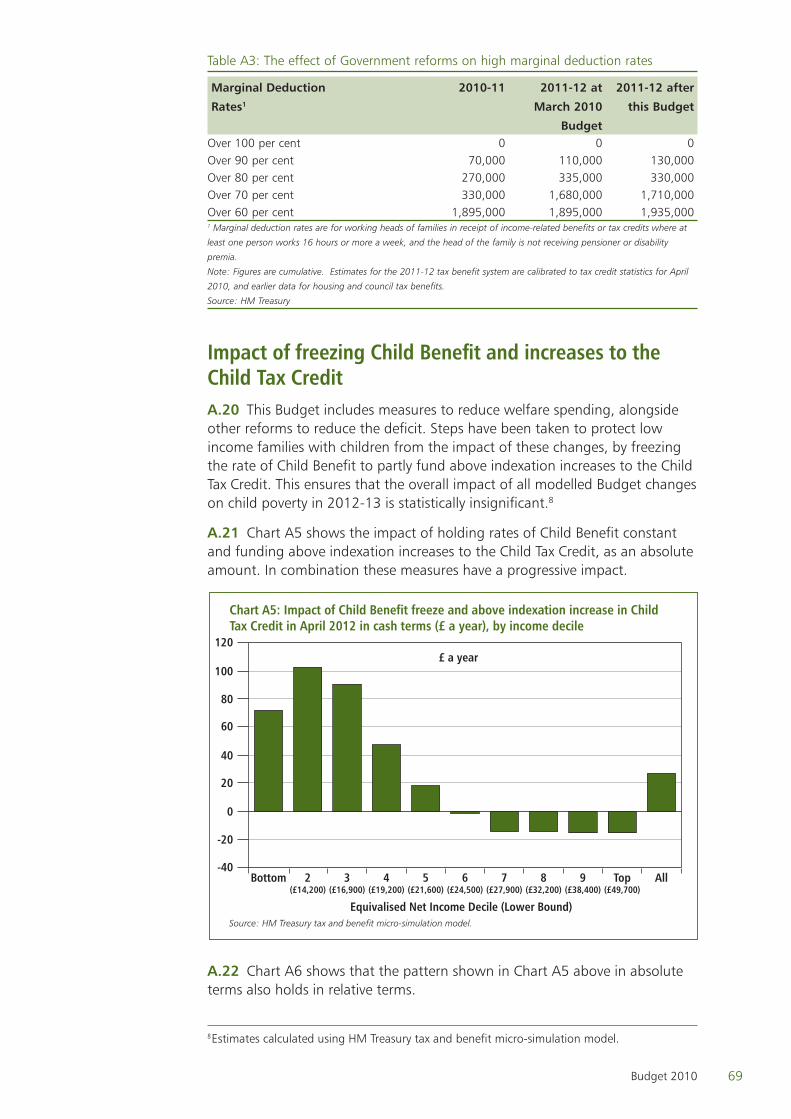
69Budget 2010
Table A3: The effect of Government reforms on high marginal deduction rates
Marginal Deduction 2010-11 2011-12 at 2011-12 after
Rates1 March 2010 this Budget
Budget Over 100 per cent 0 0 0Over 90 per cent 70,000 110,000 130,000Over 80 per cent 270,000 335,000 330,000Over 70 per cent 330,000 1,680,000 1,710,000Over 60 per cent 1,895,000 1,895,000 1,935,0001 Marginal deduction rates are for working heads of families in receipt of income-related benefits or tax credits where at
least one person works 16 hours or more a week, and the head of the family is not receiving pensioner or disability
premia.
Note: Figures are cumulative. Estimates for the 2011-12 tax benefit system are calibrated to tax credit statistics for April
2010, and earlier data for housing and council tax benefits.
Source: HM Treasury
Impact of freezing Child Benefi t and increases to the Child Tax Credit
This Budget includes measures to reduce welfare spending, alongside A.20 other reforms to reduce the defi cit. Steps have been taken to protect low income families with children from the impact of these changes, by freezing the rate of Child Benefi t to partly fund above indexation increases to the Child Tax Credit. This ensures that the overall impact of all modelled Budget changes on child poverty in 2012-13 is statistically insignifi cant.8
Chart A5 shows the impact of holding rates of Child Benefi t constant A.21 and funding above indexation increases to the Child Tax Credit, as an absolute amount. In combination these measures have a progressive impact.
Chart A5: Impact of Child Benefit freeze and above indexation increase in ChildTax Credit in April 2012 in cash terms (£ a year), by income decile
-40
-20
0
20
40
100
120
AllTop(£49,700)
9(£38,400)
8(£32,200)
7(£27,900)
6(£24,500)
5(£21,600)
4(£19,200)
3(£16,900)
2(£14,200)
Bottom
Source: HM Treasury tax and benefit micro-simulation model.
Equivalised Net Income Decile (Lower Bound)
£ a year
60
80
Chart A6 shows that the pattern shown in Chart A5 above in absolute A.22 terms also holds in relative terms.
8 Estimates calculated using HM Treasury tax and benefi t micro-simulation model.
3742_03_Annex_A.indd 69 22/6/10 00:23:15
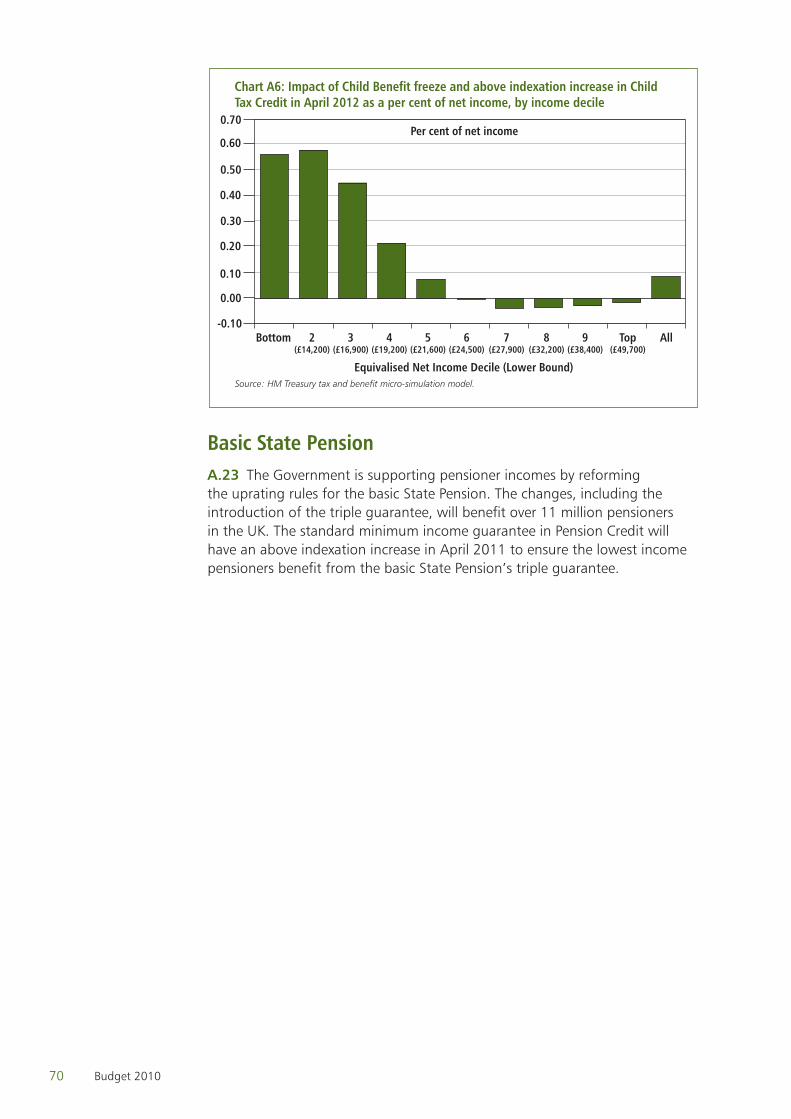
70 Budget 2010
Chart A6: Impact of Child Benefit freeze and above indexation increase in ChildTax Credit in April 2012 as a per cent of net income, by income decile
0.00
0.10
-0.10
0.20
0.30
0.40
0.50
0.60
0.70
AllTop(£49,700)
9(£38,400)
8(£32,200)
7(£27,900)
6(£24,500)
5(£21,600)
4(£19,200)
3(£16,900)
2(£14,200)
Bottom
Source: HM Treasury tax and benefit micro-simulation model.
Equivalised Net Income Decile (Lower Bound)
Per cent of net income
Basic State PensionThe Government is supporting pensioner incomes by reforming A.23
the uprating rules for the basic State Pension. The changes, including the introduction of the triple guarantee, will benefit over 11 million pensioners in the UK. The standard minimum income guarantee in Pension Credit will have an above indexation increase in April 2011 to ensure the lowest income pensioners benefit from the basic State Pension’s triple guarantee.
3742_03_Annex_A.indd 70 22/6/10 00:23:16
71Budget 2010
FinancingBDebt management objective
The Government’s debt management objective is:B.1
“to minimise, over the long term, the costs of meeting the Government’s financing needs, taking into account risk, whilst ensuring that debt management policy is consistent with the aims of monetary policy”.
The debt management policy objective is achieved by:B.2
pursuing an issuance policy that is open, transparent and predictable; •
issuing gilts that achieve a benchmark premium; •
adjusting the maturity and nature of the Government’s debt portfolio, •primarily by means of the maturity and composition of debt issuance and potentially by other market operations including switch auctions, conversion offers and buy-backs;
developing a liquid and efficient gilt market; and •
offering cost-effective savings instruments to the retail sector through •National Savings and Investments (NS&I).
HM Treasury has overall responsibility for meeting the debt management B.3 policy objective but has delegated operational responsibility for debt management to its agents:
the Debt Management Office (DMO) undertakes borrowing in sterling •through issuance of government bonds and short-term debt instruments in the wholesale market;
NS&I undertakes retail borrowing through sales of retail savings products; •and
the Bank of England undertakes borrowing in foreign currencies through •the issuance of foreign currency denominated government bonds.
Financing frameworkThe Government intends to continue to finance the central government B.4
net cash requirement (CGNCR) using the framework that was established in the 1995 Debt Management Review. The Government aims to finance its net cash requirement plus maturing debt and any financing required for additional net foreign currency reserves through the issuance of debt. All such debt issuance will take place within a set maturity structure. Auctions remain the primary means of gilt issuance but will be supported by a supplementary issuance programme comprising syndication and mini-tenders.
3742_04_Annex_B.indd 71 22/6/10 00:23:27
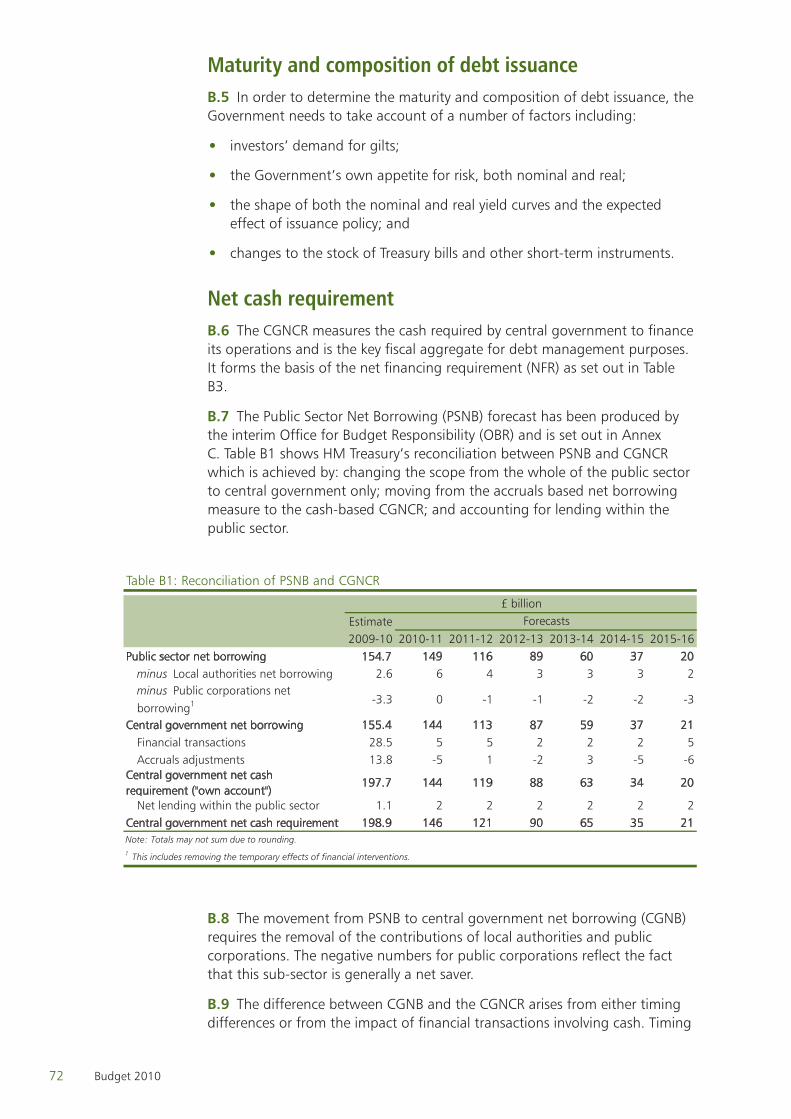
72 Budget 2010
Maturity and composition of debt issuanceIn order to determine the maturity and composition of debt issuance, the B.5
Government needs to take account of a number of factors including:
investors’ demand for gilts; •
the Government’s own appetite for risk, both nominal and real; •
the shape of both the nominal and real yield curves and the expected •effect of issuance policy; and
changes to the stock of Treasury bills and other short-term instruments. •
Net cash requirementThe CGNCR measures the cash required by central government to finance B.6
its operations and is the key fiscal aggregate for debt management purposes. It forms the basis of the net financing requirement (NFR) as set out in Table B3.
The Public Sector Net Borrowing (PSNB) forecast has been produced by B.7 the interim Office for Budget Responsibility (OBR) and is set out in Annex C. Table B1 shows HM Treasury’s reconciliation between PSNB and CGNCR which is achieved by: changing the scope from the whole of the public sector to central government only; moving from the accruals based net borrowing measure to the cash-based CGNCR; and accounting for lending within the public sector.
Estimate2009-10 2010-11 2011-12 2012-13 2013-14 2014-15 2015-16
Public sector net borrowing 154.7 149 116 89 60 37 20minus Local authorities net borrowing 2.6 6 4 3 3 3 2minus Public corporations net borrowing1 -3.3 0 -1 -1 -2 -2 -3
Central government net borrowing 155.4 144 113 87 59 37 21Financial transactions 28.5 5 5 2 2 2 5Accruals adjustments 13.8 -5 1 -2 3 -5 -6
Central government net cash requirement ("own account")
197.7 144 119 88 63 34 20
Net lending within the public sector 1.1 2 2 2 2 2 2Central government net cash requirement 198.9 146 121 90 65 35 21
1 This includes removing the temporary effects of financial interventions.
Forecasts£ billion
Note: Totals may not sum due to rounding.
Table B1: Reconciliation of PSNB and CGNCR
The movement from PSNB to central government net borrowing (CGNB) B.8 requires the removal of the contributions of local authorities and public corporations. The negative numbers for public corporations reflect the fact that this sub-sector is generally a net saver.
The difference between CGNB and the CGNCR arises from either timing B.9 differences or from the impact of financial transactions involving cash. Timing
3742_04_Annex_B.indd 72 22/6/10 00:23:27
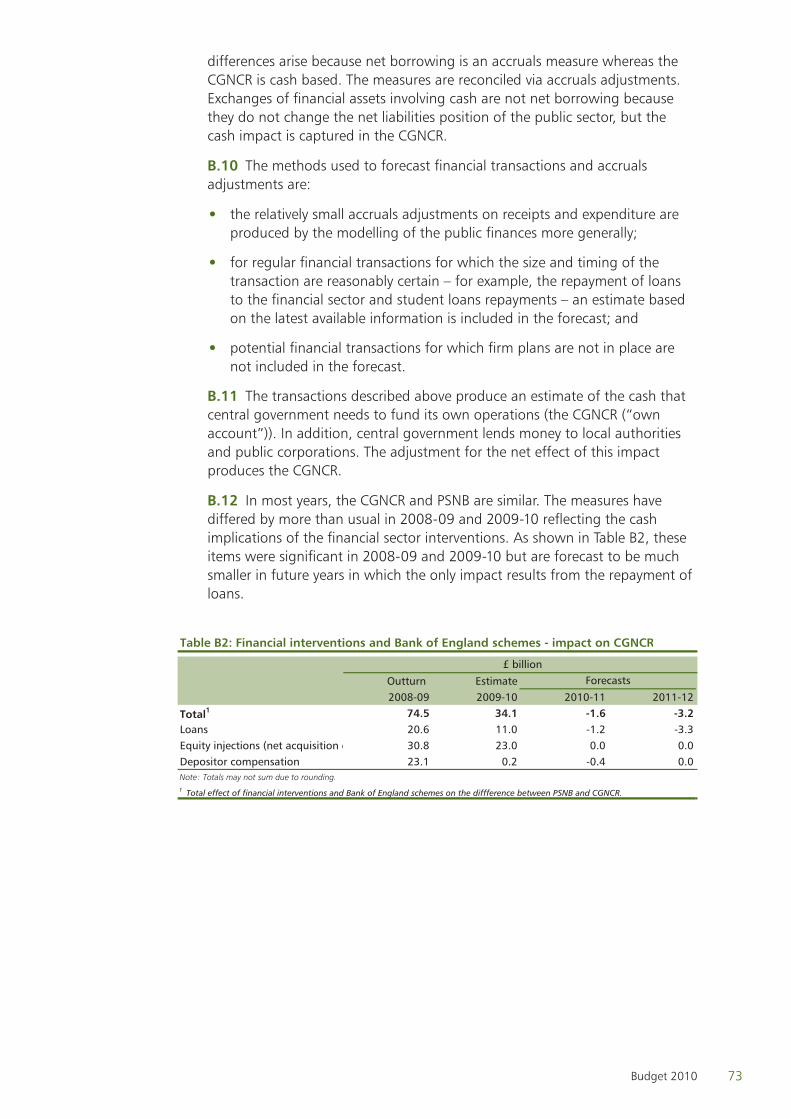
73Budget 2010
differences arise because net borrowing is an accruals measure whereas the CGNCR is cash based. The measures are reconciled via accruals adjustments. Exchanges of financial assets involving cash are not net borrowing because they do not change the net liabilities position of the public sector, but the cash impact is captured in the CGNCR.
The methods used to forecast financial transactions and accruals B.10 adjustments are:
the relatively small accruals adjustments on receipts and expenditure are •produced by the modelling of the public finances more generally;
for regular financial transactions for which the size and timing of the •transaction are reasonably certain – for example, the repayment of loans to the financial sector and student loans repayments – an estimate based on the latest available information is included in the forecast; and
potential financial transactions for which firm plans are not in place are •not included in the forecast.
The transactions described above produce an estimate of the cash that B.11 central government needs to fund its own operations (the CGNCR (“own account”)). In addition, central government lends money to local authorities and public corporations. The adjustment for the net effect of this impact produces the CGNCR.
In most years, the CGNCR and PSNB are similar. The measures have B.12 differed by more than usual in 2008-09 and 2009-10 reflecting the cash implications of the financial sector interventions. As shown in Table B2, these items were significant in 2008-09 and 2009-10 but are forecast to be much smaller in future years in which the only impact results from the repayment of loans.
Outturn Estimate2008-09 2009-10 2010-11 2011-12
Total1 74.5 34.1 -1.6 -3.2Loans 20.6 11.0 -1.2 -3.3Equity injections (net acquisition o 30.8 23.0 0.0 0.0Depositor compensation 23.1 0.2 -0.4 0.0
1 Total effect of financial interventions and Bank of England schemes on the diffference between PSNB and CGNCR.
Note: Totals may not sum due to rounding.
Table B2: Financial interventions and Bank of England schemes - impact on CGNCR
Forecasts£ billion
3742_04_Annex_B.indd 73 22/6/10 00:23:27
74 Budget 2010
Box B1 sets out an update of the costs of financial sector interventions.B.13
Box B1: Estimates of the costs of financial sector interventionsThe eventual direct fiscal cost from the support provided by the previous Government to the financial sector will be dependent on a number of factors including the eventual sale price achieved for the shares in Royal Bank of Scotland (RBS) and Lloyds Banking Group (LBG). It is possible to estimate the final cost on the basis of current market prices and, where these are not available, on an assessment of the fees and risks associated with each scheme. Using the latest market prices, the cost of the financial sector interventions, net of fees and other income, is estimated at £2 billion. This estimate is based on:
the current market value of the Government’s shareholdings in RBS •and LBG which implies a cost of £7 billion on these investments net of the value of the Dividend Access Share in RBS and fees received during the recapitalisation and for the provision of contingent capital;
the Asset Protection Agency’s central expectation that there will be •a net benefit to the taxpayer of at least £5 billion from the Asset Protection Scheme; and
the expectation that the aggregate costs of all other interventions •will not be material after fees, other income and recoveries are taken into account.
The estimate reflects the potential direct costs of the Government’s support provided to the financial sector and does not include the much more significant wider costs of the financial crisis to the economy as a whole.
Revisions to the Net Financing Requirement in 2010-11In line with the new fiscal forecasts set out in this Budget, the financing B.14
arithmetic for 2010-11 has been revised. There has been a reduction in the NFR of £20.2 billion – from £182.7 billion, in the revision to financing announced on 22 April 2010, to £162.5 billion. The reduction in the NFR is the net effect of:
a decrease in the CGNCR of £20.3 billion from the March Budget 2010 •forecast which includes a fall in PSNB of £14 billion; and
£0.1 billion of buybacks. •
NS&I is not forecast to make a contribution to net financing; this B.15 forecast is unchanged from the projection in the revision announced on 22 April 2010.
In order to meet the reduction in the NFR, the DMO’s remit has been B.16 revised. The revisions to financing are shown in Table B3.
3742_04_Annex_B.indd 74 22/6/10 00:23:27
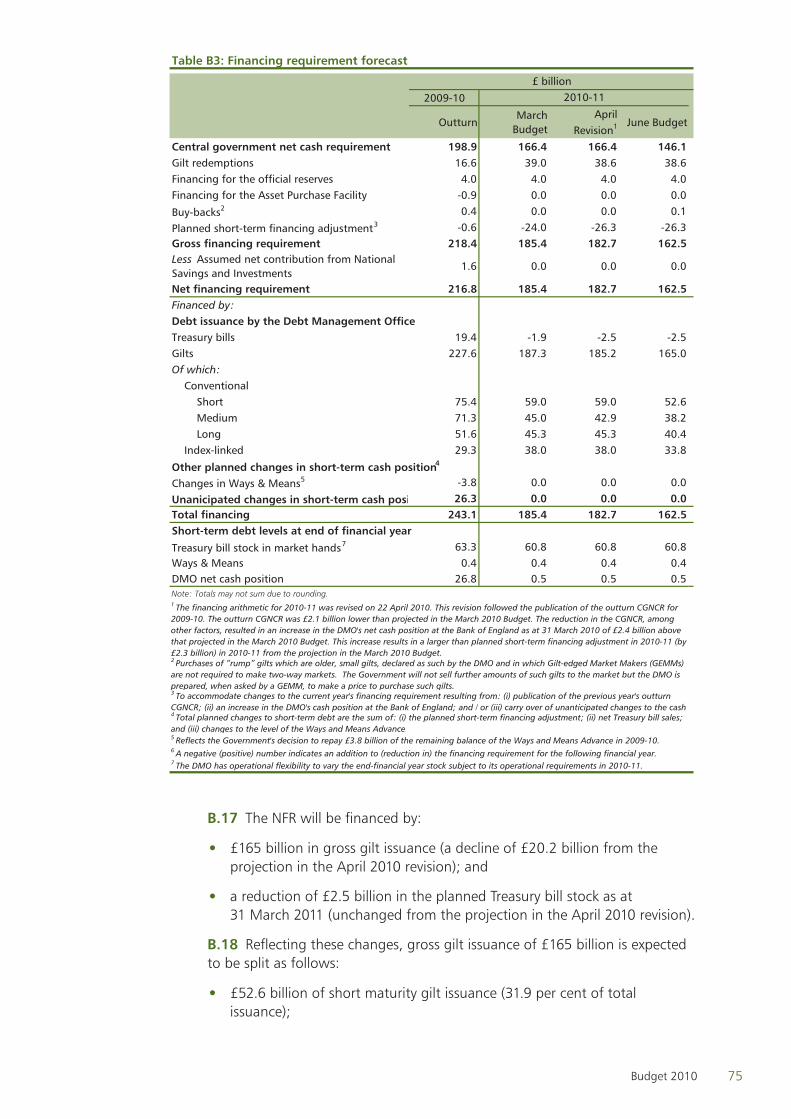
75Budget 2010
Table B3: Financing requirement forecast
2009-10
OutturnMarch
BudgetApril
Revision1 June Budget
Central government net cash requirement 198.9 166.4 166.4 146.1Gilt redemptions 16.6 39.0 38.6 38.6Financing for the official reserves 4.0 4.0 4.0 4.0Financing for the Asset Purchase Facility -0.9 0.0 0.0 0.0
Buy-backs2 0.4 0.0 0.0 0.1
Planned short-term financing adjustment3 -0.6 -24.0 -26.3 -26.3Gross financing requirement 218.4 185.4 182.7 162.5Less Assumed net contribution from National Savings and Investments
1.6 0.0 0.0 0.0
Net financing requirement 216.8 185.4 182.7 162.5Financed by:Debt issuance by the Debt Management OfficeTreasury bills 19.4 -1.9 -2.5 -2.5Gilts 227.6 187.3 185.2 165.0Of which: Conventional Short 75.4 59.0 59.0 52.6 Medium 71.3 45.0 42.9 38.2 Long 51.6 45.3 45.3 40.4 Index-linked 29.3 38.0 38.0 33.8
Other planned changes in short-term cash position4
Changes in Ways & Means5 -3.8 0.0 0.0 0.0
Unanicipated changes in short-term cash posi 26.3 0.0 0.0 0.0Total financing 243.1 185.4 182.7 162.5Short-term debt levels at end of financial year
Treasury bill stock in market hands7 63.3 60.8 60.8 60.8Ways & Means 0.4 0.4 0.4 0.4DMO net cash position 26.8 0.5 0.5 0.5
£ billion2010-11
5 Reflects the Government's decision to repay £3.8 billion of the remaining balance of the Ways and Means Advance in 2009-10.
Note: Totals may not sum due to rounding.
6 A negative (positive) number indicates an addition to (reduction in) the financing requirement for the following financial year.7 The DMO has operational flexibility to vary the end-financial year stock subject to its operational requirements in 2010-11.
1 The financing arithmetic for 2010-11 was revised on 22 April 2010. This revision followed the publication of the outturn CGNCR for 2009-10. The outturn CGNCR was £2.1 billion lower than projected in the March 2010 Budget. The reduction in the CGNCR, among other factors, resulted in an increase in the DMO's net cash position at the Bank of England as at 31 March 2010 of £2.4 billion above that projected in the March 2010 Budget. This increase results in a larger than planned short-term financing adjustment in 2010-11 (by £2.3 billion) in 2010-11 from the projection in the March 2010 Budget.2 Purchases of “rump” gilts which are older, small gilts, declared as such by the DMO and in which Gilt-edged Market Makers (GEMMs) are not required to make two-way markets. The Government will not sell further amounts of such gilts to the market but the DMO is prepared, when asked by a GEMM, to make a price to purchase such gilts.3 To accommodate changes to the current year's financing requirement resulting from: (i) publication of the previous year's outturn CGNCR; (ii) an increase in the DMO's cash position at the Bank of England; and / or (iii) carry over of unanticipated changes to the cash4 Total planned changes to short-term debt are the sum of: (i) the planned short-term financing adjustment; (ii) net Treasury bill sales; and (iii) changes to the level of the Ways and Means Advance.
The NFR will be financed by:B.17
£165 billion in gross gilt issuance (a decline of £20.2 billion from the •projection in the April 2010 revision); and
a reduction of £2.5 billion in the planned Treasury bill stock as at •31 March 2011 (unchanged from the projection in the April 2010 revision).
Reflecting these changes, gross gilt issuance of £165 billion is expected B.18 to be split as follows:
£52.6 billion of short maturity gilt issuance (31.9 per cent of total •issuance);
3742_04_Annex_B.indd 75 22/6/10 00:23:27
76 Budget 2010
£38.2 billion of medium maturity gilt issuance (23.2 per cent of total •issuance);
£40.4 billion of long maturity gilt issuance (24.5 per cent of total •issuance); and
£33.8 billion of index-linked gilt issuance (20.5 per cent of total issuance). •
The proportionate split of gross gilt issuance between gilts of different B.19 maturities and types takes into account the factors in paragraph B.5 and is unchanged from that in the April 2010 revision. As at 31 March 2010, the average maturity of the outstanding debt stock was 13.2 years. The maturity of the outstanding debt stock in the UK is the longest in the G7.
Auctions will remain the Government’s primary method by which to B.20 issue gilts. The Government will continue to use supplementary methods – syndication, mini-tenders and the post auction ‘top up’ facility – to issue gilts in the remainder of 2010-11. It is anticipated that, for the year as a whole:
£132 billion (80 per cent of total issuance) will be issued through pre- •announced auctions;
£26 billion (16 per cent of total issuance) will be issued by syndication; and •
£7 billion (4 per cent of total issuance) will be issued through mini- •tenders.
The proportionate split of gilt issuance by method of issuance is broadly B.21 unchanged from the revision to financing announced 22 April 2010. These revisions will be implemented in the third and fourth quarters of 2010-11. Further details can be found in the DMO’s Press Notice issued on 22 June 2010 which is available on the DMO’s website: www.dmo.gov.uk.
3742_04_Annex_B.indd 76 22/6/10 00:23:27
Budget forecastJune 2010
3742_05a_OBR cover 1 22/6/10 00:23:49

3742_05a_OBR cover 2 22/6/10 00:23:49
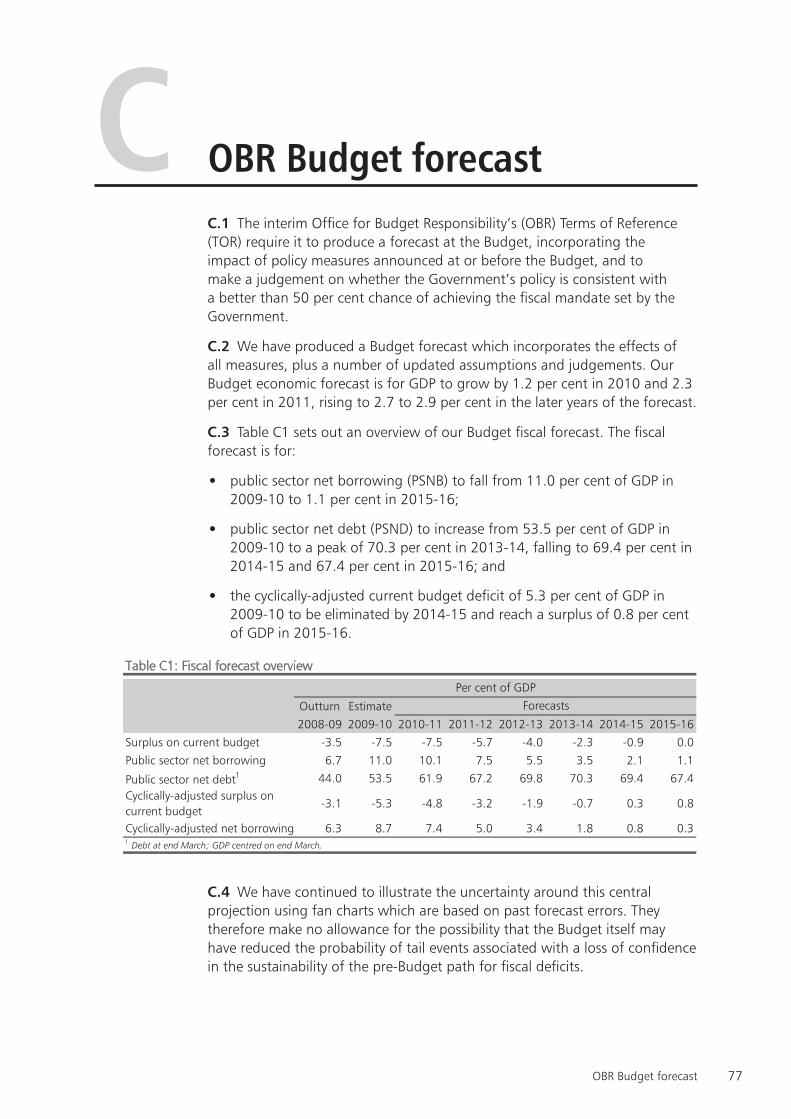
77OBR Budget forecast
OBR Budget forecastCThe interim Office for Budget Responsibility’s (OBR) Terms of Reference C.1
(TOR) require it to produce a forecast at the Budget, incorporating the impact of policy measures announced at or before the Budget, and to make a judgement on whether the Government’s policy is consistent with a better than 50 per cent chance of achieving the fiscal mandate set by the Government.
We have produced a Budget forecast which incorporates the effects of C.2 all measures, plus a number of updated assumptions and judgements. Our Budget economic forecast is for GDP to grow by 1.2 per cent in 2010 and 2.3 per cent in 2011, rising to 2.7 to 2.9 per cent in the later years of the forecast.
Table C1 sets out an overview of our Budget fiscal forecast. The fiscal C.3 forecast is for:
public sector net borrowing (PSNB) to fall from 11.0 per cent of GDP in •2009-10 to 1.1 per cent in 2015-16;
public sector net debt (PSND) to increase from 53.5 per cent of GDP in •2009-10 to a peak of 70.3 per cent in 2013-14, falling to 69.4 per cent in 2014-15 and 67.4 per cent in 2015-16; and
the cyclically-adjusted current budget deficit of 5.3 per cent of GDP in •2009-10 to be eliminated by 2014-15 and reach a surplus of 0.8 per cent of GDP in 2015-16.
Table C1: Fiscal forecast overview
Outturn Estimate
2008-09 2009-10 2010-11 2011-12 2012-13 2013-14 2014-15 2015-16
Surplus on current budget -3.5 -7.5 -7.5 -5.7 -4.0 -2.3 -0.9 0.0
Public sector net borrowing 6.7 11.0 10.1 7.5 5.5 3.5 2.1 1.1
Public sector net debt1 44.0 53.5 61.9 67.2 69.8 70.3 69.4 67.4Cyclically-adjusted surplus on current budget
-3.1 -5.3 -4.8 -3.2 -1.9 -0.7 0.3 0.8
Cyclically-adjusted net borrowing 6.3 8.7 7.4 5.0 3.4 1.8 0.8 0.31 Debt at end March; GDP centred on end March.
Forecasts
Per cent of GDP
We have continued to illustrate the uncertainty around this central C.4 projection using fan charts which are based on past forecast errors. They therefore make no allowance for the possibility that the Budget itself may have reduced the probability of tail events associated with a loss of confidence in the sustainability of the pre-Budget path for fiscal deficits.
3742_05b_Annex_C.indd 77 22/6/10 00:24:02
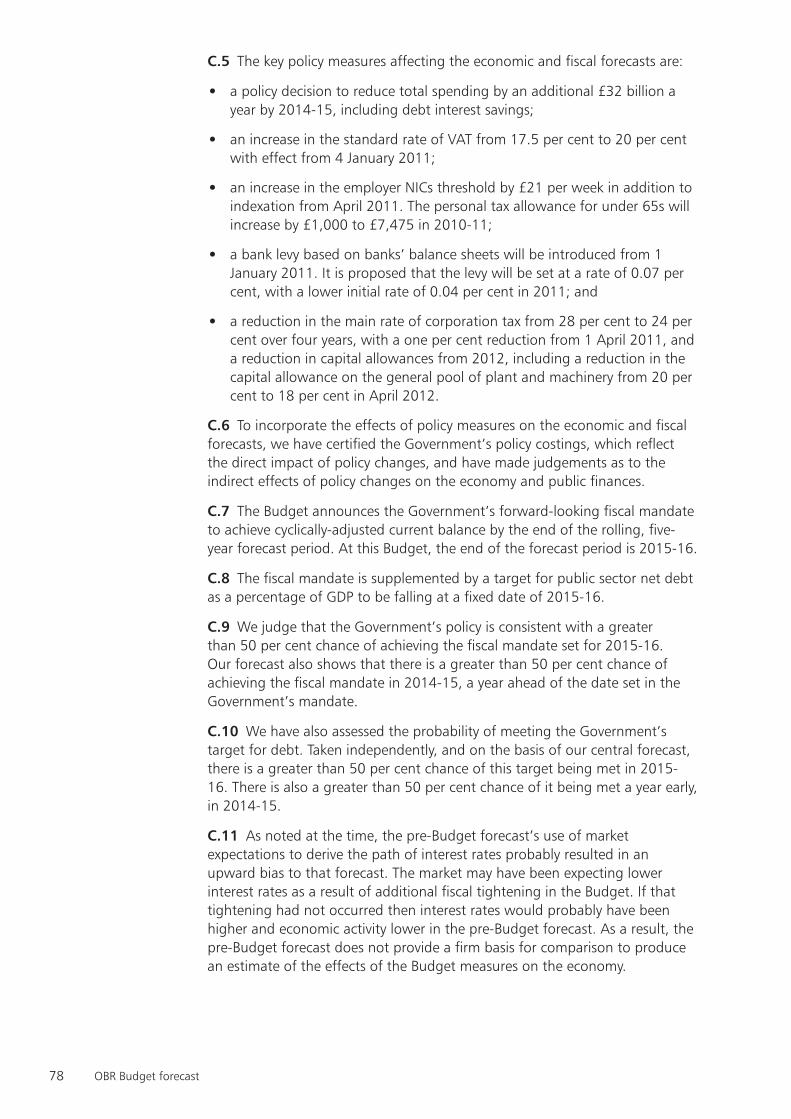
78 OBR Budget forecast
The key policy measures affecting the economic and fiscal forecasts are:C.5
a policy decision to reduce total spending by an additional £32 billion a •year by 2014-15, including debt interest savings;
an increase in the standard rate of VAT from 17.5 per cent to 20 per cent •with effect from 4 January 2011;
an increase in the employer NICs threshold by £21 per week in addition to •indexation from April 2011. The personal tax allowance for under 65s will increase by £1,000 to £7,475 in 2010-11;
a bank levy based on banks’ balance sheets will be introduced from 1 •January 2011. It is proposed that the levy will be set at a rate of 0.07 per cent, with a lower initial rate of 0.04 per cent in 2011; and
a reduction in the main rate of corporation tax from 28 per cent to 24 per •cent over four years, with a one per cent reduction from 1 April 2011, and a reduction in capital allowances from 2012, including a reduction in the capital allowance on the general pool of plant and machinery from 20 per cent to 18 per cent in April 2012.
To incorporate the effects of policy measures on the economic and fiscal C.6 forecasts, we have certified the Government’s policy costings, which reflect the direct impact of policy changes, and have made judgements as to the indirect effects of policy changes on the economy and public finances.
The Budget announces the Government’s forward-looking fiscal mandate C.7 to achieve cyclically-adjusted current balance by the end of the rolling, five-year forecast period. At this Budget, the end of the forecast period is 2015-16.
The fiscal mandate is supplemented by a target for public sector net debt C.8 as a percentage of GDP to be falling at a fixed date of 2015-16.
We judge that the Government’s policy is consistent with a greater C.9 than 50 per cent chance of achieving the fiscal mandate set for 2015-16. Our forecast also shows that there is a greater than 50 per cent chance of achieving the fiscal mandate in 2014-15, a year ahead of the date set in the Government’s mandate.
We have also assessed the probability of meeting the Government’s C.10 target for debt. Taken independently, and on the basis of our central forecast, there is a greater than 50 per cent chance of this target being met in 2015-16. There is also a greater than 50 per cent chance of it being met a year early, in 2014-15.
As noted at the time, the pre-Budget forecast’s use of market C.11 expectations to derive the path of interest rates probably resulted in an upward bias to that forecast. The market may have been expecting lower interest rates as a result of additional fiscal tightening in the Budget. If that tightening had not occurred then interest rates would probably have been higher and economic activity lower in the pre-Budget forecast. As a result, the pre-Budget forecast does not provide a firm basis for comparison to produce an estimate of the effects of the Budget measures on the economy.
3742_05b_Annex_C.indd 78 22/6/10 00:24:02
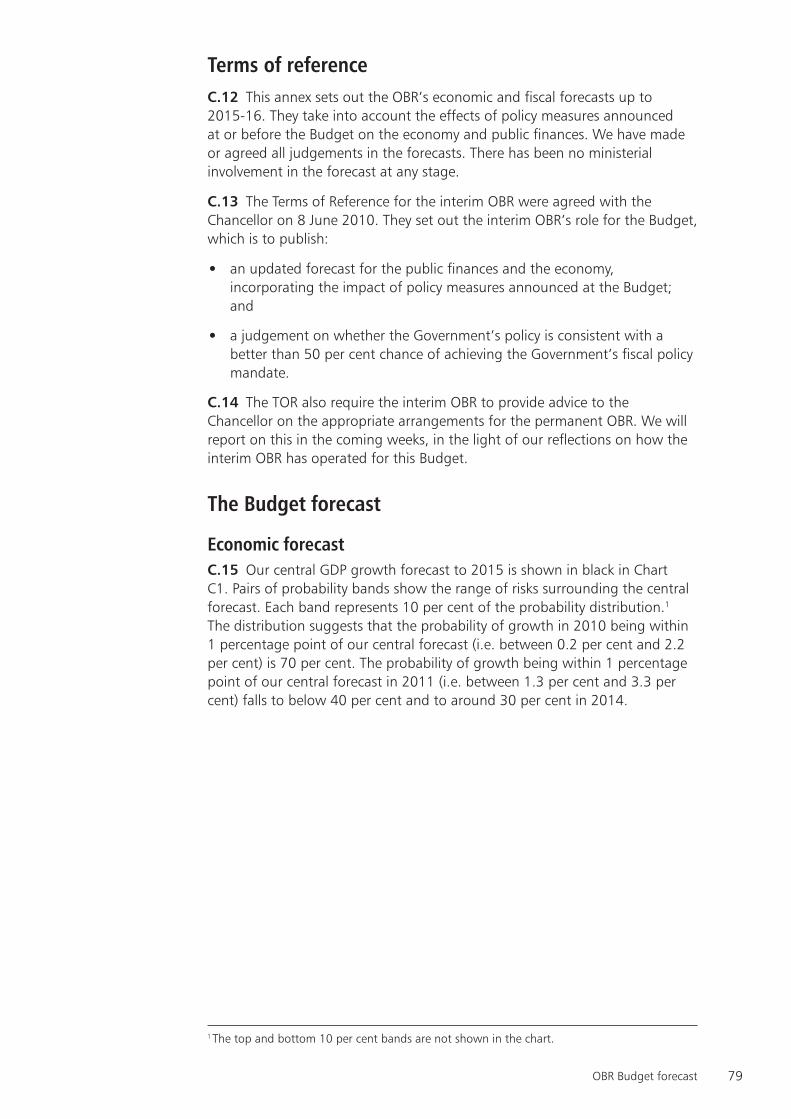
79OBR Budget forecast
Terms of referenceThis annex sets out the OBR’s economic and fiscal forecasts up to C.12
2015-16. They take into account the effects of policy measures announced at or before the Budget on the economy and public finances. We have made or agreed all judgements in the forecasts. There has been no ministerial involvement in the forecast at any stage.
The Terms of Reference for the interim OBR were agreed with the C.13 Chancellor on 8 June 2010. They set out the interim OBR’s role for the Budget, which is to publish:
an updated forecast for the public finances and the economy, •incorporating the impact of policy measures announced at the Budget; and
a judgement on whether the Government’s policy is consistent with a •better than 50 per cent chance of achieving the Government’s fiscal policy mandate.
The TOR also require the interim OBR to provide advice to the C.14 Chancellor on the appropriate arrangements for the permanent OBR. We will report on this in the coming weeks, in the light of our reflections on how the interim OBR has operated for this Budget.
The Budget forecast
Economic forecastOur central GDP growth forecast to 2015 is shown in black in Chart C.15
C1. Pairs of probability bands show the range of risks surrounding the central forecast. Each band represents 10 per cent of the probability distribution.1 The distribution suggests that the probability of growth in 2010 being within 1 percentage point of our central forecast (i.e. between 0.2 per cent and 2.2 per cent) is 70 per cent. The probability of growth being within 1 percentage point of our central forecast in 2011 (i.e. between 1.3 per cent and 3.3 per cent) falls to below 40 per cent and to around 30 per cent in 2014.
1 The top and bottom 10 per cent bands are not shown in the chart.
3742_05b_Annex_C.indd 79 22/6/10 00:24:02
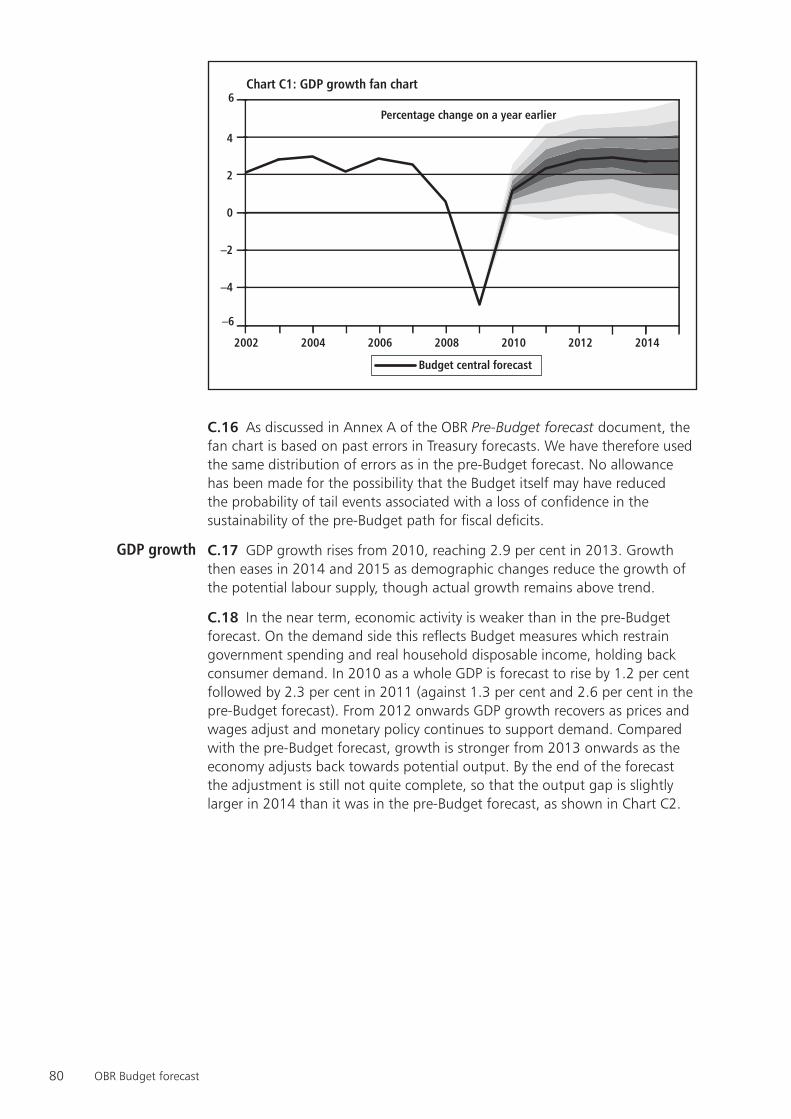
80 OBR Budget forecast
Chart C1: GDP growth fan chart
–6
–4
–2
0
2
4
6
2002 201420122010200820062004
Percentage change on a year earlier
Budget central forecast
As discussed in Annex A of the OBR C.16 Pre-Budget forecast document, the fan chart is based on past errors in Treasury forecasts. We have therefore used the same distribution of errors as in the pre-Budget forecast. No allowance has been made for the possibility that the Budget itself may have reduced the probability of tail events associated with a loss of confidence in the sustainability of the pre-Budget path for fiscal deficits.
C.17 GDP growth rises from 2010, reaching 2.9 per cent in 2013. Growth then eases in 2014 and 2015 as demographic changes reduce the growth of the potential labour supply, though actual growth remains above trend.
In the near term, economic activity is weaker than in the pre-Budget C.18 forecast. On the demand side this reflects Budget measures which restrain government spending and real household disposable income, holding back consumer demand. In 2010 as a whole GDP is forecast to rise by 1.2 per cent followed by 2.3 per cent in 2011 (against 1.3 per cent and 2.6 per cent in the pre-Budget forecast). From 2012 onwards GDP growth recovers as prices and wages adjust and monetary policy continues to support demand. Compared with the pre-Budget forecast, growth is stronger from 2013 onwards as the economy adjusts back towards potential output. By the end of the forecast the adjustment is still not quite complete, so that the output gap is slightly larger in 2014 than it was in the pre-Budget forecast, as shown in Chart C2.
GDP growth
3742_05b_Annex_C.indd 80 22/6/10 00:24:02
81OBR Budget forecast
Chart C2: The output gap1
June Budget forecastJune pre-Budget forecast March Budget forecast
1Output gap estimates on a quarterly basis, based on the latest National Accounts data and expressed as actualoutput less trend output as a percentage of trend output (non-oil basis).
Per cent Forecasts
-8
-6
-4
-2
0
2
4
6
2015201020052000199519901985198019751970196519601955
C.19 CPI inflation stays around 3 per cent in the near term. It then declines more gradually than in the pre-Budget forecast because of the rise in the standard rate of VAT to 20 per cent in January 2011 and the higher oil price assumed in the Budget forecast. Once the short-term effects of the VAT increase have passed through, the larger output gap and cuts in public spending place downward pressure on inflation in line with the pre-Budget forecast. CPI inflation falls back to a little under 2 per cent in early 2012 and then settles at the 2 per cent target over the medium term, as shown in Chart C3.
Chart C3: CPI1
0
1
2
3
4
5
6
7
8
9
10
1Outturns until 2010Q1; forecast for every second quarter from 2010Q2 to 2015Q4.
pre-Budget forecastBudget forecast
ForecastsPercentage change on a year earlier
1989 1991 1993 1995 1997 1999 2001 2003 2005 2007 2009 2011 2013 2015
Inflation
3742_05b_Annex_C.indd 81 22/6/10 00:24:02
82 OBR Budget forecast
C.20 The decline in employment appears to be coming to an end and we expect a modest recovery in employment in the second half of 2010. Even so, for 2010 as a whole employment is around ½ per cent lower than in 2009. From 2011, as GDP growth gathers momentum and demographic factors boost the population of working age, employment rises more rapidly, reaching 30 million by 2015. In the near term the increase in employment is not enough to offset the rise in the population of working age with the result that the ILO unemployment rate continues to rise, reaching a peak of 8.1 per cent by the end of the year. Thereafter, the more rapid increase in employment is sufficient to lower unemployment, so that the ILO unemployment rate falls to 6 per cent in 2015. Claimant count unemployment continues to fall throughout the forecast period.
A simple comparison of the two forecasts would show that C.21 unemployment is higher, and employment lower, than in the pre-Budget forecast. The differences in the ILO unemployment rate are small initially, reaching a peak of 0.2 percentage points in 2013 before narrowing slightly.
C.22 Wages and salaries growth rises gradually throughout the forecast, reaching 5½ percent in 2014. Consumption growth rises in the forecast to rates of over 2 per cent from 2013, but it remains below the rate of growth of GDP.
Nominal household disposable incomes are lower than in the pre-C.23 Budget forecast. There are positive effects from the personal allowance and NICs threshold changes. But there are offsetting effects, primarily from lower labour income as a result of tightening measures, and reduced transfers. The direct effect on incomes is partially offset by a decline in saving: while the saving ratio remained in a narrow 7¼-7½ per cent range in the pre-Budget forecast, it falls to 5½ per cent by 2015 in the Budget forecast. The level of real consumption is weaker than in the pre-Budget forecast, particularly in 2011 and 2012, as lower household incomes and the rise in VAT reduce household demand.
C.24 Business investment is forecast to pick up during 2010, though in the year as a whole it rises by only 1½ per cent. The recovery is maintained in 2011, although it takes until 2013 before investment returns to its pre-recession peak. From 2011 onwards business investment rises at rates between 8 and 11 per cent.
The measures to reform corporation tax, which are estimated to reduce C.25 the cost of capital faced by firms by about 3 per cent, should have a positive effect on investment. The introduction of the bank levy may partially offset the fall in the cost of capital should banks pass on some or all of the levy in the form of a higher cost of corporate finance. Even this partial offset is likely to be moderated to the extent that the levy is reflected in lower bank profits and remuneration.
Business investment growth is higher than in the pre-Budget forecast as C.26 the boost from the lower cost of capital feeds through. Business investment also strengthens as resources released from the government sector flow into the private sector. The level of business investment is around 1 per cent higher in 2014 than in the pre-Budget forecast.
Labour market
Households
Companies
3742_05b_Annex_C.indd 82 22/6/10 00:24:02
83OBR Budget forecast
Firms are expected to absorb some of the rise in VAT through lower C.27 profit margins and not to pass through the full increase to consumers. As a result, company profits as a share of GDP are lower, by 0.4 percentage points in 2014, than in the pre-Budget forecast.
C.28 Net trade is forecast to subtract from growth in 2010, as relatively robust import growth outweighs still-sluggish exports. As the recovery in UK export markets strengthens and sterling’s past depreciation boosts UK export volumes, net trade is forecast to contribute positively to growth.
The lower overall level of domestic demand in the Budget forecast feeds C.29 through to imports, which are about ½ per cent lower by 2014 than in the pre-Budget forecast. The reduction in imports is slightly less than in domestic demand as a result of the composition of the Budget – business investment (which has a relatively high import content) is higher while public spending (which has a low import content) is reduced.
The depreciation of sterling has boosted exporters’ profits as firms have C.30 not passed all of the fall in sterling through to prices. This should encourage existing firms to strive to increase exports and new firms to enter the UK export market and export volumes to rise as a result. The corporate tax measures and release of resources from the government sector should support this supply-side response. By 2014 the volume of exports is about ¾ per cent higher than in the pre-Budget forecast.
The combination of stronger export and weaker import volumes has a C.31 positive effect on the non-oil trade balance. There is a partial offset from the oil account since the Budget forecast is based on a higher oil price than the pre-Budget forecast. Overall, the trade deficit narrows by around £35 billion over the forecast period. The reduction in the current account deficit is rather smaller but it still falls from over £25 billion in 2010 to near-balance in 2015 (that is, from 1¾ per cent of GDP to near zero). The current account deficit is about ¼ per cent of GDP lower than in the pre-Budget forecast in 2014.
External sector
3742_05b_Annex_C.indd 83 22/6/10 00:24:02
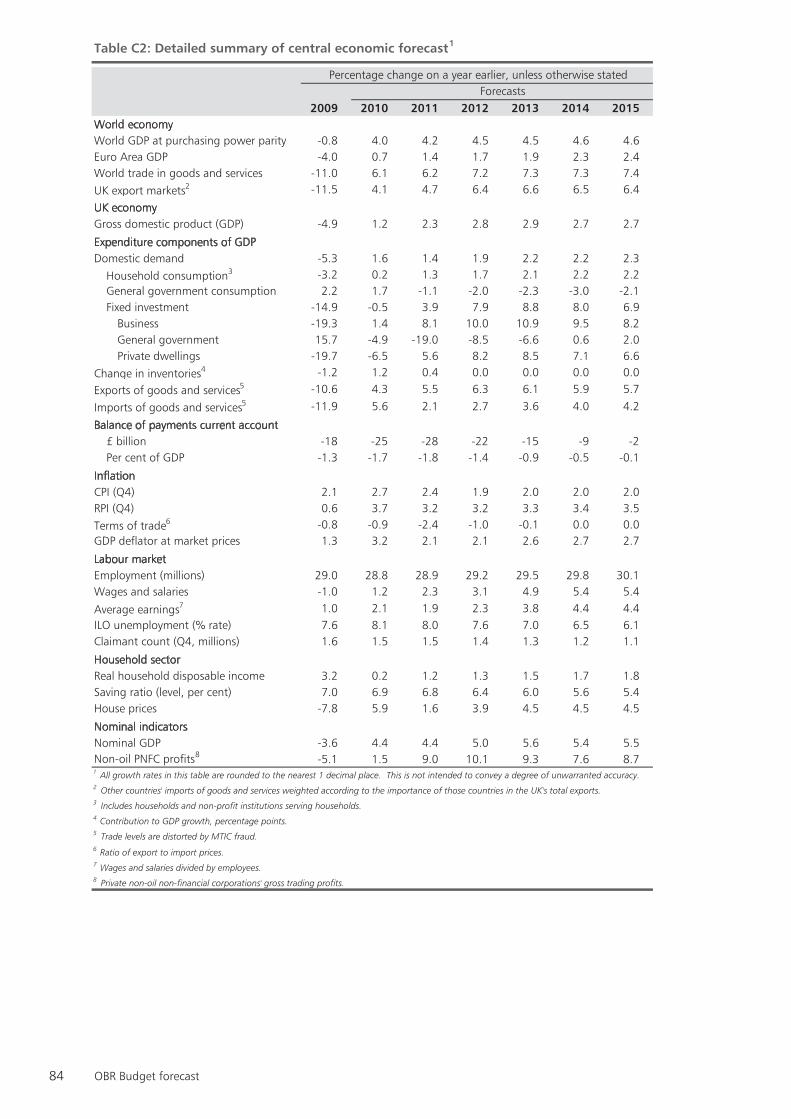
84 OBR Budget forecast
Table C2: Detailed summary of central economic forecast1
2009 2010 2011 2012 2013 2014 2015World economyWorld GDP at purchasing power parity -0.8 4.0 4.2 4.5 4.5 4.6 4.6Euro Area GDP -4.0 0.7 1.4 1.7 1.9 2.3 2.4World trade in goods and services -11.0 6.1 6.2 7.2 7.3 7.3 7.4UK export markets2 -11.5 4.1 4.7 6.4 6.6 6.5 6.4
UK economyGross domestic product (GDP) -4.9 1.2 2.3 2.8 2.9 2.7 2.7
Expenditure components of GDP Domestic demand -5.3 1.6 1.4 1.9 2.2 2.2 2.3
Household consumption3 -3.2 0.2 1.3 1.7 2.1 2.2 2.2General government consumption 2.2 1.7 -1.1 -2.0 -2.3 -3.0 -2.1Fixed investment -14.9 -0.5 3.9 7.9 8.8 8.0 6.9
Business -19.3 1.4 8.1 10.0 10.9 9.5 8.2General government 15.7 -4.9 -19.0 -8.5 -6.6 0.6 2.0Private dwellings -19.7 -6.5 5.6 8.2 8.5 7.1 6.6
Change in inventories4 -1.2 1.2 0.4 0.0 0.0 0.0 0.0
Exports of goods and services5 -10.6 4.3 5.5 6.3 6.1 5.9 5.7
Imports of goods and services5 -11.9 5.6 2.1 2.7 3.6 4.0 4.2
Balance of payments current account£ billion -18 -25 -28 -22 -15 -9 -2Per cent of GDP -1.3 -1.7 -1.8 -1.4 -0.9 -0.5 -0.1
InflationCPI (Q4) 2.1 2.7 2.4 1.9 2.0 2.0 2.0RPI (Q4) 0.6 3.7 3.2 3.2 3.3 3.4 3.5Terms of trade6 -0.8 -0.9 -2.4 -1.0 -0.1 0.0 0.0GDP deflator at market prices 1.3 3.2 2.1 2.1 2.6 2.7 2.7
Labour marketEmployment (millions) 29.0 28.8 28.9 29.2 29.5 29.8 30.1Wages and salaries -1.0 1.2 2.3 3.1 4.9 5.4 5.4
Average earnings7 1.0 2.1 1.9 2.3 3.8 4.4 4.4ILO unemployment (% rate) 7.6 8.1 8.0 7.6 7.0 6.5 6.1Claimant count (Q4, millions) 1.6 1.5 1.5 1.4 1.3 1.2 1.1
Household sectorReal household disposable income 3.2 0.2 1.2 1.3 1.5 1.7 1.8Saving ratio (level, per cent) 7.0 6.9 6.8 6.4 6.0 5.6 5.4House prices -7.8 5.9 1.6 3.9 4.5 4.5 4.5
Nominal indicatorsNominal GDP -3.6 4.4 4.4 5.0 5.6 5.4 5.5Non-oil PNFC profits8 -5.1 1.5 9.0 10.1 9.3 7.6 8.7
6 Ratio of export to import prices.7 Wages and salaries divided by employees.8 Private non-oil non-financial corporations' gross trading profits.
Forecasts
2 Other countries' imports of goods and services weighted according to the importance of those countries in the UK's total exports.
1 All growth rates in this table are rounded to the nearest 1 decimal place. This is not intended to convey a degree of unwarranted accuracy.
Percentage change on a year earlier, unless otherwise stated
3 Includes households and non-profit institutions serving households.4 Contribution to GDP growth, percentage points.5 Trade levels are distorted by MTIC fraud.
3742_05b_Annex_C.indd 84 22/6/10 00:24:03
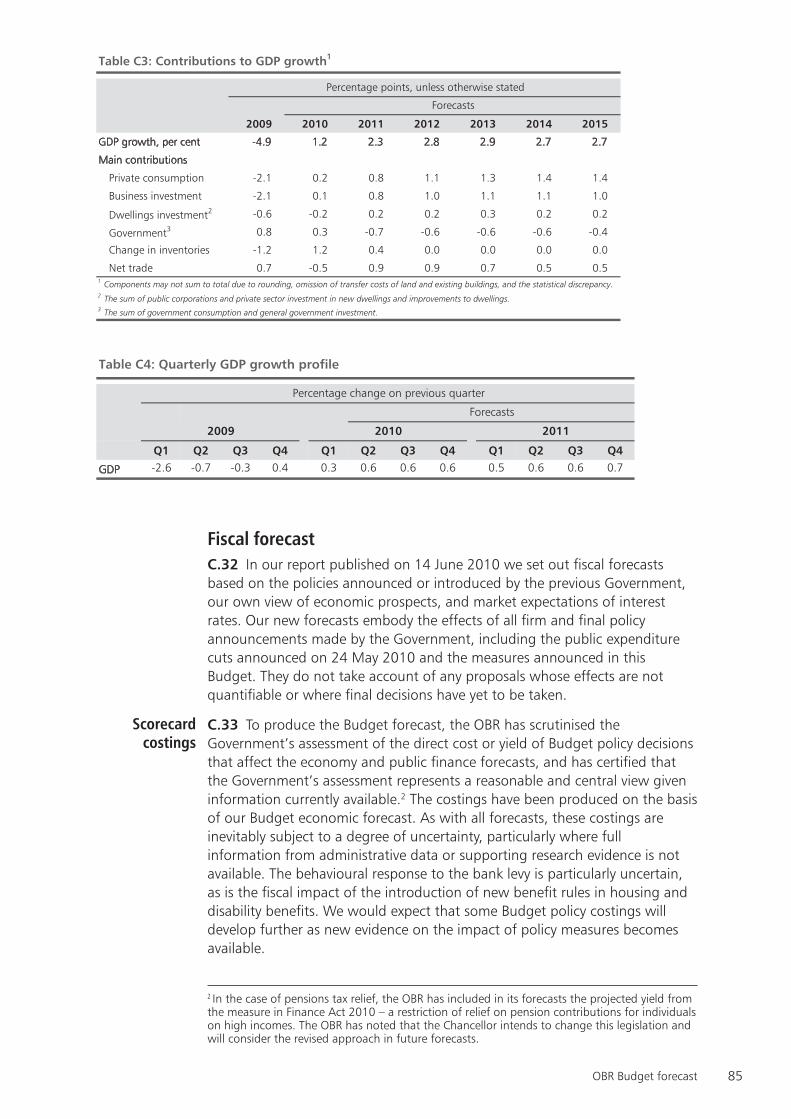
85OBR Budget forecast
Table C3: Contributions to GDP growth1
2009 2010 2011 2012 2013 2014 2015
GDP growth, per cent -4.9 1.2 2.3 2.8 2.9 2.7 2.7
Main contributions
Private consumption -2.1 0.2 0.8 1.1 1.3 1.4 1.4
Business investment -2.1 0.1 0.8 1.0 1.1 1.1 1.0
Dwellings investment2 -0.6 -0.2 0.2 0.2 0.3 0.2 0.2
Government3 0.8 0.3 -0.7 -0.6 -0.6 -0.6 -0.4
Change in inventories -1.2 1.2 0.4 0.0 0.0 0.0 0.0
Net trade 0.7 -0.5 0.9 0.9 0.7 0.5 0.5
3 The sum of government consumption and general government investment.
2 The sum of public corporations and private sector investment in new dwellings and improvements to dwellings.
Forecasts
Percentage points, unless otherwise stated
1 Components may not sum to total due to rounding, omission of transfer costs of land and existing buildings, and the statistical discrepancy.
Table C4: Quarterly GDP growth profile
Q1 Q2 Q3 Q4 Q1 Q2 Q3 Q4 Q1 Q2 Q3 Q4
GDP -2.6 -0.7 -0.3 0.4 0.3 0.6 0.6 0.6 0.5 0.6 0.6 0.7
2011
Percentage change on previous quarter
2009 2010
Forecasts
Fiscal forecastIn our report published on 14 June 2010 we set out fiscal forecasts C.32
based on the policies announced or introduced by the previous Government, our own view of economic prospects, and market expectations of interest rates. Our new forecasts embody the effects of all firm and final policy announcements made by the Government, including the public expenditure cuts announced on 24 May 2010 and the measures announced in this Budget. They do not take account of any proposals whose effects are not quantifiable or where final decisions have yet to be taken.
C.33 To produce the Budget forecast, the OBR has scrutinised the Government’s assessment of the direct cost or yield of Budget policy decisions that affect the economy and public finance forecasts, and has certified that the Government’s assessment represents a reasonable and central view given information currently available.2 The costings have been produced on the basis of our Budget economic forecast. As with all forecasts, these costings are inevitably subject to a degree of uncertainty, particularly where full information from administrative data or supporting research evidence is not available. The behavioural response to the bank levy is particularly uncertain, as is the fiscal impact of the introduction of new benefit rules in housing and disability benefits. We would expect that some Budget policy costings will develop further as new evidence on the impact of policy measures becomes available.
2 In the case of pensions tax relief, the OBR has included in its forecasts the projected yield from the measure in Finance Act 2010 – a restriction of relief on pension contributions for individuals on high incomes. The OBR has noted that the Chancellor intends to change this legislation and will consider the revised approach in future forecasts.
Scorecard costings
3742_05b_Annex_C.indd 85 22/6/10 00:24:03
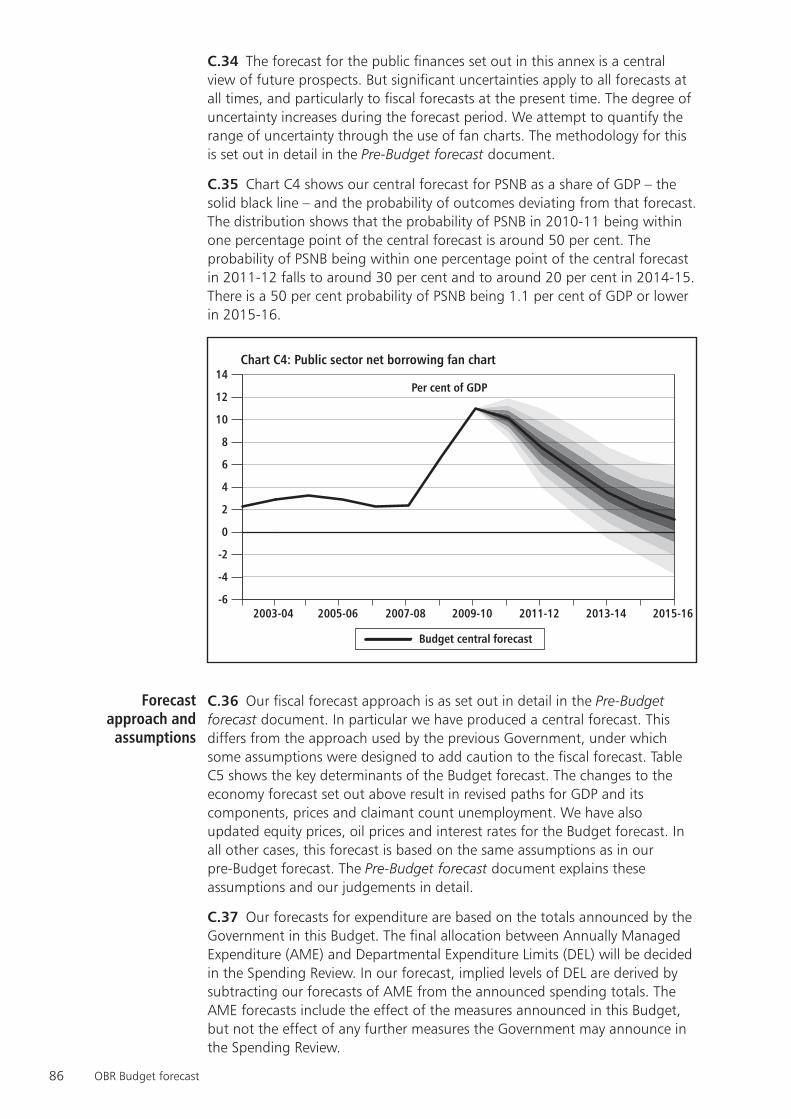
86 OBR Budget forecast
The forecast for the public finances set out in this annex is a central C.34 view of future prospects. But significant uncertainties apply to all forecasts at all times, and particularly to fiscal forecasts at the present time. The degree of uncertainty increases during the forecast period. We attempt to quantify the range of uncertainty through the use of fan charts. The methodology for this is set out in detail in the Pre-Budget forecast document.
Chart C4 shows our central forecast for PSNB as a share of GDP – the C.35 solid black line – and the probability of outcomes deviating from that forecast. The distribution shows that the probability of PSNB in 2010-11 being within one percentage point of the central forecast is around 50 per cent. The probability of PSNB being within one percentage point of the central forecast in 2011-12 falls to around 30 per cent and to around 20 per cent in 2014-15. There is a 50 per cent probability of PSNB being 1.1 per cent of GDP or lower in 2015-16.
Chart C4: Public sector net borrowing fan chart
-6
-4
-2
0
2
4
6
8
10
12
14
2015-162013-142011-122009-102007-082005-062003-04
Per cent of GDP
Budget central forecast
C.36 Our fiscal forecast approach is as set out in detail in the Pre-Budget forecast document. In particular we have produced a central forecast. This differs from the approach used by the previous Government, under which some assumptions were designed to add caution to the fiscal forecast. Table C5 shows the key determinants of the Budget forecast. The changes to the economy forecast set out above result in revised paths for GDP and its components, prices and claimant count unemployment. We have also updated equity prices, oil prices and interest rates for the Budget forecast. In all other cases, this forecast is based on the same assumptions as in our pre-Budget forecast. The Pre-Budget forecast document explains these assumptions and our judgements in detail.
Our forecasts for expenditure are based on the totals announced by the C.37 Government in this Budget. The final allocation between Annually Managed Expenditure (AME) and Departmental Expenditure Limits (DEL) will be decided in the Spending Review. In our forecast, implied levels of DEL are derived by subtracting our forecasts of AME from the announced spending totals. The AME forecasts include the effect of the measures announced in this Budget, but not the effect of any further measures the Government may announce in the Spending Review.
Forecast approach and assumptions
3742_05b_Annex_C.indd 86 22/6/10 00:24:03
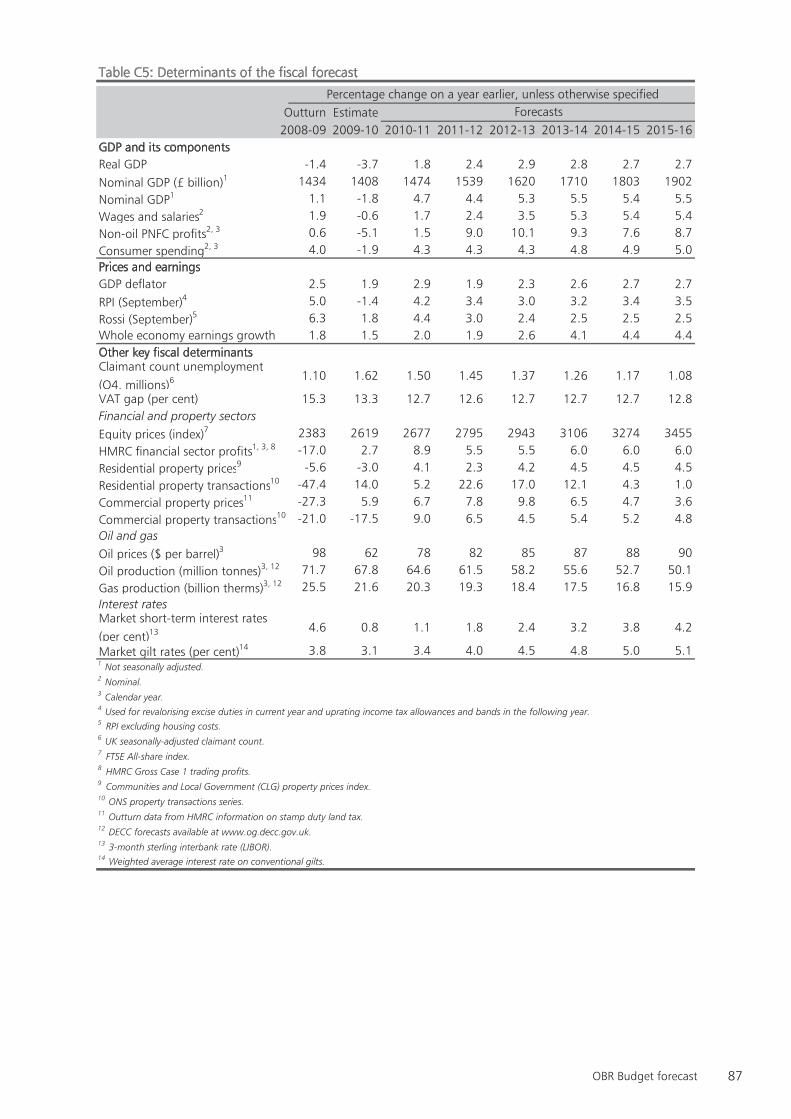
87OBR Budget forecast
Table C5: Determinants of the fiscal forecast
Outturn Estimate2008-09 2009-10 2010-11 2011-12 2012-13 2013-14 2014-15 2015-16
GDP and its componentsReal GDP -1.4 -3.7 1.8 2.4 2.9 2.8 2.7 2.7Nominal GDP (£ billion)1 1434 1408 1474 1539 1620 1710 1803 1902Nominal GDP1 1.1 -1.8 4.7 4.4 5.3 5.5 5.4 5.5Wages and salaries2 1.9 -0.6 1.7 2.4 3.5 5.3 5.4 5.4Non-oil PNFC profits2, 3 0.6 -5.1 1.5 9.0 10.1 9.3 7.6 8.7Consumer spending2, 3 4.0 -1.9 4.3 4.3 4.3 4.8 4.9 5.0Prices and earningsGDP deflator 2.5 1.9 2.9 1.9 2.3 2.6 2.7 2.7RPI (September)4 5.0 -1.4 4.2 3.4 3.0 3.2 3.4 3.5Rossi (September)5 6.3 1.8 4.4 3.0 2.4 2.5 2.5 2.5Whole economy earnings growth 1.8 1.5 2.0 1.9 2.6 4.1 4.4 4.4Other key fiscal determinantsClaimant count unemployment (Q4, millions)6
1.10 1.62 1.50 1.45 1.37 1.26 1.17 1.08
VAT gap (per cent) 15.3 13.3 12.7 12.6 12.7 12.7 12.7 12.8Financial and property sectorsEquity prices (index)7 2383 2619 2677 2795 2943 3106 3274 3455HMRC financial sector profits1, 3, 8 -17.0 2.7 8.9 5.5 5.5 6.0 6.0 6.0Residential property prices9 -5.6 -3.0 4.1 2.3 4.2 4.5 4.5 4.5Residential property transactions10 -47.4 14.0 5.2 22.6 17.0 12.1 4.3 1.0Commercial property prices11 -27.3 5.9 6.7 7.8 9.8 6.5 4.7 3.6Commercial property transactions10 -21.0 -17.5 9.0 6.5 4.5 5.4 5.2 4.8Oil and gasOil prices ($ per barrel)3 98 62 78 82 85 87 88 90Oil production (million tonnes)3, 12 71.7 67.8 64.6 61.5 58.2 55.6 52.7 50.1Gas production (billion therms)3, 12 25.5 21.6 20.3 19.3 18.4 17.5 16.8 15.9Interest ratesMarket short-term interest rates (per cent)13 4.6 0.8 1.1 1.8 2.4 3.2 3.8 4.2
Market gilt rates (per cent)14 3.8 3.1 3.4 4.0 4.5 4.8 5.0 5.1
Percentage change on a year earlier, unless otherwise specifiedForecasts
2 Nominal.3 Calendar year.4 Used for revalorising excise duties in current year and uprating income tax allowances and bands in the following year.5 RPI excluding housing costs.
1 Not seasonally adjusted.
9 Communities and Local Government (CLG) property prices index.
6 UK seasonally-adjusted claimant count.7 FTSE All-share index.
14 Weighted average interest rate on conventional gilts.
8 HMRC Gross Case 1 trading profits.
11 Outturn data from HMRC information on stamp duty land tax.12 DECC forecasts available at www.og.decc.gov.uk.13 3-month sterling interbank rate (LIBOR).
10 ONS property transactions series.
3742_05b_Annex_C.indd 87 22/6/10 00:24:03
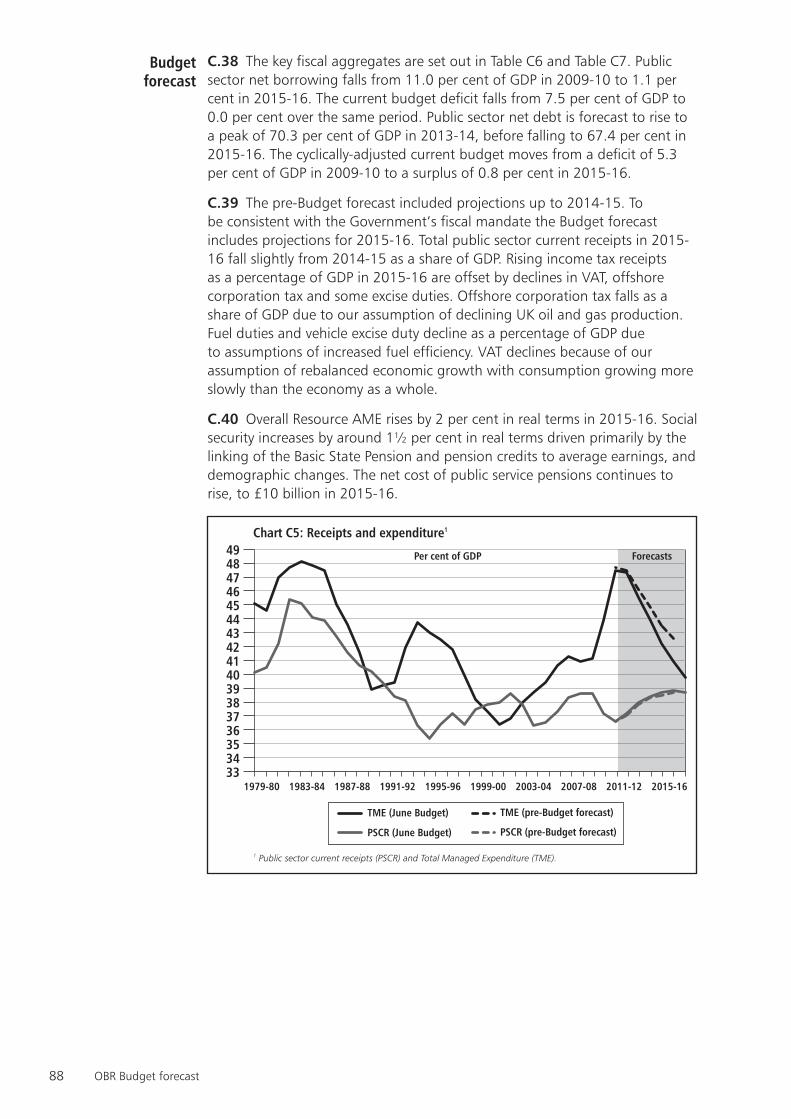
88 OBR Budget forecast
C.38 The key fiscal aggregates are set out in Table C6 and Table C7. Public sector net borrowing falls from 11.0 per cent of GDP in 2009-10 to 1.1 per cent in 2015-16. The current budget deficit falls from 7.5 per cent of GDP to 0.0 per cent over the same period. Public sector net debt is forecast to rise to a peak of 70.3 per cent of GDP in 2013-14, before falling to 67.4 per cent in 2015-16. The cyclically-adjusted current budget moves from a deficit of 5.3 per cent of GDP in 2009-10 to a surplus of 0.8 per cent in 2015-16.
The pre-Budget forecast included projections up to 2014-15. To C.39 be consistent with the Government’s fiscal mandate the Budget forecast includes projections for 2015-16. Total public sector current receipts in 2015-16 fall slightly from 2014-15 as a share of GDP. Rising income tax receipts as a percentage of GDP in 2015-16 are offset by declines in VAT, offshore corporation tax and some excise duties. Offshore corporation tax falls as a share of GDP due to our assumption of declining UK oil and gas production. Fuel duties and vehicle excise duty decline as a percentage of GDP due to assumptions of increased fuel efficiency. VAT declines because of our assumption of rebalanced economic growth with consumption growing more slowly than the economy as a whole.
Overall Resource AME rises by 2 per cent in real terms in 2015-16. Social C.40 security increases by around 1½ per cent in real terms driven primarily by the linking of the Basic State Pension and pension credits to average earnings, and demographic changes. The net cost of public service pensions continues to rise, to £10 billion in 2015-16.
Chart C5: Receipts and expenditure1
ForecastsPer cent of GDP
TME (pre-Budget forecast)TME (June Budget)
PSCR (pre-Budget forecast)PSCR (June Budget)
1 Public sector current receipts (PSCR) and Total Managed Expenditure (TME).
3334353637383940414243444546474849
2015-162011-122007-082003-041999-001995-961991-921987-881983-841979-80
Budget forecast
3742_05b_Annex_C.indd 88 22/6/10 00:24:03
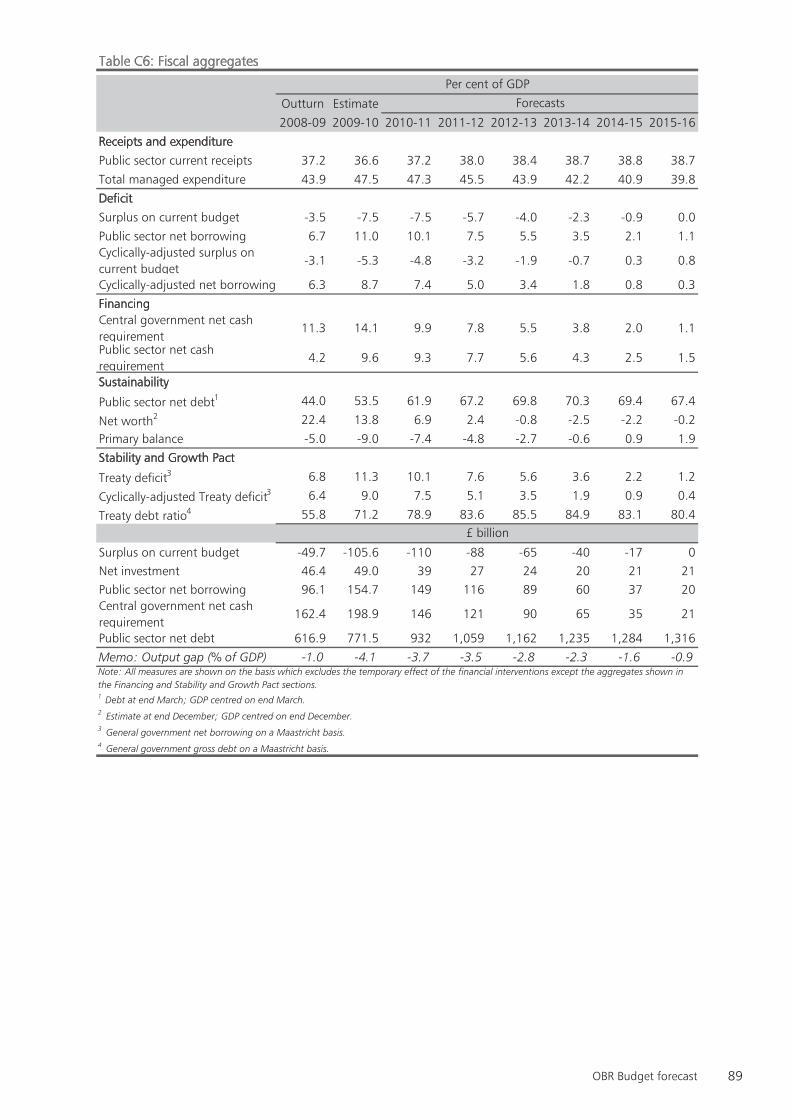
89OBR Budget forecast
Table C6: Fiscal aggregates
Outturn Estimate
2008-09 2009-10 2010-11 2011-12 2012-13 2013-14 2014-15 2015-16
Receipts and expenditure
Public sector current receipts 37.2 36.6 37.2 38.0 38.4 38.7 38.8 38.7
Total managed expenditure 43.9 47.5 47.3 45.5 43.9 42.2 40.9 39.8
Deficit
Surplus on current budget -3.5 -7.5 -7.5 -5.7 -4.0 -2.3 -0.9 0.0
Public sector net borrowing 6.7 11.0 10.1 7.5 5.5 3.5 2.1 1.1Cyclically-adjusted surplus on current budget
-3.1 -5.3 -4.8 -3.2 -1.9 -0.7 0.3 0.8
Cyclically-adjusted net borrowing 6.3 8.7 7.4 5.0 3.4 1.8 0.8 0.3
FinancingCentral government net cash requirement
11.3 14.1 9.9 7.8 5.5 3.8 2.0 1.1
Public sector net cash requirement
4.2 9.6 9.3 7.7 5.6 4.3 2.5 1.5
Sustainability
Public sector net debt1 44.0 53.5 61.9 67.2 69.8 70.3 69.4 67.4
Net worth2 22.4 13.8 6.9 2.4 -0.8 -2.5 -2.2 -0.2
Primary balance -5.0 -9.0 -7.4 -4.8 -2.7 -0.6 0.9 1.9
Stability and Growth Pact
Treaty deficit3 6.8 11.3 10.1 7.6 5.6 3.6 2.2 1.2
Cyclically-adjusted Treaty deficit3 6.4 9.0 7.5 5.1 3.5 1.9 0.9 0.4
Treaty debt ratio4 55.8 71.2 78.9 83.6 85.5 84.9 83.1 80.4
Surplus on current budget -49.7 -105.6 -110 -88 -65 -40 -17 0Net investment 46.4 49.0 39 27 24 20 21 21Public sector net borrowing 96.1 154.7 149 116 89 60 37 20Central government net cash requirement
162.4 198.9 146 121 90 65 35 21
Public sector net debt 616.9 771.5 932 1,059 1,162 1,235 1,284 1,316
Memo: Output gap (% of GDP) -1.0 -4.1 -3.7 -3.5 -2.8 -2.3 -1.6 -0.9
1 Debt at end March; GDP centred on end March.2 Estimate at end December; GDP centred on end December.3 General government net borrowing on a Maastricht basis. 4 General government gross debt on a Maastricht basis.
Forecasts
Per cent of GDP
£ billion
Note: All measures are shown on the basis which excludes the temporary effect of the financial interventions except the aggregates shown in the Financing and Stability and Growth Pact sections.
3742_05b_Annex_C.indd 89 22/6/10 00:24:03
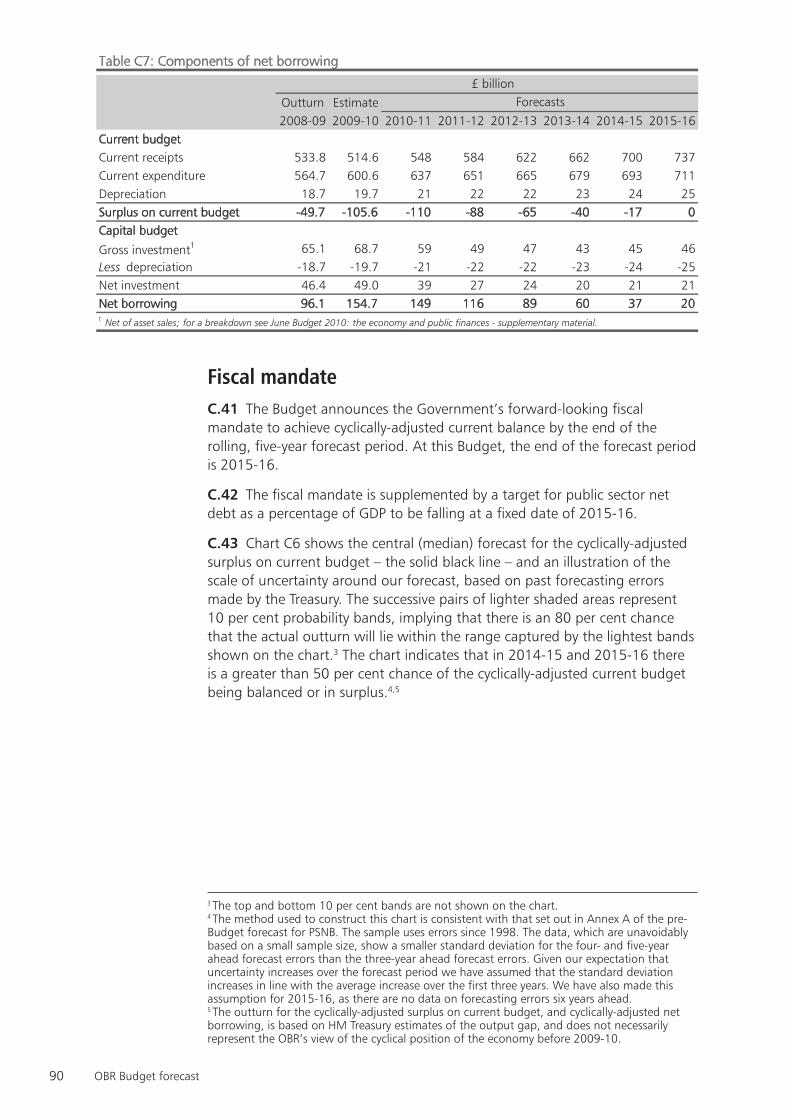
90 OBR Budget forecast
Table C7: Components of net borrowing
Outturn Estimate2008-09 2009-10 2010-11 2011-12 2012-13 2013-14 2014-15 2015-16
Current budgetCurrent receipts 533.8 514.6 548 584 622 662 700 737Current expenditure 564.7 600.6 637 651 665 679 693 711Depreciation 18.7 19.7 21 22 22 23 24 25Surplus on current budget -49.7 -105.6 -110 -88 -65 -40 -17 0Capital budget
Gross investment1 65.1 68.7 59 49 47 43 45 46Less depreciation -18.7 -19.7 -21 -22 -22 -23 -24 -25Net investment 46.4 49.0 39 27 24 20 21 21Net borrowing 96.1 154.7 149 116 89 60 37 201 Net of asset sales; for a breakdown see June Budget 2010: the economy and public finances - supplementary material.
£ billionForecasts
Fiscal mandateThe Budget announces the Government’s forward-looking fiscal C.41
mandate to achieve cyclically-adjusted current balance by the end of the rolling, five-year forecast period. At this Budget, the end of the forecast period is 2015-16.
The fiscal mandate is supplemented by a target for public sector net C.42 debt as a percentage of GDP to be falling at a fixed date of 2015-16.
Chart C6 shows the central (median) forecast for the cyclically-adjusted C.43 surplus on current budget – the solid black line – and an illustration of the scale of uncertainty around our forecast, based on past forecasting errors made by the Treasury. The successive pairs of lighter shaded areas represent 10 per cent probability bands, implying that there is an 80 per cent chance that the actual outturn will lie within the range captured by the lightest bands shown on the chart.3 The chart indicates that in 2014-15 and 2015-16 there is a greater than 50 per cent chance of the cyclically-adjusted current budget being balanced or in surplus.4,5
3 The top and bottom 10 per cent bands are not shown on the chart.4 The method used to construct this chart is consistent with that set out in Annex A of the pre-Budget forecast for PSNB. The sample uses errors since 1998. The data, which are unavoidably based on a small sample size, show a smaller standard deviation for the four- and five-year ahead forecast errors than the three-year ahead forecast errors. Given our expectation that uncertainty increases over the forecast period we have assumed that the standard deviation increases in line with the average increase over the first three years. We have also made this assumption for 2015-16, as there are no data on forecasting errors six years ahead.5 The outturn for the cyclically-adjusted surplus on current budget, and cyclically-adjusted net borrowing, is based on HM Treasury estimates of the output gap, and does not necessarily represent the OBR’s view of the cyclical position of the economy before 2009-10.
3742_05b_Annex_C.indd 90 22/6/10 00:24:04
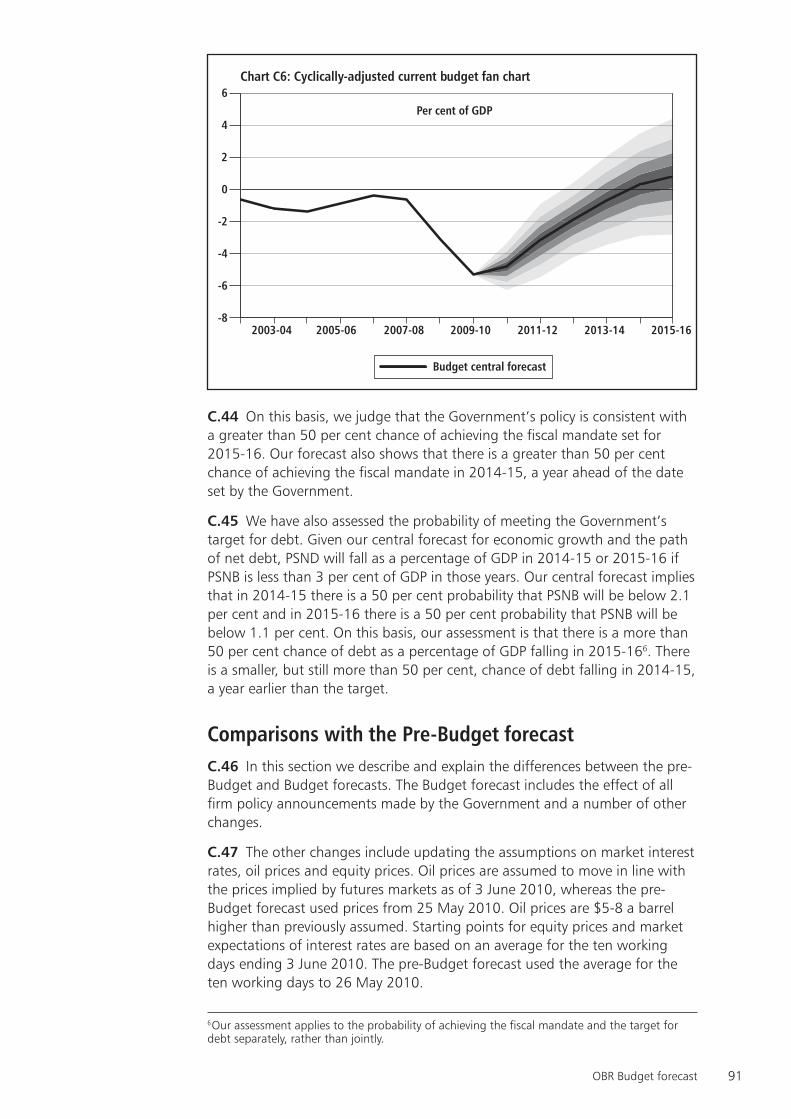
91OBR Budget forecast
Chart C6: Cyclically-adjusted current ��������� udget fan chart
-8
-6
-4
-2
0
2
4
6Per cent of GDP
Budget central forecast
2015-162013-142011-122009-102007-082005-062003-04
b
On this basis, we judge that the Government’s policy is consistent with C.44 a greater than 50 per cent chance of achieving the fiscal mandate set for 2015-16. Our forecast also shows that there is a greater than 50 per cent chance of achieving the fiscal mandate in 2014-15, a year ahead of the date set by the Government.
We have also assessed the probability of meeting the Government’s C.45 target for debt. Given our central forecast for economic growth and the path of net debt, PSND will fall as a percentage of GDP in 2014-15 or 2015-16 if PSNB is less than 3 per cent of GDP in those years. Our central forecast implies that in 2014-15 there is a 50 per cent probability that PSNB will be below 2.1 per cent and in 2015-16 there is a 50 per cent probability that PSNB will be below 1.1 per cent. On this basis, our assessment is that there is a more than 50 per cent chance of debt as a percentage of GDP falling in 2015-166. There is a smaller, but still more than 50 per cent, chance of debt falling in 2014-15, a year earlier than the target.
Comparisons with the Pre-Budget forecastIn this section we describe and explain the differences between the pre-C.46
Budget and Budget forecasts. The Budget forecast includes the effect of all firm policy announcements made by the Government and a number of other changes.
The other changes include updating the assumptions on market interest C.47 rates, oil prices and equity prices. Oil prices are assumed to move in line with the prices implied by futures markets as of 3 June 2010, whereas the pre-Budget forecast used prices from 25 May 2010. Oil prices are $5-8 a barrel higher than previously assumed. Starting points for equity prices and market expectations of interest rates are based on an average for the ten working days ending 3 June 2010. The pre-Budget forecast used the average for the ten working days to 26 May 2010.
6 Our assessment applies to the probability of achieving the fiscal mandate and the target for debt separately, rather than jointly.
3742_05b_Annex_C.indd 91 22/6/10 00:24:04
92 OBR Budget forecast
C.48 The traditional way of reporting the effect of Budget measures, whether announced in the Budget or in the Pre-Budget Report, has been in the form of a table like Table 2.1 in Chapter 2. This table sets out the direct effects of the policy measures on the fiscal forecast. The explanation for the changes is provided in the Budget supplementary document Policy costings: methodology paper.
The main measures set out are:C.49
a policy decision to reduce total spending by an additional £32 billion a •year by 2014-15, including debt interest savings;
an increase in the standard rate of VAT from 17.5 per cent to 20 per cent •with effect from 4 January 2011;
an increase in the employer NICs threshold by £21 per week in addition to •indexation from April 2011. The personal tax allowance for under 65s will increase by £1,000 to £7,475 in 2010-11;
a bank levy based on banks’ balance sheets will be introduced from 1 •January 2011. It is proposed that the levy will be set at a rate of 0.07 per cent, with a lower initial rate of 0.04 per cent in 2011; and
a reduction in the main rate of corporation tax from 28 per cent to 24 per •cent over four years, with a one per cent reduction from 1 April 2011, and a reduction in capital allowances from 2012, including a reduction in the capital allowance on the general pool of plant and machinery from 20 per cent to 18 per cent in April 2012.
Table 2.1 shows the C.50 direct effect of individual measures. The effect of each Budget measure is generally calculated as the difference between applying the pre-Budget and Budget regime to the levels of total incomes and spending at factor cost expected after the Budget. Such calculations do not show the total effect on receipts or spending after possible changes in the level or pattern of spending or other macroeconomic variables induced by that change. For example, a change in duties, in addition to indexation, might change consumption of the good bearing the duty and thereby reduce the dutiable base. It might also have an effect on GDP, through its effects on aggregate demand. The table would show the yield of the measure incorporating the effect of the change in duties applied to the reduced base. It would not necessarily show the total effect on duty receipts, since it would not show the possible effects which come through the reduction in aggregate demand.
The economic and fiscal forecasts which accompanied previous Budgets C.51 and Pre-Budget Reports did embody the total effects of policy measures, including both direct and indirect effects. The judgement on the indirect effect of policy measures has typically been made in the round, taking account of all the measures and based on the prevailing macroeconomic circumstances at the time. However, since many things change between fiscal events, it was not possible to distinguish indirect effects of policy changes from the many other factors affecting the forecasts.
On this occasion, matters are rather different since the OBR has recently C.52 published a pre-Budget forecast. Although as described above, there have been other changes since the pre-Budget forecast was completed, the main
Direct effect of Budget policy
measures
3742_05b_Annex_C.indd 92 22/6/10 00:24:04
93OBR Budget forecast
source of changes is the Budget measures. It is therefore desirable to explain how the measures have changed the economic forecast and hence the fiscal forecast.
C.53 The pre-Budget forecast does not provide a firm basis for an estimate of the effects of the Budget measures on the economy because the pre-Budget and Budget forecasts are both based on market expectations of interest rates. These are likely to have incorporated some expectation of further fiscal tightening but it is impossible to judge how much, as described in Box C1. This may have introduced an upward bias into the pre-Budget forecast and make comparison misleading.
Monetary policy response
3742_05b_Annex_C.indd 93 22/6/10 00:24:04
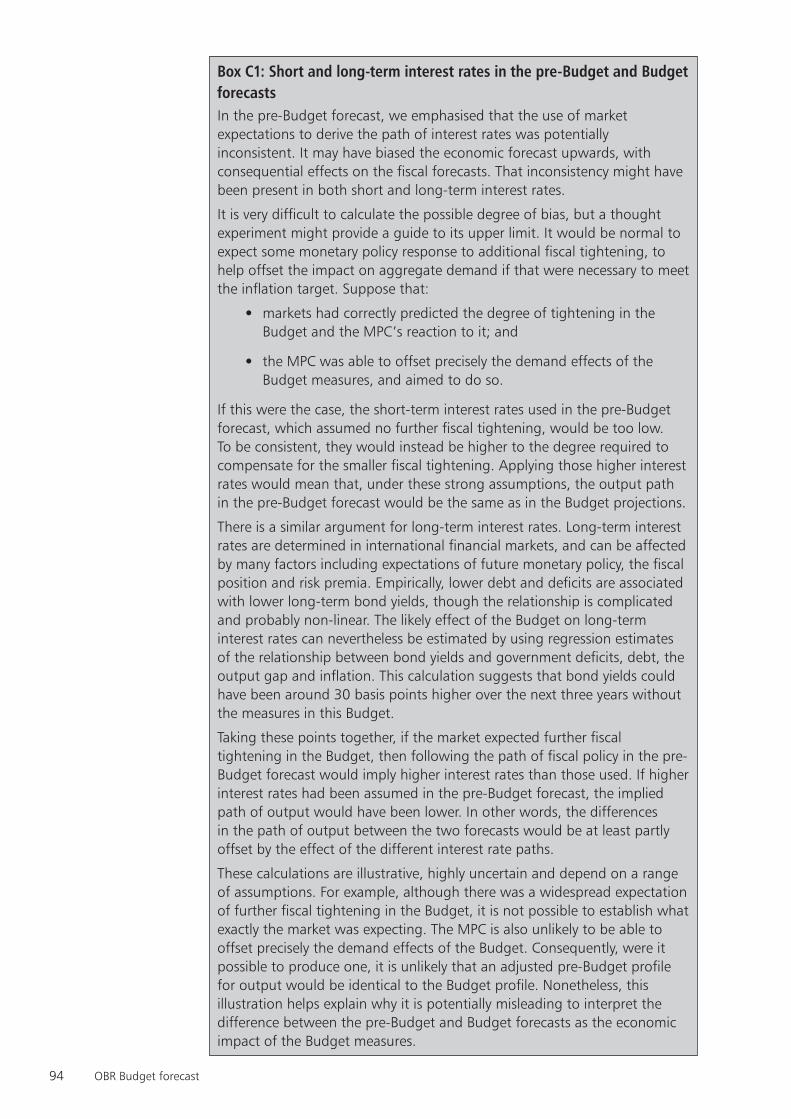
94 OBR Budget forecast
Box C1: Short and long-term interest rates in the pre-Budget and Budget forecastsIn the pre-Budget forecast, we emphasised that the use of market expectations to derive the path of interest rates was potentially inconsistent. It may have biased the economic forecast upwards, with consequential effects on the fiscal forecasts. That inconsistency might have been present in both short and long-term interest rates.
It is very difficult to calculate the possible degree of bias, but a thought experiment might provide a guide to its upper limit. It would be normal to expect some monetary policy response to additional fiscal tightening, to help offset the impact on aggregate demand if that were necessary to meet the inflation target. Suppose that:
markets had correctly predicted the degree of tightening in the •Budget and the MPC’s reaction to it; and
the MPC was able to offset precisely the demand effects of the •Budget measures, and aimed to do so.
If this were the case, the short-term interest rates used in the pre-Budget forecast, which assumed no further fiscal tightening, would be too low. To be consistent, they would instead be higher to the degree required to compensate for the smaller fiscal tightening. Applying those higher interest rates would mean that, under these strong assumptions, the output path in the pre-Budget forecast would be the same as in the Budget projections.
There is a similar argument for long-term interest rates. Long-term interest rates are determined in international financial markets, and can be affected by many factors including expectations of future monetary policy, the fiscal position and risk premia. Empirically, lower debt and deficits are associated with lower long-term bond yields, though the relationship is complicated and probably non-linear. The likely effect of the Budget on long-term interest rates can nevertheless be estimated by using regression estimates of the relationship between bond yields and government deficits, debt, the output gap and inflation. This calculation suggests that bond yields could have been around 30 basis points higher over the next three years without the measures in this Budget.
Taking these points together, if the market expected further fiscal tightening in the Budget, then following the path of fiscal policy in the pre-Budget forecast would imply higher interest rates than those used. If higher interest rates had been assumed in the pre-Budget forecast, the implied path of output would have been lower. In other words, the differences in the path of output between the two forecasts would be at least partly offset by the effect of the different interest rate paths.
These calculations are illustrative, highly uncertain and depend on a range of assumptions. For example, although there was a widespread expectation of further fiscal tightening in the Budget, it is not possible to establish what exactly the market was expecting. The MPC is also unlikely to be able to offset precisely the demand effects of the Budget. Consequently, were it possible to produce one, it is unlikely that an adjusted pre-Budget profile for output would be identical to the Budget profile. Nonetheless, this illustration helps explain why it is potentially misleading to interpret the difference between the pre-Budget and Budget forecasts as the economic impact of the Budget measures.
3742_05b_Annex_C.indd 94 22/6/10 00:24:04
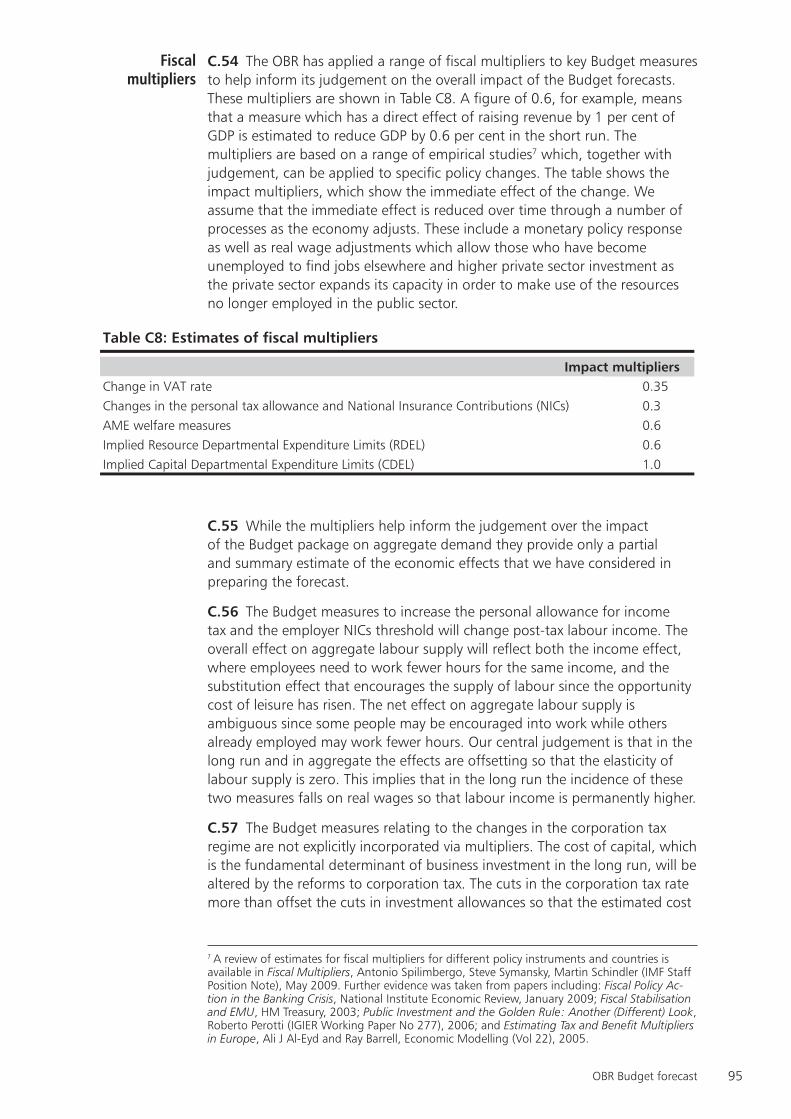
95OBR Budget forecast
C.54 The OBR has applied a range of fiscal multipliers to key Budget measures to help inform its judgement on the overall impact of the Budget forecasts. These multipliers are shown in Table C8. A figure of 0.6, for example, means that a measure which has a direct effect of raising revenue by 1 per cent of GDP is estimated to reduce GDP by 0.6 per cent in the short run. The multipliers are based on a range of empirical studies7 which, together with judgement, can be applied to specific policy changes. The table shows the impact multipliers, which show the immediate effect of the change. We assume that the immediate effect is reduced over time through a number of processes as the economy adjusts. These include a monetary policy response as well as real wage adjustments which allow those who have become unemployed to find jobs elsewhere and higher private sector investment as the private sector expands its capacity in order to make use of the resources no longer employed in the public sector.
Table C8: Estimates of fiscal multipliers
Impact multipliersChange in VAT rate 0.35Changes in the personal tax allowance and National Insurance Contributions (NICs) 0.3AME welfare measures 0.6Implied Resource Departmental Expenditure Limits (RDEL) 0.6Implied Capital Departmental Expenditure Limits (CDEL) 1.0
While the multipliers help inform the judgement over the impact C.55 of the Budget package on aggregate demand they provide only a partial and summary estimate of the economic effects that we have considered in preparing the forecast.
The Budget measures to increase the personal allowance for income C.56 tax and the employer NICs threshold will change post-tax labour income. The overall effect on aggregate labour supply will reflect both the income effect, where employees need to work fewer hours for the same income, and the substitution effect that encourages the supply of labour since the opportunity cost of leisure has risen. The net effect on aggregate labour supply is ambiguous since some people may be encouraged into work while others already employed may work fewer hours. Our central judgement is that in the long run and in aggregate the effects are offsetting so that the elasticity of labour supply is zero. This implies that in the long run the incidence of these two measures falls on real wages so that labour income is permanently higher.
The Budget measures relating to the changes in the corporation tax C.57 regime are not explicitly incorporated via multipliers. The cost of capital, which is the fundamental determinant of business investment in the long run, will be altered by the reforms to corporation tax. The cuts in the corporation tax rate more than offset the cuts in investment allowances so that the estimated cost
7 A review of estimates for fiscal multipliers for different policy instruments and countries is available in Fiscal Multipliers, Antonio Spilimbergo, Steve Symansky, Martin Schindler (IMF Staff Position Note), May 2009. Further evidence was taken from papers including: Fiscal Policy Ac-tion in the Banking Crisis, National Institute Economic Review, January 2009; Fiscal Stabilisation and EMU, HM Treasury, 2003; Public Investment and the Golden Rule: Another (Different) Look, Roberto Perotti (IGIER Working Paper No 277), 2006; and Estimating Tax and Benefit Multipliers in Europe, Ali J Al-Eyd and Ray Barrell, Economic Modelling (Vol 22), 2005.
Fiscal multipliers
3742_05b_Annex_C.indd 95 22/6/10 00:24:04
96 OBR Budget forecast
of capital for new investment is lower for all non-financial companies, and the rate of return from the existing capital stock is higher. Our judgement is that this measure will promote a higher level of business investment throughout the forecast than would otherwise have been the case.
An appropriate multiplier has informed the judgement on the effect of C.58 the increase in the rate of VAT on demand. The initial incidence of an increase in the rate of VAT will depend on how selling prices change in response. If firms leave their price net of tax unchanged the increase in VAT will be fully reflected in prices; alternatively if they reduce this price some of the incidence will be borne by firms in lower profits. Drawing on evidence of domestic and international changes in VAT rates, we judge that around two thirds of the VAT increase will be passed on relatively quickly to prices, with further adjustment in the following year. The increase in prices lowers real incomes and hence, all else equal, consumption. The remaining incidence of the VAT increase is borne by the firm.
It could be argued that the impact multipliers for policies which have C.59 been pre-announced for later years should be smaller since people and firms will have had longer to anticipate them and act accordingly, but we have not made any adjustment for that possible effect. Against that, the multipliers may be larger if cuts to benefits, for example, affect households without ready access to credit. The multipliers we have used go some way to correcting the potential error in using what might be inconsistent assumptions on interest rates in the pre-Budget forecast since they are partly estimated over periods in which there has been a monetary policy response to fiscal tightening.
C.60 It is possible for policy changes to have permanent effects to the extent that they improve or worsen the supply-side performance of the economy. Our judgement on the effect of the Budget policy package is based on the assumption that trend output will not be changed.
Comparison of the pre-Budget and Budget fiscal forecasts
Table C9 reconciles our pre-Budget and Budget forecasts by C.61 summarising the changes in PSNB and the cyclically-adjusted current budget for the period to 2014-15.
As Table C9 shows, PSNB is £33 billion lower in 2014-15, compared C.62 with the pre-Budget forecast, because:
the direct effects of total policy decisions, excluding debt interest savings, •reduce PSNB by £37 billion in 2014-15;
debt interest payments, excluding the effect of moving to updated interest •rates, reduce borrowing by £3 billion in 2014-15;
the updated market assumptions reduce borrowing by £2 billion in 2014- •15. This includes the effect of updated interest rates, which reduce debt interest costs by around £1 billion; and
other changes raise borrowing by £9 billion in 2014-15. •
Table C9 also shows the change in the cyclically-adjusted current C.63 balance in 2014-15 between the pre-Budget and Budget forecast. Our
Long-run effect
3742_05b_Annex_C.indd 96 22/6/10 00:24:04
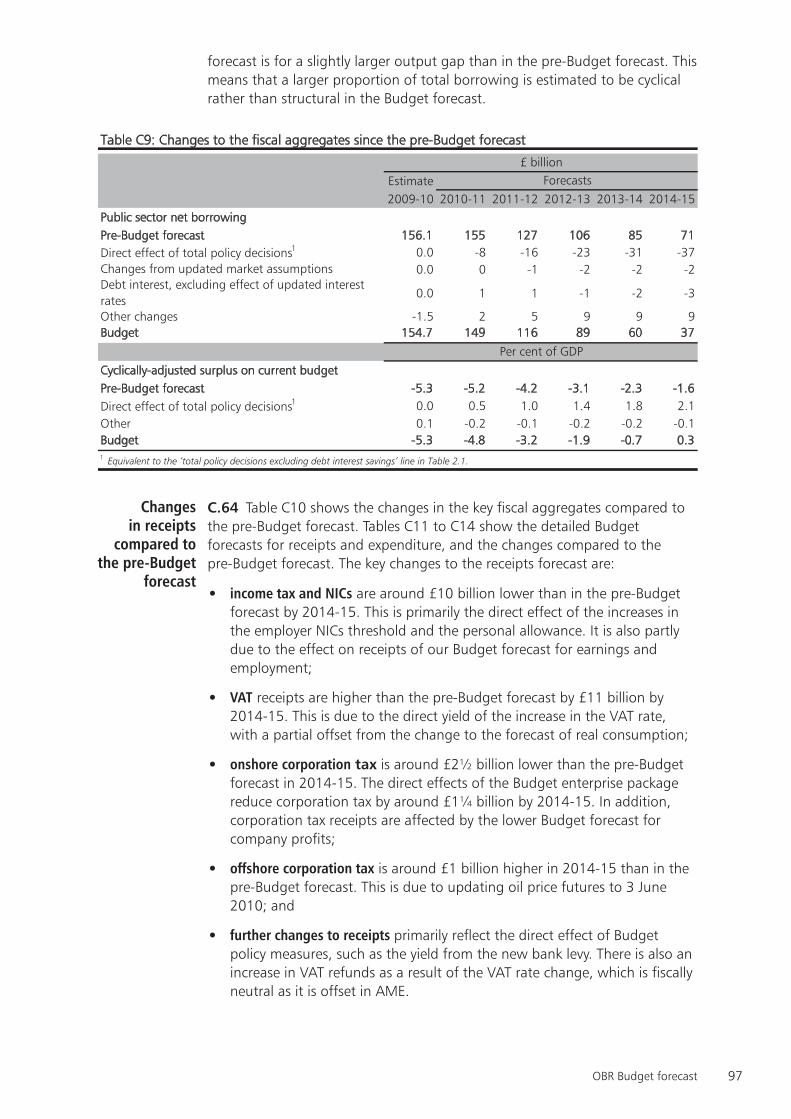
97OBR Budget forecast
forecast is for a slightly larger output gap than in the pre-Budget forecast. This means that a larger proportion of total borrowing is estimated to be cyclical rather than structural in the Budget forecast.
Table C9: Changes to the fiscal aggregates since the pre-Budget forecast
Estimate2009-10 2010-11 2011-12 2012-13 2013-14 2014-15
Public sector net borrowingPre-Budget forecast 156.1 155 127 106 85 71
0.0 -8 -16 -23 -31 -370.0 0 -1 -2 -2 -2
0.0 1 1 -1 -2 -3
Other changes -1.5 2 5 9 9 9Budget 154.7 149 116 89 60 37
Cyclically-adjusted surplus on current budget Pre-Budget forecast -5.3 -5.2 -4.2 -3.1 -2.3 -1.6
0.0 0.5 1.0 1.4 1.8 2.1Other 0.1 -0.2 -0.1 -0.2 -0.2 -0.1Budget -5.3 -4.8 -3.2 -1.9 -0.7 0.31 Equivalent to the ‘total policy decisions excluding debt interest savings’ line in Table 2.1.
Direct effect of total policy decisions1
Per cent of GDP
£ billionForecasts
Debt interest, excluding effect of updated interest rates
Direct effect of total policy decisions1
Changes from updated market assumptions
C.64 Table C10 shows the changes in the key fiscal aggregates compared to the pre-Budget forecast. Tables C11 to C14 show the detailed Budget forecasts for receipts and expenditure, and the changes compared to the pre-Budget forecast. The key changes to the receipts forecast are:
income tax and NICs • are around £10 billion lower than in the pre-Budget forecast by 2014-15. This is primarily the direct effect of the increases in the employer NICs threshold and the personal allowance. It is also partly due to the effect on receipts of our Budget forecast for earnings and employment;
VAT • receipts are higher than the pre-Budget forecast by £11 billion by 2014-15. This is due to the direct yield of the increase in the VAT rate, with a partial offset from the change to the forecast of real consumption;
onshore corporation • tax is around £2½ billion lower than the pre-Budget forecast in 2014-15. The direct effects of the Budget enterprise package reduce corporation tax by around £1¼ billion by 2014-15. In addition, corporation tax receipts are affected by the lower Budget forecast for company profits;
offshore corporation tax • is around £1 billion higher in 2014-15 than in the pre-Budget forecast. This is due to updating oil price futures to 3 June 2010; and
further changes to receipts • primarily reflect the direct effect of Budget policy measures, such as the yield from the new bank levy. There is also an increase in VAT refunds as a result of the VAT rate change, which is fiscally neutral as it is offset in AME.
Changes in receipts
compared to the pre-Budget
forecast
3742_05b_Annex_C.indd 97 22/6/10 00:24:04
98 OBR Budget forecast
C.65 The key changes to the components of AME are:
social security • is around £6 billion lower than in the pre-Budget forecast by 2014-15. This is primarily due to the direct effects of the Budget social security policy measures. There is a partial offset from the change to the Budget forecast for inflation;
tax credits • are around £2 billion lower than in the pre-Budget forecast in 2014-15, predominantly due to the tax credit reforms announced in this Budget;
debt interest costs • are £4 billion lower in 2014-15 than in the pre-Budget forecast. Approximately £1 billion of this is due to the use of updated interest rates from 3 June. The remaining £3 billion is due to the lower borrowing profile as a result of the Budget policy measures; and
further changes to AME • include small changes to pensions, local authority self-financed expenditure and other capital expenditure reflecting the effects of Budget policy measures, and an increase in VAT refunds which is offset by higher receipts.
The Budget sets out the Government’s overall spending plans in the C.66 period to 2015-16, with public sector current expenditure (PSCE) rising to £711 billion and public sector gross investment (PSGI) falling to £43 billion in 2013-14, before rising to £46 billion in 2015-16. In 2014-15, the plans for PSCE are £28 billion lower than in our pre-Budget forecast, which assumed that PSCE grew at the same nominal rates as in the March Budget. The plans for PSGI in 2014-15 are £2 billion lower than in our pre-Budget forecast which was based on the March Budget assumption for PSNI as a share of GDP.
Our Budget forecast shows implied Resource DEL (RDEL) derived as C.67 the difference between Resource AME and PSCE, and implied Capital DEL (CDEL) derived as the difference between PSGI and Capital AME. They do not represent the Government’s plans for RDEL and CDEL.
Compared to the pre-Budget forecast implied RDEL is lower by £15.5 C.68 billion in 2014-15. This is derived from the lower PSCE plans offset by the reduced Resource AME forecast. Similarly, implied CDEL is £1.6 billion below the pre-Budget forecast, derived from lower PSGI plans offset by the reduced Capital AME forecast.
Changes in expenditure
compared to the pre-Budget
forecast
3742_05b_Annex_C.indd 98 22/6/10 00:24:04
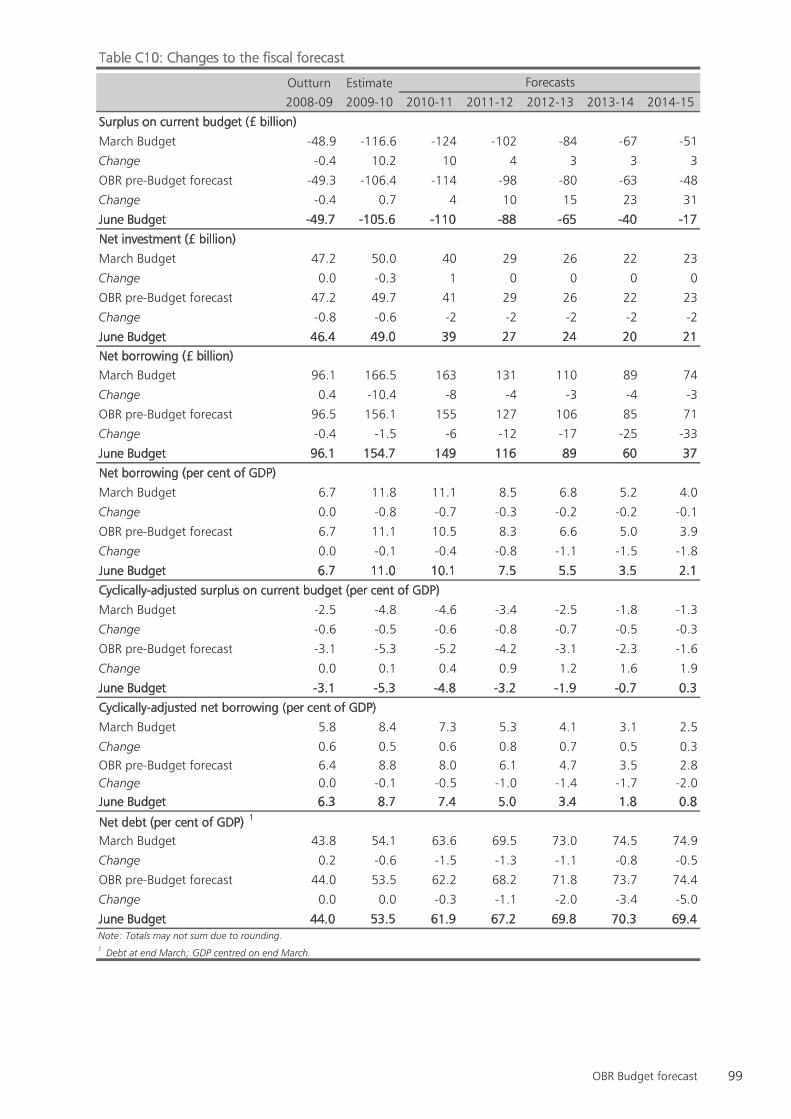
99OBR Budget forecast
Outturn Estimate
2008-09 2009-10 2010-11 2011-12 2012-13 2013-14 2014-15
Surplus on current budget (£ billion)
March Budget -48.9 -116.6 -124 -102 -84 -67 -51
Change -0.4 10.2 10 4 3 3 3
OBR pre-Budget forecast -49.3 -106.4 -114 -98 -80 -63 -48
Change -0.4 0.7 4 10 15 23 31
June Budget -49.7 -105.6 -110 -88 -65 -40 -17
Net investment (£ billion)
March Budget 47.2 50.0 40 29 26 22 23
Change 0.0 -0.3 1 0 0 0 0
OBR pre-Budget forecast 47.2 49.7 41 29 26 22 23
Change -0.8 -0.6 -2 -2 -2 -2 -2
June Budget 46.4 49.0 39 27 24 20 21
Net borrowing (£ billion)
March Budget 96.1 166.5 163 131 110 89 74
Change 0.4 -10.4 -8 -4 -3 -4 -3
OBR pre-Budget forecast 96.5 156.1 155 127 106 85 71
Change -0.4 -1.5 -6 -12 -17 -25 -33
June Budget 96.1 154.7 149 116 89 60 37
Net borrowing (per cent of GDP)
March Budget 6.7 11.8 11.1 8.5 6.8 5.2 4.0
Change 0.0 -0.8 -0.7 -0.3 -0.2 -0.2 -0.1
OBR pre-Budget forecast 6.7 11.1 10.5 8.3 6.6 5.0 3.9
Change 0.0 -0.1 -0.4 -0.8 -1.1 -1.5 -1.8
June Budget 6.7 11.0 10.1 7.5 5.5 3.5 2.1
Cyclically-adjusted surplus on current budget (per cent of GDP)
March Budget -2.5 -4.8 -4.6 -3.4 -2.5 -1.8 -1.3
Change -0.6 -0.5 -0.6 -0.8 -0.7 -0.5 -0.3
OBR pre-Budget forecast -3.1 -5.3 -5.2 -4.2 -3.1 -2.3 -1.6
Change 0.0 0.1 0.4 0.9 1.2 1.6 1.9
June Budget -3.1 -5.3 -4.8 -3.2 -1.9 -0.7 0.3
Cyclically-adjusted net borrowing (per cent of GDP)
March Budget 5.8 8.4 7.3 5.3 4.1 3.1 2.5
Change 0.6 0.5 0.6 0.8 0.7 0.5 0.3OBR pre-Budget forecast 6.4 8.8 8.0 6.1 4.7 3.5 2.8Change 0.0 -0.1 -0.5 -1.0 -1.4 -1.7 -2.0June Budget 6.3 8.7 7.4 5.0 3.4 1.8 0.8
Net debt (per cent of GDP) 1
March Budget 43.8 54.1 63.6 69.5 73.0 74.5 74.9
Change 0.2 -0.6 -1.5 -1.3 -1.1 -0.8 -0.5
OBR pre-Budget forecast 44.0 53.5 62.2 68.2 71.8 73.7 74.4
Change 0.0 0.0 -0.3 -1.1 -2.0 -3.4 -5.0
June Budget 44.0 53.5 61.9 67.2 69.8 70.3 69.4
1 Debt at end March; GDP centred on end March.
Forecasts
Table C10: Changes to the fiscal forecast
Note: Totals may not sum due to rounding.
3742_05b_Annex_C.indd 99 22/6/10 00:24:05
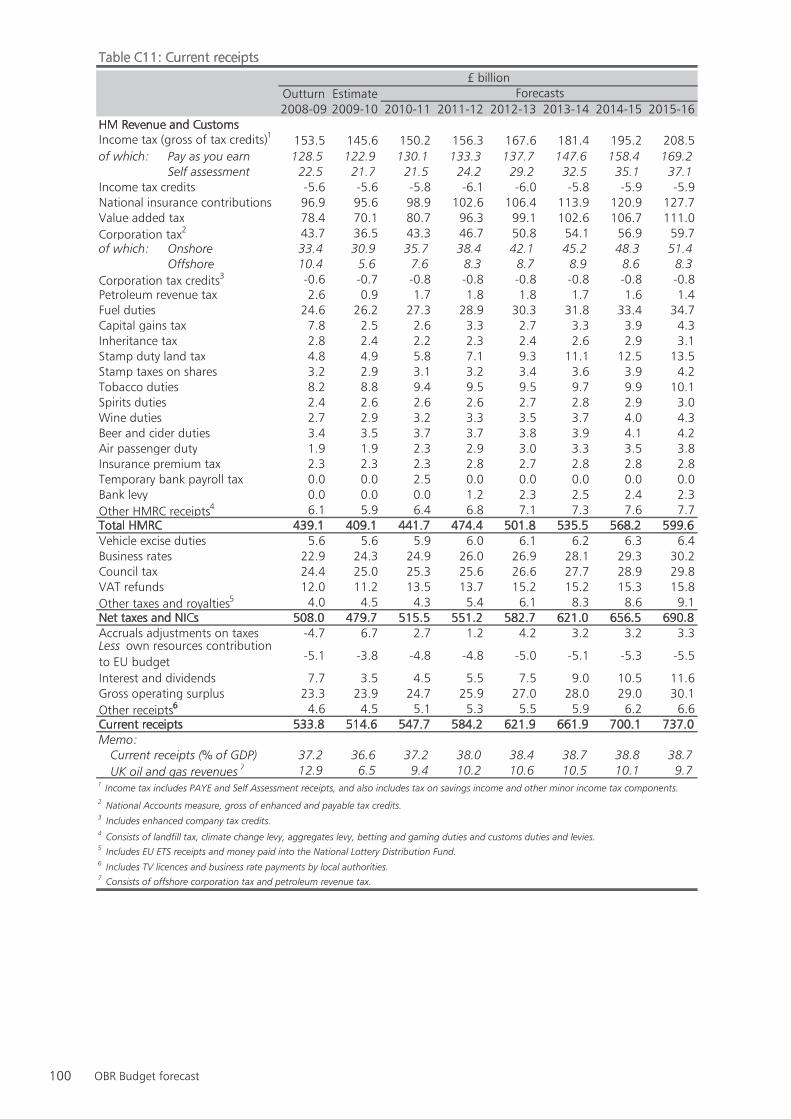
100 OBR Budget forecast
Outturn Estimate2008-09 2009-10 2010-11 2011-12 2012-13 2013-14 2014-15 2015-16
HM Revenue and CustomsIncome tax (gross of tax credits)1 153.5 145.6 150.2 156.3 167.6 181.4 195.2 208.5of which: Pay as you earn 128.5 122.9 130.1 133.3 137.7 147.6 158.4 169.2 Self assessment 22.5 21.7 21.5 24.2 29.2 32.5 35.1 37.1Income tax credits -5.6 -5.6 -5.8 -6.1 -6.0 -5.8 -5.9 -5.9National insurance contributions 96.9 95.6 98.9 102.6 106.4 113.9 120.9 127.7Value added tax 78.4 70.1 80.7 96.3 99.1 102.6 106.7 111.0Corporation tax2 43.7 36.5 43.3 46.7 50.8 54.1 56.9 59.7of which: Onshore 33.4 30.9 35.7 38.4 42.1 45.2 48.3 51.4 Offshore 10.4 5.6 7.6 8.3 8.7 8.9 8.6 8.3Corporation tax credits3 -0.6 -0.7 -0.8 -0.8 -0.8 -0.8 -0.8 -0.8Petroleum revenue tax 2.6 0.9 1.7 1.8 1.8 1.7 1.6 1.4Fuel duties 24.6 26.2 27.3 28.9 30.3 31.8 33.4 34.7Capital gains tax 7.8 2.5 2.6 3.3 2.7 3.3 3.9 4.3Inheritance tax 2.8 2.4 2.2 2.3 2.4 2.6 2.9 3.1Stamp duty land tax 4.8 4.9 5.8 7.1 9.3 11.1 12.5 13.5Stamp taxes on shares 3.2 2.9 3.1 3.2 3.4 3.6 3.9 4.2Tobacco duties 8.2 8.8 9.4 9.5 9.5 9.7 9.9 10.1Spirits duties 2.4 2.6 2.6 2.6 2.7 2.8 2.9 3.0Wine duties 2.7 2.9 3.2 3.3 3.5 3.7 4.0 4.3Beer and cider duties 3.4 3.5 3.7 3.7 3.8 3.9 4.1 4.2Air passenger duty 1.9 1.9 2.3 2.9 3.0 3.3 3.5 3.8Insurance premium tax 2.3 2.3 2.3 2.8 2.7 2.8 2.8 2.8Temporary bank payroll tax 0.0 0.0 2.5 0.0 0.0 0.0 0.0 0.0Bank levy 0.0 0.0 0.0 1.2 2.3 2.5 2.4 2.3Other HMRC receipts4 6.1 5.9 6.4 6.8 7.1 7.3 7.6 7.7Total HMRC 439.1 409.1 441.7 474.4 501.8 535.5 568.2 599.6Vehicle excise duties 5.6 5.6 5.9 6.0 6.1 6.2 6.3 6.4Business rates 22.9 24.3 24.9 26.0 26.9 28.1 29.3 30.2Council tax 24.4 25.0 25.3 25.6 26.6 27.7 28.9 29.8VAT refunds 12.0 11.2 13.5 13.7 15.2 15.2 15.3 15.8Other taxes and royalties5 4.0 4.5 4.3 5.4 6.1 8.3 8.6 9.1Net taxes and NICs 508.0 479.7 515.5 551.2 582.7 621.0 656.5 690.8Accruals adjustments on taxes -4.7 6.7 2.7 1.2 4.2 3.2 3.2 3.3
-5.1 -3.8 -4.8 -4.8 -5.0 -5.1 -5.3 -5.5
Interest and dividends 7.7 3.5 4.5 5.5 7.5 9.0 10.5 11.6Gross operating surplus 23.3 23.9 24.7 25.9 27.0 28.0 29.0 30.1Other receipts6 4.6 4.5 5.1 5.3 5.5 5.9 6.2 6.6Current receipts 533.8 514.6 547.7 584.2 621.9 661.9 700.1 737.0Memo:
Current receipts (% of GDP) 37.2 36.6 37.2 38.0 38.4 38.7 38.8 38.7UK oil and gas revenues 7 12.9 6.5 9.4 10.2 10.6 10.5 10.1 9.7
4 Consists of landfill tax, climate change levy, aggregates levy, betting and gaming duties and customs duties and levies.
Table C11: Current receipts£ billion
Forecasts
1 Income tax includes PAYE and Self Assessment receipts, and also includes tax on savings income and other minor income tax components.
Less own resources contribution to EU budget
6 Includes TV licences and business rate payments by local authorities.7 Consists of offshore corporation tax and petroleum revenue tax.
3 Includes enhanced company tax credits.
2 National Accounts measure, gross of enhanced and payable tax credits.
5 Includes EU ETS receipts and money paid into the National Lottery Distribution Fund.
3742_05b_Annex_C.indd 100 22/6/10 00:24:05
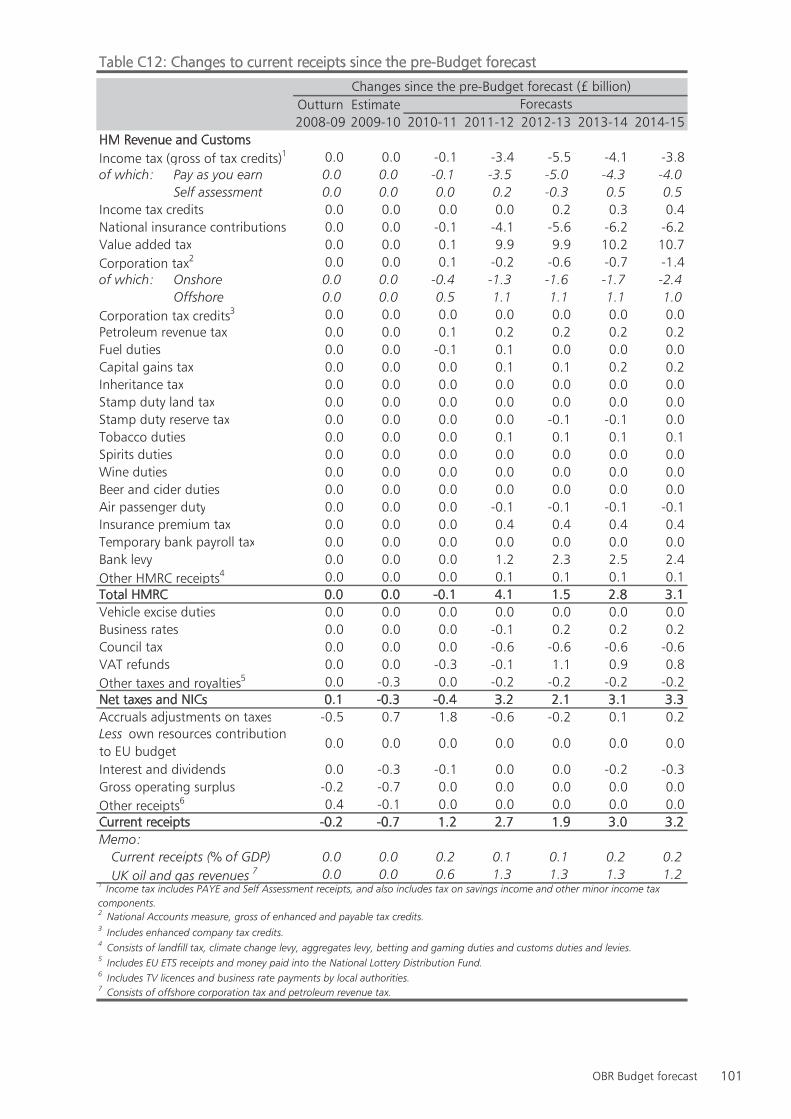
101OBR Budget forecast
Outturn Estimate2008-09 2009-10 2010-11 2011-12 2012-13 2013-14 2014-15
HM Revenue and CustomsIncome tax (gross of tax credits)1 0.0 0.0 -0.1 -3.4 -5.5 -4.1 -3.8of which: Pay as you earn 0.0 0.0 -0.1 -3.5 -5.0 -4.3 -4.0 Self assessment 0.0 0.0 0.0 0.2 -0.3 0.5 0.5Income tax credits 0.0 0.0 0.0 0.0 0.2 0.3 0.4National insurance contributions 0.0 0.0 -0.1 -4.1 -5.6 -6.2 -6.2Value added tax 0.0 0.0 0.1 9.9 9.9 10.2 10.7Corporation tax2 0.0 0.0 0.1 -0.2 -0.6 -0.7 -1.4of which: Onshore 0.0 0.0 -0.4 -1.3 -1.6 -1.7 -2.4 Offshore 0.0 0.0 0.5 1.1 1.1 1.1 1.0Corporation tax credits3 0.0 0.0 0.0 0.0 0.0 0.0 0.0Petroleum revenue tax 0.0 0.0 0.1 0.2 0.2 0.2 0.2Fuel duties 0.0 0.0 -0.1 0.1 0.0 0.0 0.0Capital gains tax 0.0 0.0 0.0 0.1 0.1 0.2 0.2Inheritance tax 0.0 0.0 0.0 0.0 0.0 0.0 0.0Stamp duty land tax 0.0 0.0 0.0 0.0 0.0 0.0 0.0Stamp duty reserve tax 0.0 0.0 0.0 0.0 -0.1 -0.1 0.0Tobacco duties 0.0 0.0 0.0 0.1 0.1 0.1 0.1Spirits duties 0.0 0.0 0.0 0.0 0.0 0.0 0.0Wine duties 0.0 0.0 0.0 0.0 0.0 0.0 0.0Beer and cider duties 0.0 0.0 0.0 0.0 0.0 0.0 0.0Air passenger duty 0.0 0.0 0.0 -0.1 -0.1 -0.1 -0.1Insurance premium tax 0.0 0.0 0.0 0.4 0.4 0.4 0.4Temporary bank payroll tax 0.0 0.0 0.0 0.0 0.0 0.0 0.0Bank levy 0.0 0.0 0.0 1.2 2.3 2.5 2.4Other HMRC receipts4 0.0 0.0 0.0 0.1 0.1 0.1 0.1Total HMRC 0.0 0.0 -0.1 4.1 1.5 2.8 3.1Vehicle excise duties 0.0 0.0 0.0 0.0 0.0 0.0 0.0Business rates 0.0 0.0 0.0 -0.1 0.2 0.2 0.2Council tax 0.0 0.0 0.0 -0.6 -0.6 -0.6 -0.6VAT refunds 0.0 0.0 -0.3 -0.1 1.1 0.9 0.8Other taxes and royalties5 0.0 -0.3 0.0 -0.2 -0.2 -0.2 -0.2Net taxes and NICs 0.1 -0.3 -0.4 3.2 2.1 3.1 3.3Accruals adjustments on taxes -0.5 0.7 1.8 -0.6 -0.2 0.1 0.2
0.0 0.0 0.0 0.0 0.0 0.0 0.0
Interest and dividends 0.0 -0.3 -0.1 0.0 0.0 -0.2 -0.3Gross operating surplus -0.2 -0.7 0.0 0.0 0.0 0.0 0.0Other receipts6 0.4 -0.1 0.0 0.0 0.0 0.0 0.0Current receipts -0.2 -0.7 1.2 2.7 1.9 3.0 3.2Memo:
Current receipts (% of GDP) 0.0 0.0 0.2 0.1 0.1 0.2 0.2UK oil and gas revenues 7 0.0 0.0 0.6 1.3 1.3 1.3 1.2
3 Includes enhanced company tax credits.4 Consists of landfill tax, climate change levy, aggregates levy, betting and gaming duties and customs duties and levies.5 Includes EU ETS receipts and money paid into the National Lottery Distribution Fund.6 Includes TV licences and business rate payments by local authorities.
Forecasts
7 Consists of offshore corporation tax and petroleum revenue tax.
Table C12: Changes to current receipts since the pre-Budget forecast
Changes since the pre-Budget forecast (£ billion)
1 Income tax includes PAYE and Self Assessment receipts, and also includes tax on savings income and other minor income tax components.2 National Accounts measure, gross of enhanced and payable tax credits.
Less own resources contribution to EU budget
3742_05b_Annex_C.indd 101 22/6/10 00:24:05
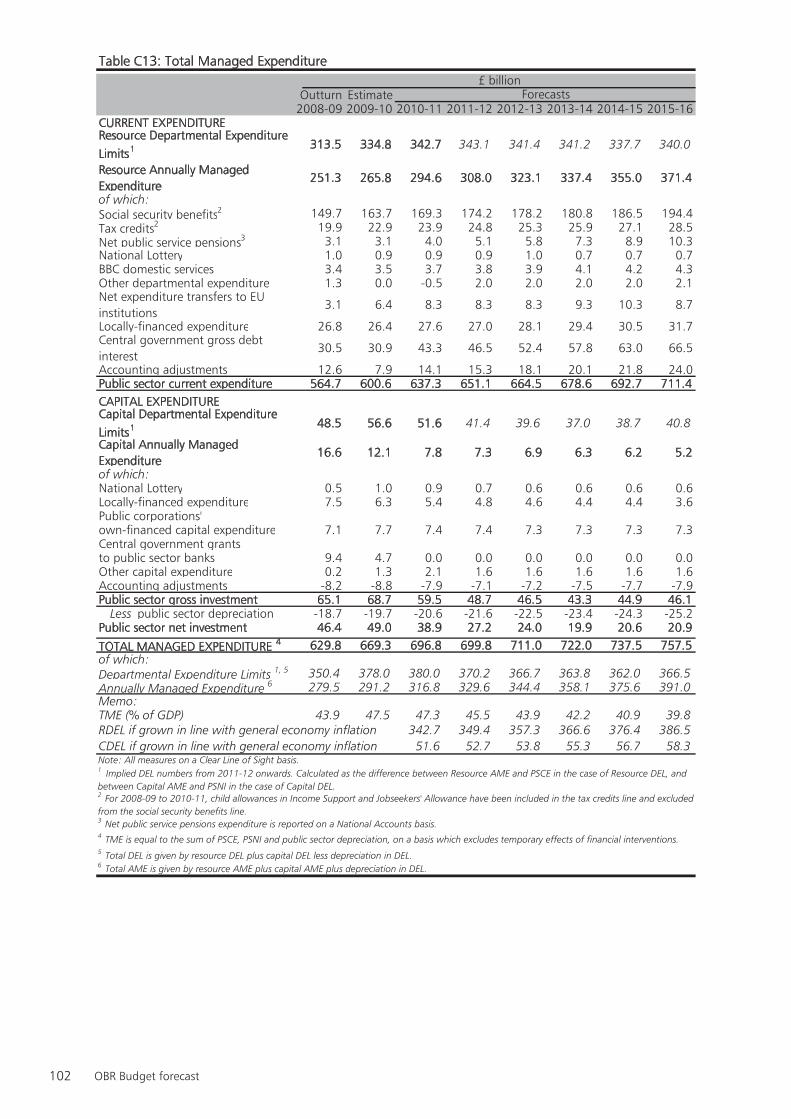
102 OBR Budget forecast
Table C13: Total Managed Expenditure
Outturn Estimate2008-09 2009-10 2010-11 2011-12 2012-13 2013-14 2014-15 2015-16
CURRENT EXPENDITUREResource Departmental Expenditure Limits1 313.5 334.8 342.7 343.1 341.4 341.2 337.7 340.0
Resource Annually Managed Expenditure
251.3 265.8 294.6 308.0 323.1 337.4 355.0 371.4
of which:Social security benefits2 149.7 163.7 169.3 174.2 178.2 180.8 186.5 194.4Tax credits2 19.9 22.9 23.9 24.8 25.3 25.9 27.1 28.5Net public service pensions3 3.1 3.1 4.0 5.1 5.8 7.3 8.9 10.3National Lottery 1.0 0.9 0.9 0.9 1.0 0.7 0.7 0.7BBC domestic services 3.4 3.5 3.7 3.8 3.9 4.1 4.2 4.3Other departmental expenditure 1.3 0.0 -0.5 2.0 2.0 2.0 2.0 2.1Net expenditure transfers to EU institutions
3.1 6.4 8.3 8.3 8.3 9.3 10.3 8.7
Locally-financed expenditure 26.8 26.4 27.6 27.0 28.1 29.4 30.5 31.7Central government gross debt interest
30.5 30.9 43.3 46.5 52.4 57.8 63.0 66.5
Accounting adjustments 12.6 7.9 14.1 15.3 18.1 20.1 21.8 24.0Public sector current expenditure 564.7 600.6 637.3 651.1 664.5 678.6 692.7 711.4CAPITAL EXPENDITURECapital Departmental Expenditure Limits1 48.5 56.6 51.6 41.4 39.6 37.0 38.7 40.8
Capital Annually Managed Expenditure
16.6 12.1 7.8 7.3 6.9 6.3 6.2 5.2
of which:National Lottery 0.5 1.0 0.9 0.7 0.6 0.6 0.6 0.6Locally-financed expenditure 7.5 6.3 5.4 4.8 4.6 4.4 4.4 3.6Public corporations' own-financed capital expenditure 7.1 7.7 7.4 7.4 7.3 7.3 7.3 7.3Central government grants to public sector banks 9.4 4.7 0.0 0.0 0.0 0.0 0.0 0.0Other capital expenditure 0.2 1.3 2.1 1.6 1.6 1.6 1.6 1.6Accounting adjustments -8.2 -8.8 -7.9 -7.1 -7.2 -7.5 -7.7 -7.9Public sector gross investment 65.1 68.7 59.5 48.7 46.5 43.3 44.9 46.1
Less public sector depreciation -18.7 -19.7 -20.6 -21.6 -22.5 -23.4 -24.3 -25.2Public sector net investment 46.4 49.0 38.9 27.2 24.0 19.9 20.6 20.9
TOTAL MANAGED EXPENDITURE 4 629.8 669.3 696.8 699.8 711.0 722.0 737.5 757.5of which:Departmental Expenditure Limits 1, 5 350.4 378.0 380.0 370.2 366.7 363.8 362.0 366.5Annually Managed Expenditure 6 279.5 291.2 316.8 329.6 344.4 358.1 375.6 391.0Memo:TME (% of GDP) 43.9 47.5 47.3 45.5 43.9 42.2 40.9 39.8RDEL if grown in line with general economy inflation 342.7 349.4 357.3 366.6 376.4 386.5CDEL if grown in line with general economy inflation 51.6 52.7 53.8 55.3 56.7 58.3
5 Total DEL is given by resource DEL plus capital DEL less depreciation in DEL.6 Total AME is given by resource AME plus capital AME plus depreciation in DEL.
Note: All measures on a Clear Line of Sight basis.
3 Net public service pensions expenditure is reported on a National Accounts basis.
£ billionForecasts
2 For 2008-09 to 2010-11, child allowances in Income Support and Jobseekers' Allowance have been included in the tax credits line and excluded from the social security benefits line.
4 TME is equal to the sum of PSCE, PSNI and public sector depreciation, on a basis which excludes temporary effects of financial interventions.
1 Implied DEL numbers from 2011-12 onwards. Calculated as the difference between Resource AME and PSCE in the case of Resource DEL, and between Capital AME and PSNI in the case of Capital DEL.
3742_05b_Annex_C.indd 102 22/6/10 00:24:06
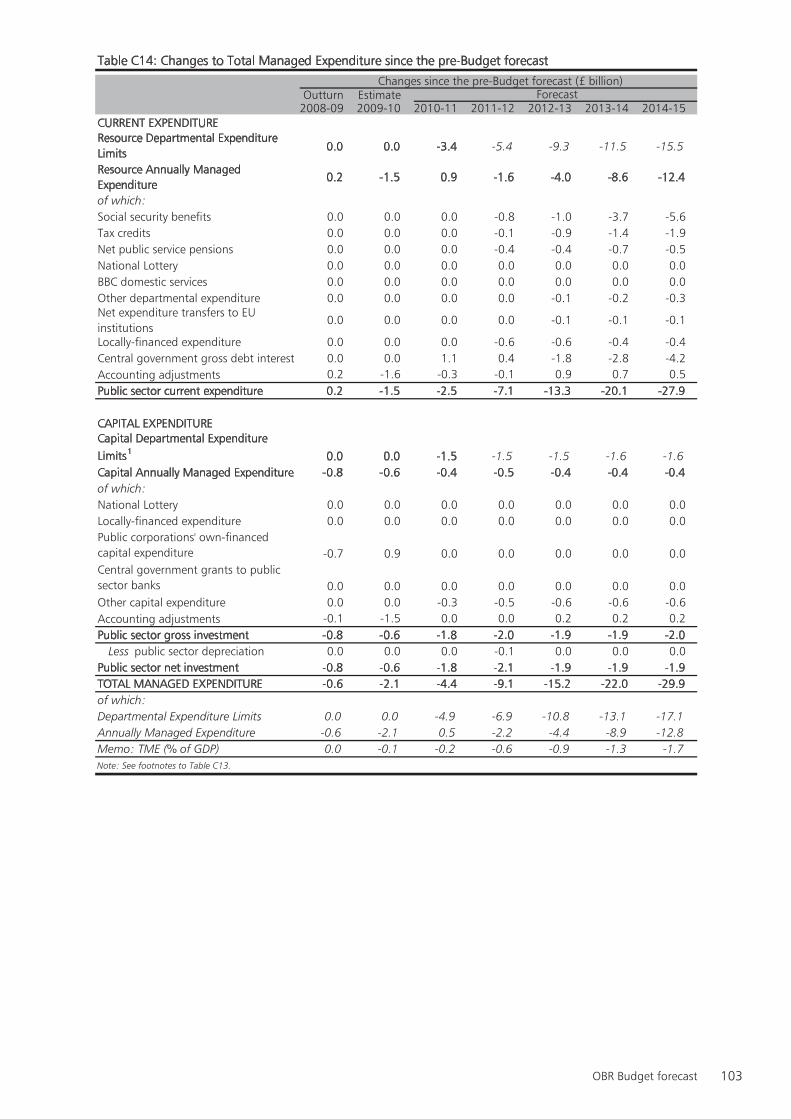
103OBR Budget forecast
Outturn Estimate2008-09 2009-10 2010-11 2011-12 2012-13 2013-14 2014-15
CURRENT EXPENDITUREResource Departmental Expenditure Limits 0.0 0.0 -3.4 -5.4 -9.3 -11.5 -15.5
Resource Annually Managed Expenditure
0.2 -1.5 0.9 -1.6 -4.0 -8.6 -12.4
of which:Social security benefits 0.0 0.0 0.0 -0.8 -1.0 -3.7 -5.6Tax credits 0.0 0.0 0.0 -0.1 -0.9 -1.4 -1.9Net public service pensions 0.0 0.0 0.0 -0.4 -0.4 -0.7 -0.5National Lottery 0.0 0.0 0.0 0.0 0.0 0.0 0.0BBC domestic services 0.0 0.0 0.0 0.0 0.0 0.0 0.0Other departmental expenditure 0.0 0.0 0.0 0.0 -0.1 -0.2 -0.3Net expenditure transfers to EU institutions
0.0 0.0 0.0 0.0 -0.1 -0.1 -0.1
Locally-financed expenditure 0.0 0.0 0.0 -0.6 -0.6 -0.4 -0.4Central government gross debt interest 0.0 0.0 1.1 0.4 -1.8 -2.8 -4.2Accounting adjustments 0.2 -1.6 -0.3 -0.1 0.9 0.7 0.5Public sector current expenditure 0.2 -1.5 -2.5 -7.1 -13.3 -20.1 -27.9
CAPITAL EXPENDITURECapital Departmental Expenditure Limits1 0.0 0.0 -1.5 -1.5 -1.5 -1.6 -1.6Capital Annually Managed Expenditure -0.8 -0.6 -0.4 -0.5 -0.4 -0.4 -0.4of which:National Lottery 0.0 0.0 0.0 0.0 0.0 0.0 0.0Locally-financed expenditure 0.0 0.0 0.0 0.0 0.0 0.0 0.0
-0.7 0.9 0.0 0.0 0.0 0.0 0.0
0.0 0.0 0.0 0.0 0.0 0.0 0.0Other capital expenditure 0.0 0.0 -0.3 -0.5 -0.6 -0.6 -0.6Accounting adjustments -0.1 -1.5 0.0 0.0 0.2 0.2 0.2Public sector gross investment -0.8 -0.6 -1.8 -2.0 -1.9 -1.9 -2.0
Less public sector depreciation 0.0 0.0 0.0 -0.1 0.0 0.0 0.0Public sector net investment -0.8 -0.6 -1.8 -2.1 -1.9 -1.9 -1.9TOTAL MANAGED EXPENDITURE -0.6 -2.1 -4.4 -9.1 -15.2 -22.0 -29.9of which:Departmental Expenditure Limits 0.0 0.0 -4.9 -6.9 -10.8 -13.1 -17.1Annually Managed Expenditure -0.6 -2.1 0.5 -2.2 -4.4 -8.9 -12.8Memo: TME (% of GDP) 0.0 -0.1 -0.2 -0.6 -0.9 -1.3 -1.7Note: See footnotes to Table C13.
Changes since the pre-Budget forecast (£ billion)
Table C14: Changes to Total Managed Expenditure since the pre-Budget forecast
Public corporations' own-financed capital expenditureCentral government grants to public sector banks
Forecast
3742_05b_Annex_C.indd 103 22/6/10 00:24:06
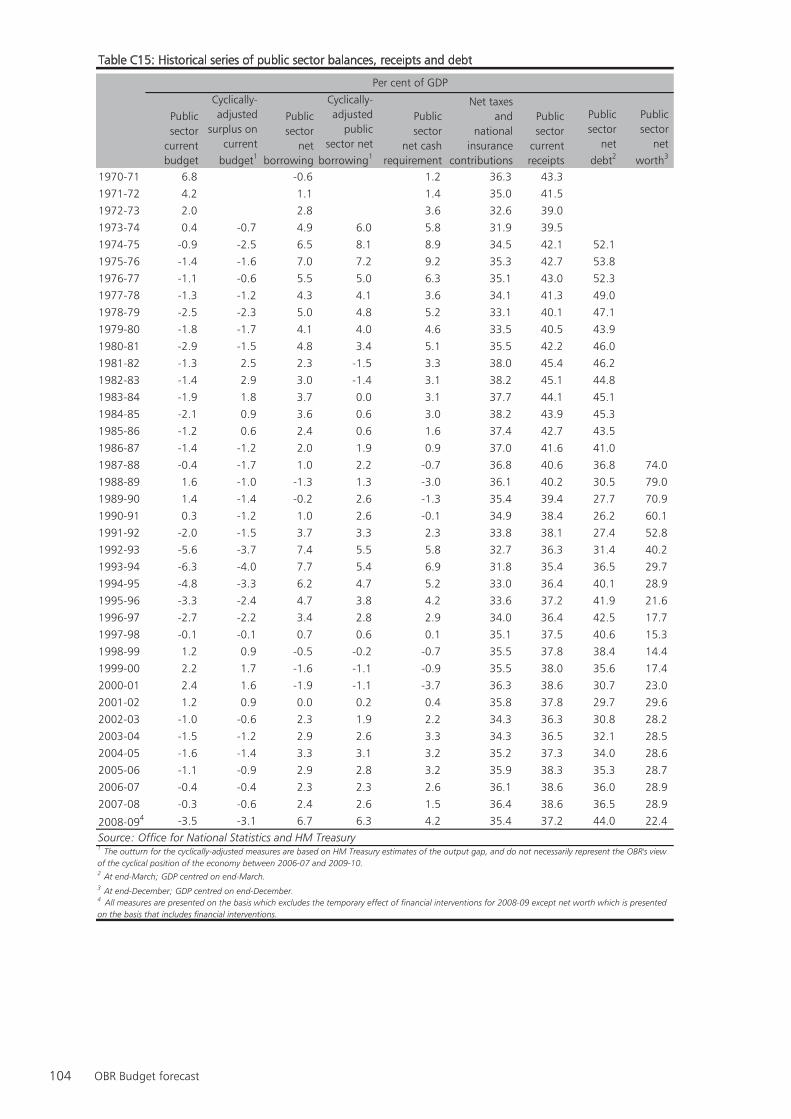
104 OBR Budget forecast
Table C15: Historical series of public sector balances, receipts and debt
Public sector
current budget
Cyclically-adjusted
surplus on current
budget1
Public sector
net borrowing
Cyclically-adjusted
public sector net
borrowing1
Public sector
net cash requirement
Net taxes and
national insurance
contributions
Public sector
current receipts
Public sector
net debt2
Public sector
net worth3
1970-71 6.8 -0.6 1.2 36.3 43.3
1971-72 4.2 1.1 1.4 35.0 41.5
1972-73 2.0 2.8 3.6 32.6 39.0
1973-74 0.4 -0.7 4.9 6.0 5.8 31.9 39.5
1974-75 -0.9 -2.5 6.5 8.1 8.9 34.5 42.1 52.1
1975-76 -1.4 -1.6 7.0 7.2 9.2 35.3 42.7 53.8
1976-77 -1.1 -0.6 5.5 5.0 6.3 35.1 43.0 52.3
1977-78 -1.3 -1.2 4.3 4.1 3.6 34.1 41.3 49.0
1978-79 -2.5 -2.3 5.0 4.8 5.2 33.1 40.1 47.1
1979-80 -1.8 -1.7 4.1 4.0 4.6 33.5 40.5 43.9
1980-81 -2.9 -1.5 4.8 3.4 5.1 35.5 42.2 46.0
1981-82 -1.3 2.5 2.3 -1.5 3.3 38.0 45.4 46.2
1982-83 -1.4 2.9 3.0 -1.4 3.1 38.2 45.1 44.8
1983-84 -1.9 1.8 3.7 0.0 3.1 37.7 44.1 45.1
1984-85 -2.1 0.9 3.6 0.6 3.0 38.2 43.9 45.3
1985-86 -1.2 0.6 2.4 0.6 1.6 37.4 42.7 43.5
1986-87 -1.4 -1.2 2.0 1.9 0.9 37.0 41.6 41.0
1987-88 -0.4 -1.7 1.0 2.2 -0.7 36.8 40.6 36.8 74.0
1988-89 1.6 -1.0 -1.3 1.3 -3.0 36.1 40.2 30.5 79.0
1989-90 1.4 -1.4 -0.2 2.6 -1.3 35.4 39.4 27.7 70.9
1990-91 0.3 -1.2 1.0 2.6 -0.1 34.9 38.4 26.2 60.1
1991-92 -2.0 -1.5 3.7 3.3 2.3 33.8 38.1 27.4 52.8
1992-93 -5.6 -3.7 7.4 5.5 5.8 32.7 36.3 31.4 40.2
1993-94 -6.3 -4.0 7.7 5.4 6.9 31.8 35.4 36.5 29.7
1994-95 -4.8 -3.3 6.2 4.7 5.2 33.0 36.4 40.1 28.9
1995-96 -3.3 -2.4 4.7 3.8 4.2 33.6 37.2 41.9 21.6
1996-97 -2.7 -2.2 3.4 2.8 2.9 34.0 36.4 42.5 17.7
1997-98 -0.1 -0.1 0.7 0.6 0.1 35.1 37.5 40.6 15.3
1998-99 1.2 0.9 -0.5 -0.2 -0.7 35.5 37.8 38.4 14.4
1999-00 2.2 1.7 -1.6 -1.1 -0.9 35.5 38.0 35.6 17.4
2000-01 2.4 1.6 -1.9 -1.1 -3.7 36.3 38.6 30.7 23.0
2001-02 1.2 0.9 0.0 0.2 0.4 35.8 37.8 29.7 29.6
2002-03 -1.0 -0.6 2.3 1.9 2.2 34.3 36.3 30.8 28.2
2003-04 -1.5 -1.2 2.9 2.6 3.3 34.3 36.5 32.1 28.5
2004-05 -1.6 -1.4 3.3 3.1 3.2 35.2 37.3 34.0 28.6
2005-06 -1.1 -0.9 2.9 2.8 3.2 35.9 38.3 35.3 28.7
2006-07 -0.4 -0.4 2.3 2.3 2.6 36.1 38.6 36.0 28.9
2007-08 -0.3 -0.6 2.4 2.6 1.5 36.4 38.6 36.5 28.9
2008-094 -3.5 -3.1 6.7 6.3 4.2 35.4 37.2 44.0 22.4Source: Office for National Statistics and HM Treasury
2 At end-March; GDP centred on end-March.3 At end-December; GDP centred on end-December.
Per cent of GDP
4 All measures are presented on the basis which excludes the temporary effect of financial interventions for 2008-09 except net worth which is presented on the basis that includes financial interventions.
1 The outturn for the cyclically-adjusted measures are based on HM Treasury estimates of the output gap, and do not necessarily represent the OBR's view of the cyclical position of the economy between 2006-07 and 2009-10.
3742_05b_Annex_C.indd 104 22/6/10 00:24:07
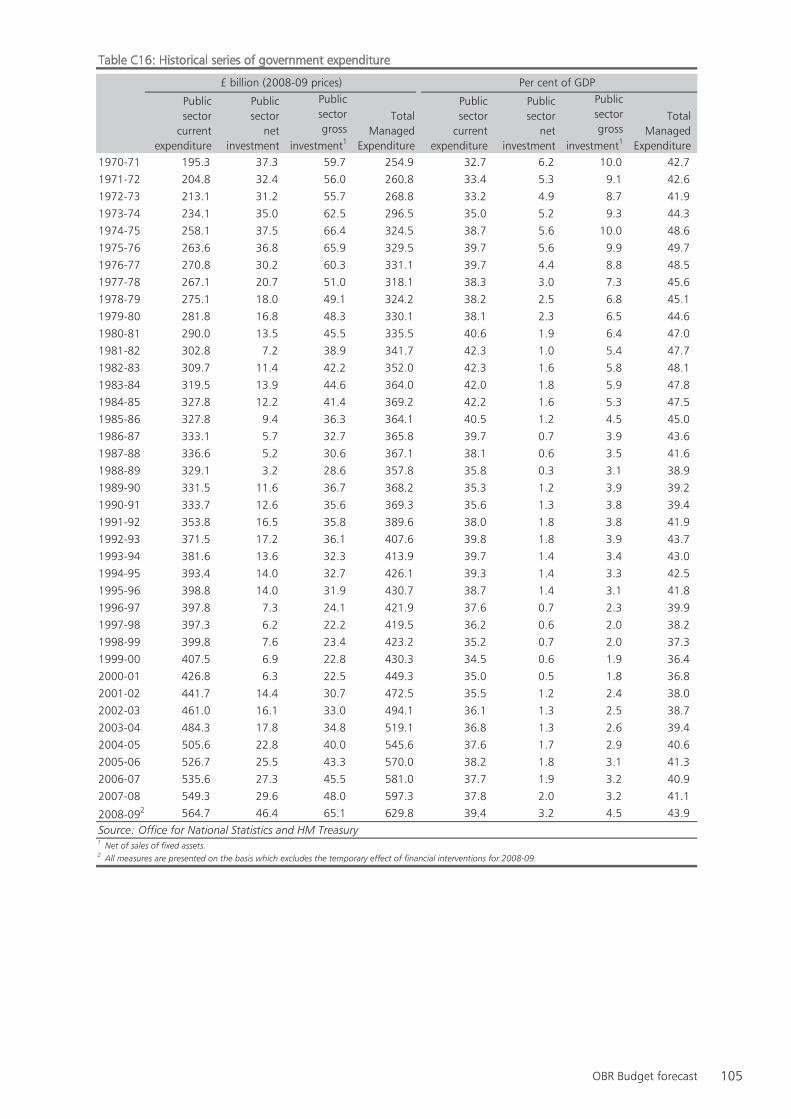
105OBR Budget forecast
Table C16: Historical series of government expenditure
Public sector
current expenditure
Public sector
net investment
Public sector gross
investment1
Total Managed
Expenditure
Public sector
current expenditure
Public sector
net investment
Public sector gross
investment1
Total Managed
Expenditure1970-71 195.3 37.3 59.7 254.9 32.7 6.2 10.0 42.7
1971-72 204.8 32.4 56.0 260.8 33.4 5.3 9.1 42.6
1972-73 213.1 31.2 55.7 268.8 33.2 4.9 8.7 41.9
1973-74 234.1 35.0 62.5 296.5 35.0 5.2 9.3 44.3
1974-75 258.1 37.5 66.4 324.5 38.7 5.6 10.0 48.6
1975-76 263.6 36.8 65.9 329.5 39.7 5.6 9.9 49.7
1976-77 270.8 30.2 60.3 331.1 39.7 4.4 8.8 48.5
1977-78 267.1 20.7 51.0 318.1 38.3 3.0 7.3 45.6
1978-79 275.1 18.0 49.1 324.2 38.2 2.5 6.8 45.1
1979-80 281.8 16.8 48.3 330.1 38.1 2.3 6.5 44.6
1980-81 290.0 13.5 45.5 335.5 40.6 1.9 6.4 47.0
1981-82 302.8 7.2 38.9 341.7 42.3 1.0 5.4 47.7
1982-83 309.7 11.4 42.2 352.0 42.3 1.6 5.8 48.1
1983-84 319.5 13.9 44.6 364.0 42.0 1.8 5.9 47.8
1984-85 327.8 12.2 41.4 369.2 42.2 1.6 5.3 47.5
1985-86 327.8 9.4 36.3 364.1 40.5 1.2 4.5 45.0
1986-87 333.1 5.7 32.7 365.8 39.7 0.7 3.9 43.6
1987-88 336.6 5.2 30.6 367.1 38.1 0.6 3.5 41.6
1988-89 329.1 3.2 28.6 357.8 35.8 0.3 3.1 38.9
1989-90 331.5 11.6 36.7 368.2 35.3 1.2 3.9 39.2
1990-91 333.7 12.6 35.6 369.3 35.6 1.3 3.8 39.4
1991-92 353.8 16.5 35.8 389.6 38.0 1.8 3.8 41.9
1992-93 371.5 17.2 36.1 407.6 39.8 1.8 3.9 43.7
1993-94 381.6 13.6 32.3 413.9 39.7 1.4 3.4 43.0
1994-95 393.4 14.0 32.7 426.1 39.3 1.4 3.3 42.5
1995-96 398.8 14.0 31.9 430.7 38.7 1.4 3.1 41.8
1996-97 397.8 7.3 24.1 421.9 37.6 0.7 2.3 39.9
1997-98 397.3 6.2 22.2 419.5 36.2 0.6 2.0 38.2
1998-99 399.8 7.6 23.4 423.2 35.2 0.7 2.0 37.3
1999-00 407.5 6.9 22.8 430.3 34.5 0.6 1.9 36.4
2000-01 426.8 6.3 22.5 449.3 35.0 0.5 1.8 36.8
2001-02 441.7 14.4 30.7 472.5 35.5 1.2 2.4 38.0
2002-03 461.0 16.1 33.0 494.1 36.1 1.3 2.5 38.7
2003-04 484.3 17.8 34.8 519.1 36.8 1.3 2.6 39.4
2004-05 505.6 22.8 40.0 545.6 37.6 1.7 2.9 40.6
2005-06 526.7 25.5 43.3 570.0 38.2 1.8 3.1 41.3
2006-07 535.6 27.3 45.5 581.0 37.7 1.9 3.2 40.9
2007-08 549.3 29.6 48.0 597.3 37.8 2.0 3.2 41.1
2008-092 564.7 46.4 65.1 629.8 39.4 3.2 4.5 43.9Source: Office for National Statistics and HM Treasury1 Net of sales of fixed assets.
Per cent of GDP£ billion (2008-09 prices)
2 All measures are presented on the basis which excludes the temporary effect of financial interventions for 2008-09.
3742_05b_Annex_C.indd 105 22/6/10 00:24:07

106 OBR Budget forecast
3742_05b_Annex_C.indd 106 22/6/10 00:24:07
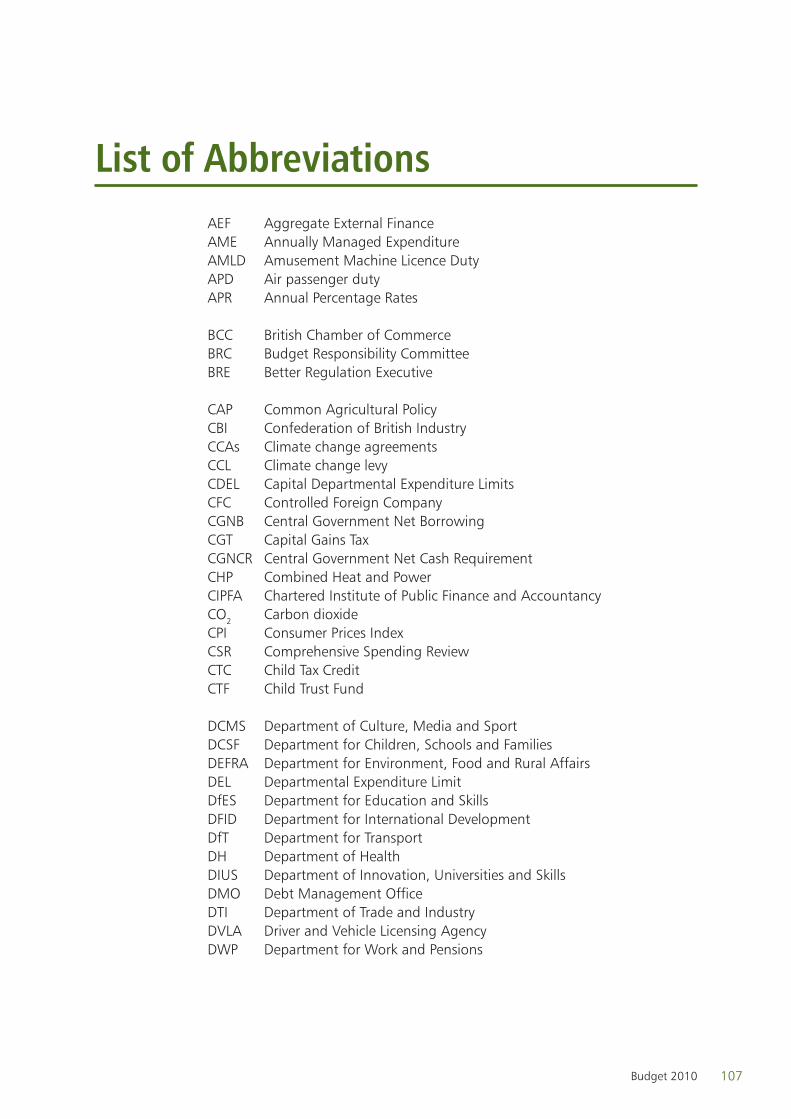
107Budget 2010
List of AbbreviationsAEF Aggregate External FinanceAME Annually Managed ExpenditureAMLD Amusement Machine Licence DutyAPD Air passenger dutyAPR Annual Percentage Rates
BCC British Chamber of CommerceBRC Budget Responsibility CommitteeBRE Better Regulation Executive
CAP Common Agricultural PolicyCBI Confederation of British IndustryCCAs Climate change agreementsCCL Climate change levyCDEL Capital Departmental Expenditure Limits CFC Controlled Foreign CompanyCGNB Central Government Net Borrowing CGT Capital Gains TaxCGNCR Central Government Net Cash RequirementCHP Combined Heat and PowerCIPFA Chartered Institute of Public Finance and AccountancyCO2 Carbon dioxideCPI Consumer Prices IndexCSR Comprehensive Spending ReviewCTC Child Tax CreditCTF Child Trust Fund
DCMS Department of Culture, Media and SportDCSF Department for Children, Schools and FamiliesDEFRA Department for Environment, Food and Rural AffairsDEL Departmental Expenditure LimitDfES Department for Education and SkillsDFID Department for International DevelopmentDfT Department for TransportDH Department of HealthDIUS Department of Innovation, Universities and Skills DMO Debt Management OfficeDTI Department of Trade and IndustryDVLA Driver and Vehicle Licensing AgencyDWP Department for Work and Pensions
3742_06_List of.indd 107 22/6/10 00:24:23
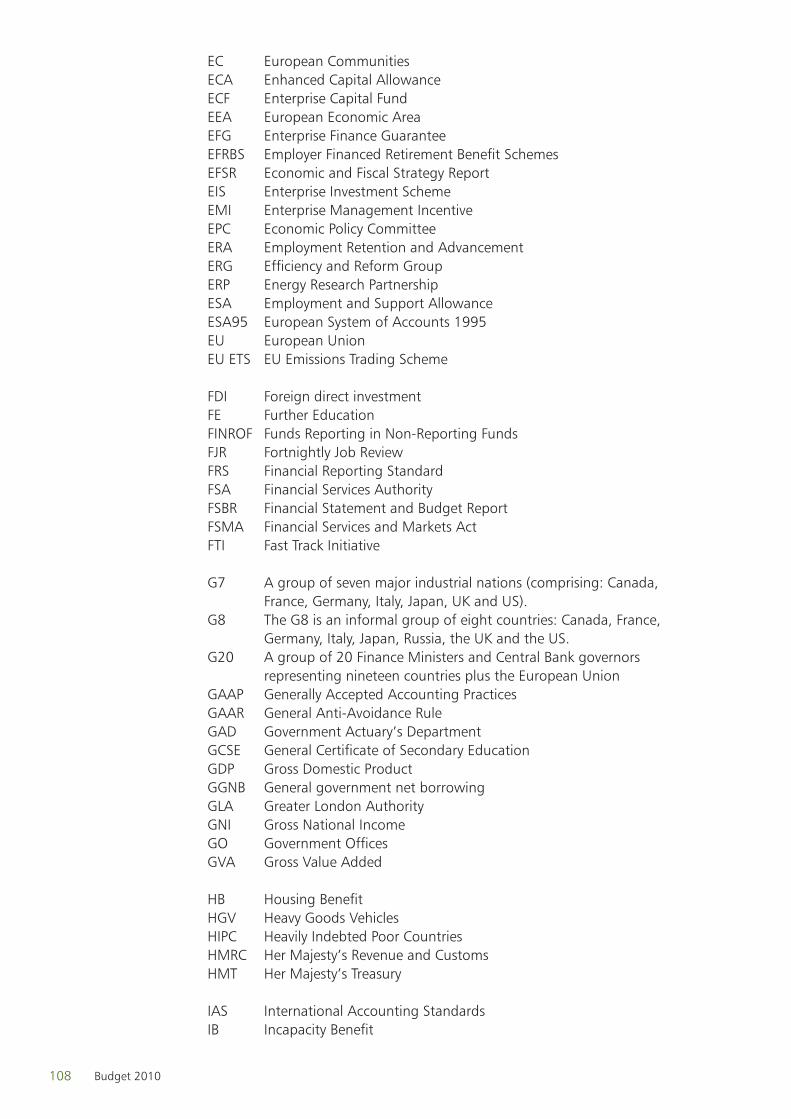
108 Budget 2010
EC European CommunitiesECA Enhanced Capital AllowanceECF Enterprise Capital FundEEA European Economic AreaEFG Enterprise Finance GuaranteeEFRBS Employer Financed Retirement Benefit SchemesEFSR Economic and Fiscal Strategy ReportEIS Enterprise Investment SchemeEMI Enterprise Management IncentiveEPC Economic Policy CommitteeERA Employment Retention and AdvancementERG Efficiency and Reform GroupERP Energy Research PartnershipESA Employment and Support AllowanceESA95 European System of Accounts 1995EU European UnionEU ETS EU Emissions Trading Scheme
FDI Foreign direct investmentFE Further EducationFINROF Funds Reporting in Non-Reporting FundsFJR Fortnightly Job ReviewFRS Financial Reporting StandardFSA Financial Services AuthorityFSBR Financial Statement and Budget ReportFSMA Financial Services and Markets ActFTI Fast Track Initiative
G7 A group of seven major industrial nations (comprising: Canada, France, Germany, Italy, Japan, UK and US).
G8 The G8 is an informal group of eight countries: Canada, France, Germany, Italy, Japan, Russia, the UK and the US.
G20 A group of 20 Finance Ministers and Central Bank governors representing nineteen countries plus the European Union
GAAP Generally Accepted Accounting PracticesGAAR General Anti-Avoidance Rule GAD Government Actuary’s DepartmentGCSE General Certificate of Secondary EducationGDP Gross Domestic ProductGGNB General government net borrowingGLA Greater London AuthorityGNI Gross National IncomeGO Government OfficesGVA Gross Value Added
HB Housing BenefitHGV Heavy Goods VehiclesHIPC Heavily Indebted Poor CountriesHMRC Her Majesty’s Revenue and CustomsHMT Her Majesty’s Treasury
IAS International Accounting StandardsIB Incapacity Benefit
3742_06_List of.indd 108 22/6/10 00:24:23
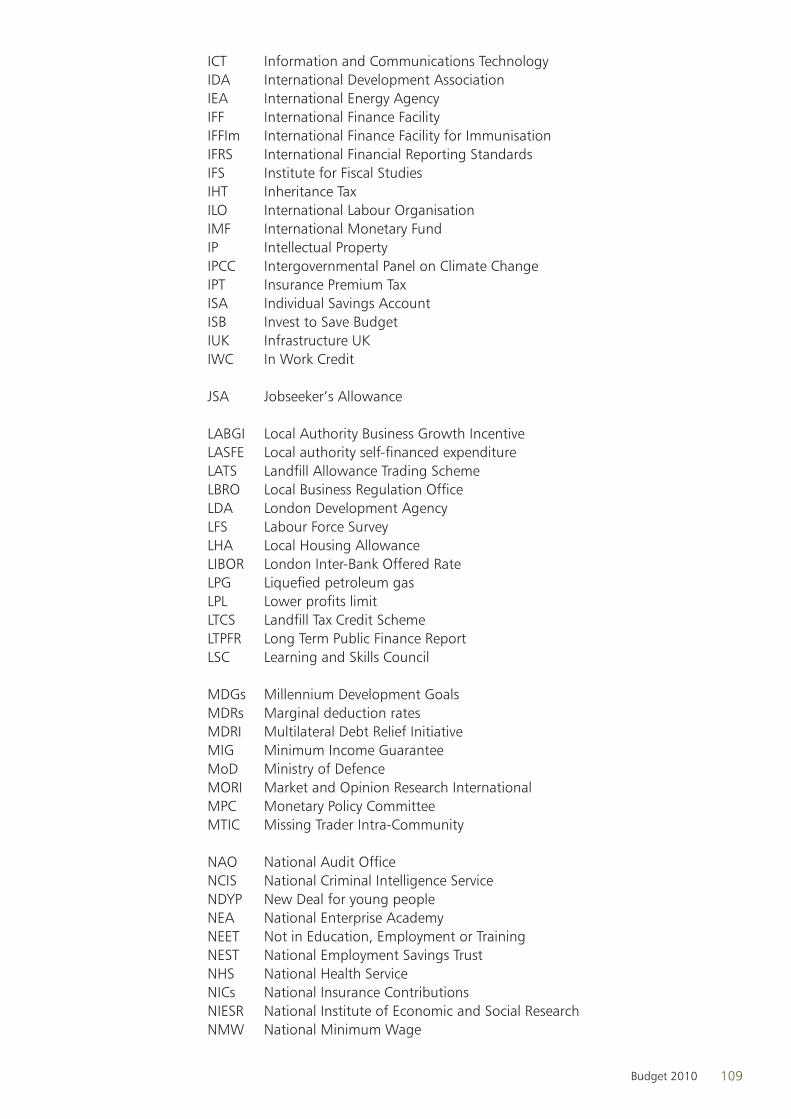
109Budget 2010
ICT Information and Communications TechnologyIDA International Development AssociationIEA International Energy AgencyIFF International Finance FacilityIFFIm International Finance Facility for ImmunisationIFRS International Financial Reporting StandardsIFS Institute for Fiscal StudiesIHT Inheritance TaxILO International Labour OrganisationIMF International Monetary FundIP Intellectual PropertyIPCC Intergovernmental Panel on Climate ChangeIPT Insurance Premium TaxISA Individual Savings AccountISB Invest to Save BudgetIUK Infrastructure UKIWC In Work Credit
JSA Jobseeker’s Allowance
LABGI Local Authority Business Growth IncentiveLASFE Local authority self-financed expenditureLATS Landfill Allowance Trading SchemeLBRO Local Business Regulation OfficeLDA London Development AgencyLFS Labour Force SurveyLHA Local Housing AllowanceLIBOR London Inter-Bank Offered RateLPG Liquefied petroleum gasLPL Lower profits limitLTCS Landfill Tax Credit SchemeLTPFR Long Term Public Finance Report LSC Learning and Skills Council
MDGs Millennium Development GoalsMDRs Marginal deduction ratesMDRI Multilateral Debt Relief InitiativeMIG Minimum Income GuaranteeMoD Ministry of DefenceMORI Market and Opinion Research InternationalMPC Monetary Policy CommitteeMTIC Missing Trader Intra-Community
NAO National Audit OfficeNCIS National Criminal Intelligence ServiceNDYP New Deal for young peopleNEA National Enterprise AcademyNEET Not in Education, Employment or TrainingNEST National Employment Savings Trust NHS National Health ServiceNICs National Insurance ContributionsNIESR National Institute of Economic and Social ResearchNMW National Minimum Wage
3742_06_List of.indd 109 22/6/10 00:24:23
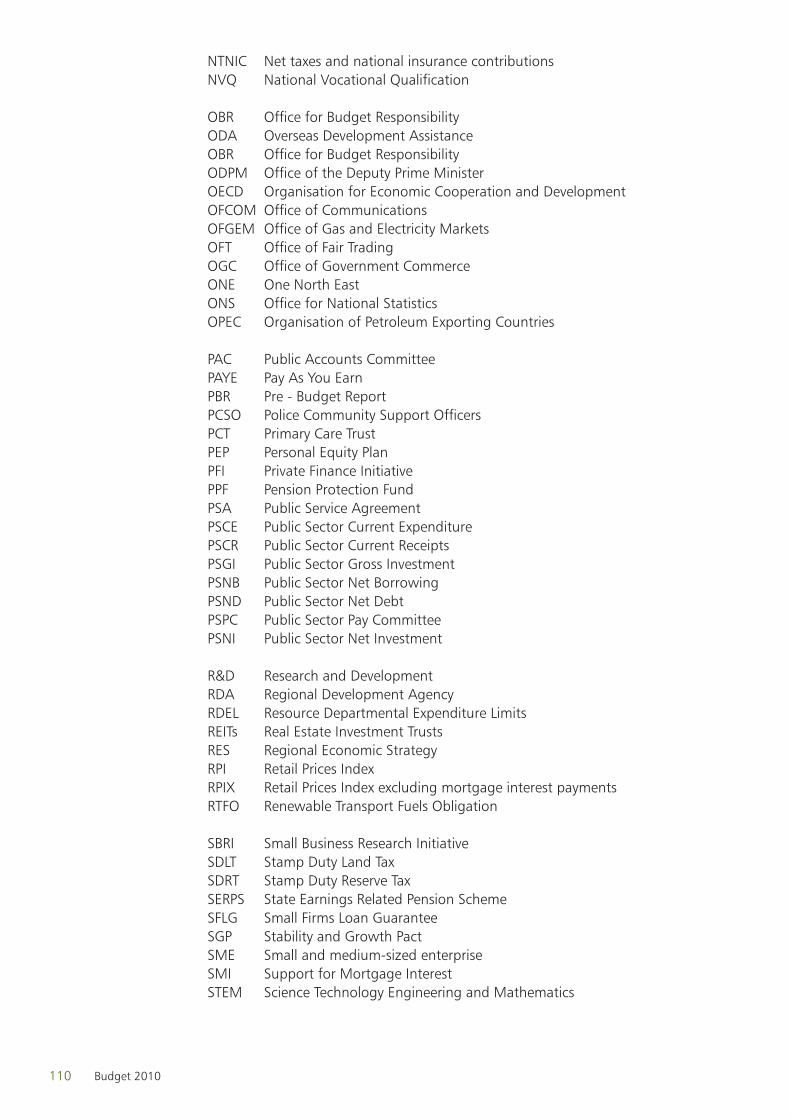
110 Budget 2010
NTNIC Net taxes and national insurance contributionsNVQ National Vocational Qualification
OBR Office for Budget ResponsibilityODA Overseas Development AssistanceOBR Office for Budget ResponsibilityODPM Office of the Deputy Prime MinisterOECD Organisation for Economic Cooperation and DevelopmentOFCOM Office of CommunicationsOFGEM Office of Gas and Electricity MarketsOFT Office of Fair TradingOGC Office of Government CommerceONE One North EastONS Office for National StatisticsOPEC Organisation of Petroleum Exporting Countries
PAC Public Accounts CommitteePAYE Pay As You EarnPBR Pre - Budget ReportPCSO Police Community Support OfficersPCT Primary Care TrustPEP Personal Equity PlanPFI Private Finance InitiativePPF Pension Protection FundPSA Public Service AgreementPSCE Public Sector Current ExpenditurePSCR Public Sector Current ReceiptsPSGI Public Sector Gross InvestmentPSNB Public Sector Net BorrowingPSND Public Sector Net DebtPSPC Public Sector Pay CommitteePSNI Public Sector Net Investment
R&D Research and DevelopmentRDA Regional Development AgencyRDEL Resource Departmental Expenditure LimitsREITs Real Estate Investment TrustsRES Regional Economic StrategyRPI Retail Prices IndexRPIX Retail Prices Index excluding mortgage interest paymentsRTFO Renewable Transport Fuels Obligation
SBRI Small Business Research InitiativeSDLT Stamp Duty Land TaxSDRT Stamp Duty Reserve TaxSERPS State Earnings Related Pension SchemeSFLG Small Firms Loan GuaranteeSGP Stability and Growth PactSME Small and medium-sized enterpriseSMI Support for Mortgage InterestSTEM Science Technology Engineering and Mathematics
3742_06_List of.indd 110 22/6/10 00:24:23
111Budget 2010
TME Total Managed ExpenditureTOR Terms of Reference TSB Technology Strategy Board
UKTI UK Trade and Investment
VAT Value Added TaxVCT Venture Capital TrustVED Vehicle Excise Duty
WGA Whole of Government AccountsWTC Working Tax Credit
LIST OF TABLESExecutive Summary Table A: Summary of the Budget policy decisions
1.1 Total consolidation plans over the forecast period1.2 Summary of OBR’s central economic forecast1.3 Overview of OBR fiscal forecast
2.1 Budget policy decisions 2.2 Departmental Expenditure limits – resource and capital budgets 2.3 Total Managed Expenditure2.4 Measures announced at the March 2010 Budget or earlier which take
effect from April 2011 or later2.5 The Civil list
A1 Illustrative examples of Income Tax and National Insurance paid per year, by income level
A2 Illustrative examples of a family’s tax credit entitlement per year, by income level
A3 The effect of Government reforms on high marginal deduction rates
B1 Reconciliation of PSNB and CGNCRB2 Financial interventions and Bank of England schemes – impact on
CGNCRB3 Financing requirement forecast
C1 Fiscal forecast overviewC2 Detailed summary of central economic forecastC3 Contributions to GDP growth C4 Quarterly GDP growth profileC5 Determinants of the fiscal forecastC6 Fiscal aggregatesC7 Components of net borrowingC8 Estimates of fiscal multipliersC9 Changes to the fiscal aggregates since the pre-Budget forecastC10 Changes to the fiscal forecast
3742_06_List of.indd 111 22/6/10 00:24:23
112 Budget 2010
C11 Current receipts C12 Changes to current receipts since OBR pre-Budget forecastC13 Total Managed ExpenditureC14 Changes to Total Managed Expenditure since the OBR pre-Budget
forecastC15 Historical series of public sector balances, receipts and debtC16 Historical series of government expenditure
LIST OF CHARTS
Executive Summary, chart 1. Government spending 2010-11 Executive Summary, chart 2. Government receipts
1.1 Private sector debt in the UK1.2 Receipts and expenditure1.3 Consolidation in the cyclically-adjusted current surplus 1.4 Path of public sector net debt1.5 Illustrative long term projections
A1 Impact of all measures on taxes and benefits in cash terms (£ a year), by income distribution (2012-13)
A2 Impact of all measures as a per cent of net income by income distribution (2012-13)
A3 Additional tax due to indirect tax Budget measures in cash terms (£ a year), by expenditure distribution (2012-13)
A4 Additional tax due to indirect tax Budget measures as a percentage of net income, by expenditure deciles (2012-13)
A5 Impact of Child Benefit freeze and above indexation increase in child element of Child Tax Credit in cash terms (£ a year), by income deciles (2012-13)
A6 Impact of Child Benefit freeze and above indexation increase in child element of Child Tax Credit as a percentage of net income, by income deciles (2012-13)
C1 Percentage change on a year earlierC2 The output gapC3 Percentage change on year earlierC4 Public Sector net Borrowing (PSNB) fan chart C5 Receipts and expenditureC6 Cyclically Adjusted Current Budget (CACB) fan chart
3742_06_List of.indd 112 22/6/10 00:24:23