budget execution report - minecofin · budget execution report january ... projections reflecting...
TRANSCRIPT
MINISTRY OF FINANCE AND ECONOMIC PLANNING
Budget Execution
Report January – March 2015
June 2015
Office of the Chief Economist
Macroeconomic Policy Unit
1
CONTENTS
CONTENTS ------------------------------------------------------------------------------------------------------------ 1
I. INTRODUCTION ------------------------------------------------------------------------------------------- 2
II. FISCAL PERFORMANCE IN THE THIRD QUARTER OF FY 2014/15 ------------ 2
A. Domestic Revenue -------------------------------------------------------------------------------------------- 3
1. Tax Revenue ----------------------------------------------------------------------------------------------------------------- 4
2. Non Tax Revenue --------------------------------------------------------------------------------------------------------- 5
B. Grants --------------------------------------------------------------------------------------------------------------- 6
C. Expenditures and Net Lending -------------------------------------------------------------------- 7
1. Recurrent Expenditures ------------------------------------------------------------------------------------------- 7
2. Capital Expenditures ----------------------------------------------------------------------------------------------- 8
3. Net Lending ----------------------------------------------------------------------------------------------------------------- 9
D. Deficit and Financing ---------------------------------------------------------------------------------- 9
III. Sector Performance for the period January-March for the
2014/2015 Fiscal Year--------------------------------------------------------------------------------- 11
IV. CONCLUSION --------------------------------------------------------------------------------------------- 17
TABLES
Table 1. Domestic revenue (billion FRw) ----------------------------------------------------------- 4
Table 2. Budget Support Disbursements (in million USD) ------------------------------ 6
Table 3. Expenditures and net lending (billion FRw) ------------------------------------ 7
Table 4. Financing (billion FRw) ------------------------------------------------------------------------ 10
Table 5. Operations of the Central Government (provisional) ------------------- 20
FIGURES
Figure 1. Domestic Government Securities (billion Rwf) ----------------------------- 11
Figure 2. Fiscal performance -------------------------------------------------------------------------------- 18
Figure 3. Tax Revenue Collections ---------------------------------------------------------------------- 19
2
I. INTRODUCTION
1. Rwanda’s economic performance remains strong. On the
international scene, global growth remains moderate at 3.5
percent in 2015, as reflected The International Monetary Fund’s
(IMF) April 2015 World Economic Outlook, albeit with uneven
prospects across countries and regions. Rwanda’s economy remains
strong, with growth at 7.6 percent in the first quarter of 2015,
boding well for achieving the forecasted 6.5 percent growth for
the year. Inflation remained subdued, in the single digits, and
lower compared to regional peers. Headline inflation at end May
2015 stood at 2.2 percent, slightly up compared to the first
four months on account on increased food, housing and energy
prices.
2. Fiscal performance in the first half of FY 2014/15 (July-
December 2014) was moderate. Tax revenue collections were
slightly lower than projections mainly on account of lower than
expected yields on revenue measures. While current spending was
on track, capital spending and net lending fell short of
projections reflecting delays in project implementations and the
completion of KCC. The lower than projected spending resulted
into a lower deficit and moderate deposits accumulation in the
banking system. With some of the issues that plagued capital
spending in the first half being addressed, it was expected that
spending would pick up in the second half.
II. FISCAL PERFORMANCE IN THE THIRD QUARTER OF FY 2014/15
3. Performance in the third quarter aligned to the revised FY
2014/15. To reflect changes in revenue sources, the 2014/15
budget was revised upwards from FRw 1,753.3 billion to FRw
1,762.3. Changes in the budget included a downward revision of
3
budget support, increase in domestic borrowing, and some
expenditure reallocations.
4. Projections for the third quarter of FY 2014/15 assumed a
pick-up in economic activity allowing for higher domestic
revenue collections and accelerated spending on investment
projects to further boost growth. Although fiscal performance
throughout the first half of the fiscal year fell short of
expectations on domestic revenue collection and absorptive
capacity to implement investment projects, a pickup was expected
during the second half, starting in the third quarter. Total
revenue 1 and grants were projected at FRw 369.8 billion, with
total expenditures and net lending set at FRw 432.3 billion and
clearance of arrears worth FRw 62.9 billion resulting into a
deficit on cash basis including grants of FRw 125.5 to be
financed externally to the tune of FRw 64.2 billion and FRw 61.3
billion domestically.
A. Domestic Revenue
5. Domestic revenue collections exceeded forecasts for the
quarter. The over performance in domestic revenue driven by
higher than projected reimbursements for peace keeping
operations overshadowed underperformance in tax revenue
collection. Local government tax collections most of which fell
due at the end of the quarter were on track. The lower
performance in tax revenue collections against forecast
reflected continued delays in revenue administration measures
translating into additional revenue inflows (Table 1).
1 The revenue projections referred to in this report are based on the FY
2014/15 revised budget submitted to Parliament.
4
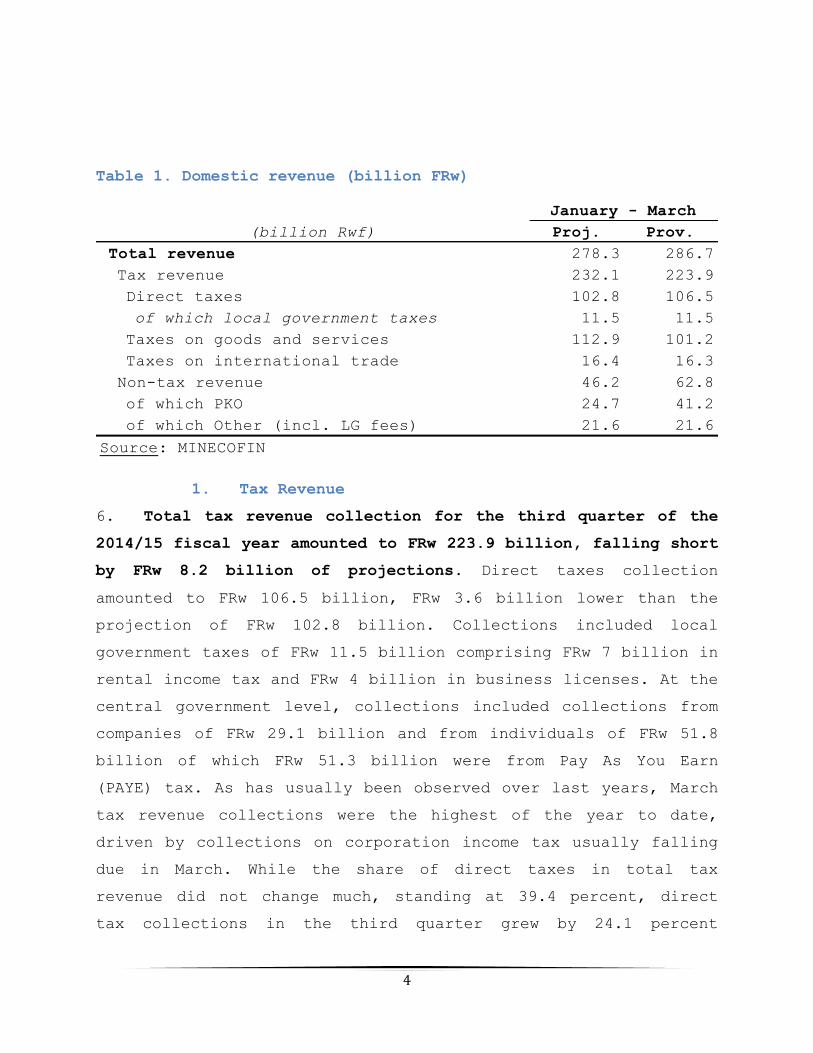
Table 1. Domestic revenue (billion FRw)
1. Tax Revenue
6. Total tax revenue collection for the third quarter of the
2014/15 fiscal year amounted to FRw 223.9 billion, falling short
by FRw 8.2 billion of projections. Direct taxes collection
amounted to FRw 106.5 billion, FRw 3.6 billion lower than the
projection of FRw 102.8 billion. Collections included local
government taxes of FRw 11.5 billion comprising FRw 7 billion in
rental income tax and FRw 4 billion in business licenses. At the
central government level, collections included collections from
companies of FRw 29.1 billion and from individuals of FRw 51.8
billion of which FRw 51.3 billion were from Pay As You Earn
(PAYE) tax. As has usually been observed over last years, March
tax revenue collections were the highest of the year to date,
driven by collections on corporation income tax usually falling
due in March. While the share of direct taxes in total tax
revenue did not change much, standing at 39.4 percent, direct
tax collections in the third quarter grew by 24.1 percent
(billion Rwf) Proj. Prov.
Total revenue 278.3 286.7
Tax revenue 232.1 223.9
Direct taxes 102.8 106.5
of which local government taxes 11.5 11.5
Taxes on goods and services 112.9 101.2
Taxes on international trade 16.4 16.3
Non-tax revenue 46.2 62.8
of which PKO 24.7 41.2
of which Other (incl. LG fees) 21.6 21.6
Source: MINECOFIN
January - March
5
compared to the same quarter in the previous fiscal year.
Indirect taxes collections amounted to FRw 101.2 billion, FRw
11.7 billion lower than the projection of FRw 112.9 billion.
Although falling short of target, collections of indirect taxes
in the third quarter were 3.9 percent higher compared to the
same quarter a year before and included collections of FRw 27.8
billion (27.6 percent of indirect taxes collections) in excises;
FRw 67.2 billion in value added tax (66.6 percent of indirect
taxes collections); and FRw 5.8 billion in road fund tax (5.8
percent of indirect taxes collections). Year on year growth in
value added tax in the third quarter at 6.9 percent was broadly
in line with real growth in final consumption expenditures of
over the period of 6 percent. International trade taxes
collections were FRw 16.3 billion, only FRw 0.1 billion lower
than the projection of FRw 16.4 billion. Import duties that
account for 96.1 percent of total international trade taxes grew
by 13.4 percent in the third quarter compared to the same
quarter a year before, while growth in total import value of
only 0.9 percent over the same period, possibly reflecting
collections resulting from imports of the end of 2014.
2. Non Tax Revenue
7. PKO reimbursement regularizations contributed to higher
than projected collections on non-tax revenues. Non tax revenue
collections for the third quarter of FY 2014/15 amounted to FRw
62.8 billion, including reimbursements for peace keeping
operations (PKO) of Rwanda Defense and Police forces abroad of
FRw 41.2 billion compared to FRw 24.7 billion that was
projected; and other non-tax collections of FRw 21.6 billion
including local government fees of about FRw 17.9 percent.
6
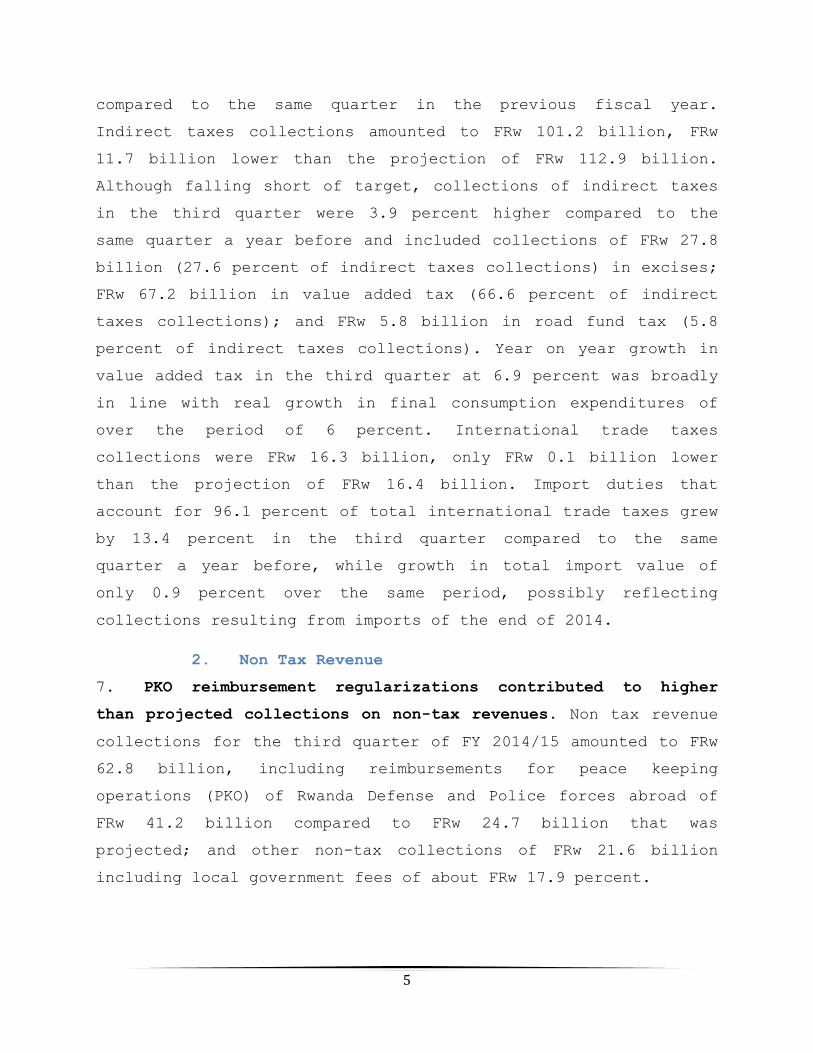
B. Grants
8. Both budget and project grants disbursements were broadly
in line with projections. Total project support disbursements
amounted to FRw 57.8 billion, matching projections. It is
however worthwhile pointing out that detailed information on
project grants expenditures is still very difficult to obtain.
Estimates provided draw on assumptions based on one hand on cash
disbursements for projects to accounts at the National Bank of
Rwanda (BNR) and on the other hand on the assumption that
disbursements are equally distributed in the first and second
half of the fiscal year. Total budget support disbursements
during the third quarter of FY 2014/15 amounted to FRw 25.5
billion against a projection of FRw 33.7 billion. Other than
exchange rate factors explaining differences between projections
and actual disbursements on budgetary grants; the main
differences came from lower than projected disbursements from
the United Kingdom’s for Agriculture, and Germany for
decentralization (Table 2).
Table 2. Budget Support Disbursements (in million USD)
Donor Proj. Prov.
DfID 28.4 11.4
Agriculture 17.0 0.0
Social Protection 11.4 11.4
Germany 1.5 0.0
RLDSF 1.5 0.0
Global Fund 19.0 24.5
World Bank (loan) 70.0 0.0
Social Protection 70.0 0.0
Total 118.9 35.9
Source: MINECOFIN
January - March
7
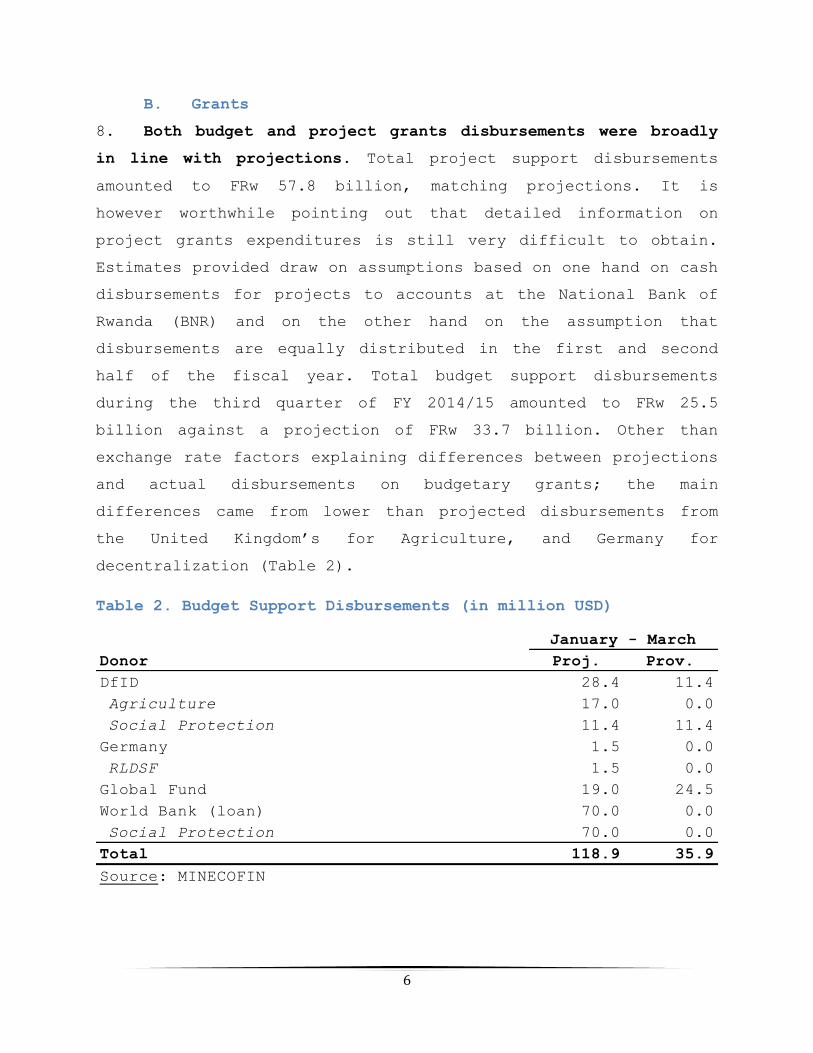
C. Expenditures and Net Lending
9. Total spending in the third quarter of FY 2014/15 was
broadly in line with projections, albeit with mixed performance.
Total expenditures and net lending amounted to FRw 432.7
billion, FRw 0.4 billion higher than projected. While current
expenditures and net lending performance fell below projections,
capital expenditures exceeded projections.
Table 3. Expenditures and net lending (billion FRw)
1. Recurrent Expenditures
10. Current spending fell short of projections. Total current
spending amounted to FRw 226.1 billion, FRw 5.1 billion lower
than the FRw 231.2 billion projected owing mainly to a
combination of lower than projected spending on wages and
salaries and transfers and higher than projected on goods and
services and exceptional expenditures.
(billion Rwf) Proj. Prov.
Total expenditure and net lending 432.3 432.7
Current expenditure 231.2 226.1
Wages and salaries 54.5 52.2
Purchases of goods and services 30.9 34.9
Interest payments 6.5 6.7
Domestic Int (paid) 2.6 4.6
External Int (due) 4.0 2.1
Transfers 111.3 98.4
of which expenditures on local government taxes29.3 29.3
Exceptional social expenditure 27.9 33.9
Capital expenditure 169.2 181.5
Domestic 91.7 104.0
Foreign 77.4 77.4
Net lending 31.9 25.1
Source: MINECOFIN
January - March
8
Wages and salaries payments in the third quarter amounted
to FRw 52.2 billion compared to FRw 54.5 billion projected for
the period. The lower than projected performance was due to
delayed hiring of staff that had been planned for the fiscal
year.
Goods and services spending amounted to FRw 34.9 billion,
FRw 3.9 billion higher than the projected FRw 30.9 billion. The
overspending was due to payments of ICT equipment and software,
consultancy services and maintenance and repairs for office
buildings and equipment.
Exceptional expenditures stood at FRw 33.9 billion, FRw 6
billion higher than projected, mostly driven by higher spending
on peace keeping operations expenditures as a result of new
deployments. Payments on other exceptional expenditures, for
demobilization and assistance, and Genocide survivors were
broadly on track.
Transfers and subsidies amounted to FRw 98.4 billion and
were FRw 12.9 billion lower than projections. The delays were
mainly due to low payments on international subscriptions for
some Organizations as well as transfers to other agencies.
Interest payments amounted to FRw 6.7 billion, slightly
higher than the projection of FRw 6.5 billion. The FRw 0.2
billion over performance was a combination of excess spending on
domestic interest payment by FRw 2 billion and lower spending on
external interest payment by FRw 1.9 billion.
2. Capital Expenditures
11. Capital expenditures performance in the third quarter of FY
2014/15 was very strong. Total capital expenditures amounted to
FRw 181.5 billion of which FRw 104 billion were capital
9
expenditures domestically financed and FRw 77.4 billion
externally financed. Domestically financed capital spending
exceeded projections by FRw 12.3 billion, reflecting a
resumption of projects that had experienced delays throughout
the first half.
3. Net Lending
12. Lower than projected use of the proceeds of the Eurobond
affected net lending performance. Net lending in the third
quarter of FY 2014/15 amounted to FRw 25.1 billion against a
projection of FRw 31.9 billion reflecting the net effect of
higher than anticipated spending on strategic investments and
subsidies to Rwandair; and no spending on KCC as construction
works delayed.
D. Deficit and Financing
13. The fiscal deficit was much lower than projected during the
third quarter of FY 2014/15. At the end of the quarter, the
deficit on payment order basis (including grants) was only FRw
0.2 billion higher than projections. Accumulation of arrears
during the quarter amounting to FRw 23.4 billion instead of the
planned reduction of FRw 62.9 billion led to a much lower fiscal
deficit on cash basis (including grants) than was projected
(Table 5). Lower than expected budgetary disbursement led to
accumulation of arrears as commitments in agriculture and social
protections were made in anticipation of disbursements from the
World Bank and the UK – they are now expected to be cleared
during the fourth quarter. The budget closed with a deficit on
cash basis of FRw 39.3 billion compared to a deficit of FRw
125.5 billion that was projected (Table 4). Financing of the
deficit came on one hand from foreign sources to the tune of FRw
18.3 billion compared to FRw 64.2 billion that was planned,
10
reflecting lower budgetary loan disbursements than planned (FRw
48.2 billion). On the other hand, domestic financing stood at
FRw 21 billion against FRw 61.3 billion that was planned,
reflecting lower drawdown on bank deposits and securities
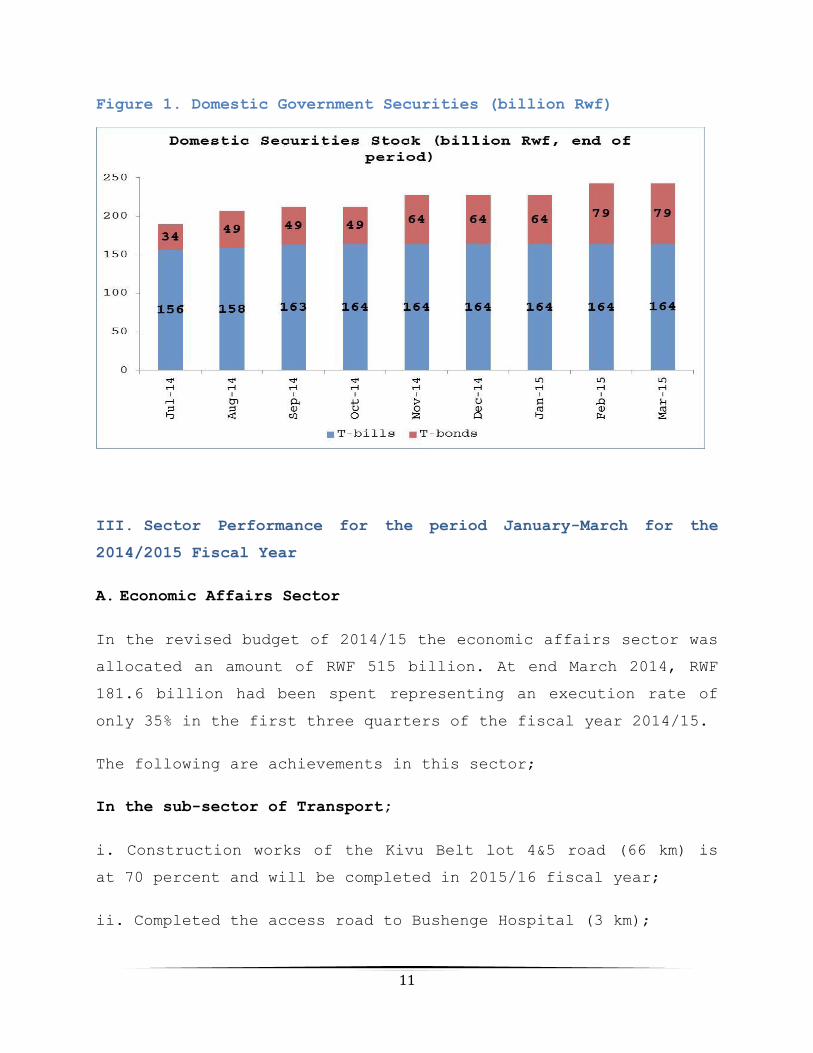
issuance. The stock of securities over the quarter increased by
FRw 15 billion, reflecting the planned Treasury bond issuance
(Figure 1).
Table 4. Financing (billion FRw)
(billion Rwf) Proj. Prov.
Financing 125.5 39.3
Foreign financing (net) 64.2 18.3
Drawings 67.9 19.7
Budgetary loan 48.2 0.0
Project loans 19.7 19.7
Amortization (due) -3.7 -1.3
Domestic financing 61.3 21.0
Banking system (Monetary Survey) 57.8 17.9
Non bank (Net) 3.6 0.7
Gvnt Securities (Net) 15.0 5.8
Non Bank Sector Debt Repayment -11.4 -5.1
Errors and ommissions 0.0 2.5
Source: MINECOFIN
January - March
11
Figure 1. Domestic Government Securities (billion Rwf)
III. Sector Performance for the period January-March for the
2014/2015 Fiscal Year
A. Economic Affairs Sector
In the revised budget of 2014/15 the economic affairs sector was
allocated an amount of RWF 515 billion. At end March 2014, RWF
181.6 billion had been spent representing an execution rate of
only 35% in the first three quarters of the fiscal year 2014/15.
The following are achievements in this sector;
In the sub-sector of Transport;
i. Construction works of the Kivu Belt lot 4&5 road (66 km) is
at 70 percent and will be completed in 2015/16 fiscal year;
ii. Completed the access road to Bushenge Hospital (3 km);
12
iii. Construction works of Muhanga – Ngororero - Mukamira (99
km) road are ongoing at 75 percent;
iv. Constructed the access road to Mugombwa Refugee camp;
v. Maintained the road Ndatemwa - Muhura (23 km);
vi. Completed the detailed study of Muhanga - Karongi
rehabilitation and negotiations for funds will be carried out in
2015/16 fiscal year;
Vii. Construction works of the road CIMERWA - Bugarama are at 80
percent;
viii. Completed Rusumo One Border Post;
ix. Completed the runway for Kamembe Airport
In the sub- sector of Energy;
I. Electricity connectivity was increased by 2 percent and
50,000 new households was connected whereby access to
electricity reached 21 percent;
ii. Transmission lines increased by 318.9 km of MV lines, 517.6
km of LV and 140.4 km of HV;
ii. Construction works of Rusumo Hydro Power Plant that will
give 80 MW are on track and the plant is expected to be
completed in 2019;
iv. Negotiations for a new methane project are ongoing as
planned and expected to be completed by June 2015.
In the sub-sector of Water and Sanitation, the total primary
spending to water and sanitation sector, was 6.4 billion at the
13
end March. Execution was at 30.3 per cent against the total
revised allocated budget 2014/2015 amounted 21.1 billion. Keys
achievements are as follow:
i. Constructed 149.3 Km of water pipe line in Rubavu, Rulindo
and Nyamagabe and that supplied clean drinking water to 152,869
households;
ii. Construction works of 66Km water pipe line in
Rulindo expected supply 28,250 is at 75% and will be
completed by June 2015;
iii. Upgraded 47 Km in urban areas, Nasho - Ngoma, Cyampirita -
Gatsibo, Katabogamua - Nyagatare;
iv. Reinforced water system in Nkombo and construction
of Mbona – Nyabirasi - Kivumu water pipeline are ongoing;
v. Construction works of Runda Water supply system are at
advanced stage;
vi. Introduced the e-payment system to facilitate the
payment of water consumption bills using mobile money and
electronic banking
In the sub-sector of agriculture, the total revised budget
2014/2015 allocated was 60 billion. At the end of the third
quarter in March 15.1 billion was spent this represents an
execution rate of 25.3%. The following are the key achievements:
i. A total number of 16,115 ha of radical terraces and 44,499 ha
of progressive terraces were constructed;
ii. The number of marshland irrigation constructed was 750ha and
construction works of new 1,270 ha are under way;
14
iii. The number of hillside irrigation reached 1,095 ha
that was constructed and prepared for maize and vegetables
cultivation.
iv. Livestock development has been enhanced through GIRINKA
Programme whereby 13,658 animals were distributed to poor
families. Also the number of artificially inseminated cows was
94,868;
v. The feeder roads network improved whereby 117 km were
constructed in 2014/15 fiscal year.
vi. The number of students undertaking specialized
training in agriculture increased whereby 106 students were
sent to Israel for specialization in irrigation,
agribusiness and horticulture.
In the sub-sector of Trade and Industry, basing on the 2014/2015
revised budget allocated to this sector amounted of 58.4
billion; the total spending at the end March was 33.8 billion,
at which comes 57.9 per cent as an execution rate. The following
are the key achievements:
i. In order to facilitate national Exporters to access foreign
markets , 90 exporters have been trained in handcrafts,
honey, bananas, pineapple, Nuts, essential oil, flour and
light and 16 exporters have been supported to attend the Uganda
and Germany trade fairs;
ii. The Market Infrastructure Master Plan was completed
and Implementation Plans for Districts are being developed;
iii. Relocation of industries from Gikondo Park is ongoing as
planned;
15
iv. Completed expropriation for five provincial industrial parks
of Huye, Rusizi, Nyabihu, Bugesera and Rwamagana.
v. In order to help new entrepreneurs to access finance
to start their businesses, 1500 Start - up toolkits were
provided.
B. Education Sector
The total primary spending in the education sector at the end
March of the 2014/15 fiscal year amounted to RWF 151.8 billion
which represented about 70.8% of the approved budget of RWF
214.4 billion. The following are the key achievements in the
sector:
i. In pre-primary education, 1260 kits were distributed in 1260
nursery schools and one teacher from each school was trained.
Also enrolment has increased by nearly 12% in 2014 and the
number of institutions increased by 17%;
ii. In primary education, the Government continued to increase
the number of class rooms and 1,609 new classrooms and 2,604
latrines were built in line with the intention to increase
education for all children and expanding access to 12 years of
basic education
iii. For secondary education, 19 new schools were created and
new classrooms were equipped with 24,840 desks;
iv. The number of TVET center’s increased from 306 in 2013 to
365 in 2014. Also the number of trainees enrolled in TVET
programmes increased from 83,893 students in 2013 to 93,024
students in 2014; and the number of trainers in TVET centres
increased from 3,020 trainers in 2013 to 3,595 trainers in 2014;
16
v. In order to strengthen the performance in science,
technology and innovation at all levels of education, and
application of science, technology and innovation in relevant
sectors of the economy, 274 12YBE schools with sciences
combination received science practical examination materials;
vi. 274 12YBE schools with sciences combination received science
practical examination materials. Hence, 658 teachers from
these schools were trained on skills related to
preparation of practical experiments and administration of
practical exams.
vii. In tertiary education, 22.5% of tertiary students
are in science and technology fields, of which 34% in
agriculture and health sciences;
Viii. The University of Rwanda was established and merged the
former 7 Higher Learning Institutions to improve the quality of
education;
C. Health sector
The total spending in the Health sector at the end of March
amounted to 95.6 billion compared to 2014/2015 revised budget
that amounted to 200.1 billion. That represents an execution
rate of 47.8 %. Below are the achievements for the sector:
i. The construction and rehabilitation works at
various Hospitals are ongoing (Nyabikenke Hospital
stands at 30%, Rutare modern health center at 82% and
Nyagatare Hospital at 74% while the Architectural
and technical design for Ruhengeri Hospital was completed
and the construction works will begin next Fiscal Year.
17
ii. In order to ensure quality and availability of human
resources for health, deployment of qualified nurses,
Midwives, Medical Doctors, and Specialists in health
facilities continued across the country, including in new
provincial and referral hospitals.
iii. For District pharmacies to comply with national
standards, 5 District Pharmacies (Gatsibo, Nyagatare,
Nyaruguru, Ruhango and Muhanga) are under construction
and the work progress is estimated at 80%.
iv. The availability of vital medical products in health
facilities has improved and on average 100 % of Health
facilities (District pharmacies and District hospitals) reported
less than 5% of vital medical products stocked-outs
IV. CONCLUSION
14. Fiscal performance in the third quarter of FY 2014/15 was
broadly on track. Spending performance was mixed but portraying
resumption in capital spending that had been delayed in the
first half of the year. Revenue performance remained dismal
however. Continued good economic performance is expected to
boost revenue collections in the fourth quarter and spending is
expected to remain on track, allowing closing the fiscal year as
planned.
18
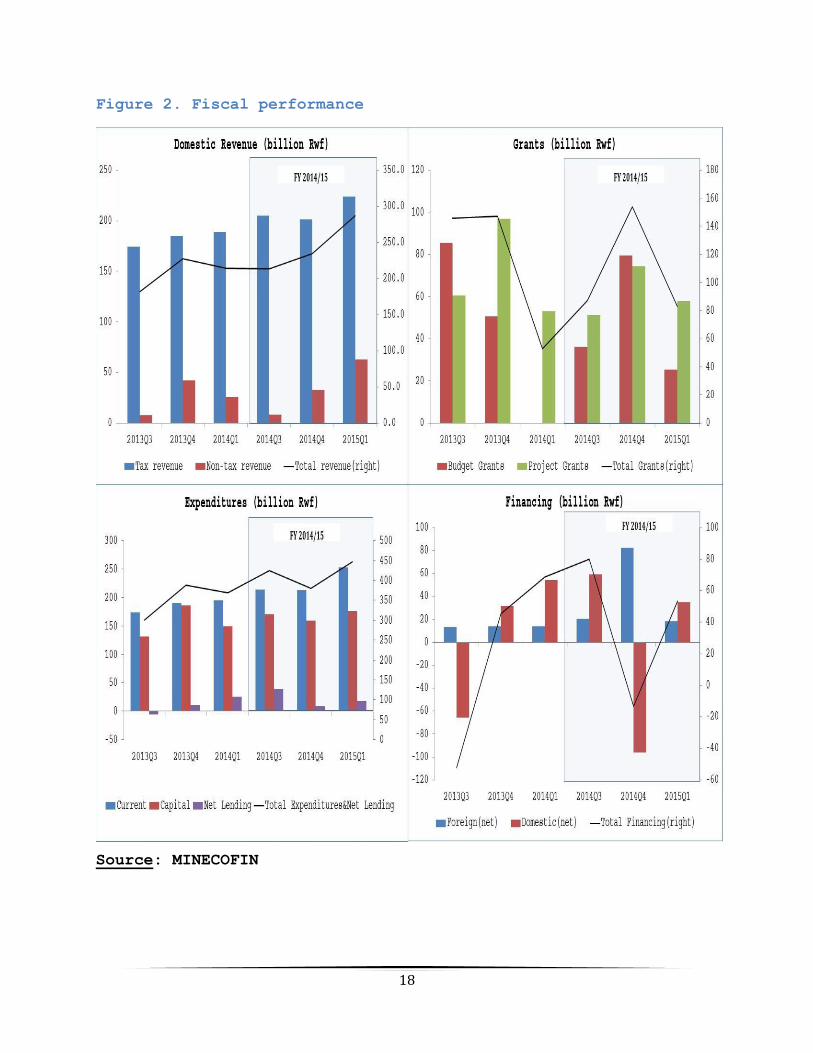
Figure 2. Fiscal performance
Source: MINECOFIN
19
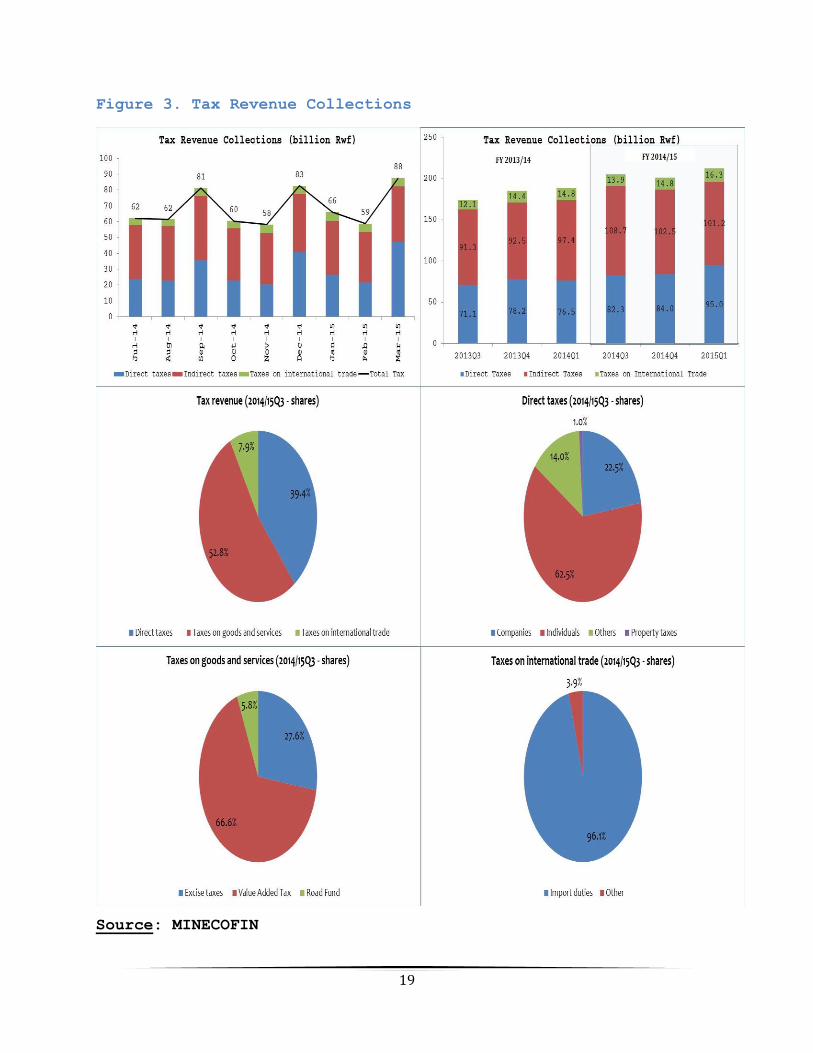
Figure 3. Tax Revenue Collections
Source: MINECOFIN
20
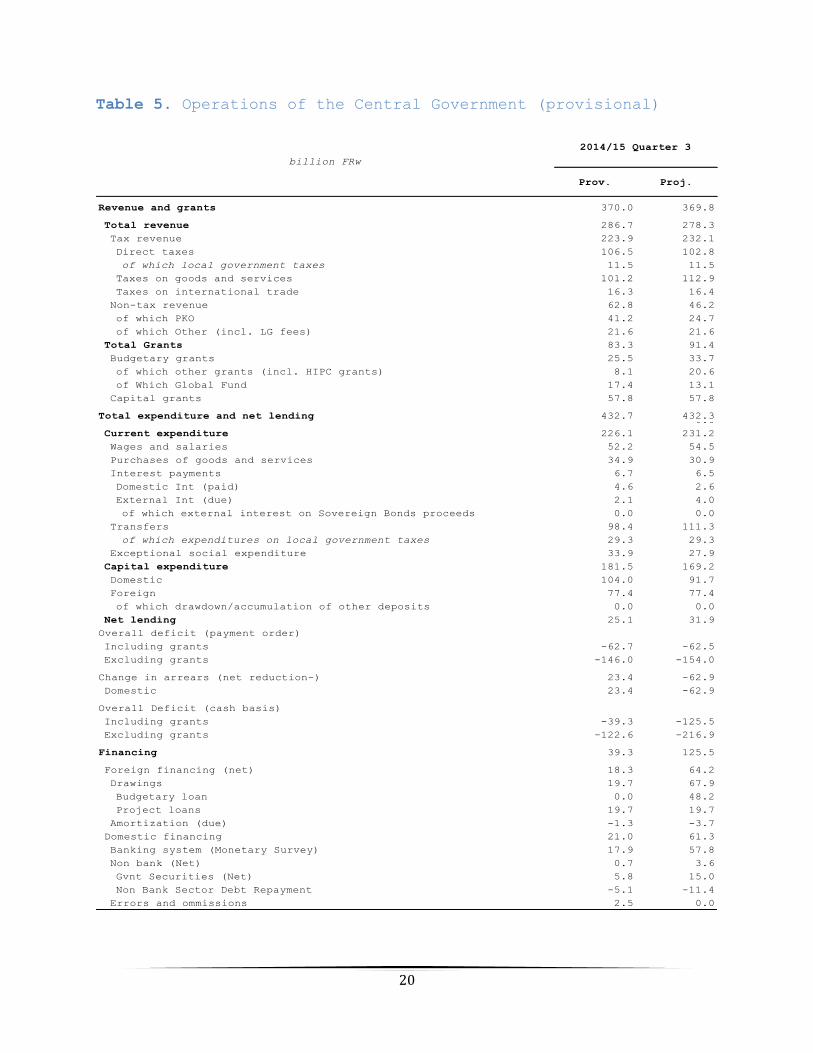
Table 5. Operations of the Central Government (provisional)
Prov. Proj.
Revenue and grants 370.0 369.8
Total revenue 286.7 278.3
Tax revenue 223.9 232.1
Direct taxes 106.5 102.8
of which local government taxes 11.5 11.5
Taxes on goods and services 101.2 112.9
Taxes on international trade 16.3 16.4
Non-tax revenue 62.8 46.2
of which PKO 41.2 24.7
of which Other (incl. LG fees) 21.6 21.6
Total Grants 83.3 91.4
Budgetary grants 25.5 33.7
of which other grants (incl. HIPC grants) 8.1 20.6
of Which Global Fund 17.4 13.1
Capital grants 57.8 57.8
Total expenditure and net lending 432.7 432.30.0
Current expenditure 226.1 231.2
Wages and salaries 52.2 54.5
Purchases of goods and services 34.9 30.9
Interest payments 6.7 6.5
Domestic Int (paid) 4.6 2.6
External Int (due) 2.1 4.0
of which external interest on Sovereign Bonds proceeds 0.0 0.0
Transfers 98.4 111.3
of which expenditures on local government taxes 29.3 29.3
Exceptional social expenditure 33.9 27.9
Capital expenditure 181.5 169.2
Domestic 104.0 91.7
Foreign 77.4 77.4
of which drawdown/accumulation of other deposits 0.0 0.0
Net lending 25.1 31.9
Overall deficit (payment order)
Including grants -62.7 -62.5
Excluding grants -146.0 -154.0
Change in arrears (net reduction-) 23.4 -62.9
Domestic 23.4 -62.9
Overall Deficit (cash basis)
Including grants -39.3 -125.5
Excluding grants -122.6 -216.9
Financing 39.3 125.5
Foreign financing (net) 18.3 64.2
Drawings 19.7 67.9
Budgetary loan 0.0 48.2
Project loans 19.7 19.7
Amortization (due) -1.3 -3.7
Domestic financing 21.0 61.3
Banking system (Monetary Survey) 17.9 57.8
Non bank (Net) 0.7 3.6
Gvnt Securities (Net) 5.8 15.0
Non Bank Sector Debt Repayment -5.1 -11.4
Errors and ommissions 2.5 0.0
billion FRw
2014/15 Quarter 3