budget execution: tracking progress and controlling funds - case studies parminder brar, fm anchor...
TRANSCRIPT

Budget Execution: Tracking Progress and Controlling Funds - Case Studies
Parminder Brar, FM AnchorBudget Management and Financial Accountability CourseMarch 1-2, 2004

The World Bank
Outline
Case Study 1: India : Why India? Bank lending of around $1.5 bn. Is 1.29% of GoI’s budget, and around 0.6% of general government spending. Supporting budget management reform is critical for achieving MDG’s. Budget Management System based upon Treasury Single Account and reimbursement to commercial banks.
Case Study 2: Nigeria : Why Nigeria? Cash management crucial for budget management. Role of CBN in budget management. Budget management based upon cash advances and multiplicity of bank accounts and banks for each agency.
Conclusion

The World Bank
Case 1: India – Expenditure Trends
Trend of GOI Expenditure1999-2000
0
10000
20000
30000
40000
50000
60000
Apr May June Jul Aug Sep Oct Nov Dec Jan Feb Mar
Rs
. C
r.
Plan Non Plan
Trend of GOI Expenditure 2000-2001
0
10000
20000
30000
40000
50000
60000
Apr May June Jul Aug Sep Oct Nov Dec Jan Feb Mar
Rs
. C
r.
Plan Non Plan
Trend of GOI Expenditure 1997/98
0
5000
10000
15000
20000
25000
30000
35000
40000
45000
50000
Apr May June Jul Aug Sep Oct Nov Dec Jan Feb Mar
Rs
. C
r.
Plan Non Plan
Trend of GOI Expenditure 1998-99
0
10000
20000
30000
40000
50000
60000
Apr May June Jul Aug Sep Oct Nov Dec Jan Feb Mar
Rs
. C
r.
Plan Non Plan
Annual expenditure trends are remarkably similar.
* Rs. 1 crore = Rs.10 million.

The World Bank
Case 1: India – Expenditure Trends
GOI's Cumulative Expenditure Trend
0%
20%
40%
60%
80%
100%
120%
Per
cen
t o
f Act
ual
s
1996-97 7% 13% 21% 27% 32% 39% 46% 52% 61% 73% 81% 100%
1997-98 6% 12% 20% 27% 33% 39% 46% 53% 61% 71% 79% 100%
1998-99 7% 13% 21% 28% 34% 43% 50% 56% 64% 74% 81% 100%
1999-00 6% 11% 20% 27% 34% 42% 49% 56% 64% 74% 80% 100%
2000-01 5% 12% 18% 25% 32% 40% 47% 56% 63% 73% 81% 100%
2001-02 (Prov.) 5% 10% 18% 26% 33% 40% 48% 56% 65% 74% 82% 100%
2002-03 5% 11%
Apl May Jun Jul Aug Sep Oct Nov Dec Jan Feb Mar
18% 21%22%Quarterly Trend 35%
Annual expenditure trends are remarkably similar.

The World Bank
Case 1: India – Overall Expenditure
Share of GOI Expenditure: Plan and Non Plan
27% 25% 24% 26% 25% 28% 28%
73% 75% 76% 74% 75% 72% 72%
0%
10%
20%
30%
40%
50%
60%
70%
80%
90%
100%
1996/97 1997-98 98/99 99/00 00/01 01/02(Prov.) 02/03 (BE)
Pe
rce
nt
of
Ac
tua
ls
Plan Non Plan
Around 75% of GOI expenditure is recurrent (Non Plan) and the rest is capital (Plan) *.
* There could be some overlap in capital and recurrent expenditure between Plan and Non Plan.

The World Bank
Case 1: India – Non Plan Trend
Non Plan Expenditure Trend (Cumulative)
0%
10%
20%
30%
40%
50%
60%
70%
80%
90%
100%
1996-97 8% 13% 23% 30% 34% 42% 48% 54% 62% 76% 83% 100%
1997-98 6% 13% 21% 27% 32% 39% 46% 53% 62% 72% 80% 100%
1998-99 7% 13% 22% 29% 35% 44% 50% 56% 64% 75% 81% 100%
1999-00 6% 12% 20% 27% 34% 42% 49% 56% 63% 75% 80% 100%
2000-01 5% 11% 16% 24% 31% 39% 47% 56% 63% 75% 82% 100%
2001-02 (Prov.) 5% 10% 18% 27% 34% 41% 49% 57% 66% 77% 84% 100%
2002-03 6% 12%
Apl May Jun Jul Aug Sep Oct Nov Dec Jan Feb Mar
18% 25%23%Quarterly Trend
34%
Annual trends of recurrent expenditure are remarkably similar.

The World Bank
Case 1: India – Non Plan Expenditure
Non Plan Expenditure Shares
0%
10%
20%
30%
40%
50%
60%
70%
80%
90%
1997-98 1998-99 1999-2000 2000-2001 2001-2002 (Prov.) 2002-03 (% of BE)
Per
cen
t o
f N
on
Pla
n
Interest Payments (40%) Ministry of Defence (26%)
Department of Food & Public Distribution (7%) Transfers to State and UT Governments (6%)
Department of Fertilisers (4%) Police (4%)
Department of Agriculture and Cooperation (0%) Pensions (1%)
Department of Secondary and Higher Education (1%)

The World Bank
Case 1: India - Plan expenditure
Plan Expenditure Trend (Cumulative)
0%
20%
40%
60%
80%
100%
120%
Per
cen
t o
f Act
ual
s
1996-97 4% 11% 16% 20% 27% 33% 39% 47% 56% 66% 76% 100%
1997-98 5% 9% 18% 27% 33% 40% 47% 54% 61% 69% 78% 100%
1998-99 5% 12% 17% 23% 33% 42% 49% 57% 64% 70% 78% 100%
1999-00 4% 10% 19% 28% 36% 42% 50% 56% 65% 71% 79% 100%
2000-01 4% 14% 23% 28% 37% 43% 49% 55% 61% 68% 76% 100%
2001-02 (Prov.) 4% 11% 18% 24% 31% 38% 46% 52% 62% 69% 78% 100%
2002-03 4% 10%
Apl May Jun Jul Aug Sep Oct Nov Dec Jan Feb Mar
24%20%18%Quarterly Trend 38%
Around 40% of capital expenditure is spent in the last quarter.

The World Bank
Case 1: India – Plan expenditure
Plan Expenditure (Share of Actuals)
0%
10%
20%
30%
40%
50%
60%
70%
80%
97-98 1998-99 1999-2000 2000-01 2001-02 (Prov.) 2002-03(% of BE)
Transfers to State and UT's (37%) Rural Development (9%) Department of Education (6%)
Ministry of Power (3%) Ministry of Railways (5%) Department of Family Welfare (4%)
Ministry of Road Transport (6%) Ministry of Social Justice (1%) Department of Women and Child Dev. (2%)

The World Bank
Case 1: India - Ministry trendsThe Indian Rope Trick:
Plan Expenditure of the Ministry of Power
3%
7%
1%
5%
2%
6%
2%
7%
4%
8%
11%
44%
-5%
0%
5%
10%
15%
20%
25%
30%
35%
40%
45%
50%
April May June July Aug Sept Oct Nov Dec Jan Feb March
Pe
rce
nt
of
Ac
tua
ls
01-02 00-01 99-00 98-99 97/98

The World Bank
Case 1: India - Ministry trendsThe Peaks:
Plan Expenditure of Department of Road Transport
0%3%
1%
5%
18%20%
1%
7%
51%
2%
6%
-10%
0%
10%
20%
30%
40%
50%
60%
70%
April May June July Aug Sept Oct Nov Dec Jan Feb March
Pe
rce
nt
of
Ac
tua
ls
01-02 00-01 99-00 98-99 97/98

The World Bank
Case 1: India - Ministry trendsThe Rolling Hills:
Plan Expenditure of the Department of Family Welfare
5%
7%
18%
1% 2%
5%
22%
7%
22%
3% 3%
6%
-5%
0%
5%
10%
15%
20%
25%
30%
35%
40%
April May June July Aug Sept Oct Nov Dec Jan Feb March
Pe
rce
nt
of
Ac
tua
ls
01-02 00-01 99-00 98-99 97/98

The World Bank
Case 1: India - Ministry trendsThe Stress Reliever:
Transfers to States and UT's
7%
6%
8%8% 7%
8%7%
9%
7%
9%
5%
19%
0%
5%
10%
15%
20%
25%
April May June July Aug Sept Oct Nov Dec Jan Feb March
Pe
rce
nt
of
Ac
tua
ls
01-02 00-01 99-00 98-99 97/98

The World Bank
Case 1: India - ReceiptsTax receipts account for 60% of GOI receipts
GOI Receipts
70% 67%63% 66% 66%
60% 63%
24%27%
27%28% 27%
31% 26%
6% 6%10%
6% 7% 9% 11%
0%
10%
20%
30%
40%
50%
60%
70%
80%
90%
100%
96-97 97-98 98-99 99-00 00-01 01-02 (Prov.) 02-03(BE)
Tax Receipts (Net) Non-Tax Receipts Non Debt Capital Receipts

The World Bank
Case 1: India - ReceiptsReceipt trends are remarkably similar.
Trend of GOI's Total Receipts (Cumulative)
0%
10%
20%
30%
40%
50%
60%
70%
80%
90%
100%
Pe
rce
nt
of
Ac
tua
ls
1996-97 5% 10% 17% 23% 31% 41% 48% 55% 67% 74% 81% 100%
1997-98 3% 10% 16% 22% 29% 40% 48% 56% 71% 79% 85% 100%
1998-99 4% 8% 15% 21% 29% 37% 47% 53% 64% 74% 79% 100%
1999-00 0% 6% 13% 19% 28% 37% 46% 53% 64% 72% 79% 100%
2000-01 1% 8% 15% 22% 33% 42% 50% 56% 68% 73% 81% 100%
2001-02 (Prov.) 1% 4% 10% 16% 28% 39% 49% 55% 65% 72% 81% 100%
2002-03 (% of BE) 2% 6%
Apl May Jun Jul Aug Sep Oct Nov Dec Jan Feb Mar

The World Bank
Case 1: India - ReceiptsTax receipts have been overestimated for the last 7 years.
GOI Total Receipts
100,000
120,000
140,000
160,000
180,000
200,000
220,000
240,000
260,000
280,000
300,000
Rs.
Cr.
BE 142,394 166,722 176,903 203,928 227,211 258,909 274,785
RE 139,167 148,900 178,174 194,839 223,551 232,715
Actuals 134,275 143,131 166,017 193,368 206,796 222,859
1996-97 1997-98 1998-99 1999-00 2000-01 2001-02 (Prov.) 2002-03
+52,113 +31,698
+15,876
+51,926

The World Bank
Case 1: India - ReceiptsBudget Management challenges are partly due to overestimating receipts every year.
+8,856
+16,063+13,428+27,350
+22,886
+33,459+27,527
+18,773
+47,270
+31,060
GOI's Receipts, Expenditure and Deficit
0
50,000
100,000
150,000
200,000
250,000
300,000
350,000
400,000
450,000
Rs.
Cr.
Total Receipts 134,275 143,131 166,017 193,368 206,796 222,859 274,785
Total Expenditure 201,007 232,068 279,366 298,084 325,611 359,070 410,309
Fiscal Deficit 66,732 88,937 113,349 104,717 118,815 136,211 135,524
1996/97 1997-98 98/99 99/00 00/01 01/02 (Prov.) 02/03 (BE)
+51,239
+51,926
The World Bank
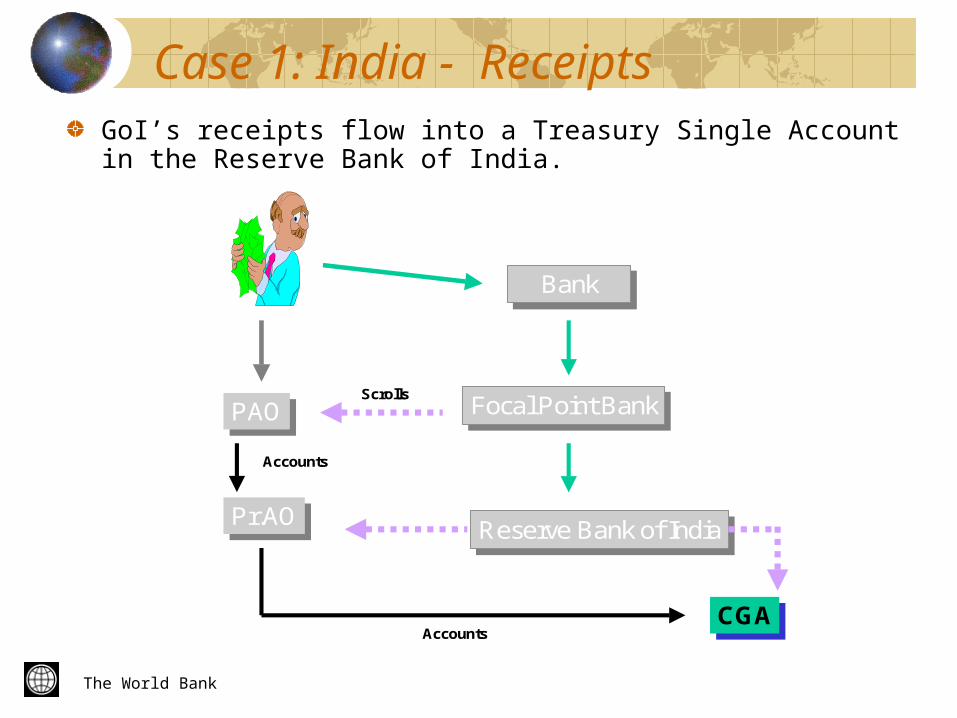
Case 1: India - Receipts
BankBank
Focal Point BankFocal Point Bank
Reserve Bank of IndiaReserve Bank of India
PAOPAO
Pr.AOPr.AO
CGACGA
Scrolls
Accounts
Accounts
GoI’s receipts flow into a Treasury Single Account in the Reserve Bank of India.

The World Bank
Case 1: India - Disbursements
D e a lin g B ra n c h
D e a lin g B ra n c h
F o c a l P o in t B a n kF o c a l P o in t B a n k
L in k C e llL in k C e ll
P A OP A O
P r .A OP r .A O
R e s e r v e B a n k o f In d iaR e s e r v e B a n k o f In d ia
S c ro lls
A c c o u n ts
P u t T h ru
C la im
C h e q u e
C G AC G A
R e im b u rs e m e n t
Disbursements are on the basis of reimbursement of funds to commercial banks. One Ministry deals with one bank.

The World Bank
Case 2: Nigeria - Receipts
Central Bank of Nigeria (CBN)
Consolidated Revenue Fund
Central CapitalFund
Federation Account
Health
Federal
State
Local
Sub Treasury (FPO Abuja)
Line Ministry Receipts
Oil Revenues
VAT
Customs
Roads
Ports
Internal Affairs
Education
etc.
Cash management is based on funds available in the CRF.

The World Bank
Case 2: Nigeria - Expenditures
DGBudget
OAGF
CBN
ConsolidatedRevenue Fund
Central CapitalFund
Warrant Mandate
Cash Back
58 Line Ministry’s
Authority to Incur Expenditure
37 Field Pay Offices Account No. 4 Receipts (Private Bank No. 3)
Account No. 1 Capital Exp.
Account No.3 Recurrent Exp.(Private Bank No.2)
Account No. 2 OH. Exp. (Private Bank No. 1)
Cash Back
Cash Management Committee
Disbursement system operates on the basis of cash advances to numerous banks.

The World Bank
Case 2: Nigeria – CRF Receipts
Nigeria : CRF 2003 : Receipts
77%
16%
7%
0%
10%
20%
30%
40%
50%
60%
70%
80%
90%
100%
Jan. Feb. Mar. Apr. May Jun. Jul. Aug. Sept. Oct. Nov. Dec. Ave.
Pe
rce
nt
NTB Statutory Other
77% of receipts are on account of Treasury Bonds.
* Provisional unaudited data

The World Bank
Case 2: Nigeria – CRF Expenditures
Nigeria : CRF 2003 : Disbursement
79%
5%
4%
1%
10%
1%
0%
10%
20%
30%
40%
50%
60%
70%
80%
90%
100%
Jan. Feb. Mar. Apr. May Jun. Jul. Aug. Sept. Oct. Nov. Dec. Ave.
Per
cen
t
NTB Regular Capital Overhead Pension Salaries Other
79% of disbursements are on account of Treasury Bonds.
* Provisional unaudited data

The World Bank
Case 2: Nigeria – Net TB Support
Nigeria : Consolidated Revenue Fund 2003 : Net Position
-200
-100
0
100
200
300
400
500
600
700
Jan. Feb. Mar. Apr. May Jun. Jul. Aug. Sept. Oct. Nov. Dec.
Nia
ra (
Tr.)
NTB Receipts NTB Disbursements Net
In FY 03 - in ten out of twelve months NTB operations reduced monthly cash balances.
* Provisional unaudited data

The World Bank
Case 2: Nigeria – Non NTB Disbursements
Nigeria : CRF 2003: Disbursements
0
10
20
30
40
50
60
Regular Capital Overhead Pension Salaries Other
Nia
ra (
Tr.
)
Jan. Feb. Mar. Apr. May Jun. Jul. Aug. Sept. Oct. Nov. Dec.
In FY 03 – Cash constraints severely impacted capital and recurrent expenditures.
* Provisional unaudited data

The World Bank
Conclusion
Poor budgeting can aggravate stress of budget management (India).Unpredictability of fund flows can severely impact project performance (Nigeria). Multitude of bank accounts result in sub optimal cash management (Nigeria).Are there robust systems for linking financial progress with physical progress?Does flow of funds result in better outcomes?