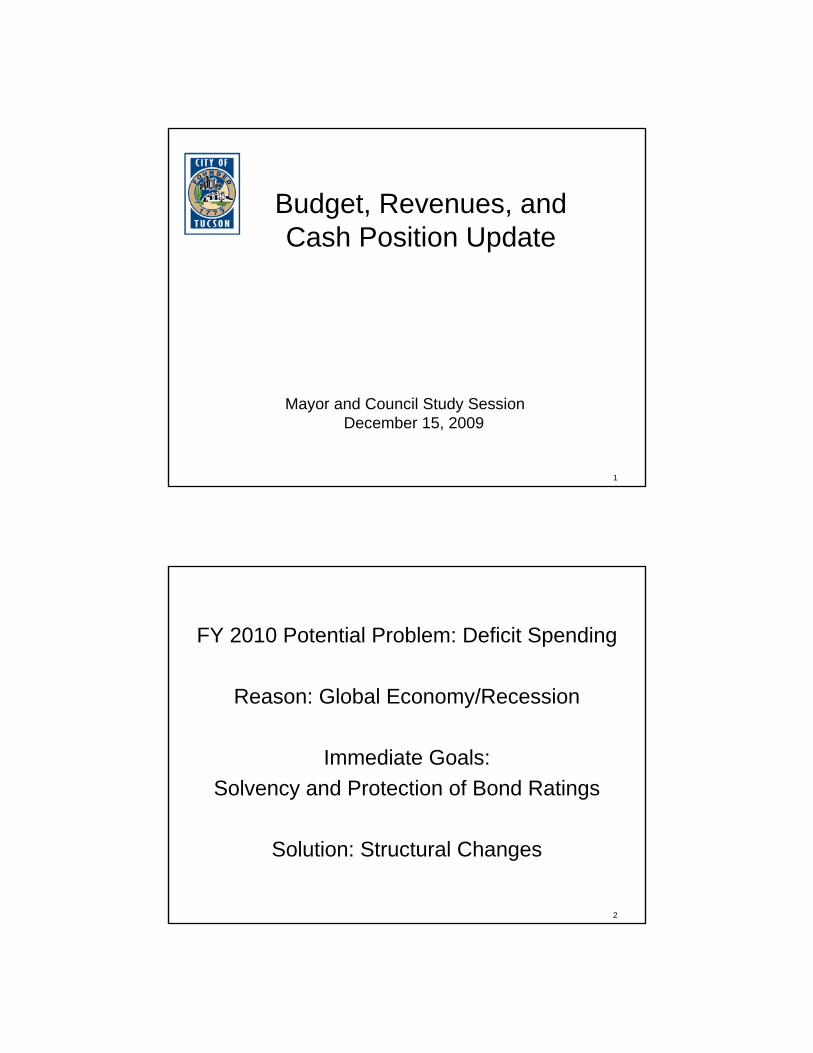
budget, revenues, and cash position update
TRANSCRIPT
1
Budget, Revenues, and Cash Position Update
Mayor and Council Study SessionDecember 15, 2009
2
FY 2010 Potential Problem: Deficit Spending
Reason: Global Economy/Recession
Immediate Goals: Solvency and Protection of Bond Ratings
Solution: Structural Changes
3
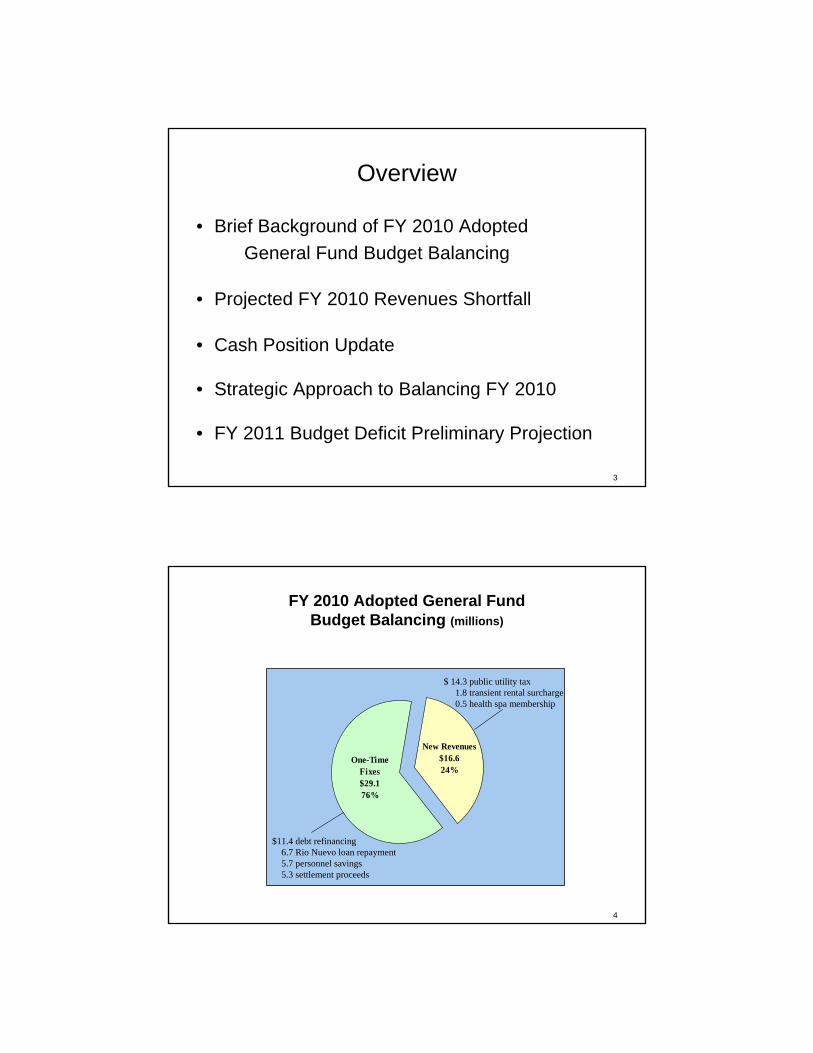
Overview
• Brief Background of FY 2010 AdoptedGeneral Fund Budget Balancing
• Projected FY 2010 Revenues Shortfall
• Cash Position Update
• Strategic Approach to Balancing FY 2010
• FY 2011 Budget Deficit Preliminary Projection
4
FY 2010 Adopted General Fund Budget Balancing (millions)
One-Time Fixes$29.176%
New Revenues $16.624%
$11.4 debt refinancing6.7 Rio Nuevo loan repayment5.7 personnel savings5.3 settlement proceeds
$ 14.3 public utility tax1.8 transient rental surcharge0.5 health spa membership
5
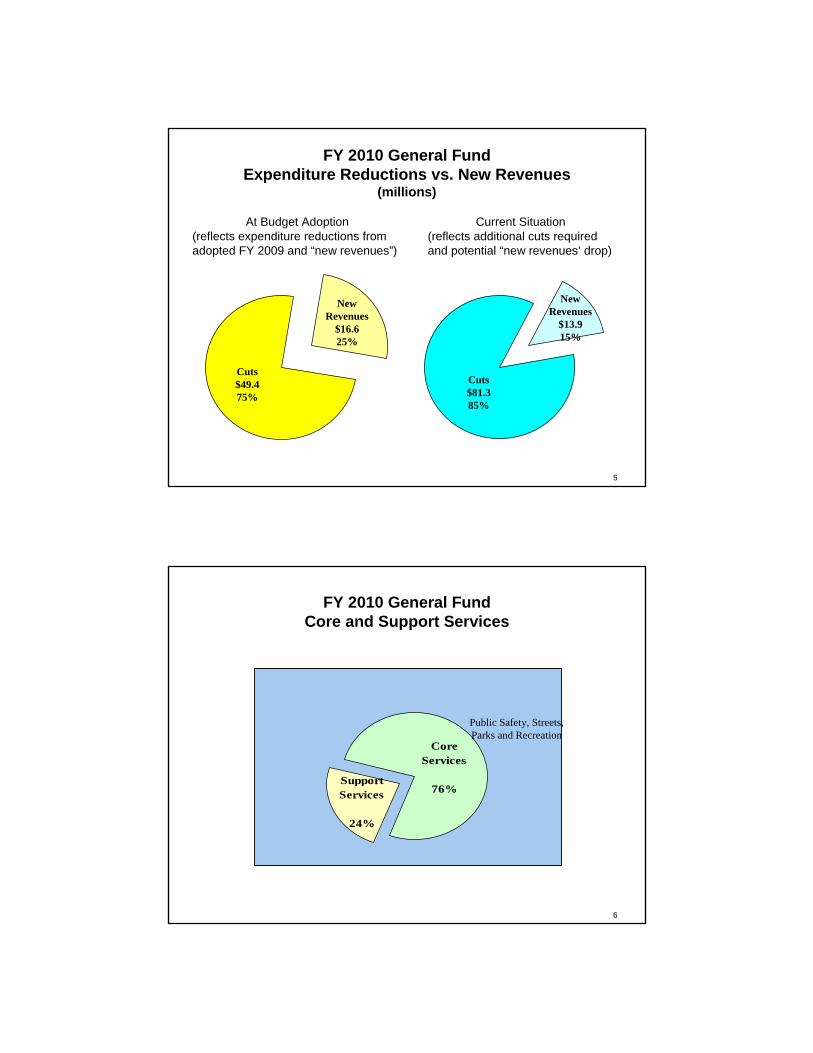
FY 2010 General FundExpenditure Reductions vs. New Revenues
(millions)
Cuts$49.4 75%
New Revenues
$16.6 25%
Cuts$81.3 85%
New Revenues
$13.9 15%
At Budget Adoption(reflects expenditure reductions from adopted FY 2009 and “new revenues”)
Current Situation(reflects additional cuts required and potential “new revenues’ drop)
6
FY 2010 General Fund Core and Support Services
Support Services
24%
Core Services
76%
Public Safety, Streets, Parks and Recreation
7
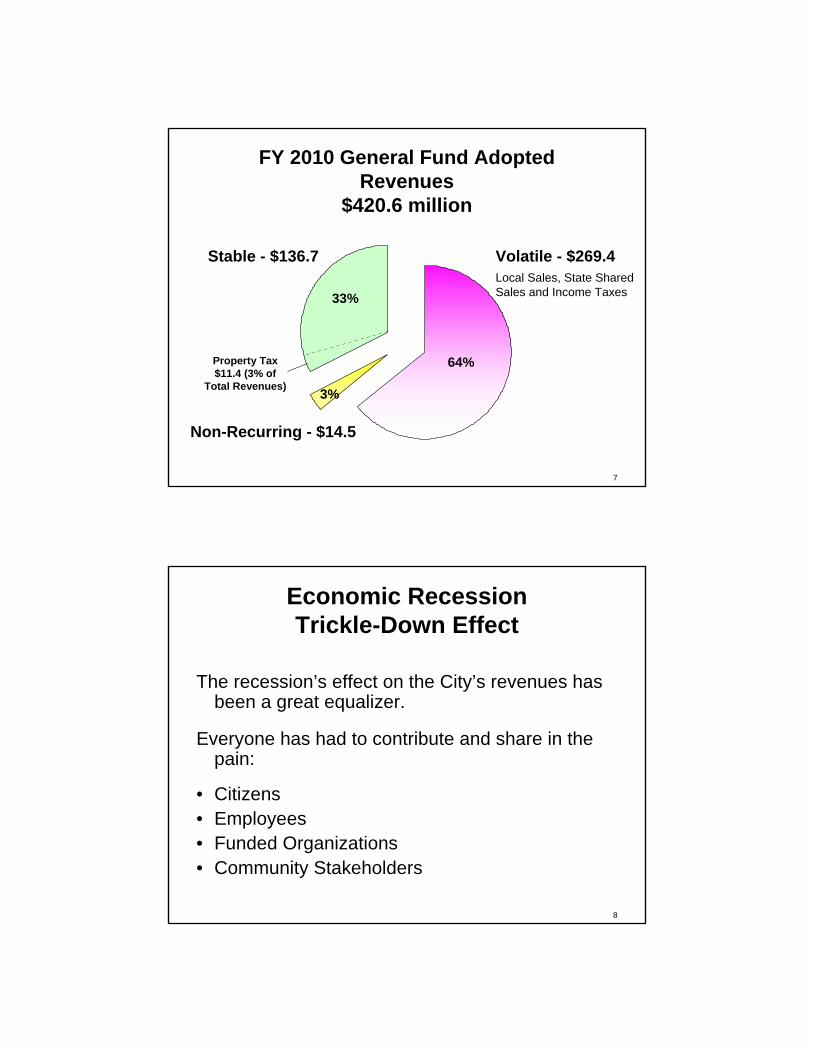
FY 2010 General Fund AdoptedRevenues
$420.6 million
Stable - $136.7 Volatile - $269.4
Non-Recurring - $14.5
33%
64%
3%
Local Sales, State Shared Sales and Income Taxes
Property Tax $11.4 (3% of
Total Revenues)
8
Economic Recession Trickle-Down Effect
The recession’s effect on the City’s revenues has been a great equalizer.
Everyone has had to contribute and share in the pain:
• Citizens • Employees • Funded Organizations• Community Stakeholders
9
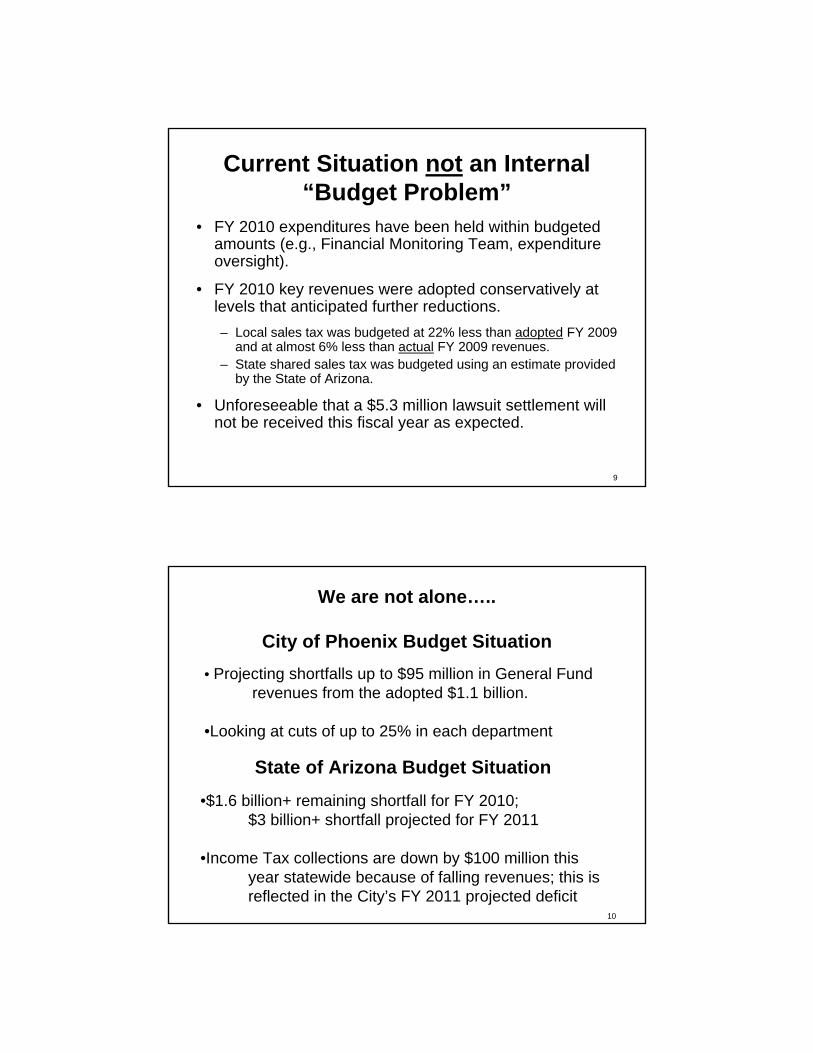
Current Situation not an Internal “Budget Problem”
• FY 2010 expenditures have been held within budgeted amounts (e.g., Financial Monitoring Team, expenditure oversight).
• FY 2010 key revenues were adopted conservatively at levels that anticipated further reductions.– Local sales tax was budgeted at 22% less than adopted FY 2009
and at almost 6% less than actual FY 2009 revenues.– State shared sales tax was budgeted using an estimate provided
by the State of Arizona.
• Unforeseeable that a $5.3 million lawsuit settlement will not be received this fiscal year as expected.
We are not alone…..
City of Phoenix Budget Situation• Projecting shortfalls up to $95 million in General Fund
revenues from the adopted $1.1 billion.
•Looking at cuts of up to 25% in each department
State of Arizona Budget Situation
•$1.6 billion+ remaining shortfall for FY 2010; $3 billion+ shortfall projected for FY 2011
•Income Tax collections are down by $100 million this year statewide because of falling revenues; this is reflected in the City’s FY 2011 projected deficit
10
11
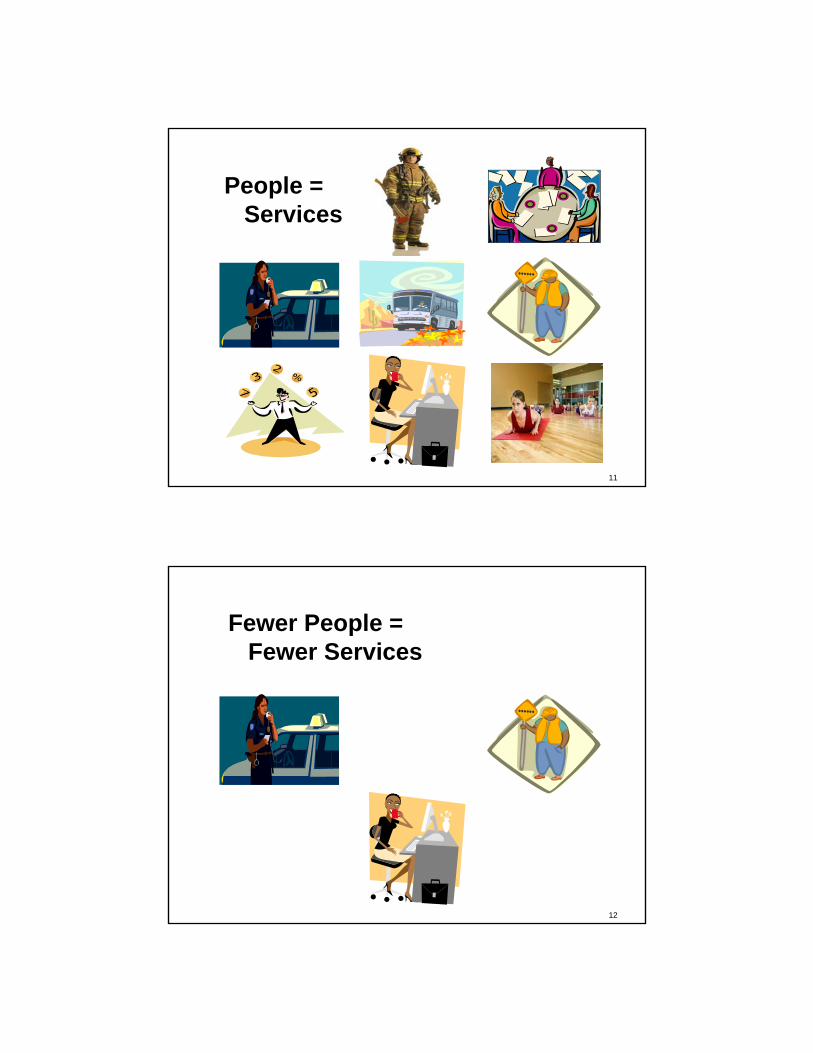
People =Services
12
Fewer People =Fewer Services
13
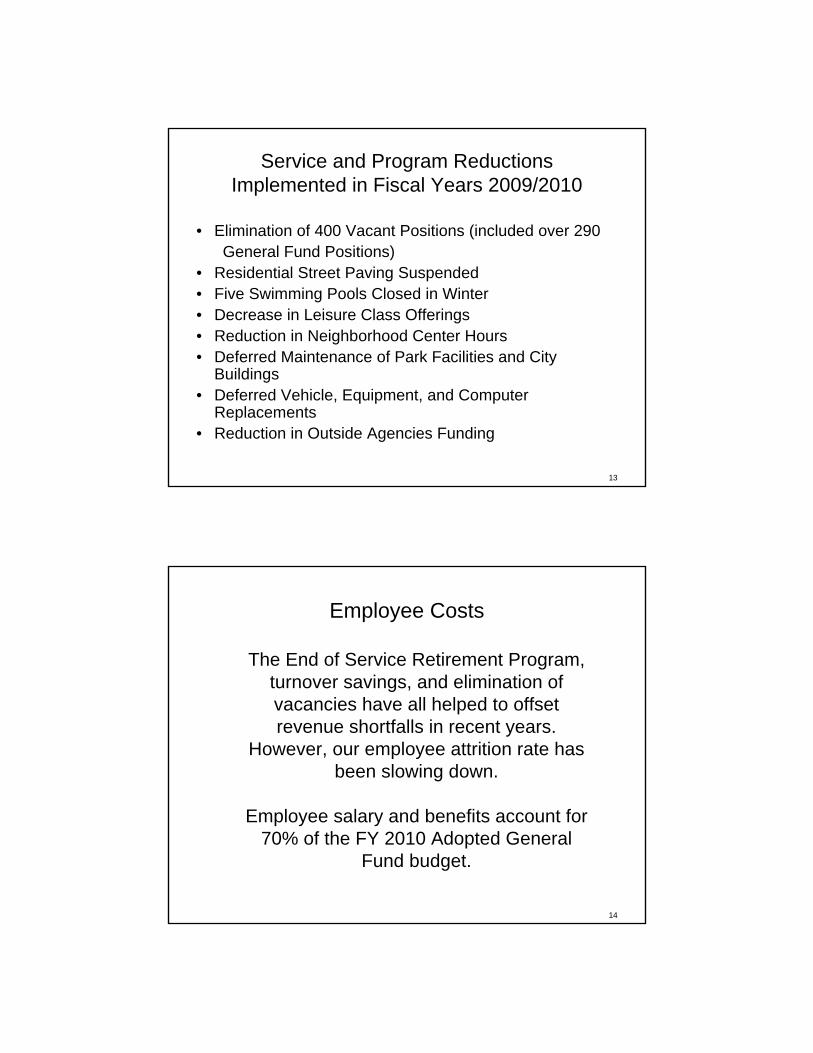
Service and Program Reductions Implemented in Fiscal Years 2009/2010
• Elimination of 400 Vacant Positions (included over 290General Fund Positions)
• Residential Street Paving Suspended• Five Swimming Pools Closed in Winter• Decrease in Leisure Class Offerings• Reduction in Neighborhood Center Hours • Deferred Maintenance of Park Facilities and City
Buildings• Deferred Vehicle, Equipment, and Computer
Replacements• Reduction in Outside Agencies Funding
14
The End of Service Retirement Program, turnover savings, and elimination of vacancies have all helped to offset revenue shortfalls in recent years.
However, our employee attrition rate has been slowing down.
Employee salary and benefits account for 70% of the FY 2010 Adopted General
Fund budget.
Employee Costs
15
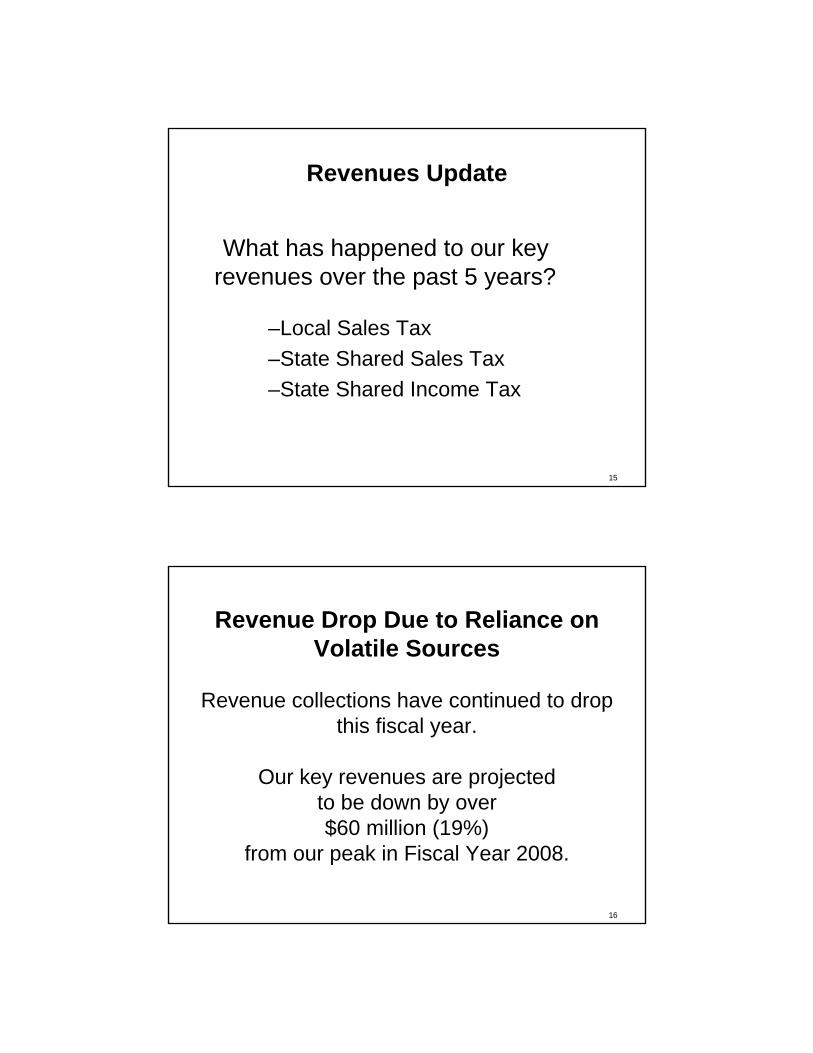
Revenues Update
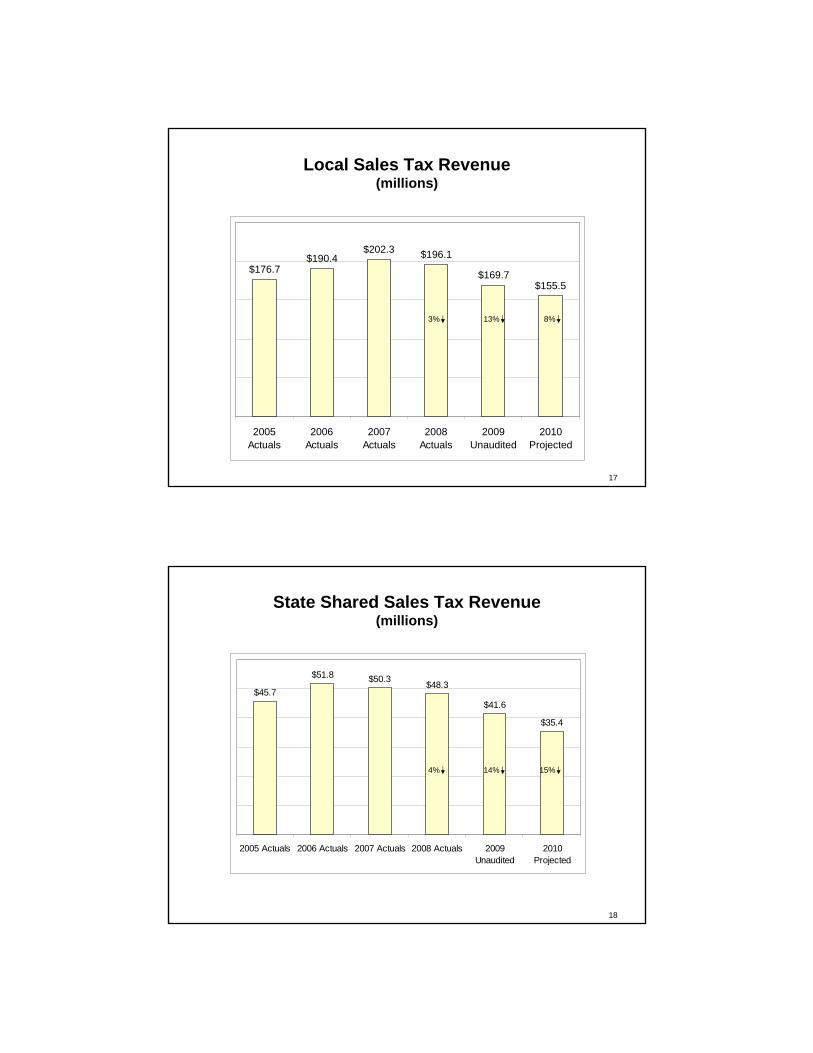
What has happened to our key revenues over the past 5 years?
–Local Sales Tax–State Shared Sales Tax–State Shared Income Tax
16
Revenue Drop Due to Reliance on Volatile Sources
Revenue collections have continued to drop this fiscal year.
Our key revenues are projected to be down by over$60 million (19%)
from our peak in Fiscal Year 2008.
17
Local Sales Tax Revenue(millions)
$176.7$190.4
$202.3 $196.1
$169.7$155.5
2005Actuals
2006Actuals
2007Actuals
2008Actuals
2009Unaudited
2010Projected
13%3% 8%
18
State Shared Sales Tax Revenue(millions)
$45.7
$51.8 $50.3 $48.3
$41.6
$35.4
2005 Actuals 2006 Actuals 2007 Actuals 2008 Actuals 2009Unaudited
2010Projected
4% 14% 15%
19
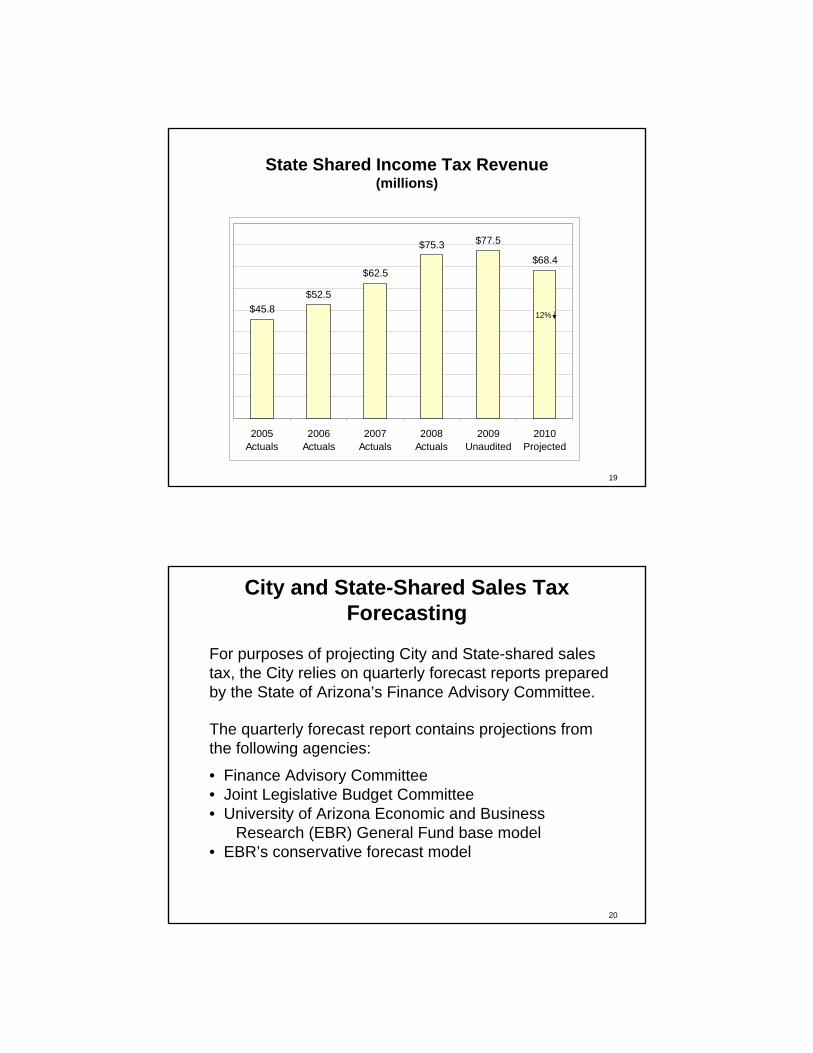
State Shared Income Tax Revenue(millions)
$45.8$52.5
$62.5
$75.3 $77.5
$68.4
2005Actuals
2006Actuals
2007Actuals
2008Actuals
2009Unaudited
2010Projected
12%
20
City and State-Shared Sales Tax Forecasting
For purposes of projecting City and State-shared sales tax, the City relies on quarterly forecast reports prepared by the State of Arizona’s Finance Advisory Committee.
The quarterly forecast report contains projections from the following agencies:
• Finance Advisory Committee• Joint Legislative Budget Committee• University of Arizona Economic and Business
Research (EBR) General Fund base model• EBR’s conservative forecast model
21
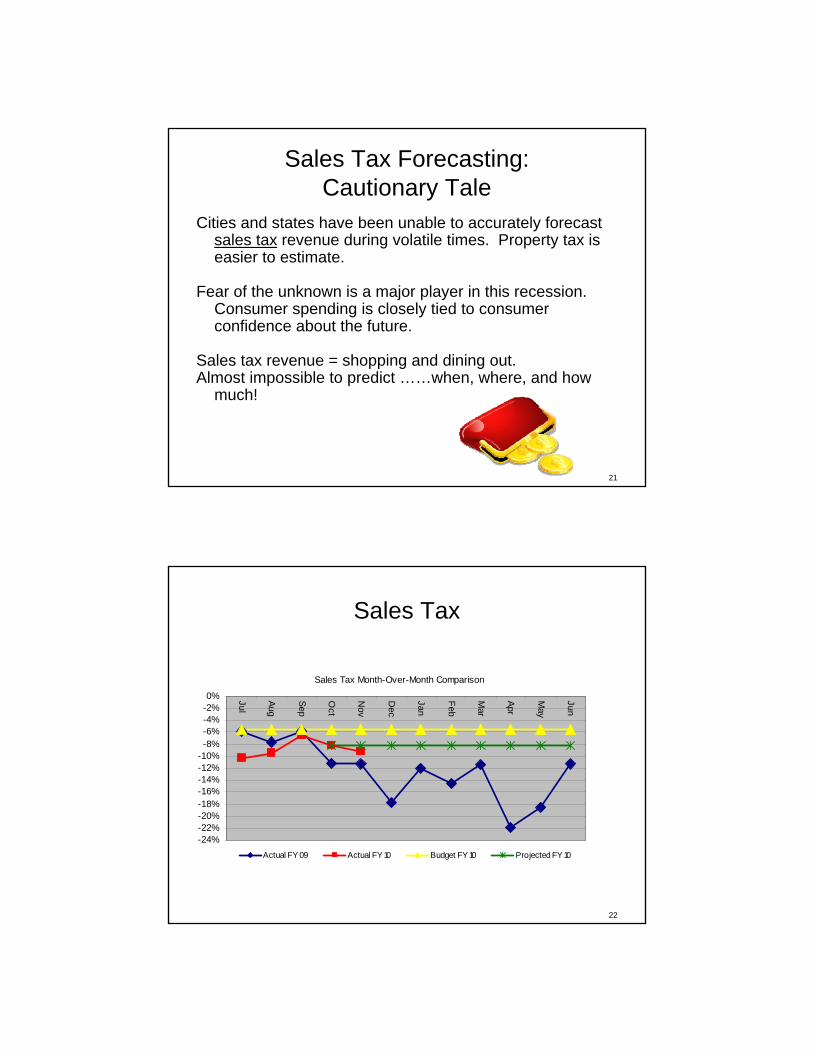
Sales Tax Forecasting:Cautionary Tale
Cities and states have been unable to accurately forecast sales tax revenue during volatile times. Property tax is easier to estimate.
Fear of the unknown is a major player in this recession. Consumer spending is closely tied to consumer confidence about the future.
Sales tax revenue = shopping and dining out.Almost impossible to predict ……when, where, and how
much!
22
Sales Tax
Sales Tax Month-Over-Month Comparison
-24%-22%-20%-18%-16%-14%-12%-10%-8%-6%-4%-2%0% Jul
Aug
Sep
Oct
Nov
Dec
Jan
Feb
Mar
Apr
May
Jun
Actual FY 09 Actual FY 10 Budget FY 10 Projected FY 10
23
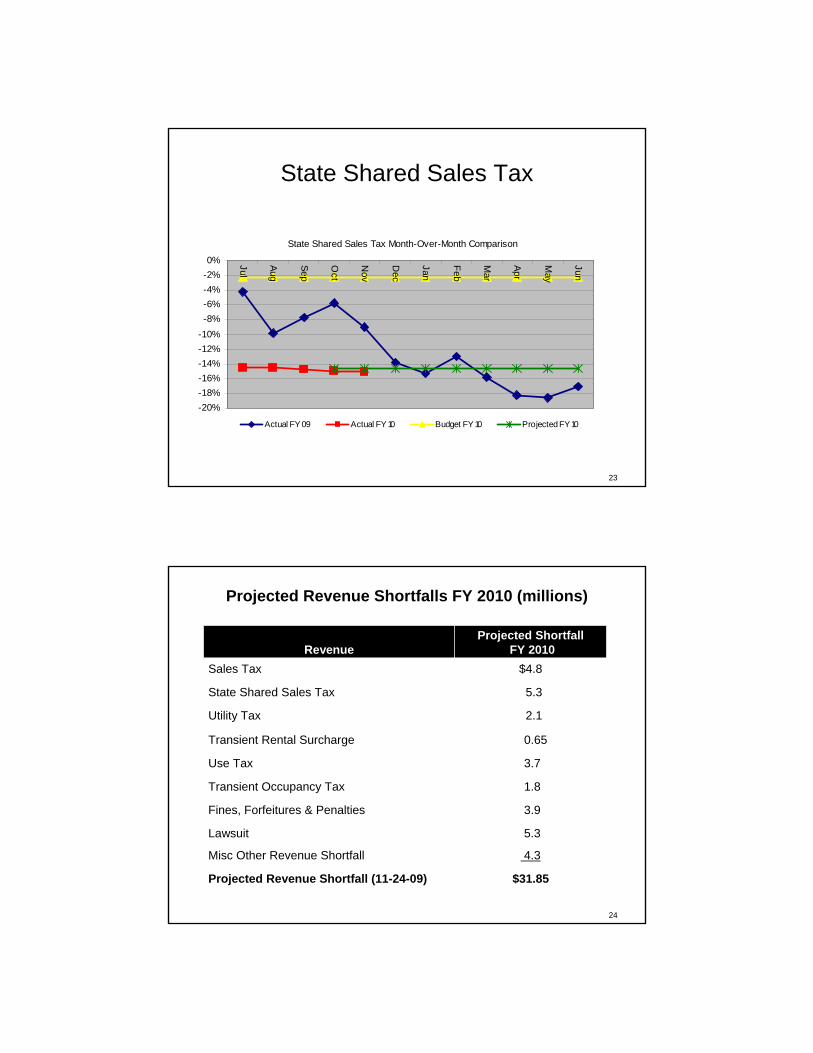
State Shared Sales Tax
State Shared Sales Tax Month-Over-Month Comparison
-20%-18%-16%-14%-12%-10%-8%-6%-4%-2%0% Jul
Aug
Sep
Oct
Nov
Dec
Jan
Feb
Mar
Apr
May
Jun
Actual FY 09 Actual FY 10 Budget FY 10 Projected FY 10
24
Projected Revenue Shortfalls FY 2010 (millions)
$4.8Sales Tax
5.3State Shared Sales Tax
2.1Utility Tax
0.65Transient Rental Surcharge
Revenue Projected Shortfall
FY 2010
Use Tax 3.7
Transient Occupancy Tax 1.8
Fines, Forfeitures & Penalties 3.9
Lawsuit 5.3
Misc Other Revenue Shortfall 4.3
Projected Revenue Shortfall (11-24-09) $31.85
25
Time has run out on our reliance on volatile revenues and one-time fixes.
There are few alternatives other than structuralchanges with only a short timeframe to act. Delays will only compound the problem.
26
Cash Position Update
The City utilizes an investment pool that:• Maximizes interest earnings potential.• Accounts for each fund’s cash separately and
allocates interest monthly.
Staff has updated the Mayor and Council’s Independent Audit and Performance Commission on this data on a monthly basis since April 2009.
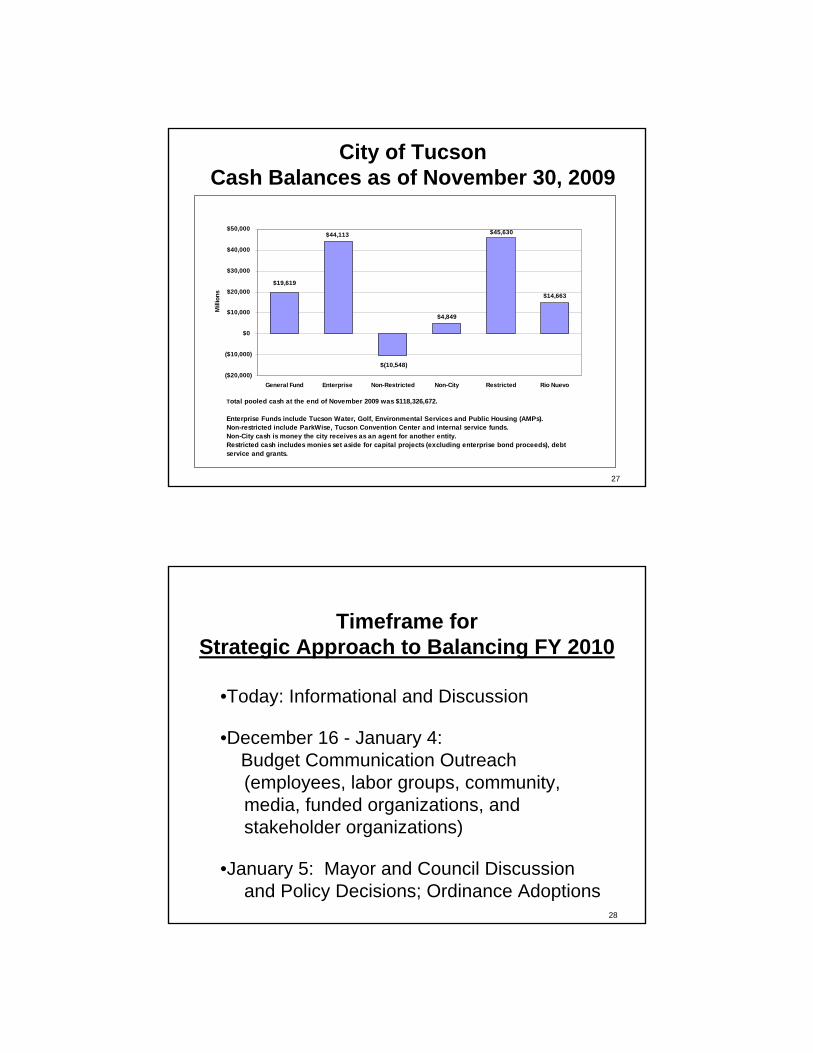
$14,663
$45,630
$(10,548)
$19,619
$4,849
$44,113
($20,000)
($10,000)
$0
$10,000
$20,000
$30,000
$40,000
$50,000
General Fund Enterprise Non-Restricted Non-City Restricted Rio Nuevo
Mill
ions
Total pooled cash at the end of November 2009 was $118,326,672.
Enterprise Funds include Tucson Water, Golf, Environmental Services and Public Housing (AMPs). Non-restricted include ParkWise, Tucson Convention Center and internal service funds. Non-City cash is money the city receives as an agent for another entity.Restricted cash includes monies set aside for capital projects (excluding enterprise bond proceeds), debt service and grants.
City of TucsonCash Balances as of November 30, 2009
27
28
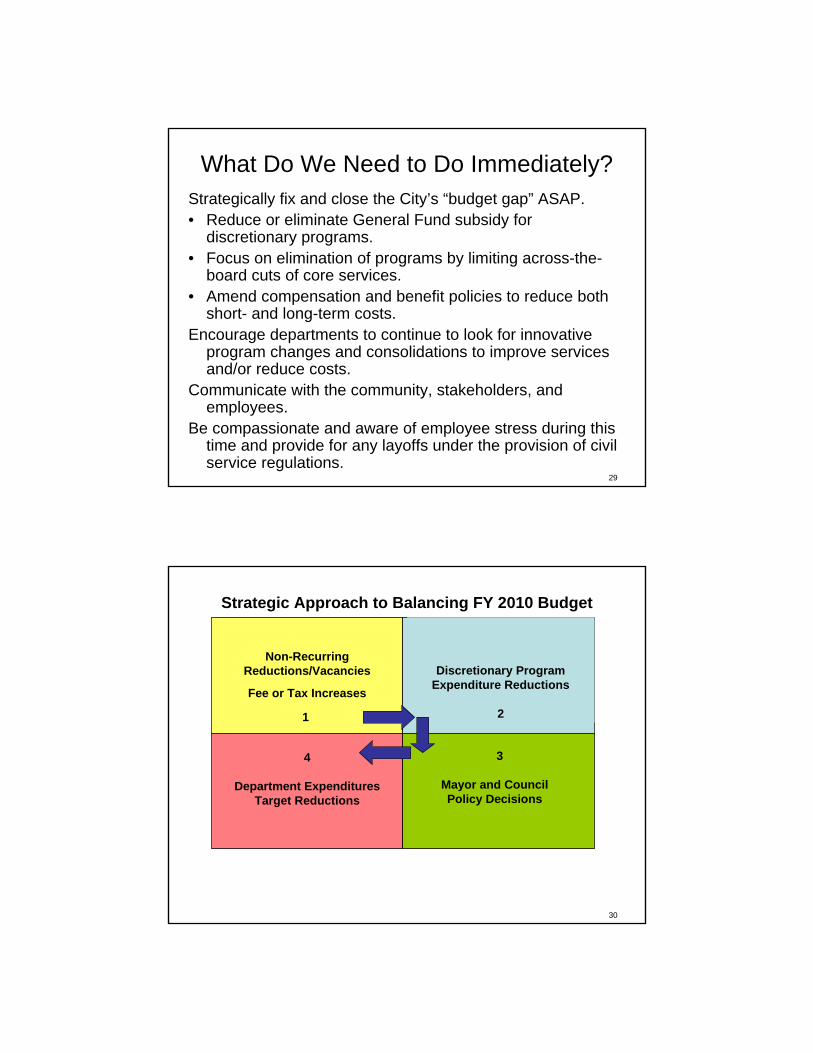
Timeframe forStrategic Approach to Balancing FY 2010
•Today: Informational and Discussion
•December 16 - January 4: Budget Communication Outreach (employees, labor groups, community, media, funded organizations, and stakeholder organizations)
•January 5: Mayor and Council Discussion and Policy Decisions; Ordinance Adoptions
29
What Do We Need to Do Immediately?Strategically fix and close the City’s “budget gap” ASAP.• Reduce or eliminate General Fund subsidy for
discretionary programs.• Focus on elimination of programs by limiting across-the-
board cuts of core services.• Amend compensation and benefit policies to reduce both
short- and long-term costs.Encourage departments to continue to look for innovative
program changes and consolidations to improve services and/or reduce costs.
Communicate with the community, stakeholders, and employees.
Be compassionate and aware of employee stress during this time and provide for any layoffs under the provision of civil service regulations.
30
Non-RecurringReductions/Vacancies
Fee or Tax Increases
1
Discretionary Program Expenditure Reductions
2
4
Department Expenditures Target Reductions
3
Mayor and Council Policy Decisions
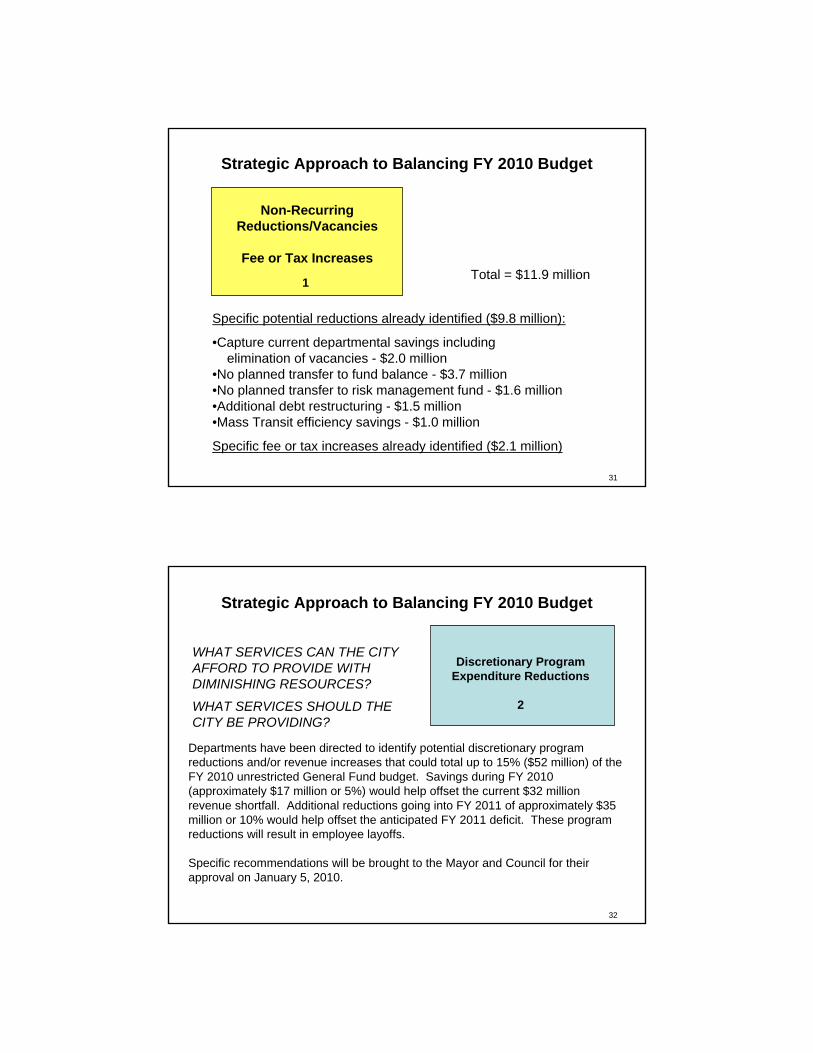
Strategic Approach to Balancing FY 2010 Budget
31
Non-RecurringReductions/Vacancies
Fee or Tax Increases
1
Strategic Approach to Balancing FY 2010 Budget
Specific potential reductions already identified ($9.8 million):
•Capture current departmental savings including elimination of vacancies - $2.0 million
•No planned transfer to fund balance - $3.7 million•No planned transfer to risk management fund - $1.6 million•Additional debt restructuring - $1.5 million•Mass Transit efficiency savings - $1.0 million
Specific fee or tax increases already identified ($2.1 million)
Total = $11.9 million
32
Discretionary Program Expenditure Reductions
2
Strategic Approach to Balancing FY 2010 Budget
Departments have been directed to identify potential discretionary program reductions and/or revenue increases that could total up to 15% ($52 million) of the FY 2010 unrestricted General Fund budget. Savings during FY 2010 (approximately $17 million or 5%) would help offset the current $32 million revenue shortfall. Additional reductions going into FY 2011 of approximately $35 million or 10% would help offset the anticipated FY 2011 deficit. These program reductions will result in employee layoffs.
Specific recommendations will be brought to the Mayor and Council for their approval on January 5, 2010.
WHAT SERVICES CAN THE CITY AFFORD TO PROVIDE WITH DIMINISHING RESOURCES?
WHAT SERVICES SHOULD THE CITY BE PROVIDING?
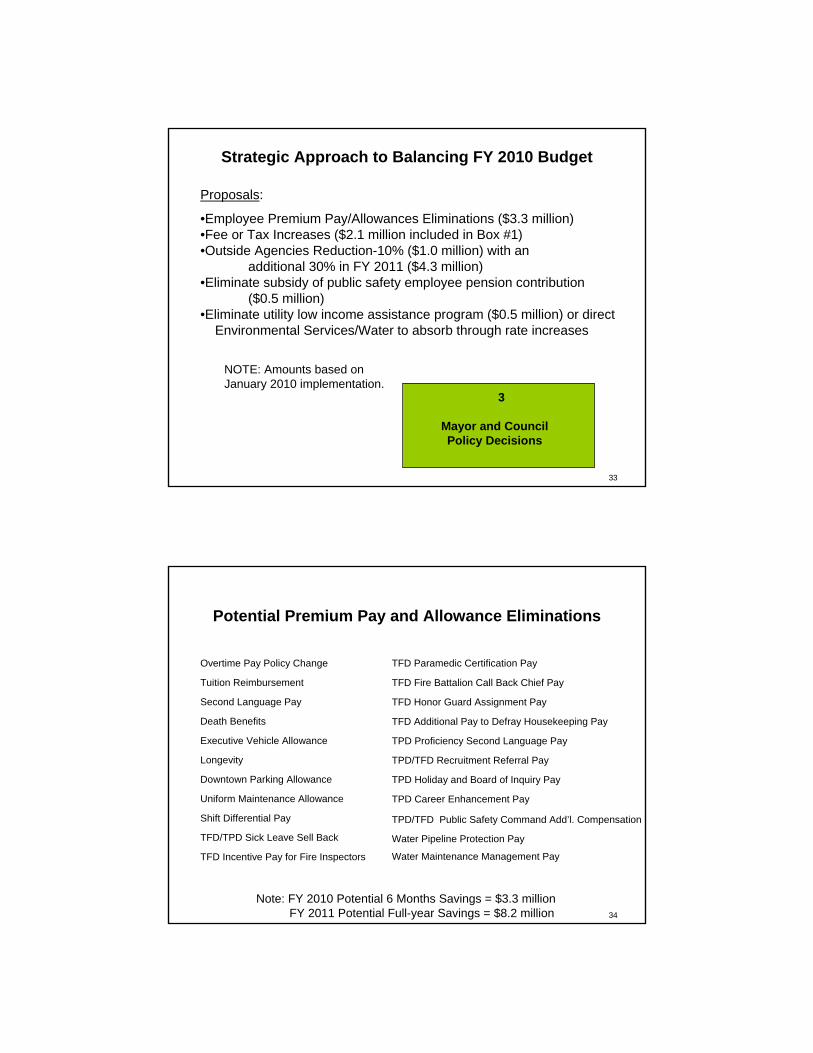
33
3
Mayor and Council Policy Decisions
Strategic Approach to Balancing FY 2010 Budget
Proposals:
•Employee Premium Pay/Allowances Eliminations ($3.3 million)•Fee or Tax Increases ($2.1 million included in Box #1)•Outside Agencies Reduction-10% ($1.0 million) with an
additional 30% in FY 2011 ($4.3 million)•Eliminate subsidy of public safety employee pension contribution
($0.5 million) •Eliminate utility low income assistance program ($0.5 million) or direct
Environmental Services/Water to absorb through rate increases
NOTE: Amounts based on January 2010 implementation.
34
Potential Premium Pay and Allowance Eliminations
Note: FY 2010 Potential 6 Months Savings = $3.3 millionFY 2011 Potential Full-year Savings = $8.2 million
TFD Incentive Pay for Fire Inspectors
TFD/TPD Sick Leave Sell Back
Shift Differential Pay
Uniform Maintenance Allowance
Downtown Parking Allowance
Longevity
Executive Vehicle Allowance
Death Benefits
Second Language Pay
Tuition Reimbursement
Overtime Pay Policy Change
Water Maintenance Management Pay
Water Pipeline Protection Pay
TPD/TFD Public Safety Command Add’l. Compensation
TPD Career Enhancement Pay
TPD Holiday and Board of Inquiry Pay
TPD/TFD Recruitment Referral Pay
TPD Proficiency Second Language Pay
TFD Additional Pay to Defray Housekeeping Pay
TFD Honor Guard Assignment Pay
TFD Fire Battalion Call Back Chief Pay
TFD Paramedic Certification Pay
35
FY 2010 Proposed Revenue Sources
358,000Increase existing Development Services fees by at least 10% and add approximately a dozen new fees
$ 2,129,250 Total Revenue if effective February 1, 2010
5,833 Require special events license for “promoters” $28 Dealer-Trade fee
9,167 Require special events license for “promoters” $45 Business License fee
72,917 Institute new fee structure for Real Estate Division for cost recovery on public requests
120,833 Repeal the cost of land deduction for sales tax
170,833 Increase Business License Fee by $10 (from $45 to $55)
350,000 Increase Parks & Recreation program fees for higher cost recovery
416,667 Alternative to Jail Fee (Up to Judge)
$ 625,000 Institute collection of insurance deductible for Advanced Life Support from city residents
FY 2010 Estimated Revenue Proposed Fee or Tax
36
General Fund Outside Agency Allocations10% ATB Reduction Recommendation except for
“Payments to Other Governments” category
(Continued)
640,512 71,168 711,680 Subtotal
20,538 2,282 22,820 Tucson Pops Orchestra
10,971 1,219 12,190 Tucson Sister Cities Association
58,716 6,524 65,240 Tucson Museum of Art
32,076 3,564 35,640 Tucson Children's Museum
37,008 4,112 41,120 Tucson Botanical Gardens
8,226 914 9,140 El Centro Cultural de las Americas
472,977 52,553 525,530 Tucson-Pima Arts Council (TPAC)
Arts and Cultural Enrichment
5,973,948 663,772 6,637,720 Subtotal
1,118,430 124,270 1,242,700 Tucson Regional Economic Opportunities (TREO)
424,359 47,151 471,510 School Plus Jobs
61,605 6,845 68,450 Pro Neighborhoods
3,632,715 403,635 4,036,350 Metropolitan Tucson Convention and Visitors Bureau (MTCVB)
342,225 38,025 380,250 JobPath
252,018 28,002 280,020 Business Improvement District (BID)
142,596 15,844 158,440 Critical Path Institute (C-Path)
Economic and Workforce Development
RevisedFY 2010
FY 201010% Reduction
Adopted GF FY 2010 (DRAFT)
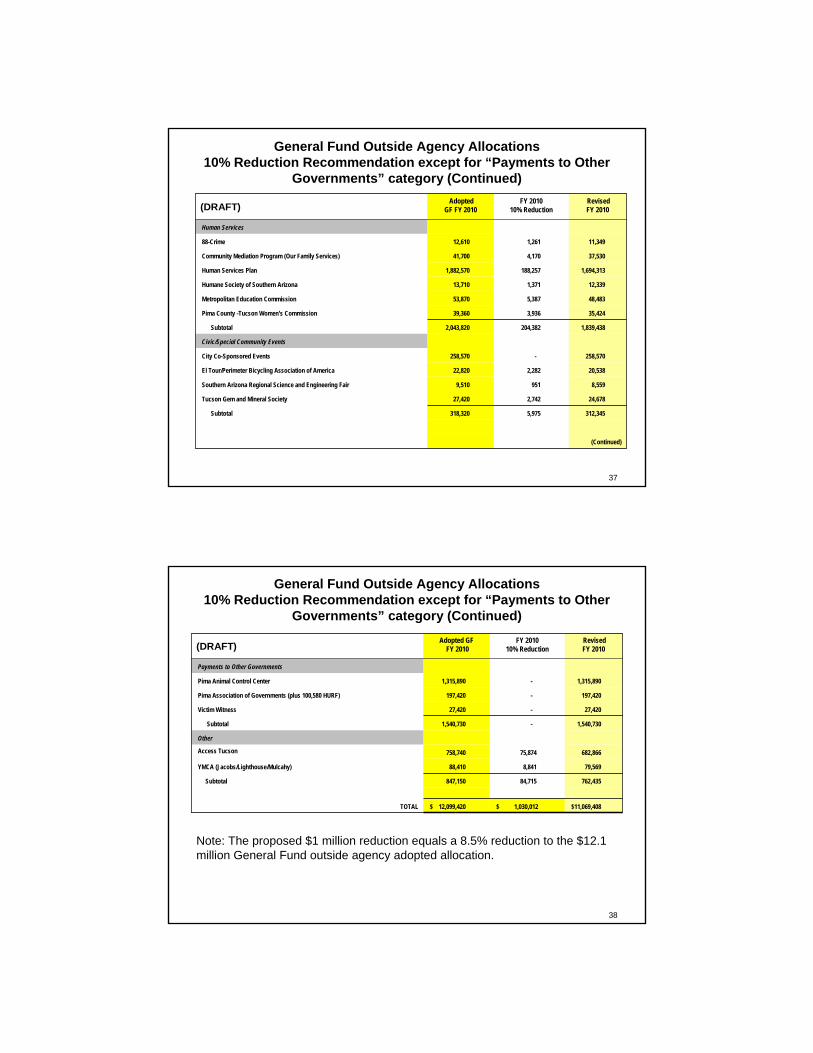
37
General Fund Outside Agency Allocations10% Reduction Recommendation except for “Payments to Other
Governments” category (Continued)
(Continued)
312,345 5,975 318,320 Subtotal
24,678 2,742 27,420 Tucson Gem and Mineral Society
8,559 951 9,510 Southern Arizona Regional Science and Engineering Fair
20,538 2,282 22,820 El Tour/Perimeter Bicycling Association of America
258,570 -258,570 City Co-Sponsored Events
Civic/Special Community Events
1,839,438 204,382 2,043,820 Subtotal
35,424 3,936 39,360 Pima County -Tucson Women's Commission
48,483 5,387 53,870 Metropolitan Education Commission
12,339 1,371 13,710 Humane Society of Southern Arizona
1,694,313 188,257 1,882,570 Human Services Plan
37,530 4,170 41,700 Community Mediation Program (Our Family Services)
11,349 1,261 12,610 88-Crime
Human Services
RevisedFY 2010
FY 201010% Reduction
AdoptedGF FY 2010 (DRAFT)
38
General Fund Outside Agency Allocations10% Reduction Recommendation except for “Payments to Other
Governments” category (Continued)
$11,069,408 $ 1,030,012 $ 12,099,420 TOTAL
762,435 84,715 847,150 Subtotal
79,569 8,841 88,410 YMCA (Jacobs/Lighthouse/Mulcahy)
682,866 75,874 758,740 Access Tucson
Other
1,540,730 -1,540,730 Subtotal
27,420 -27,420 Victim Witness
197,420 -197,420 Pima Association of Governments (plus 100,580 HURF)
1,315,890 -1,315,890 Pima Animal Control Center
Payments to Other Governments
RevisedFY 2010
FY 201010% Reduction
Adopted GFFY 2010 (DRAFT)
Note: The proposed $1 million reduction equals a 8.5% reduction to the $12.1 million General Fund outside agency adopted allocation.
39
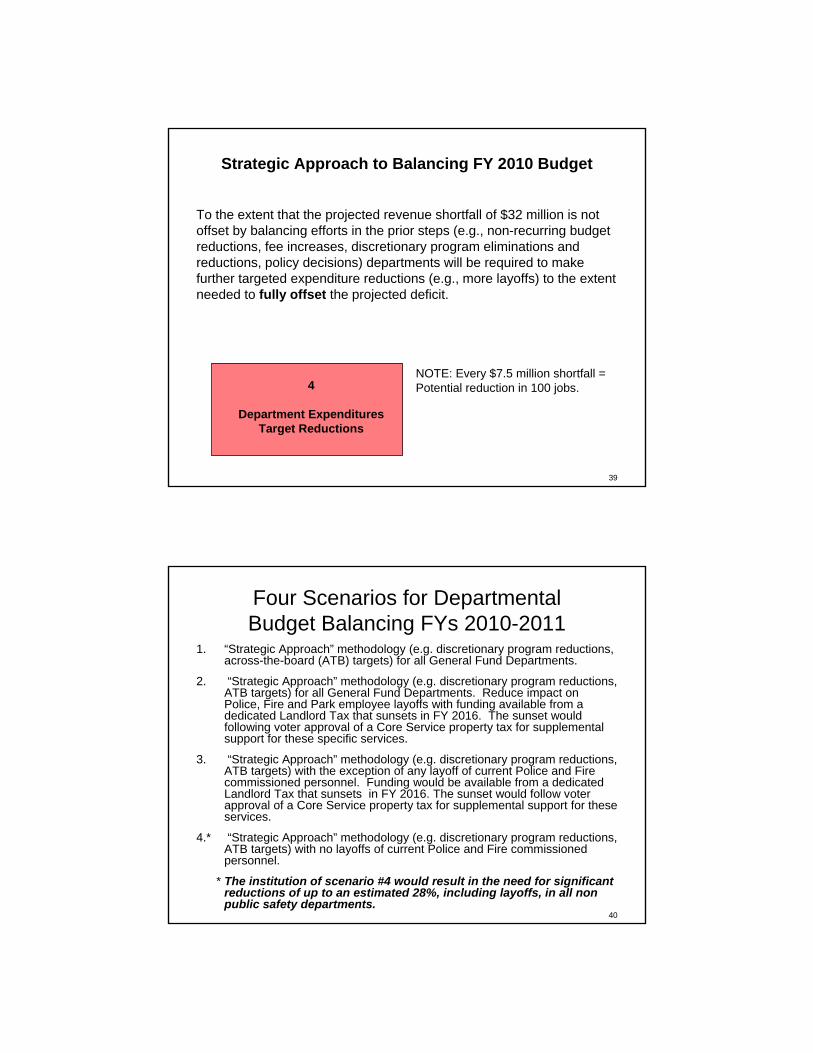
4
Department Expenditures Target Reductions
Strategic Approach to Balancing FY 2010 Budget
To the extent that the projected revenue shortfall of $32 million is not offset by balancing efforts in the prior steps (e.g., non-recurring budget reductions, fee increases, discretionary program eliminations and reductions, policy decisions) departments will be required to make further targeted expenditure reductions (e.g., more layoffs) to the extent needed to fully offset the projected deficit.
NOTE: Every $7.5 million shortfall = Potential reduction in 100 jobs.
40
Four Scenarios for Departmental Budget Balancing FYs 2010-2011
1. “Strategic Approach” methodology (e.g. discretionary program reductions, across-the-board (ATB) targets) for all General Fund Departments.
2. “Strategic Approach” methodology (e.g. discretionary program reductions, ATB targets) for all General Fund Departments. Reduce impact onPolice, Fire and Park employee layoffs with funding available from a dedicated Landlord Tax that sunsets in FY 2016. The sunset would following voter approval of a Core Service property tax for supplemental support for these specific services.
3. “Strategic Approach” methodology (e.g. discretionary program reductions, ATB targets) with the exception of any layoff of current Police and Fire commissioned personnel. Funding would be available from a dedicated Landlord Tax that sunsets in FY 2016. The sunset would follow voter approval of a Core Service property tax for supplemental support for these services.
4.* “Strategic Approach” methodology (e.g. discretionary program reductions, ATB targets) with no layoffs of current Police and Fire commissioned personnel.
* The institution of scenario #4 would result in the need for significant reductions of up to an estimated 28%, including layoffs, in all non public safety departments.
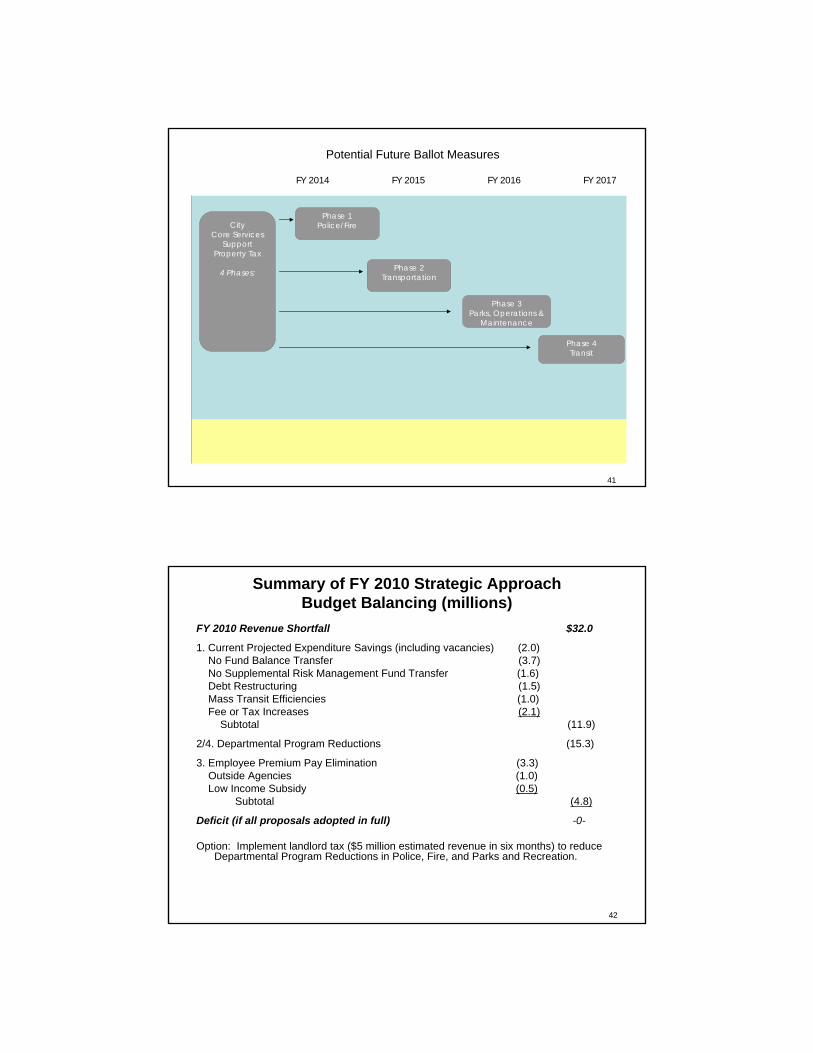
City Core Services
Support Property Tax
4 Phases:
Phase 1Police/Fire
Phase 2Transportation
Phase 3Parks, Operations &
Maintenance
Phase 4Transit
Potential Future Ballot Measures
FY 2014 FY 2015 FY 2016 FY 2017
41
42
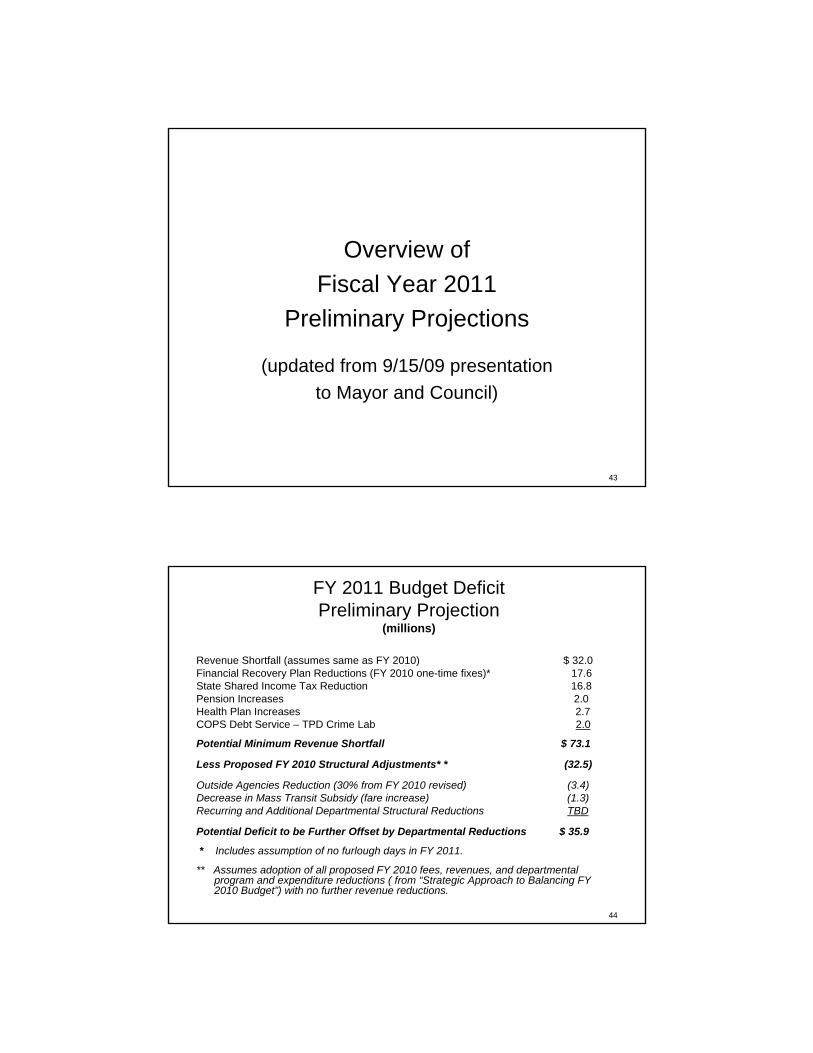
Summary of FY 2010 Strategic Approach Budget Balancing (millions)
FY 2010 Revenue Shortfall $32.0
1. Current Projected Expenditure Savings (including vacancies) (2.0)No Fund Balance Transfer (3.7)No Supplemental Risk Management Fund Transfer (1.6)Debt Restructuring (1.5)Mass Transit Efficiencies (1.0)Fee or Tax Increases (2.1)
Subtotal (11.9)
2/4. Departmental Program Reductions (15.3)
3. Employee Premium Pay Elimination (3.3)Outside Agencies (1.0)Low Income Subsidy (0.5)
Subtotal (4.8)
Deficit (if all proposals adopted in full) -0-
Option: Implement landlord tax ($5 million estimated revenue in six months) to reduce Departmental Program Reductions in Police, Fire, and Parks and Recreation.
43
Overview of Fiscal Year 2011
Preliminary Projections
(updated from 9/15/09 presentation to Mayor and Council)
44
FY 2011 Budget Deficit Preliminary Projection
(millions)
Revenue Shortfall (assumes same as FY 2010) $ 32.0Financial Recovery Plan Reductions (FY 2010 one-time fixes)* 17.6State Shared Income Tax Reduction 16.8Pension Increases 2.0 Health Plan Increases 2.7COPS Debt Service – TPD Crime Lab 2.0
Potential Minimum Revenue Shortfall $ 73.1
Less Proposed FY 2010 Structural Adjustments* * (32.5)
Outside Agencies Reduction (30% from FY 2010 revised) (3.4)Decrease in Mass Transit Subsidy (fare increase) (1.3)Recurring and Additional Departmental Structural Reductions TBD
Potential Deficit to be Further Offset by Departmental Reductions $ 35.9
* Includes assumption of no furlough days in FY 2011.
** Assumes adoption of all proposed FY 2010 fees, revenues, and departmental program and expenditure reductions ( from “Strategic Approach to Balancing FY 2010 Budget”) with no further revenue reductions.
45
Summary
• Immediately close the “budget gap”.
• Implement more structural cuts and limit or eliminate “one-time” fixes.
• Communicate.
46
Next Steps
• FY 2010 Budget Communication Outreach – immediate implementation
• January 5, 2010 Mayor and Council – Study Session: Policy direction for FY 2010 structural budgetary savings– Public Hearing on new revenues– Regular Agenda: Adoption of ordinances to amend the compensation
and benefit codes and implement new revenues
• Revenues will continue to be monitored and projections will continue to be refined and updated. Mayor and Council will be informed.
• February 23, 2010 Mayor and Council – Study Session: FY 2011 Revenues and Budget Balancing Framework