budget statement 2018-19 · chapter 1: budget highlights 1 key general government sector 2018-19...
TRANSCRIPT
Budget Statement
2018-19
Budget Paper No. 1
Circulated by The Hon. Dominic Perrottet MP, Treasurer, and Minister for Industrial Relations


Budget Statement 2018-19
TABLE OF CONTENTS
Chart, Figure and Table List
Focus Box List
About this Budget Paper ........................................................................................... i
Chapter 1: Budget Highlights
1.1 Building tomorrow, delivering today .......................................................... 1 - 1
1.2 Strong financial management .................................................................. 1 - 2
1.3 Robust economic outlook ........................................................................ 1 - 4
1.4 Budget priorities ....................................................................................... 1 - 5
Chapter 2: Fiscal Strategy and Outlook
2.1 Fiscal strategy .......................................................................................... 2 - 1
2.2 Budget position and outlook .................................................................... 2 - 3
Chapter 3: The Economy
3.1 A strong economic outlook ...................................................................... 3 - 1
3.2 Supportive conditions for exports and business investment .................... 3 - 6
3.3 Population growth is driving demand ....................................................... 3 - 8
3.4 Consumption boosted by employment, will rely more on wages ............. 3 - 10
3.5 Risks to the economic outlook ................................................................. 3 - 11
Chapter 4: Productivity Reform in NSW
4.1 The strength of NSW productivity ............................................................ 4 - 1
4.2 Improving living standards through productivity ...................................... 4 - 2
4.3 NSW Government is delivering on productivity reforms .......................... 4 - 4
4.4 Strengthening the productivity and regulatory reform agenda ................. 4 - 8
4.5 Priority areas for productivity reforms ........................................................ 4 - 9
Chapter 5: Revenue
5.1 2018-19 Budget revenue measures .......................................................... 5 - 1
5.2 General government revenue .................................................................... 5 - 4
5.3 Taxation revenue ....................................................................................... 5 - 7
5.4 Grant revenue............................................................................................ 5 - 13
5.5 Other revenues ........................................................................................ 5 - 18
Budget Statement 2018-19
Chapter 6: Expenditure
6.1 General government recurrent expenses ................................................ 6 - 1
6.2 General government capital expenditure ................................................. 6 - 9
6.3 Recurrent and capital expenditure by function ........................................ 6 - 10
6.4 Recurrent expense measures statement ................................................. 6 - 17
Chapter 7: Managing the State’s Assets and Liabilities
7.1 Reforming the State’s balance sheet ....................................................... 7 - 1
7.2 Net debt ................................................................................................... 7 - 3
7.3 Net worth .................................................................................................. 7 - 5
Chapter 8: Commercial Performance in the Broader Public Sector
8.1 Overview of the broader public sector ..................................................... 8 - 1
8.2 Reform of government businesses ............................................................ 8 - 2
8.3 Non-financial public sector ....................................................................... 8 - 6
8.4 Public financial corporation sector ........................................................... 8 - 9
Appendices
A1. Statement of Finances ............................................................................. A1 - 1
A2. Statement of Significant Accounting Policies and Forecast Assumptions ......................................................................................... A2 - 1
A3. Classification of Agencies ........................................................................ A3 - 1
A4. 2017-18 Budget – Outcome and Summary of Variations ........................ A4 - 1
A5. Tax Expenditure and Concessional Charges Statement ......................... A5 - 1
B. Fiscal Risks and Budget Sensitivities ...................................................... B - 1
C. Contingent Assets and Liabilities ............................................................. C - 1
D. Historical Fiscal Indicators ....................................................................... D - 1
E. Performance and Reporting Under the Fiscal Responsibility Act ............ E - 1
Glossary
Budget Statement 2018-19
CHART, FIGURE AND TABLE LIST Page
Chapter 1: Budget Highlights 1Key general government sector 2018-19 Budget aggregates Table 1.1 1-2
Budget result: 2017-18 Half-Yearly Review compared to the 2018-19 Budget Chart 1.1 1-3
General government revenues and expenses as a share of GSP Chart 1.2 1-3
General government net debt as a share of GSP Chart 1.3 1-4
NSW maintaining above trend economic activity Chart 1.4 1-5
Chapter 2: Fiscal Strategy and Outlook 2Fiscal objective and targets Table 2.1 2-2
Credit ratings of Australian states and territories as at June 2018 Chart 2.1 2-2
General government sector budget result aggregates Table 2.2 2-3
Four-year average revenue growth Chart 2.2 2-4
Four-year average expense growth Chart 2.3 2-4
Reconciliation of 2018-19 Budget to 2017-18 Budget Table 2.3 2-5
Capital expenditure in the non-financial public sector Chart 2.4 2-6
Capital expenditure by sector Chart 2.5 2-6
Net debt comparison without asset recycling measures Chart 2.6 2-7
Chapter 3: The Economy 3Economic performance and outlook Table 3.1 3-1
NSW average GSP per capita growth since 2014-15 has outperformed other states Chart 3.1 3-2
The regional unemployment rate is well below its long run average Chart 3.2 3-3
Household services supporting non-residential building Chart 3.3 3-3
Labour supply adjusting to meet labour demand Chart 3.4 3-4
Social and business services have driven female employment growth over the past 30 years Chart 3.5 3-5
Female participation rate and long run equilibrium Chart 3.6 3-5
Large service based industries have seen strong overseas export growth Chart 3.7 3-6
New South Wales has the most international students Chart 3.8 3-7
International students leading to higher education construction Chart 3.9 3-7
Capacity pressures encouraging new investment Chart 3.10 3-8
NSW population growth since Federation Chart 3.11 3-8
Overseas migration is at all-time highs Chart 3.12 3-9
But, interstate outflows are picking up Chart 3.13 3-9
Housing undersupply to halve over three years Chart 3.14 3-9
Completions to peak in 2018-19 Chart 3.15 3-9
Savings rate to stabilise Chart 3.16 3-10
Investors driving the housing market Chart 3.17 3-10
Hourly wages to support labour income Chart 3.18 3-11
Wage pressures are building Chart 3.19 3-11
Chapter 4: Productivity Reform in NSW 4NSW productivity performance relative to other states Chart 4.1 4-2
The 3P’s of NSW economic growth and NSW real per capita income growth Chart 4.2 4-3
More efficient and lower cost electricity network in NSW Chart 4.3 4-4
Efficiencies leading to lower bills for Sydney Water Chart 4.4 4-5
Worker compensation reforms improving safety and productivity Chart 4.5 4-7
Declining premium costs as percentage of total NSW payroll Chart 4.6 4-7
Budget Statement 2018-19
Chapter 5: Revenue 5Revenue measures announced in the 2018-19 Budget Table 5.1 5-1
Payroll tax paying businesses affected by threshold changes Chart 5.1 5-2
Payroll tax saving and potential employment impact Chart 5.2 5-3
Changes in 2017-18 revenue – Half-Yearly Review to 2018-19 Budget Chart 5.3 5-5
Composition of total revenue, 2018-19 Chart 5.4 5-5
General government sector summary of revenue Table 5.2 5-6
Revenue reconciliation Table 5.3 5-7
General government sector-summary of taxation revenue Table 5.4 5-8
Composition of taxation revenue, 2018-19 Chart 5.5 5-9
Residential prices and auction clearance rates Chart 5.6 5-10
Savings for first-home buyers Chart 5.7 5-11
Composition of first-home buyer concessions for dwellings less than $800,000 Chart 5.8 5-11
Total first-home buyer concessions Chart 5.9 5-12
Grant revenue Table 5.5 5-14
GST revenues to New South Wales – reconciliation statement Table 5.6 5-14
Redistribution of New South Wales’ equal per capita share of GST Chart 5.10 5-16
National Agreement and other payments to New South Wales Table 5.7 5-17
National Partnership payments to New South Wales Table 5.8 5-18
Sale of goods and services Table 5.9 5-19
Fines, regulatory fees, licences and other revenues Table 5.10 5-20
Chapter 6: Expenditure 6Expense reconciliation since the 2017-18 Budget Table 6.1 6-2
Whole-of-government efficiencies since 2011-12 Table 6.2 6-4
General government sector expenses Table 6.3 6-5
Composition of 2018-19 expenses Chart 6.1 6-5
Employee expense growth 2003-04 to 2021-22 Chart 6.2 6-6
Proportion of frontline and non-frontline staff from 2011 to 2017 Chart 6.3 6-7
Composition of grants and subsidies in 2018-19 by sector Chart 6.4 6-8
Capital expenditure reconciliation Table 6.4 6-9
General government sector capital spending relative to GSP Chart 6.5 6-10
Composition of total 2018-19 recurrent expenditure by policy area Chart 6.6 6-11
Composition of total 2018-19 capital expenditure by policy area Chart 6.7 6-11
New recurrent policy measures since the 2017-18 Half-Yearly Review by Cluster Table 6.5 6-17
Chapter 7: Managing the State’s Assets and Liabilities 7Key balance sheet aggregates of the GGS Table 7.1 7-2
Net debt increases as the record infrastructure program is delivered Chart 7.1 7-4
NSW GGS net worth to increase by $44.8 billion over the next four years Chart 7.2 7-6
GGS net worth for all Australian states and territories in 2017-18 Chart 7.3 7-6
GGS financial assets reflect asset divestments and cash management reforms Chart 7.4 7-7
Infrastructure systems drive the increase in GGS non-financial assets Chart 7.5 7-8
Increasing borrowings offset by decreasing superannuation liabilities Chart 7.6 7-8
Government superannuation contributions until 2030 Chart 7.7 7-9
Chapter 8: Commercial Performance in the Broader Public Sector 8More efficient and lower cost electricity networks in New South Wales Chart 8.1 8-4
Components of the non-financial public sector net operating balance Chart 8.2 8-6
Dividends and tax equivalent payments from public non-financial corporations and public financial corporations
Table 8.1 8-7
Capital expenditure of the public non-financial corporations sector Chart 8.3 8-8
Workers compensation insurance premiums as a share of wages Chart 8.4 8-10
Budget Statement 2018-19
Appendix A1: Statement of Finances A1General government sector operating statement Table A1.1 A1-8
General government sector balance sheet Table A1.2 A1-10
General government sector cash flow statement Table A1.3 A1-11
General government sector taxes Table A1.4 A1-12
General government sector grant revenue and expense Table A1.5 A1-13
General government sector dividend and income tax equivalent income Table A1.6 A1-14
General government sector expenses by function Table A1.7 A1-14
General government sector purchases of non-financial assets by function Table A1.8 A1-15
Public non-financial corporations sector operating statement Table A1.9 A1-16
Public non-financial corporations sector balance sheet Table A1.10 A1-18
Public non-financial corporations sector cash flow statement Table A1.11 A1-19
Non-financial public sector operating statement Table A1.12 A1-20
Non-financial public sector balance sheet Table A1.13 A1-22
Non-financial public sector cash flow statement Table A1.14 A1-23
Appendix A2: Statement of Significant Accounting Policies and Forecast Assumptions
A2
Key economic performance assumptions Table A2.1 A2-5
Superannuation assumptions – pooled fund / state super schemes Table A2.2 A2-8
Appendix A3: Classification of Agencies A3Classification of agencies by sector Table A3.1 A3-2
Appendix A4: 2016-17 Budget - Outcome and Summary of Variations A4Summary of variations Table A4.1 A4-2
Appendix A5: Tax Expenditure and Concessional Charges Statement A5Major tax expenditures by type Table A5.1 A5-2
Concessions by function Table A5.2 A5-3
Transfer duty – major tax expenditures Table A5.3 A5-4
General insurance duty – major tax expenditures Table A5.4 A5-6
Life insurance duty – major tax expenditures Table A5.5 A5-7
Motor vehicle stamp duty – major tax expenditures Table A5.6 A5-7
Payroll tax – major tax expenditures Table A5.7 A5-9
Land tax – major tax expenditures Table A5.8 A5-11
Vehicle weight tax – major tax expenditures Table A5.9 A5-14
Motor vehicle registration fees – major tax expenditures Table A5.10 A5-15
Gambling and betting taxes – major tax expenditures Table A5.11 A5-16
Parking Space Levy – major tax expenditures Table A5.12 A5-17
Public order and safety – major concessions Table A5.13 A5-17
Education – major concessions Table A5.14 A5-18
Health – major concessions Table A5.15 A5-19
Transport – major concessions Table A5.16 A5-19
Housing and Community – major concessions Table A5.17 A5-20
Economic affairs – major concessions Table A5.18 A5-21
Recreation, culture and religion – major concessions Table A5.19 A5-21
Environmental protection – major concessions Table A5.20 A5-22

Budget Statement 2018-19
Appendix B: Fiscal Risks and Budget Sensitivities BRevenue sensitivities – state taxation revenues Table B.1 B-1
Revenue sensitivities – GST Table B.2 B-2
Revenue sensitivities – royalties Table B.3 B-3
Expense sensitivities Table B.4 B-4
Financial markets and interest rate sensitivities Table B.5 B-4
Superannuation liabilities Table B.6 B-6
Appendix C: Contingent Assets and Liabilities CGeneral government non-quantifiable contingent assets Table C.1 C-2
General government quantifiable contingent liabilities Table C.2 C-2
Commercial transaction-related non-quantifiable contingent liabilities Table C.3 C-3
Other non-quantifiable contingent liabilities Table C.4 C-4
Appendix D: Historical Fiscal Indicators DGeneral government sector operating statement aggregates Table D.1 D-2
General government sector balance sheet and financing indicators Table D.2 D-3
Total state sector operating statement aggregates Table D.3 D-4
Total state sector balance sheet and financing indicators Table D.4 D-5
New South Wales credit metrics Table D.5 D-6
Appendix E: Performance and Reporting Under the Fiscal Responsibility Act EFiscal Responsibility Act – object, targets and principles Table E.1 E-1
New South Wales is one of five states rated triple-A by Moody’s and S&P Table E.2 E-2
New South Wales has the highest ratings possible in Australia Chart E.1 E-2
Expense growth and target Chart E.2 E-3
Taxation revenue, ratio to GSP Chart E.3 E-4

Budget Statement 2018-19
FOCUS BOX LIST Page
Chapter 1: Budget Highlights 1The NSW Generations Fund: investing for the future and delivering for today Box 1.1 1-2
Investing in care for new parents and children Box 1.2 1-8
Attracting more apprentices and easing the financial load Box 1.3 1-10
Creative Kids rebate Box 1.4 1-15
Chapter 2: Fiscal Strategy and Outlook 2
NSW belongs to the exclusive global triple-A club Box 2.1 2-2
A new framework to underpin financial management transformation Box 2.2 2-3
Successful asset recycling strategy delivers for New South Wales Box 2.3 2-7
Chapter 3: The Economy 3Prospering regional economies Box 3.1 3-3
Female workers are reshaping the labour market Box 3.2 3-5
Business investment is set to make a larger contribution to growth Box 3.3 3-8
Chapter 4: Productivity Reform in NSW 4Investing in education and skills for the future Box 4.1 4-3
Worker compensation reforms improving productivity Box 4.2 4-6
New steps in productivity and regulatory reforms Box 4.3 4-8
Investigating Build to Rent in New South Wales Box 4.4 4-10
Chapter 5: Revenue 5Higher payroll tax threshold to support small business Box 5.1 5-2
First-home buyer numbers 3.5 times higher than last year Box 5.2 5-11
GST relativity affected by NSW’s strong fiscal position Box 5.3 5-15
National Agreements - a fair share for New South Wales Box 5.4 5-16
Taking the lead on federal financial relations Box 5.5 5-18
Chapter 6: Expenditure 6More Trains, More Services Box 6.1 6-3
Increasing frontline staff Box 6.2 6-7
Supporting rural and regional health infrastructure Box 6.3 6-12
Investing in early childhood education Box 6.4 6-13
Improving public transport accessibility Box 6.5 6-14
Continuing to protect against terrorism Box 6.6 6-15
Social protection initiatives - caseworkers Box 6.7 6-16
Creating green places and open spaces Box 6.8 6-16
Chapter 7: Managing the State’s Assets and Liabilities 7Asset and Liability Committee drives balance sheet reform Box 7.1 7-3
Active management of the State’s financial assets – NIFF and SAHF Box 7.2 7-5
A new property infrastructure policy to improve utilisation Box 7.3 7-8
Funding the State’s superannuation liabilities Box 7.4 7-9
Chapter 8: Commercial Performance in the Broader Public Sector 8Sydneysiders save more on water compared with other major cities Box 8.1 8-3
Landcom: delivering affordable housing across New South Wales Box 8.2 8-6
WestConnex Box 8.3 8-9
Appendix C: Contingent Assets and Liabilities CAccounting definition of contingent assets and liabilities Box C.1 C-1
Budget Statement 2018-19 i
ABOUT THIS BUDGET PAPER
Purpose and scope
Budget Paper No. 1 Budget Statement provides information on the State finances in aggregate. The objectives of this paper are to:
inform citizens of the State’s fiscal position and the Government’s fiscal strategy
meet requirements under s. 27AA of the Public Finance and Audit Act 1983, which prescribes the content of the budget papers, including providing four-year projections of all major economic and financial variables, and revised estimates for the preceding budget year and explanations of any significant variations
meet requirements under s.8 of the Fiscal Responsibility Act 2012, including providing a statement of the Government’s fiscal strategy, a report on performance against the fiscal object, targets and principles contained in the Act, and an assessment of the impact of any budget measures on the State’s long-term fiscal gap
enable interstate comparisons by reporting within the Australian Bureau of Statistics Government Finance Statistics framework.
The scope of the Budget is the general government sector. However, this budget paper also includes information on the Estimated Financial Statements for the public non-financial corporations and non-financial public sectors. The statements provide a comprehensive picture of the State’s fiscal position and strategy.
In this Budget, the Government has identified a number of priority projects for which it has reserved Restart NSW funding. The budget estimates include the estimated direct budget impact of spending funds reserved in Restart NSW. Funding has been reserved with a view to future Restart NSW commitments being made. Restart NSW commitments can only be made following completion of project development and assurance processes, including final business case approval.
Reporting of Budget data
The Estimated Financial Statements in these Budget Papers are prepared on an accrual basis of accounting, in accordance with Australian Accounting Standards, the Uniform Presentation Framework, and the principles and rules contained in the Australia Bureau of Statistics, Australian System of Government Finance Statistics: Concepts, Sources and Methods 2015 (Cat. No. 5514) (ABS-GFS Manual).
Aggregated financial data is presented on an eliminated basis – that is, intra government transactions between entities are eliminated out.
About this Budget Paper
ii Budget Statement 2018-19
Notes
The budget year refers to 2018-19, while the forward estimates period refers to 2019-20, 2020-21 and 2021-22. Figures in tables, charts and text may have been rounded. Discrepancies between totals and the sum of components reflect rounding:
– estimates under $100,000 are rounded to the nearest thousand
– estimates midway between rounding points are rounded up
– percentages are based on the underlying unrounded values.
For the budget result, parentheses indicate a deficit, while no sign indicates a surplus.
One billion equals one thousand million.
The following notations are used:
– n.a. means data is not available
– N/A means not applicable
– no. means number
– 0 means not zero, but rounded to zero
– … means zero
– ‘000 means thousand
– $m means millions of dollars
– $b means billions of dollars.
Differences between harmonised government finance statistics (GFS) generally accepted accounting principles (GAAP) information, as shown in the budget papers, and pure GFS information, as reported by the Australian Bureau of Statistics, are known as convergence differences. Such differences are not departures from Accounting Standards but merely variations in measurement or treatments between GAAP and GFS frameworks. Details of these main convergence differences between GAAP and GFS are explained in Appendix A.
Unless otherwise indicated, the data source for tables and charts is NSW Treasury.

Budget Statement 2018-19 1 - 1
1. BUDGET HIGHLIGHTS
1.1 Building tomorrow, delivering today
The 2018-19 Budget focuses on the people, families and communities of New South Wales, and on making our State a better place to live – building for tomorrow, and delivering for today.
Based on a foundation of fiscal discipline, reform and economic strength, the Budget provides more support and better services to help ease the pressure on individuals and families, strengthen businesses, and create more opportunities to share in NSW’s economic success.
Despite pressures on revenue – particularly residential transfer duty – a healthy surplus of $3.9 billion is projected for 2017-18, with strong average surpluses of $1.6 billion forecast from 2018-19 to 2021-22 (see Table 1.1).
The NSW economy is expected to continue its run of above-trend growth this year and over the next two years. This would result in six years of above-trend growth for the first time since the 1990s. This growth is being fuelled by a once-in-a-generation pipeline of public investment – including the Budget’s record $87.2 billion four-year infrastructure program.
The State’s balance sheet remains strong with net debt estimated to fall to negative $9.8 billion in June 2018 – a record low. New South Wales is also set to become the first Australian state with a net worth of a quarter of a trillion dollars in June 2018, one year ahead of expectations.
The Government’s strong financial management and economic stewardship enable the Budget to provide more support for citizens today, while acting now to meet future challenges.
The Budget helps to reduce everyday costs, with savings on car and caravan registration, green slips and energy bills, and a new Creative Kids program – to complement Active Kids – so more children can get into creative activities like music, drama, art and coding.
It also funds thousands of additional frontline workers, including police, teachers and nurses, supports job creation with payroll tax cuts, takes steps to increase economic opportunity for indigenous citizens, tackles homelessness, and supports those with mental illness.
To meet the needs of future generations, the Budget bolsters the work already underway to deliver new record investments in schools, hospitals and transport links in our cities and regions, as well as investing in the conservation of our natural wonders, and world-class museums, stadia and sporting and cultural facilities across the state.
To reinforce the State’s financial future, the Budget launches a world-first sovereign wealth fund: the NSW Generations Fund (see Box 1.1). As intergenerational challenges loom on the horizon, the Fund will help Government keep debt at sustainable levels in the long term.
It will also enable My Community Dividend – a participatory budgeting program for local communities to allocate funding for local projects of their choice (see Box 1.1).
With these initiatives, the 2018-19 Budget reflects the NSW Government’s ongoing commitment to build for tomorrow while delivering for today.
Budget Highlights
1 - 2 Budget Statement 2018-19
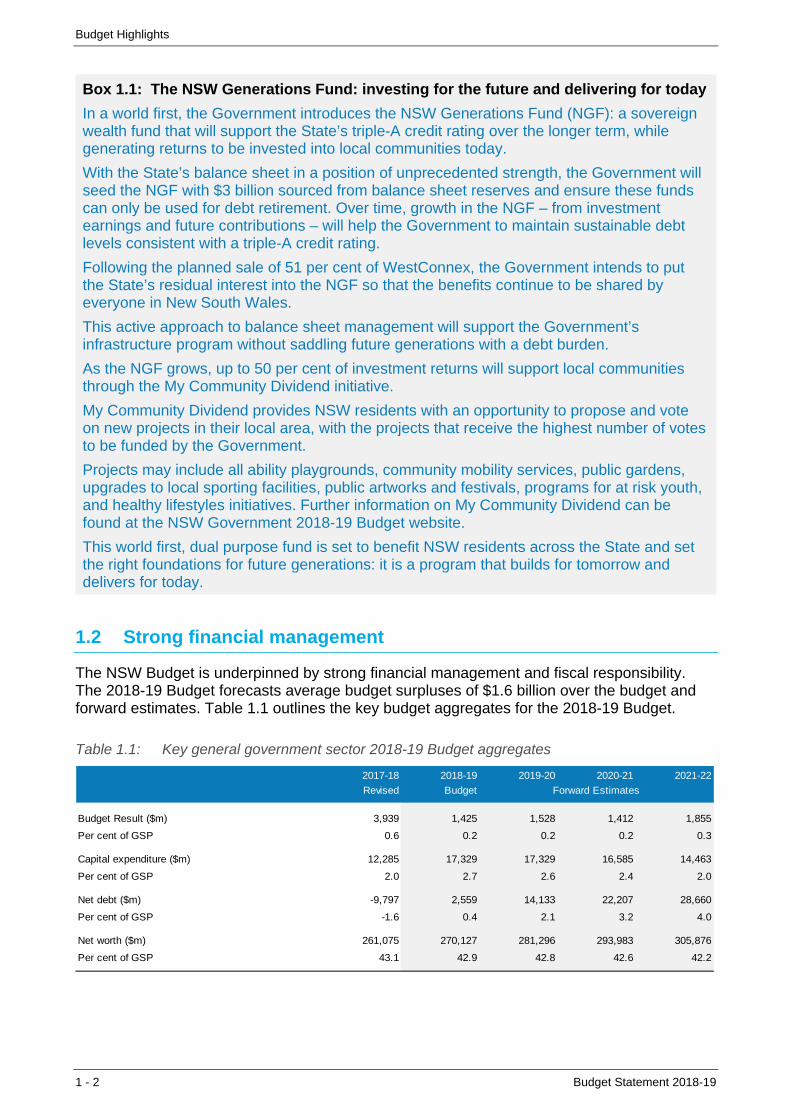
Box 1.1: The NSW Generations Fund: investing for the future and delivering for today
In a world first, the Government introduces the NSW Generations Fund (NGF): a sovereign wealth fund that will support the State’s triple-A credit rating over the longer term, while generating returns to be invested into local communities today.
With the State’s balance sheet in a position of unprecedented strength, the Government will seed the NGF with $3 billion sourced from balance sheet reserves and ensure these funds can only be used for debt retirement. Over time, growth in the NGF – from investment earnings and future contributions – will help the Government to maintain sustainable debt levels consistent with a triple-A credit rating.
Following the planned sale of 51 per cent of WestConnex, the Government intends to put the State’s residual interest into the NGF so that the benefits continue to be shared by everyone in New South Wales.
This active approach to balance sheet management will support the Government’s infrastructure program without saddling future generations with a debt burden.
As the NGF grows, up to 50 per cent of investment returns will support local communities through the My Community Dividend initiative.
My Community Dividend provides NSW residents with an opportunity to propose and vote on new projects in their local area, with the projects that receive the highest number of votes to be funded by the Government.
Projects may include all ability playgrounds, community mobility services, public gardens, upgrades to local sporting facilities, public artworks and festivals, programs for at risk youth, and healthy lifestyles initiatives. Further information on My Community Dividend can be found at the NSW Government 2018-19 Budget website.
This world first, dual purpose fund is set to benefit NSW residents across the State and set the right foundations for future generations: it is a program that builds for tomorrow and delivers for today.
1.2 Strong financial management
The NSW Budget is underpinned by strong financial management and fiscal responsibility. The 2018-19 Budget forecasts average budget surpluses of $1.6 billion over the budget and forward estimates. Table 1.1 outlines the key budget aggregates for the 2018-19 Budget.
Table 1.1: Key general government sector 2018-19 Budget aggregates
2017-18 2018-19 2019-20 2020-21 2021-22
Revised Budget
Budget Result ($m) 3,939 1,425 1,528 1,412 1,855
Per cent of GSP 0.6 0.2 0.2 0.2 0.3
Capital expenditure ($m) 12,285 17,329 17,329 16,585 14,463
Per cent of GSP 2.0 2.7 2.6 2.4 2.0
Net debt ($m) -9,797 2,559 14,133 22,207 28,660
Per cent of GSP -1.6 0.4 2.1 3.2 4.0
Net worth ($m) 261,075 270,127 281,296 293,983 305,876
Per cent of GSP 43.1 42.9 42.8 42.6 42.2
Forward Estimates

Budget Highlights
Budget Statement 2018-19 1 - 3
New South Wales is facing a slowdown in transfer duty revenue in the near term. Transfer duty is expected to decline by $565 million in 2017-18 and a total of $5.5 billion across the three years to 2020-21 relative to the 2017-18 Half-Yearly Review. At the same time, New South Wales will continue to be penalised under the current model for GST distribution, with the NSW share to reach a historically low level by 2021-22, at which point NSW is expected to receive only 83 cents out of each dollar of NSW per capita share of the GST.
Chart 1.1: Budget result: 2017-18 Half-Yearly Review compared to the 2018-19 Budget
3,332
2,093
1,442 1,558
3,939
1,425 1,528 1,412
0
500
1,000
1,500
2,000
2,500
3,000
3,500
4,000
4,500
2017-18 2018-19 2019-20 2020-21
$ m
illio
ns
2017-18 Half-Year Review 2018-19 Budget
Despite these fiscal challenges, the Government is investing in more health, education, transport and other services. This investment is essential to meet the State’s growth and to improve outcomes for citizens across the State. This is driving an increase in expenses of $2.8 billion across the four years to 2020-21 relative to the 2017-18 Half-Yearly Review. Nevertheless, the Government continues to ensure a sustainable budget position (see Chart 1.1). This has been achieved by maintaining a tight control on expenses, which are projected to decline as a share of GSP over the next four years (see Chart 1.2).
Chart 1.2: General government revenues and expenses as a share of GSP
11.0
11.5
12.0
12.5
13.0
13.5
14.0
2010-11 2011-12 2012-13 2013-14 2014-15 2015-16 2016-17 2017-18 2018-19 2019-20 2020-21 2021-22
Pe
r c
en
t
Revenue Expenses
The Government’s successful asset recycling strategy and continued budget surpluses are essential to funding the State’s record infrastructure program and keeping net debt at sustainable levels.
Budget Highlights
1 - 4 Budget Statement 2018-19
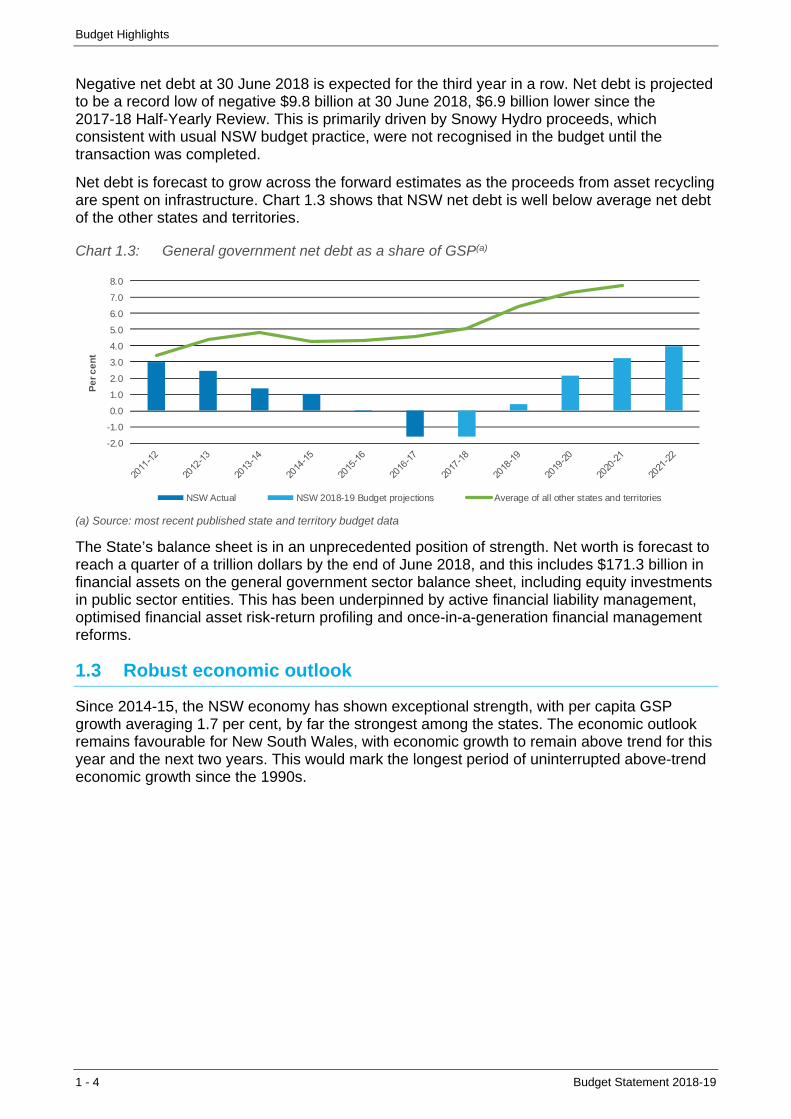
Negative net debt at 30 June 2018 is expected for the third year in a row. Net debt is projected to be a record low of negative $9.8 billion at 30 June 2018, $6.9 billion lower since the 2017-18 Half-Yearly Review. This is primarily driven by Snowy Hydro proceeds, which consistent with usual NSW budget practice, were not recognised in the budget until the transaction was completed.
Net debt is forecast to grow across the forward estimates as the proceeds from asset recycling are spent on infrastructure. Chart 1.3 shows that NSW net debt is well below average net debt of the other states and territories.
Chart 1.3: General government net debt as a share of GSP(a)
-2.0
-1.0
0.0
1.0
2.0
3.0
4.0
5.0
6.0
7.0
8.0
Pe
r c
en
t
NSW Actual NSW 2018-19 Budget projections Average of all other states and territories
(a) Source: most recent published state and territory budget data
The State’s balance sheet is in an unprecedented position of strength. Net worth is forecast to reach a quarter of a trillion dollars by the end of June 2018, and this includes $171.3 billion in financial assets on the general government sector balance sheet, including equity investments in public sector entities. This has been underpinned by active financial liability management, optimised financial asset risk-return profiling and once-in-a-generation financial management reforms.
1.3 Robust economic outlook
Since 2014-15, the NSW economy has shown exceptional strength, with per capita GSP growth averaging 1.7 per cent, by far the strongest among the states. The economic outlook remains favourable for New South Wales, with economic growth to remain above trend for this year and the next two years. This would mark the longest period of uninterrupted above-trend economic growth since the 1990s.

Budget Highlights
Budget Statement 2018-19 1 - 5
Chart 1.4: NSW maintaining above trend economic activity
Source: ABS 5220.0, ABS 6202.0 and NSW Treasury
Public investment continues to be a cornerstone of economic growth, contributing half a percentage point per year to economic growth, on average, over the three years to 2017-18. This outstanding performance – around four times its historical average contribution – is forecast to be repeated in 2018-19, underpinned by the State’s record $87.2 billion infrastructure program.
For the past three years New South Wales has had the lowest unemployment rate of any state. Momentum in the labour market remains strong, with employment growth of 3 per cent forecast for 2017-18. Abundant job opportunities are attracting more people to the labour force, and have lifted workforce participation to near record levels of 64.8 per cent.
Over the forward estimates, above trend employment growth combined with high participation and above-trend population growth, is expected to see the unemployment rate remain stable at around 4¾ per cent, consistent with full employment.
Strengthening global and national economies are expected to boost exports, spurring business to increase investment and employment. Households have been surprisingly resilient in 2017-18, but a softening housing market and modest wage growth are expected to weigh on consumption over the next two years.
1.4 Budget priorities
The 2018-19 Budget’s strong fiscal and economic position is enabling the Government to make large investments in new infrastructure and deliver enhanced services to meet the needs of the people of New South Wales.
Helping families and individuals with the cost of living
Recognising the pressures faced by families, the Government continues to focus on easing the cost of living with new initiatives that complement measures from last year’s Budget.
New initiatives include:
the new Creative Kids Rebate that will provide families with a $100 voucher per school-aged child, per year for extra-curricular activities including music, drama, visual and performing arts, coding and language classes (see Box 1.4); this will complement the existing Active Kids Rebate, which provides a $100 voucher per year for each school-aged child for use with registered sports organisations
0
1
2
3
4
5
6
7
0.0
0.5
1.0
1.5
2.0
2.5
3.0
3.5
4.0
2014-15 2015-16 2016-17 2017-18 2018-19 2019-20 2014-15 2015-16 2016-17 2017-18 2018-19 2019-20
Pe
rce
nt
An
nu
al g
row
th p
er c
en
t
NSW Australia
Real Gross Product Unemployment Rate
ForecastsForecasts

Budget Highlights
1 - 6 Budget Statement 2018-19
establishing an online “one-click energy switch” service through Service NSW, allowing New South Wales consumers to send their energy bills to Service NSW, who will advise on the best alternative energy deals and provide assistance in signing up to a new deal in a few easy clicks
establishing a cost of living service – a one-stop shop, available in Service NSW centres, online or over the phone, to reduce cost pressures for households by advising on available rebates and concessions across government
reducing the top ten (level two) parking fines issued by State Government agencies by 25 per cent and initiating a review to ensure that Government issued fines are fair and balanced
reducing caravan motor vehicle weight tax for private users by 40 per cent, making caravan registration cheaper from 1 November 2018
extending universal education access to preschool for three-year olds, making New South Wales the first state in Australia to do so, providing an average saving for families of $825 dollars a year from 1 January 2019.
These new initiatives support existing cost of living programs including:
the Energy Affordability Package, providing up to 20 per cent increases to energy rebates from 1 July 2017 including the Low-Income Household Rebate, the Family Energy Rebate, the Gas Rebate, the Medical Energy Rebate, the Life Support Rebate, and the Energy Accounts Payment Assistance
reducing the cost of Compulsory Third Party (CTP) Green Slips for vehicle owners, including a refund for some vehicle owners, saving on average $124 per year in the last 12 months
the Toll Relief Program which eases costs for frequent toll road users by providing free vehicle registration to owners of privately registered light vehicles that spend $25 or more per week, on average, over a 12 month period on tolls from 1 July 2018, expected to save some drivers more than $700 per year
limiting Opal fare increases to CPI only, with the Gold Opal to be capped at $2.50 for all day travel, from July 2018
transfer duty relief saving first home buyers an average of $14,500 with additional benefits for first home buyers, offering total savings up to $34,361.
Delivering world-class health
The 2018-19 Budget aims to provide New South Wales with a world-class healthcare system and a strong support structure to ensure people have access to the health services they need when they need them.
The Government is investing in health infrastructure with $8.0 billion over four years. This includes new funding to:
commence new capital works at Liverpool Hospital, Griffith Base Hospital, Dubbo Cancer Centre, Bankstown-Lidcombe Hospital (emergency department), birthing suites and theatres at St George Hospital and the next stage of a new health service at Rouse Hill
invest in the $700.0 million state-wide Mental Health Infrastructure Program. This investment will transform existing infrastructure to support new contemporary care models and provide new specialist mental health units for mothers and their babies, children, adolescents and older persons. It will also improve the forensic mental health network and enhance step-up step-down capacity in the community

Budget Highlights
Budget Statement 2018-19 1 - 7
commence a new Rural Health Infrastructure Program, that will upgrade Tenterfield, Dungog, Scone and Gloucester Hospitals
enhance hospital builds already in progress at Grafton, Inverell, Manning, Coffs Harbour, Cooma and Bowral
plan for future works at John Hunter, Nepean Stage 2, Sydney Children’s Hospital Westmead Stage 2, Albury Hospital (medical care, obstetric and neonatal services), Canterbury, Bankstown, Shoalhaven (Nowra), Hornsby hospitals and Goulburn ambulatory care.
Other new investments include:
increasing frontline health staff, with an estimated 1,370 additional frontline staff across the state including 950 nurses and midwives, 300 doctors and 120 allied health workers such as physiotherapists, occupational therapists and pharmacists
investing in care for new parents and children with a $156.5 million new Parents Package (see Box 1.2)
investing in ambulance services with $23.7 million in 2018-19 to employ an additional 200 paramedics (700 over four years) and 13 call centre staff (50 over four years) to improve ambulance response times, reduce paramedic fatigue and support safety
world-class research and innovation investment total of $115.0 million in 2018-19 for medical and scientific innovations to fight diseases and keep the community healthier including the following two new initiatives:
– $15.0 million for cardiovascular disease research capacity development as part of the Government’s $150.0 million commitment over 10 years
– $5.0 million to support treatment of childhood cancer and other genetic disorders by investing in technology and staff to enhance for paediatric precision medicine as part of the new Parents Package
$82.5 million in 2018-19 for increased admitted and community-based mental health services across New South Wales. This is part of the $2.1 billion total recurrent investment for mental health services including $100.0 million annually for specialist community mental health supports to continue the Government’s 10-year reform of mental health services
continuing with the existing drug and alcohol services investment with $12.0 million in 2018-19 for services in metropolitan and regional areas for prevention and harm minimisation programs.

Budget Highlights
1 - 8 Budget Statement 2018-19
Box 1.2: Investing in care for new parents and children
The Government is committed to protecting and improving the wellbeing of new parents and their babies. In this Budget, the Government is investing in a landmark $156.5 million Parents Package. Key initiatives in 2018-19 include:
• $9.3 million to provide 100 more midwives to support maternity service growth across the State
• $7.6 million for a NSW Baby Bundle, starting 1 January 2019, to provide new parents with essential items to assist in their child’s early health and development
• $5.0 million to support treatment of childhood cancer and other genetic disorders by investing in technology and staff to enhance paediatric precision medicine research
• $4.3 million to expand the NSW post-natal home visits program, including funding two Karitane child and family health nurses to provide virtual home visits to new parents
• $2.2 million to partner with Tresillian to establish five new Family Care Centre Hubs in rural and regional locations to provide local intensive support at early infancy
• $2.0 million to upgrade play spaces in eight paediatric wards to make facilities more welcoming at often stressful times for families
• $1.5 million to enhance systems across the State to support the safe and timely transfer of pregnant women who need higher levels of care
• $1.1 million to increase services for pregnant women and mothers with severe and complex mental illness. Planning will also commence for the development of a new specialist mothers and babies mental health unit
• $200,000 to expand newborn bloodspot screening to include congenital adrenal hyperplasia. This is in addition to $2.0 million to introduce a Spinal Muscular Atrophy and Severe Combined Immunodeficiency pilot research program in 2018-19
• information campaigns to support prospective parents and pregnant women with important health advice.
More schools and learning opportunities
Around 164,000 more students are forecast to enter government schools by 2031. Growing our education system is key to ensuring the educational success of students across New South Wales.
The Government is investing a record $6.0 billion over four years to deliver more than 170 new and upgraded schools including:
commencing work in 2018-19 on 40 new and upgraded school projects, and beginning planning for over 20 new and upgraded schools
continuing works on more than 110 ongoing new and upgraded schools.
This record capital investment also includes the delivery of minor works projects including improvements to school facilities such as canteen and toilet block upgrades, sports courts and installation of shade covers, as well as land purchases for new and expanded schools.

Budget Highlights
Budget Statement 2018-19 1 - 9
In addition, the 2018-19 Budget also provides:
$500.0 million over five years for cooling in schools through the installation of reverse cycle air-conditioning to ensure New South Wales schools have the best environment to learn
$197.8 million over four years to extend universal access to preschool for three-year olds, as part of the Start Strong. This will help families with the cost of early childhood education as well as creating the best foundations for success
a continuation of the record $747.0 million planned maintenance investment across New South Wales schools announced in the 2017-18 Budget with $160.0 million invested in 2018-19
$30.0 million in 2018-19 to open school playgrounds and sporting facilities for community use on weekends and during school holidays through the Share Our Space program.
The best start in life
The Government is helping young people get ahead with initiatives for the best start in life and to enhance skills and qualifications.
Measures aimed at providing an optimal start in life include:
$156.5 million over four years for a Parents Package to improve the wellbeing of new parents and their babies (see Box 1.2)
ensuring that every child in New South Wales is provided the opportunity to partake in two years of early childhood education, with the continuation and expansion of the Start Strong program. $197.8 million is being invested over four years in the focus areas of:
– ensuring universal access to two years of early childhood education for all three-year old children from 2019 onwards – making New South Wales the first state in Australia to do so
– creating 4,800 new community preschool places in growth areas with $42.1 million in extra capital grants funding provided over four years
$39.2 million over four years to replace and refurbish Police Citizens Youth Clubs. These clubs create police and community partnerships focused on encouraging young people to be active, develop their skills, character and leadership, and prevent crime by and against young people. These funds will provide replacement clubs in Wagga Wagga, Walgett and Dubbo, a new club in the Windsor area and the upgrade of five regional clubs in Albury, Bourke, Griffith, Kempsey and Moree.
In addition, the 2018-19 Budget is helping to make training more accessible for students with:
$285.2 million (over six years) to fund 100,000 fee-free apprenticeships to increase apprenticeship commencements and address skills shortages in areas of significant demand in New South Wales (see Box 1.3)
additional investments into the Mobile Training Units to provide support for the delivery of training with TAFE Connected Learning Centres. This is part of the 2018-19 investment total of $179.5 million for TAFE NSW’s capital expenditure program.
Budget Highlights
1 - 10 Budget Statement 2018-19
Box 1.3: Attracting more apprentices and easing the financial load
The Government is providing 100,000 fee-free Smart and Skilled apprenticeships to students to ease the financial pressures faced by students and increase the uptake of apprenticeships.
Fees for apprenticeships are often a barrier to participation in training. Upfront fees, compounded by tool and travel costs, can be prohibitive for prospective apprentices on the minimum apprentice wage.
There are skilled labour shortages in many industries in New South Wales, including the construction, hospitality and automotive repair industries.
A fee-free apprenticeship can remove financial barriers to, and provide an incentive for, prospective students enrolling in a Smart and Skilled apprenticeship and enable them to take advantage of the high demand for jobs in these growing sectors.
Building a better-connected New South Wales
The 2018-19 Budget is building better transport infrastructure to get New South Wales residents where they need to go. A well-connected transport system, including investment in roads, rail and buses will help people spend less time in traffic and get home to their families sooner. This Budget includes:
$4.3 billion in 2018-19 towards delivery of Sydney Metro including $2.4 billion on Sydney Metro Northwest linking North West Sydney with Chatswood, and $1.9 billion on Sydney Metro City and Southwest linking Chatswood with Bankstown
a new $3.0 billion Restart NSW reservation for the Sydney Metro West, the city’s next underground metro railway between the Sydney CBD and Greater Parramatta. This funding, subject to the final business case, will fund completion of project development and commencement of land acquisition, early works and tunnelling. This is in addition to the NSW Government investment of $28.1 million in 2018-19 to fast track the planning and the final business case for this project
$1.8 billion in 2018-19 to continue the development and delivery of WestConnex
$1.2 billion in 2018-19 to continue the Pacific Highway upgrade program, including continuing construction between Woolgoolga and Ballina, and planning for the Coffs Harbour bypass
$648.2 million ($1.6 billion over four years) for the More Trains, More Services Program, which will enhance rail infrastructure and fleet to increase and improve rail services, including express services for Western Sydney
$438.9 million in 2018-19 (co-funded by NSW and Commonwealth Governments) for road upgrades to support the new Western Sydney Airport at Badgerys Creek, including continuing construction on the remainder of Bringelly Road as well as The Northern Road between Narellan and Penrith
$282.8 million in 2018-19 ($3.0 billion over four years) to continue planning or delivery of missing links on motorways and major routes in Sydney, including the new projects such as F6 extension Stage 1, Western Harbour Tunnel and Beaches Link and Sydney Gateway, and continuing NorthConnex
$281.3 million in 2018-19 to reduce congestion on Sydney roads by addressing critical pinch points, and continuing works for the M4 Smart Motorway
$258.0 million in 2018-19 ($2.1 billion over four years) of new investment in the Parramatta Light Rail Stage 1 to support growth in Western Sydney

Budget Highlights
Budget Statement 2018-19 1 - 11
$11.6 million in 2018-19 as a new investment to plan upgrades of Heathcote Road, including widening the Woronora River bridge and road widening between Holsworthy and Voyager Point.
Making New South Wales the best place to work and do business
A strong economy is only possible if businesses can thrive. The Government understands this and is investing in initiatives that will attract, support and encourage business activity across New South Wales.
The 2018-19 Budget introduces new measures and expands on existing programs, including:
increasing the payroll tax-free threshold from $750,000 to $1.0 million to help reduce the burden on businesses in New South Wales. The threshold will increase progressively over the next four years to 2021-22
establishing the first ever New South Wales Productivity Commission with an overarching focus on micro-economic reform to drive productivity and improve regulations. The Commission’s work is aimed at making it easier to do business, lowering the cost of living, making housing more affordable, and making our State the easiest to move to
$37.0 million in 2018-19 to accelerate and extend the roll out of the Easy to Do Business Program, in the cafes, restaurants and small bars, and the housing construction sectors in New South Wales, under the project agreement for Small Business Regulatory Reform agreed with the Commonwealth Government
$2.0 million ($7.1 million over four years) for civil justice initiatives to provide a responsive and effective civil justice system that will support people and small businesses to resolve matters quickly and efficiently, and to alleviate demand pressures on courts. Key initiatives include implementation of the pilot online dispute resolution program.
Supporting those who need it most
The Government is investing in a range of initiatives to ensure the ongoing provision of vital services to the most vulnerable. Key objectives of these initiatives include providing accessible healthcare, protecting our kids, reducing homelessness, creating sustainable housing and reducing domestic violence.
New initiatives in the 2018-19 Budget include:
$250.0 million for the New South Wales contribution to the Commonwealth Redress Scheme for survivors of child sexual abuse in NSW Government institutions
$61.7 million over four years in new funding to implement the NSW Homelessness Strategy 2018-2023 to support programs including Staying Home Leaving Violence, sustaining tenancy supports, social impact investment and transitional accommodation
$59.1 million over four years in new funding to support better safety, permanency and wellbeing outcomes for children, young people and their families with funding for 100 additional workers for the child protection system and investment in the open adoption program
$44.1 million over three years to support people impacted by domestic violence and reduce reoffending and re-victimisation
$10.0 million in 2018-19 ($55.0 million over four years) to implement a Mentally Healthy Workplaces Strategy to foster workplaces with an environment that supports and engages workers

Budget Highlights
1 - 12 Budget Statement 2018-19
a grant of $5.0 million for Adele House, a charity providing specialist drug rehabilitation and training services, towards a facility at Bucca Road on the New South Wales North Coast.
The Government is also continuing to support the State’s transition to the full National Disability Insurance Scheme (NDIS) on 1 July 2018 with:
$3.2 billion in 2018-19 as the NSW Government contribution to support the transition to the NDIS. This consists of an estimated $2.7 billion cash contribution and $477.5 million in-kind contribution through services provided by NSW Government agencies
$97.5 million in 2018-19 ($230 million over three years) for operational services until full transition to the NGO sector
$87.0 million in 2018-19 ($150 million over three years) for residual disability functions.
Investing in our regional communities
Regional New South Wales is high on the Government’s priority list with a range of initiatives in the 2018-19 Budget aimed at promoting the regions as an attractive place to live, work, do business and visit.
A new key initiative of this budget is the planned implementation of the Snowy Hydro Legacy Fund to facilitate reinvestment of proceeds from the Snowy Hydro Limited share sale. The intention of this program is to invest these gains in state-building infrastructure across regional New South Wales. The Government has appropriated an initial $40.0 million in 2018-19 to investigate the feasibility and implementation of potential projects.
In addition, the Government is investing:
$1.9 billion in 2018-19 on regional capacity enhancements with the continuation of upgrades to the Pacific and Princes Highways, and Central Coast and Hunter Roads, various projects and programs on roads in regional New South Wales and procurement of the Regional Rail Fleet Program
an additional $250.0 million over four years towards the Farm Innovation Fund, which provides concessional loans of up to $250,000 for investments in on-farm infrastructure to provide greater drought resilience, and $50,000 seven-year interest-free loans to allow farmers to transport feed, move livestock and preserve stock bloodlines
a new reservation of $155.0 million from Restart NSW for the new Shoalhaven River bridge at Nowra, subject to Restart NSW assurance
$153.4 million over four years (total of $178.4 million over five years from 2017-18) in new investments for the Regional Road Freight Corridor program as part of Restart NSW
a new $137.3 million over four years for Fixing Country Rail (Restart NSW) projects including $60.4 million towards the Junee to Griffith Line Upgrade, $40.0 million for the Berry to Bomaderry Rail Line and the OMEGA Tunnels Track Upgrade and $7.7 million for the Tarago Passing Loop Extension
$71.8 million new investment over four years towards the forestry sector including $34.0 million over four years for a loan scheme as part of the Forestry Innovation Fund to support innovation and productivity growth, an equity injection of $24.0 million to Forestry Corporation to support plantation investment, $9.2 million over four years for world-class forest mapping and monitoring and $4.6 million over four years for forestry contractor training and accreditation
$26.8 million over four years in new Resources for Regions programs including $7.8 million for the Upper Hunter Regional Mine Affected Roads program, $4.6 million for stage four of the South Orange Economic Development Corridor (Anson Street to Pinnacle Road) and $4.3 million for the Newcastle Beach Community Infrastructure Project

Budget Highlights
Budget Statement 2018-19 1 - 13
$26.7 million in 2018-19 for the Sealing Country Roads Program (Cobb and Silver City Highways) in Western New South Wales
$50.0 million over four years as a new initiative to upgrade research stations across rural and regional New South Wales to boost productivity and support world-class food and fibre production. This includes $40.0 million reserved in Restart NSW
a new $10.0 million over two years from 2018-19 to commence the Rural Health Infrastructure Program, providing the capacity to undertake upgrades and refurbishments of smaller rural facilities including Tenterfield, Scone, Gloucester and Dungog.
Protecting our communities
The Government is investing in critical infrastructure and services aimed at making our community safer, fairer and a better place to live and work and for visitors to explore and enjoy. The 2018-19 Budget is investing in new initiatives including:
$315.0 million in 2018-19 to improve road safety, including a significant increase in investment through the Road Safety Plan 2021 targeting areas where the majority of fatalities occur. This builds on existing programs funded through the Community Road Safety Fund including public education campaigns, road upgrades through the Safer Roads and Black Spot programs, as well as high-visibility police enforcement
$288.2 million over four years to further support the re-engineering of the NSW Police Force and provide the Police Commissioner with the flexibility to deploy resources according to need, and effectively address and respond to crime
$17.1 million ($56.4 million over four years) for the State Emergency Service Operational Fleet Replacement Program, replacing emergency vehicles and equipment inventory, marine vessels and trailers
$3.2 million ($6.5 million over two years) for the Rural Fire Service to repurpose emergency response helicopters provided by the Australian Defence Force to increase bushfire response capability
$52.6 million over four years to implement the National Facial Biometric Matching Capability in New South Wales, increasing the capability to identify suspects and victims of terrorism and other criminal activity
$22.0 million ($89.3 million over four years) to implement the Terrorism (High Risk Offenders) Act 2017, enabling post-sentence detention in a correctional centre or community supervision of offenders who pose a risk of committing a terrorism offence in the future
an additional $151.1 million in 2018-19 ($467.3 million over four years) in the Critical Communications Enhancement Program to expand the coverage of the Government radio network and improve critical communications during emergencies.
Sports, arts and culture
The 2018-19 Budget is funding new projects to develop and support arts and culture, increase attendance at sporting and cultural events, sustain cultural precincts, improve participation in sport and active recreation and support our athletes to become world-class. The Government is also delivering new investment in high-quality stadia, venues and facilities, including:
major stadia to attract world-class sporting and entertainment events and address ageing stadium infrastructure with $729.0 million for construction of a new stadium at Moore Park to replace the Sydney Football Stadium. This is in addition to the existing investment of $183.7 million to complete construction of the Western Sydney Stadium at Parramatta
Budget Highlights
1 - 14 Budget Statement 2018-19
$245.0 million in 2018-19 as part of the Government’s $645.0 million contribution to construct the new Powerhouse Museum in Parramatta as part of a new arts and cultural precinct, expand the Museums Discovery Centre, and plan a creative industries precinct in Ultimo
$100.0 million reserved for the Greater Sydney Sport Facility Fund to increase the number and quality of sporting facilities in densely populated areas
$20.0 million reserved from Restart NSW for the creation and upgrade of inclusive playspaces as part of the Everyone Can Play in NSW program
$7.5 million in 2018-19 ($59.5 million over four years) for the construction of the Western Sydney Centre of Innovation in Plant Sciences, to enable the protection of an internationally significant botanical collection of over 1.4 million plant specimens
$5.8 million in 2018-19 ($50.5 million over three years) to upgrade the Australian Museum to deliver a new touring exhibition hall and education and visitor facilities. This upgrade will also enable Sydney to be one of ten cities worldwide to host the King Tutankhamun exhibition before it permanently returns to Egypt
$1.5 million in 2018-19 ($6.1 million over four years) for the ongoing operation of the expanded Anzac Memorial, which will commemorate and preserve the legacy of servicemen and women.
In addition, the Government is continuing with:
the rejuvenation of the Walsh Bay Arts Precinct with $110.4 million invested in 2018-19 ($219.6 million over three years)
the Regional Cultural Fund with $30.0 million invested in 2018-19 ($87.9 million over three years) to support development of arts and cultural activities in our regions
the Regional Sport Infrastructure Fund with an investment of $100.0 million over five years to increase the number and quality of regional sporting facilities
an investment of $24.1 million in 2018-19 ($72.4 million over four years), some of which is new, for grants to support screen production across New South Wales.
Budget Highlights
Budget Statement 2018-19 1 - 15
Box 1.4: Creative Kids Rebate
From 1 January 2019, families in New South Wales will be eligible to receive up to $100 each year for every school-age child to support access to creative and cultural activities outside school. The Creative Kids Rebate complements, and is in addition to, the Active Kids Rebate announced in the 2017-18 Budget – parents will be able to access both rebates.
Creative and cultural activities can add financial pressure to families. To help with these costs, the Creative Kids Rebate will provide assistance with fees for a broad range of structured cultural activities and lessons including:
• music
• drama and theatre
• language classes
• visual arts
• coding, graphic design and other forms of digital creativity.
Participation in extra-curricular activities, including creative arts and sports, is an integral part of learning growth and development. These activities help build important social, emotional and physical skills, including resilience, initiative and team work. The Creative Kids Rebate will support more children across New South Wales to access these critical learning opportunities by easing cost pressures on families.
Parents and caregivers of school-aged children will be able to apply for the Creative Kids Rebate alongside the existing Active Kids Rebate through Service NSW.
Empowering Aboriginal communities
New investments are being made in the 2018-19 Budget to support and empower Aboriginal people across New South Wales, including:
$33.1 million over four years for the Aboriginal Social Housing Strategy to deliver innovative housing solutions, support for Aboriginal people and to build the Aboriginal Community Housing sector
$10.0 million over four years for social impact investment to support Aboriginal economic development. This investment will support innovative community-led initiatives to improve Aboriginal employment outcomes, wealth creation and well-being
$3.75 million in 2018-19 to support an additional 1,000 student placements in the Clontarf Foundation program, which encourages Aboriginal boys and young men to stay at school by harnessing their passion for sport
$2.8 million in 2018-19 for the establishment of Australia’s first Aboriginal Languages Trust under the Aboriginal Languages Act 2017. The Aboriginal Languages Trust will be responsible for resourcing local language activities and developing and implementing a five year strategic plan to support Aboriginal languages at local, regional and State levels
$2.7 million over three years for the expansion of the Youth Koori Court to the new Surry Hills Children’s Court, providing at risk young people with links to relevant support agencies.

Budget Highlights
1 - 16 Budget Statement 2018-19
Preserving our environment
The Government recognises the value of preserving the natural environment.
The 2018-19 Budget provides a total investment of $1.9 billion in 2018-19 towards valued and protected environment and heritage initiatives including:
$632.3 million ($2.5 billion over four years) for national parks, walking trails, public parklands and gardens to grow tourism and improve liveability and sustainability. This includes new upgrades to national walking tracks in Sydney, Port Stephens, Tweed-Byron, on the Macleay Valley Coast and the South Coast
$89.4 million ($345 million over four years) for the Biodiversity Conservation Trust of New South Wales to deliver private land conservation outcomes across priority areas
$36.8 million to protect threatened species including $24.9 million through the State’s Saving our Species program and $11.9 million to implement the New South Wales Koala Strategy.
Other new initiatives the Government is investing in include:
$25.0 million in 2018-19 ($100.0 million over four years) for the acquisition of green and open spaces to improve the liveability of New South Wales communities
$9.5 million in 2018-19 ($37.5 million over four years) to partner with communities, councils and businesses to increase the average tree canopy across Sydney as part of the Five Million Trees for Greater Sydney by 2030 program.
Planning the future of Western Sydney
Western Sydney remains an area of focus for the NSW Government. Planning for the region includes aspirations for a new Western Sydney Airport, providing growth in supporting industries and infrastructure, world-class jobs and a great quality of life.
The 2018-19 Budget includes the following new initiatives for Western Sydney:
$3.0 billion reserved from Restart NSW for the Sydney Metro West, the city’s next underground metro railway. This will provide the fastest, easiest and most reliable journey between the Sydney CBD and Greater Parramatta. Further details are provided above under Building a better-connected New South Wales
$258.0 million in 2018-19 ($2.1 billion over four years) of new investment in stage one of the Parramatta Light Rail to support growth in Western Sydney and create new communities by connecting places
commitments under the Western Sydney City Deal, including:
– $60.0 million as the NSW Government contribution towards the $150.0 million Western Sydney Parkland City Liveability Program
– $50.0 million (including $35.0 million in 2018-19) towards planning and the final business case for the North-South Rail Link to service the new Western Sydney Airport as part of a joint funding commitment of $100.0 million between the Commonwealth and New South Wales Governments through the Western Sydney City Deal
– $15.0 million New South Wales contribution to a $30.0 million Western Parklands City housing package
– $7.5 million in 2018-19 ($59.5 million over four years) for the construction of the Western Sydney Centre of Innovation in Plant Sciences
– the Aerotropolis development surrounding Western Sydney Airport and establishing the Western Sydney Investment Attraction Office.
Budget Highlights
Budget Statement 2018-19 1 - 17
In addition, the Government is:
working with the Commonwealth Government to fund road upgrades supporting the new Western Sydney Airport at Badgerys Creek, with $438.9 million allocated in 2018-19
investing $132.2 million in 2018-19, inclusive of new funding, for road upgrades to support population and economic growth in Western Sydney, including construction of the first stage of the Campbelltown Road upgrade at Edmondson Park, improvements to Appin Road, and commencing construction of the Jane Street and Mulgoa Road upgrade at Penrith.
Investing for the future, today
The unprecedented strength of the Government’s balance sheet is supported by its successful asset recycling strategy and disciplined financial management. To ensure the benefits of today can be shared with the generations of tomorrow, the Government is establishing a world first sovereign wealth fund – the NSW Generations Fund (NGF). The NGF is a dual-purpose fund that combines the objectives of keeping debt at sustainable levels in line with a triple-A credit rating and supporting investment in communities across New South Wales. The NGF is supported by legislation to ensure funds will be available for debt retirement. As the fund grows over time it will support the Government’s infrastructure program without saddling future generations with a debt burden. NSW Treasury Corporation, the State’s financial markets partner, will manage the NGF - building on their proven track record in managing the State’s financial assets.
As the NGF grows, up to 50 per cent of investment returns will support local communities through the My Community Dividend initiative - a new initiative where the community can propose and vote online for the investments they need in their local area.
To oversee the NGF, the Government will establish the NGF Advisory Board who will contribute real-world expertise to help shape the future of the NGF and My Community Dividend.

Budget Statement 2018-19 2 - 1
2. FISCAL STRATEGY AND OUTLOOK
2.1 Fiscal strategy
The NSW Government has delivered on its fiscal strategy — adhering to the requirements of the Fiscal Responsibility Act 2012 (FRA), and maintaining sustainable finances while delivering the services and infrastructure required for a growing state. This has been achieved by:
ensuring budget discipline to maintain surpluses
funding capital expenditure through budget surpluses and asset recycling proceeds as much as possible, and
maintaining prudent debt levels consistent with a triple-A credit rating (see Box 2.1).
The FRA makes New South Wales unique across Australian and international jurisdictions with its legislated requirement to maintain a triple-A credit rating. This objective is also supported by legislated fiscal targets and principles of sound financial management.1
Every year since 2012, the Government has met the fiscal targets mandated by the FRA, and the Government will again meet those targets in this Budget (see Table 2.1 and Appendix E Performance and Reporting under the Fiscal Responsibility Act for more details).
1 The principles of sound financial management are: responsible and sustainable spending, taxation and infrastructure
investment; effective financial and asset management, including sound policies and processes; and achieving intergenerational equity.
• Across the next four years, the 2018-19 Budget is projecting average budget surpluses of $1.6 billion. The Government has maintained a strong operating position which is enabling additional investment in essential health, education, transport and disability services, despite a softening property market and a declining share of GST revenue.
• In 2017-18, New South Wales again leads the nation with a $3.9 billion surplus and negative net debt for the third year in a row.
• Net debt is projected to reach a record low of negative $9.8 billion at June 2018, driven by a strong operating result and proceeds from the Snowy Hydro sale. Over the four years to June 2022, the Government is maintaining net debt at a sustainable level consistent with a triple-A credit rating.
• The Government’s strong fiscal management and successful asset recycling strategy, coupled with a strong economy, have enabled a record $87.2 billion infrastructure program across the budget and forward estimates.
• New South Wales continues to meet the targets outlined in the Fiscal Responsibility Act 2012, including maintaining its triple-A credit rating and keeping expense growth below long-term revenue growth of 5.6 per cent.
• The 2018-19 Budget also invests in the future of New South Wales by creating the NSW Generations Fund to share the proceeds of the State’s success today with future generations.

Fiscal Strategy and Outlook
2 - 2 Budget Statement 2018-19
As the centrepiece of the State’s fiscal strategy, the FRA helps limit the cost of government borrowing and helps maintain economic confidence in New South Wales. It also holds the Government to account – the Act’s requirements cannot be changed without Parliament’s approval. A statutory review of the FRA is currently underway and will be tabled in both houses of Parliament later this year.
Table 2.1: Fiscal objective and targets
Requirements of the Fiscal Responsibility Act 2012
Targetmet?
Explanation
Objective: Maintain the triple-A credit rating
Standard & Poor's Reaffirmed AAA with a negative outlook(a) in September 2017
Moody's Reaffirmed Aaa with a stable outlook in October 2017
Target 1: Annual expense growth less than the long-term average revenue growth
Annual expense growth is less than long-term average revenue growth (5.6 per cent) across all five years in this budget
Target 2: Elimination of the State's unfunded superannuation liability by 2030
NSW is on track to be fully funded by 2030 based on the funding program at the last triennial review (December 2015)
(a) Due to a negative outlook on the Commonwealth Government (a sub-sovereign cannot be rated higher than the sovereign)
Box 2.1: NSW belongs to the exclusive global triple-A club
New South Wales is one of only two Australian states rated triple-A by both major credit rating agencies. Internationally, there are only six state or provincial governments rated triple-A by Moody’s and ten by Standard & Poor’s (as at June 2018). This excludes the United States where states are assessed under a different methodology.
A triple-A credit rating reflects an independent assessment of a strong fiscal and economic position, a solid institutional framework and sustainable debt levels. Triple-A rated jurisdictions are also generally able to borrow at lower interest rates given their strength relative to lower-rated governments.
Chart 2.1: Credit ratings of Australian states and territories as at June 2018
0
1
2
3
NSW VIC ACT QLD WA SA Tas NT
Standard & Poor's Moody's
AAA / Aaa
AA+ / Aa1
AA / Aa2
The rating of a state government is capped by its sovereign’s rating. As at June 2018, Standard & Poor’s has the Commonwealth’s triple-A rating on a negative outlook, which means there may be a rating downgrade in the next six months to two years. Consequently, Standard & Poor’s also has the New South Wales, Victorian and Australian Capital Territory triple-A ratings on a negative outlook. In the event of a sovereign downgrade, NSW will continue to manage its fiscal position consistent with a triple-A credit rating.
Fiscal Strategy and Outlook
Budget Statement 2018-19 2 - 3
The Government is also embarking on a once-in-a-generation improvement in the State’s financial management practices. On 7 June 2018, the Government Sector Finance Bill 2018 was passed by Parliament as the next stage in modernising these financial frameworks (see Box 2.2).
Box 2.2: A new framework to underpin financial management transformation
The Government is finalising its Financial Management Transformation program, following the launch of the Prime financial management system and a shift to an outcomes-focused budgeting framework.
The third and final pillar of the Financial Management Transformation program will reform the existing legislative framework, which dates back to the 1980s. It will modernise existing provisions on the use of financial services, which will allow for a broader range of banking services, and strengthen the Government’s financial management performance, accountability and transparency, bringing New South Wales’ financial management in line with international best practice.
2.2 Budget position and outlook
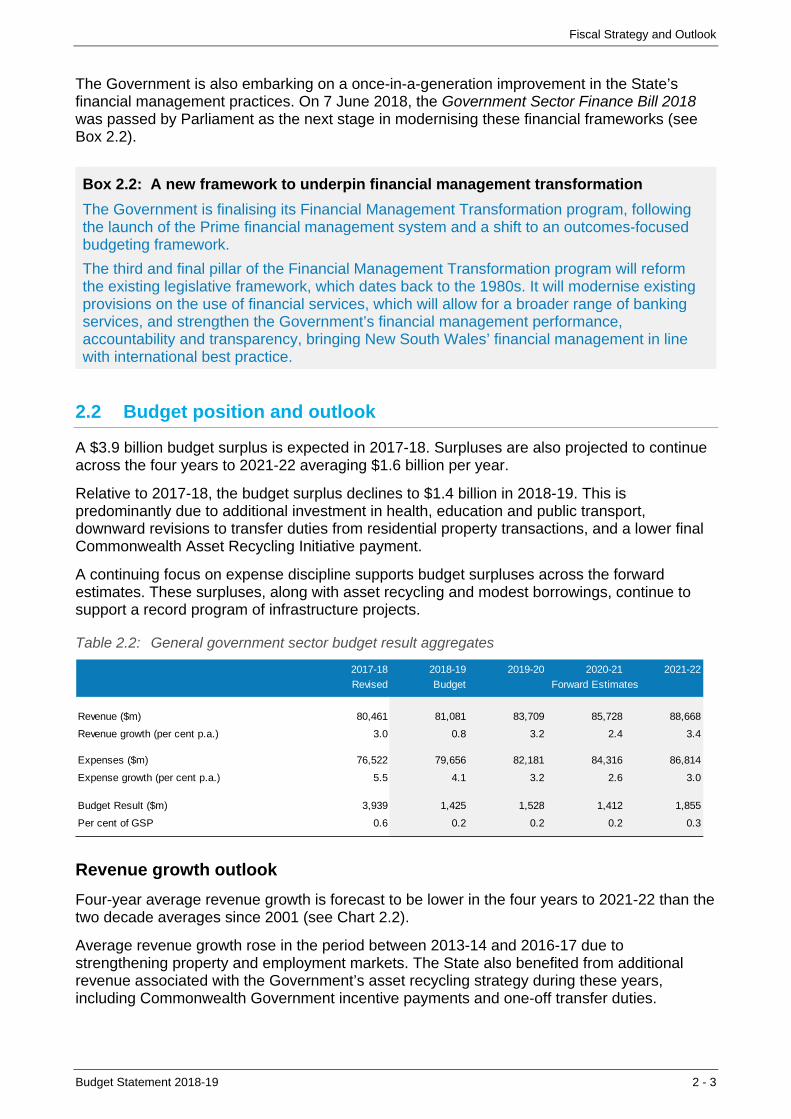
A $3.9 billion budget surplus is expected in 2017-18. Surpluses are also projected to continue across the four years to 2021-22 averaging $1.6 billion per year.
Relative to 2017-18, the budget surplus declines to $1.4 billion in 2018-19. This is predominantly due to additional investment in health, education and public transport, downward revisions to transfer duties from residential property transactions, and a lower final Commonwealth Asset Recycling Initiative payment.
A continuing focus on expense discipline supports budget surpluses across the forward estimates. These surpluses, along with asset recycling and modest borrowings, continue to support a record program of infrastructure projects.
Table 2.2: General government sector budget result aggregates
2017-18 2018-19 2019-20 2020-21 2021-22
Revised Budget
Revenue ($m) 80,461 81,081 83,709 85,728 88,668
Revenue growth (per cent p.a.) 3.0 0.8 3.2 2.4 3.4
Expenses ($m) 76,522 79,656 82,181 84,316 86,814
Expense growth (per cent p.a.) 5.5 4.1 3.2 2.6 3.0
Budget Result ($m) 3,939 1,425 1,528 1,412 1,855
Per cent of GSP 0.6 0.2 0.2 0.2 0.3
Forward Estimates
Revenue growth outlook
Four-year average revenue growth is forecast to be lower in the four years to 2021-22 than the two decade averages since 2001 (see Chart 2.2).
Average revenue growth rose in the period between 2013-14 and 2016-17 due to strengthening property and employment markets. The State also benefited from additional revenue associated with the Government’s asset recycling strategy during these years, including Commonwealth Government incentive payments and one-off transfer duties.

Fiscal Strategy and Outlook
2 - 4 Budget Statement 2018-19
The 3.0 per cent annual revenue growth figure for 2017-18 (see Table 2.2) is expected to be slightly higher than anticipated in the 2017-18 Half-Yearly Review, primarily due to higher than budgeted returns on the NSW Infrastructure Future Fund (NIFF).
Chart 2.2: Four-year average revenue growth
5.9
4.2
0.0
1.0
2.0
3.0
4.0
5.0
6.0
7.0
8.0
9.0
Pe
r c
en
t
Average Revenue Growth (4 year) Average Revenue Growth (2001-2011) Average Revenue Growth (2012-2022)
Four-year average revenue growth is projected to be 2.5 per cent across the budget and forward estimates, below the 4.2 per cent average for the decade to 2021-22. This is primarily due to lower transfer duties from a softening in residential property transaction volumes and prices. This is partially offset by upward revisions to GST revenue forecasts and mining royalties.
Expense growth outlook
Following a similar trend to revenue, four-year average expense growth is projected to be lower in the decade to the end of the forward estimates than in preceding decade (see Chart 2.3). Across the budget and forward estimates, four-year average expense growth is projected to be 3.2 per cent, below the 4.3 per cent decade average to 2021-22. This is well below expense growth in the previous decade and reflects careful management of public spending. Expenditure restraint will remain important to supporting a sustainable budget position in the years ahead as revenue growth moderates and cost pressures emerge in the delivery of essential services such as health, education and transport.
Chart 2.3: Four-year average expense growth
6.4
4.3
0.0
1.0
2.0
3.0
4.0
5.0
6.0
7.0
8.0
9.0
Per
cen
t
Average Expense Growth (4 year) Average Expense Growth (2001-2011) Average Expense Growth (2012-2022)
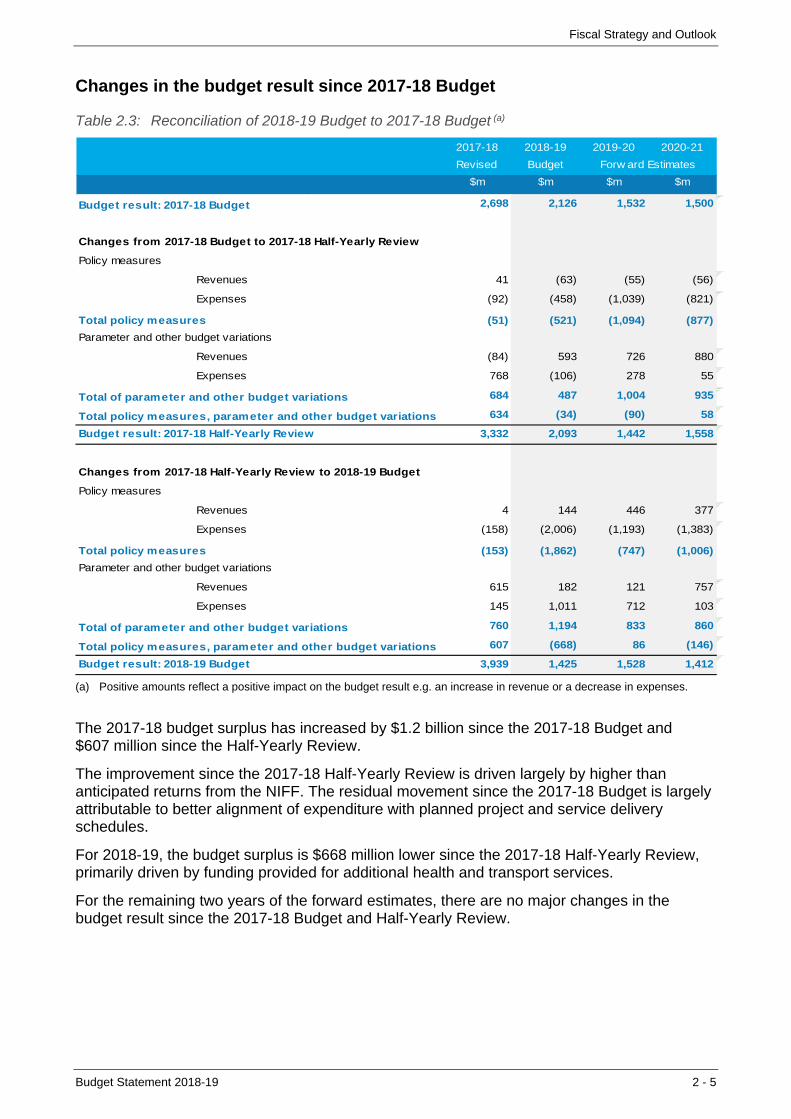
Fiscal Strategy and Outlook
Budget Statement 2018-19 2 - 5
Changes in the budget result since 2017-18 Budget
Table 2.3: Reconciliation of 2018-19 Budget to 2017-18 Budget (a)
2017-18 2018-19 2019-20 2020-21
Revised Budget
$m $m $m $m
Budget result: 2017-18 Budget 2,698 2,126 1,532 1,500
Changes from 2017-18 Budget to 2017-18 Half-Yearly Review
Policy measures
Revenues 41 (63) (55) (56)
Expenses (92) (458) (1,039) (821)
Total policy measures (51) (521) (1,094) (877)
Parameter and other budget variations
Revenues (84) 593 726 880
Expenses 768 (106) 278 55
Total of parameter and other budget variations 684 487 1,004 935
Total policy measures, parameter and other budget variations 634 (34) (90) 58
Budget result: 2017-18 Half-Yearly Review 3,332 2,093 1,442 1,558
Changes from 2017-18 Half-Yearly Review to 2018-19 Budget
Policy measures
Revenues 4 144 446 377
Expenses (158) (2,006) (1,193) (1,383)
Total policy measures (153) (1,862) (747) (1,006)
Parameter and other budget variations
Revenues 615 182 121 757
Expenses 145 1,011 712 103
Total of parameter and other budget variations 760 1,194 833 860
Total policy measures, parameter and other budget variations 607 (668) 86 (146)
Budget result: 2018-19 Budget 3,939 1,425 1,528 1,412
Forw ard Estimates
(a) Positive amounts reflect a positive impact on the budget result e.g. an increase in revenue or a decrease in expenses.
The 2017-18 budget surplus has increased by $1.2 billion since the 2017-18 Budget and $607 million since the Half-Yearly Review.
The improvement since the 2017-18 Half-Yearly Review is driven largely by higher than anticipated returns from the NIFF. The residual movement since the 2017-18 Budget is largely attributable to better alignment of expenditure with planned project and service delivery schedules.
For 2018-19, the budget surplus is $668 million lower since the 2017-18 Half-Yearly Review, primarily driven by funding provided for additional health and transport services.
For the remaining two years of the forward estimates, there are no major changes in the budget result since the 2017-18 Budget and Half-Yearly Review.
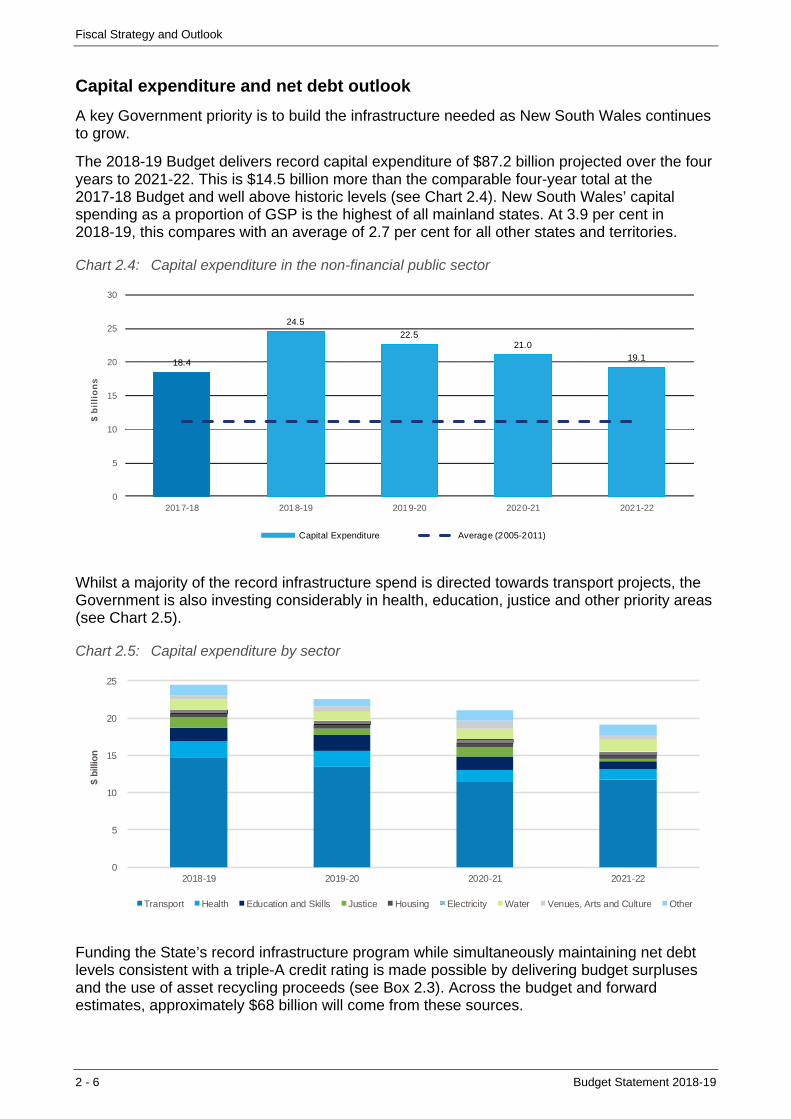
Fiscal Strategy and Outlook
2 - 6 Budget Statement 2018-19
Capital expenditure and net debt outlook
A key Government priority is to build the infrastructure needed as New South Wales continues to grow.
The 2018-19 Budget delivers record capital expenditure of $87.2 billion projected over the four years to 2021-22. This is $14.5 billion more than the comparable four-year total at the 2017-18 Budget and well above historic levels (see Chart 2.4). New South Wales’ capital spending as a proportion of GSP is the highest of all mainland states. At 3.9 per cent in 2018-19, this compares with an average of 2.7 per cent for all other states and territories.
Chart 2.4: Capital expenditure in the non-financial public sector
18.4
24.5
22.521.0
19.1
0
5
10
15
20
25
30
2017-18 2018-19 2019-20 2020-21 2021-22
$ b
illi
on
s
Capital Expenditure Average (2005-2011)
Whilst a majority of the record infrastructure spend is directed towards transport projects, the Government is also investing considerably in health, education, justice and other priority areas (see Chart 2.5).
Chart 2.5: Capital expenditure by sector
0
5
10
15
20
25
2018-19 2019-20 2020-21 2021-22
$ b
illio
n
Transport Health Education and Skills Justice Housing Electricity Water Venues, Arts and Culture Other
Funding the State’s record infrastructure program while simultaneously maintaining net debt levels consistent with a triple-A credit rating is made possible by delivering budget surpluses and the use of asset recycling proceeds (see Box 2.3). Across the budget and forward estimates, approximately $68 billion will come from these sources.
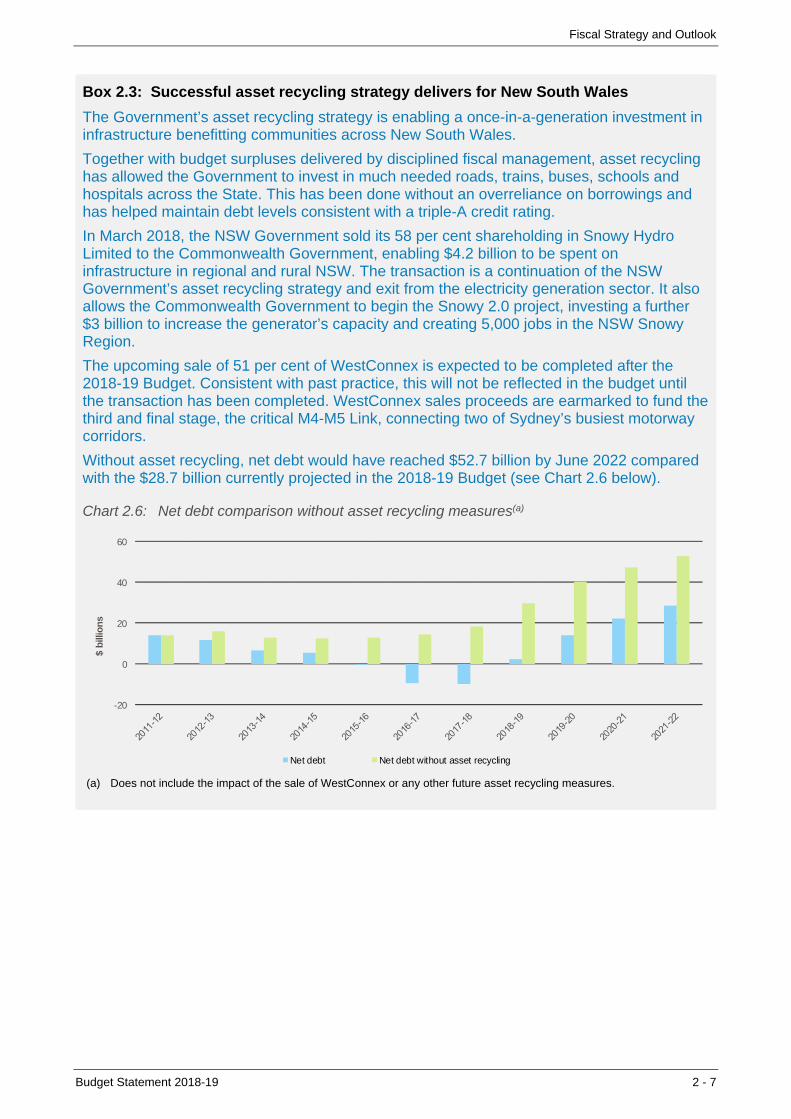
Fiscal Strategy and Outlook
Budget Statement 2018-19 2 - 7
Box 2.3: Successful asset recycling strategy delivers for New South Wales
The Government’s asset recycling strategy is enabling a once-in-a-generation investment in infrastructure benefitting communities across New South Wales.
Together with budget surpluses delivered by disciplined fiscal management, asset recycling has allowed the Government to invest in much needed roads, trains, buses, schools and hospitals across the State. This has been done without an overreliance on borrowings and has helped maintain debt levels consistent with a triple-A credit rating.
In March 2018, the NSW Government sold its 58 per cent shareholding in Snowy Hydro Limited to the Commonwealth Government, enabling $4.2 billion to be spent on infrastructure in regional and rural NSW. The transaction is a continuation of the NSW Government’s asset recycling strategy and exit from the electricity generation sector. It also allows the Commonwealth Government to begin the Snowy 2.0 project, investing a further $3 billion to increase the generator’s capacity and creating 5,000 jobs in the NSW Snowy Region.
The upcoming sale of 51 per cent of WestConnex is expected to be completed after the 2018-19 Budget. Consistent with past practice, this will not be reflected in the budget until the transaction has been completed. WestConnex sales proceeds are earmarked to fund the third and final stage, the critical M4-M5 Link, connecting two of Sydney’s busiest motorway corridors.
Without asset recycling, net debt would have reached $52.7 billion by June 2022 compared with the $28.7 billion currently projected in the 2018-19 Budget (see Chart 2.6 below).
Chart 2.6: Net debt comparison without asset recycling measures(a)
(a) Does not include the impact of the sale of WestConnex or any other future asset recycling measures.
-20
0
20
40
60
$ b
illio
ns
Net debt Net debt without asset recycling

Budget Statement 2018-19 3 - 1
3. THE ECONOMY
• New South Wales’ economic outperformance, which began in 2014-15, continued in 2017-18 with expectations of 3 per cent economic growth. This will mark an exceptional four-year period with economic growth above trend (2½ per cent) and above the national average. Household consumption, public infrastructure, dwelling construction and service exports have been the key drivers of this strong performance.
• The NSW economy is forecast to perform well in 2018-19 and 2019-20, with gross state product (GSP) increasing by 2¾ per cent in both years. Growth drivers are shifting from dwelling construction and household consumption, towards business investment and more broad-based strength in exports.
• The State’s record infrastructure program and its spillover into private investment continues to drive growth. Almost half of the national pipeline of public engineering projects underway is in New South Wales. Strengthening global and national economies are expected to boost exports, spurring businesses to lift investment and employment.
• The labour market is experiencing strong momentum, with employment growth of 3 per cent forecast in 2017-18. This has fostered near record workforce participation, which combined with above-trend population growth is expected to see the unemployment rate stabilise at around 4¾ per cent over the forward estimates.
• A tightening national labour market, rising advertised salaries and emerging wage pressures in certain industries set the preconditions for a modest rise in wages growth over the next few years.
• Strong jobs growth has provided a boost to household income and consumption in 2017-18. Over the next two years, the prospect of easing house prices, modest wages growth, elevated household debt and tightening financial conditions are expected to keep consumption growth below its long-run average.
3.1 A strong economic outlook
Table 3.1: Economic performance and outlook (a) 1
2017-18 2018-19 2019-20 2020-21 2021-22
Forecasts Forecasts Forecasts Projections Projections
Real state final demand 3¾ 3 3 - -
Real gross state product 3 2¾ 2¾ 2½ 2½
Employment 3 1¾ 1½ 1¼ 1¼
Unemployment rate (b)4¾ 4¾ 4¾ 4¾ 4¾
Sydney consumer price index (c)2 2¼ 2¼ 2½ 2½
Wage price index 2 2½ 2¾ 3 3¼
Nominal gross state product 5 4 4½ 5 5
Population (d)1.6 1.6 1.5 1.4 1.4
1.0
New South Wales2016-17
Outcome
3.9
2.9
5.0
2.0
2.0
6.4
1.6 Sources: ABS 5206.0, 5220.0, 6202.0, 6401.0, 6345.0, 3101.0 and NSW Treasury .
(a) Per cent change, annual average unless otherwise indicated (b) Annual average, per cent (c) 2017-18 to 2020-21 include a ¼ percentage point contribution from tobacco excise increases (d) Per cent change through the year to 30 June. Forecasts are rounded to the nearest 0.1 percentage points.
1 Economic forecasts are based on data available at the time they were prepared, which includes results to June 2017 for GSP,
to the December quarter 2017 for state final demand, to the March quarter 2018 for the wage price index and the consumer price index, to the September quarter 2017 for population and to April 2018 for the labour force.

The Economy
3 - 2 Budget Statement 2018-19
Since 2014-15 the NSW economy has shown exceptional strength, with per capita GSP growth averaging 1.7 per cent a year, by far the strongest among the states (see Chart 3.1). This strong growth has also flowed to New South Wales’ regions (see Box 3.1).
This strength has been underpinned by households—through dwelling investment and household consumption—supported by strong gains in dwelling prices, above-trend population growth and low interest rates. Public investment has also made an impressive contribution, reflecting the Government’s asset recycling strategy, with positive spillovers for business investment and employment. Service exports are another highlight, with relatively broad-based growth across tourism, education and professional and technical business services. Education related travel has been a standout.
While conditions in the housing market continue to soften, the overall economic outlook remains favourable. External demand conditions are likely to improve as the national and global economies strengthen. Growing Asian demand, low interest rates, a lower Australian dollar, above-trend population growth, and a historically large infrastructure and residential construction pipeline continue to provide support.
Consequently, the economy is forecast to maintain above-trend growth for the next two years. The pace is, however, expected to ease and the composition of growth shift towards exports and business investment and away from household consumption and dwelling investment.
Chart 3.1: NSW average GSP per capita growth since 2014-15 has outperformed other states
-1.0
-0.5
0.0
0.5
1.0
1.5
2.0
NSW VIC TAS QLD SA WA
Pe
r ce
nt c
ha
ng
e, a
nn
ual a
vera
ge
(20
14
-15
to 2
01
6-1
7)
Australia
Source: ABS 5220.0 and NSW Treasury
The public sector is expected to remain a key source of strength, underpinned by the State’s record $87.2 billion four-year capital program and the expansion of services such as the National Disability Insurance Scheme (NDIS). Public investment is expected to contribute around ½ a percentage point to economic growth, on average, over 2017-18 and 2018-19. This is consistent with its contribution over the previous two years and around four times the historical average. Supported by the approval of new major transport projects, public investment is forecast to boost economic growth by a ¼ of a percentage point in 2019-20. In addition to the direct contribution during the construction phase, this infrastructure will significantly increase the productive capacity of the economy in the long term (see Chapter 4 in this Budget Statement).
Business investment is forecast to grow faster over the three forecast years than at any time since 2008-09. Buoyed by public infrastructure investment and broadening demand for exports, business investment is expected to contribute around twice its long-run average to economic growth (see Box 3.3). This is expected to partially offset a modest outlook for household consumption growth and easing dwelling construction. Growth in household consumption is expected to be below its long-run average over the next two years as declining house prices, high household debt, modest wages growth and tightening credit conditions see households limit spending. While the dwelling construction cycle has peaked, the large pipeline of projects is expected to support elevated levels of activity for some time yet.

The Economy
Budget Statement 2018-19 3 - 3
Box 3.1: Prospering regional economies2
In regional New South Wales employment growth has accelerated over the past three years, averaging 2.4 per cent annually, well above the long-run average of 1.5 per cent. This growth has been concentrated in full-time employment, which accounted for more than 66 per cent of additional jobs in the regions. Regional female employment growth has been particularly impressive, growing by 3.6 per cent annually over the past three years, accounting for 70 per cent of total regional employment growth.
Strong employment growth has contributed to a significant fall in the regional unemployment rate, from its post-mining boom peak of 7.3 per cent in 2015, to 5.7 per cent currently. This is 0.6 percentage points below its long-term level (see Chart 3.2).
Chart 3.2: The regional unemployment rate is well below its long run average(a)
-2.0
-1.5
-1.0
-0.5
0.0
0.5
1.0
1.5
2.0
2.5
Apr-02 Apr-06 Apr-10 Apr-14 Apr-18
Per
cent
age
poin
ts, d
iffe
ren
ce
Sydney
Regional NSW
Newcastle and Illawarra
Source: ABS 6291.0.55.001 and NSW Treasury
(a) Unemployment rate deviation from long run average
Solid labour market conditions, affordable housing and attractive lifestyles are enticing more people from Sydney, Newcastle and the Illawarra to regional areas—in net terms 13,000 people made the move in 2016-17. Around 57 per cent of this flow was to three regions—the Mid North Coast, the Hunter Valley (excluding Newcastle) and the Central Coast.
This trend is expected to continue as job vacancies for these regions (including Newcastle) rose by 17.2 per cent, on average, over the year to April 2018.
This migration and strong employment growth are driving demand for housing outside of Sydney. The value of residential building approvals in regional New South Wales is at a record high of $4.5 billion over the last year. The Hunter Valley (excluding Newcastle), Central Coast and Richmond-Tweed account for 38.8 per cent of demand. Approvals in Newcastle and the Illawarra are up 57 per cent over the past three-years, reaching a record high. This has partially offset slowing approvals in Sydney.
Private non-residential building approvals are also at a record high in regional areas (see Chart 3.3). Increased demand for services has seen annual approvals for household service-related buildings double over the past year. This growth has been concentrated in the Coffs Harbour-Grafton and the Mid North Coast areas.
Chart 3.3: Household services supporting non-residential building(a)
0.0
0.2
0.4
0.6
0.8
1.0
1.2
1.4
1.6
1.8
2.0
Jul-12 Jun-14 May-16 Apr-18
$ M
illio
ns,
12 m
onth
sum
Household ServicesCommericalIndustr ialRegional NSW
Source: ABS 8731.0 and NSW Treasury
(a) Private sector building approvals
Strong labour markets, attractive living conditions and record construction activity demonstrate that, assisted by the right policies, the State’s regional areas can flourish.
2 Regional New South Wales excludes Sydney, Newcastle and Lake Macquarie, and Illawarra, but includes the Central
Coast. All figures are presented on an annual average basis.

The Economy
3 - 4 Budget Statement 2018-19
Strong labour market momentum lifting participation to record highs
Employment growth has rebounded to an estimated 3 per cent in 2017-18, led by full-time jobs, which accounted for more than 60 per cent of additional employment over the past year. At the same time, average hours worked have continued their long-term decline as full-time employees are tending to work fewer hours.
Chart 3.4: Labour supply adjusting to meet labour demand
-4
-3
-2
-1
0
1
2
3
4
5
May-08 May-09 May-10 May-11 May-12 May-13 May-14 May-15 May-16 May-17 May-18
Per
ce
nt c
hang
e, t
hrou
gh t
he y
ear
15+ Population Par ticipation rate Unemployment rate Employment
Source: ABS 6202.0 and NSW Treasury
Employment growth has been concentrated in labour-intensive industries, with the largest contributions coming from health & social assistance (0.7 percentage points, supported by the NDIS), construction (0.5 percentage points), education & training (0.3 percentage points) and retail trade (0.7 percentage points).
Demand for labour has been supported by strong economic activity and modest wages growth. Strong demand has encouraged people into the labour force, through inward migration and higher workforce participation (see Chart 3.4). This has kept the unemployment rate fairly stable at around 5 per cent, the lowest of any state. The NSW participation rate is near a record high—led by a record high female participation rate of 59.9 per cent in May 2018 (see Box 3.2).
Forward indicators of labour demand, such as job advertisements and hiring intentions, suggest employment momentum will be maintained in the near term. Over the next two years, employment growth is expected to come down from the current impressive highs to be more consistent with growth in economic activity. Nonetheless the outlook remains upbeat. Employment is forecast to expand by an above-trend rate of 1¾ per cent in 2018-19, and 1½ per cent in 2019-20. With elevated population growth and workforce participation, the unemployment rate is likely to ease only a little further and remain anchored at around 4¾ per cent over the forward estimates. This is consistent with estimates of full employment for New South Wales.
Wages growth and inflation are muted, but expected to gather momentum
Wages growth has remained modest, weighed down by several factors including national spare capacity, slow productivity growth, low inflation expectations and (until recently) a wages overhang that built up during the mining boom. These conditions, however, are receding and there are signs of emerging wage pressures, especially in the construction, health, education and related sectors. As a result, wages growth is expected to rise gradually, as the national labour market tightens, reaching 3¼ per cent by 2021-22.
Inflation is expected to rise with a tide of stronger wages and import prices, lifted by higher global inflation and a lower Australian dollar. While the risks around the inflation outlook are broadly balanced, intense retail sector competition, lower utility prices and weak conditions in the housing market could all impact the outlook.
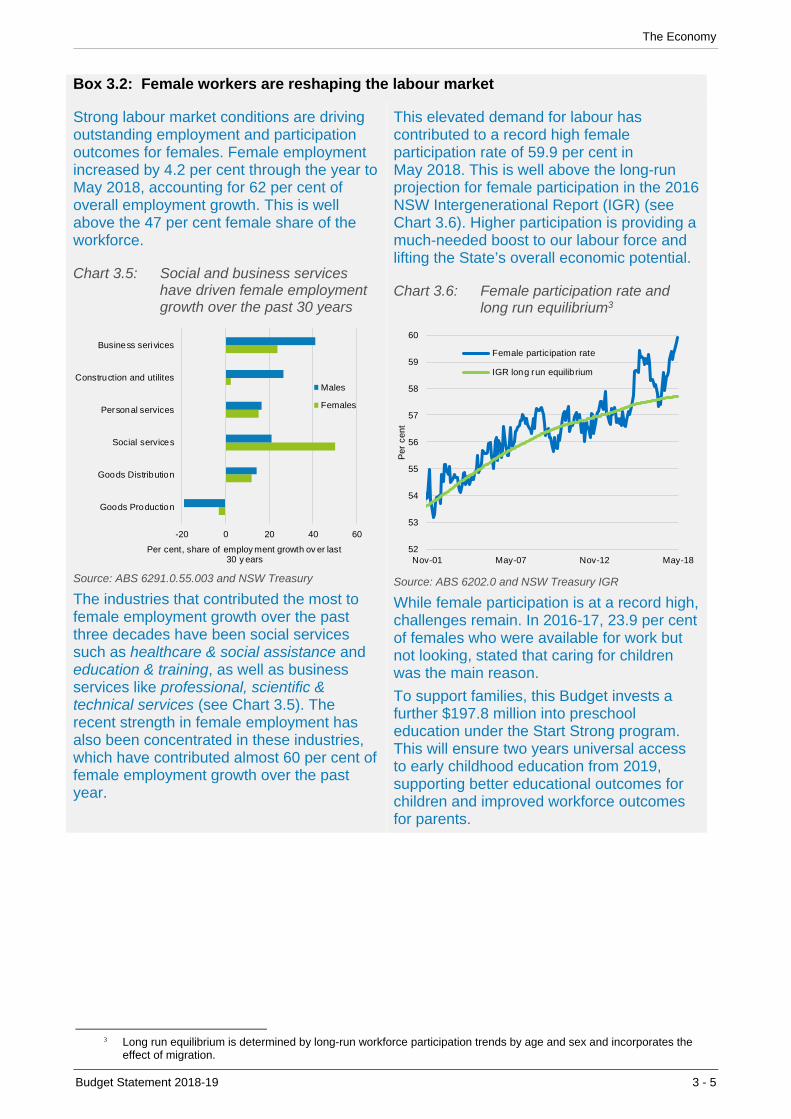
The Economy
Budget Statement 2018-19 3 - 5
Box 3.2: Female workers are reshaping the labour market
Strong labour market conditions are driving outstanding employment and participation outcomes for females. Female employment increased by 4.2 per cent through the year to May 2018, accounting for 62 per cent of overall employment growth. This is well above the 47 per cent female share of the workforce.
Chart 3.5: Social and business services have driven female employment growth over the past 30 years
-20 0 20 40 60
Goods Production
Goods Distribution
Social services
Personal services
Construction and utilites
Business serivices
Per cent, share of employ ment growth ov er last 30 y ears
Males
Females
Source: ABS 6291.0.55.003 and NSW Treasury
The industries that contributed the most to female employment growth over the past three decades have been social services such as healthcare & social assistance and education & training, as well as business services like professional, scientific & technical services (see Chart 3.5). The recent strength in female employment has also been concentrated in these industries, which have contributed almost 60 per cent of female employment growth over the past year.
This elevated demand for labour has contributed to a record high female participation rate of 59.9 per cent in May 2018. This is well above the long-run projection for female participation in the 2016 NSW Intergenerational Report (IGR) (see Chart 3.6). Higher participation is providing a much-needed boost to our labour force and lifting the State’s overall economic potential.
Chart 3.6: Female participation rate and long run equilibrium3
52
53
54
55
56
57
58
59
60
Nov-01 May-07 Nov-12 May-18
Per
cen
t
Female participation rate
IGR long run equilib rium
Source: ABS 6202.0 and NSW Treasury IGR
While female participation is at a record high, challenges remain. In 2016-17, 23.9 per cent of females who were available for work but not looking, stated that caring for children was the main reason.
To support families, this Budget invests a further $197.8 million into preschool education under the Start Strong program. This will ensure two years universal access to early childhood education from 2019, supporting better educational outcomes for children and improved workforce outcomes for parents.
3 Long run equilibrium is determined by long-run workforce participation trends by age and sex and incorporates the
effect of migration.

The Economy
3 - 6 Budget Statement 2018-19
3.2 Supportive conditions for exports and business investment
Export-oriented firms are experiencing a fortuitous blend of economic conditions. Economic growth across the rest of Australia and the global economy has lifted, supporting demand for interstate and international exports. This improvement is helping to drive stronger business investment.
National and global demand is taking off
At the national level, the mining investment downturn is approaching completion. Growth across the rest of Australia is expected to lift above trend as the non-mining sector gathers steam, supported by strong population growth and favourable business conditions. Meanwhile, the global economy is steadily improving, having taken nearly a decade to recover from the Global Financial Crisis. The International Monetary Fund expects above-trend global economic growth of 3.9 per cent in both 2018 and 2019. Moreover, moderating terms of trade and increasing global interest rates are likely to see the Australian dollar ease, providing support to trade-exposed businesses.
Chart 3.7: Large service based industries have seen strong overseas export growth(a)
Coal, $16b
Education, $11.3b
Tourism, $7.3bAdv anced manuf acturing,
$6.9b
Food & liv e animals, $6.6b
Metals and ores, $6.5b
Prof essional & technical business
serv ices, $6.2b
Financial serv ices, $3.3b
Transport, $2.7b0
5
10
15
20
25
0 2 4 6 8 10 12 14 16 18 20
Sh
are
of
tota
l ex
port
s, p
er c
ent
Av erage Annual Growth 2014-2017, per cent
Bubble size represents nominal v alue of exports in 2017 in billionsThe exports categories charted represent 80 per cent of all exports
Source: ABS 5368.0.55.003/004, ABS.Stat Beta and NSW Treasury
(a) NSW nominal goods and services exports in 2017
As the economies of New South Wales’ trading partners evolve, the composition of exports is expected to change. For instance, China is pursuing plans to transition to a lower, more sustainable growth model where demand is less reliant on investment and exports and tilted more towards household consumption. This rebalancing presents a significant opportunity for New South Wales’ largely services-driven economy, particularly for the education and tourism sectors. It is also likely to support advanced manufacturing, such as medical and pharmaceutical products, as well as agricultural exports (see Chart 3.7). New South Wales has the largest advanced manufacturing industry in Australia, with exports having grown by an impressive 11.8 per cent, on average, over the three years to 2017.
Over the longer-term, a burgeoning global middle-class—expected to reach over 5 billion in 2030, up from 3.2 billion in 2016—will bring a host of new market opportunities.4 The vast majority of this new middle class will be in Asia and New South Wales is well positioned to meet their needs, as they exercise their new found purchasing power.
4 The Unprecedented Expansion of the Global Middle Class, Working Paper 100 (2017), Brookings Institution
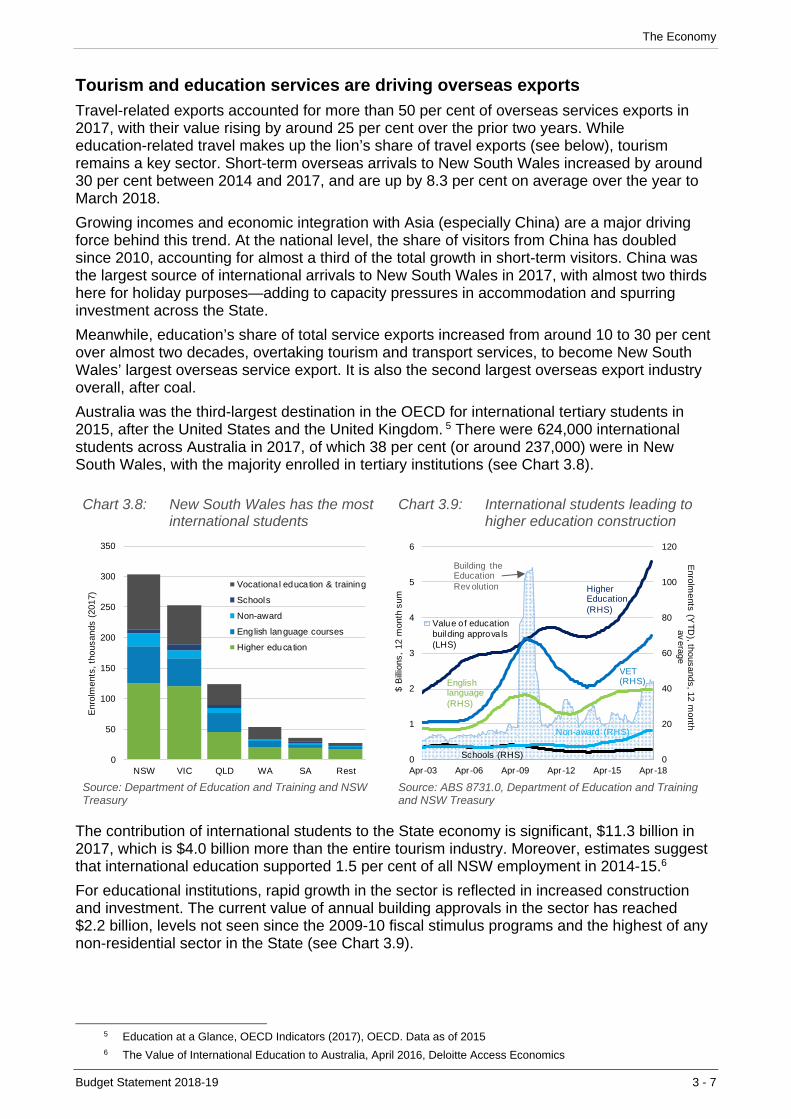
The Economy
Budget Statement 2018-19 3 - 7
Tourism and education services are driving overseas exports
Travel-related exports accounted for more than 50 per cent of overseas services exports in 2017, with their value rising by around 25 per cent over the prior two years. While education-related travel makes up the lion’s share of travel exports (see below), tourism remains a key sector. Short-term overseas arrivals to New South Wales increased by around 30 per cent between 2014 and 2017, and are up by 8.3 per cent on average over the year to March 2018.
Growing incomes and economic integration with Asia (especially China) are a major driving force behind this trend. At the national level, the share of visitors from China has doubled since 2010, accounting for almost a third of the total growth in short-term visitors. China was the largest source of international arrivals to New South Wales in 2017, with almost two thirds here for holiday purposes—adding to capacity pressures in accommodation and spurring investment across the State.
Meanwhile, education’s share of total service exports increased from around 10 to 30 per cent over almost two decades, overtaking tourism and transport services, to become New South Wales’ largest overseas service export. It is also the second largest overseas export industry overall, after coal.
Australia was the third-largest destination in the OECD for international tertiary students in 2015, after the United States and the United Kingdom. 5 There were 624,000 international students across Australia in 2017, of which 38 per cent (or around 237,000) were in New South Wales, with the majority enrolled in tertiary institutions (see Chart 3.8).
Chart 3.8: New South Wales has the most international students
0
50
100
150
200
250
300
350
NSW VIC QLD WA SA Rest
Enr
olm
ents
, tho
usan
ds (
2017
)
Vocational education & training
Schools
Non-award
English language courses
Higher education
Source: Department of Education and Training and NSW Treasury
Chart 3.9: International students leading to higher education construction
0
20
40
60
80
100
120
0
1
2
3
4
5
6
Apr-03 Apr-06 Apr-09 Apr-12 Apr-15 Apr-18
Enro
lmen
ts (YTD
), thousand
s, 12 m
onth
ave
rage
$ B
illio
ns,
12
mon
th s
um
Value of educationbuilding approvals(LHS)
Higher Education(RHS)
VET (RHS)English
language (RHS)
Non-award (RHS)
Schools (RHS)
Building the Education Rev olution
Source: ABS 8731.0, Department of Education and Training and NSW Treasury
The contribution of international students to the State economy is significant, $11.3 billion in 2017, which is $4.0 billion more than the entire tourism industry. Moreover, estimates suggest that international education supported 1.5 per cent of all NSW employment in 2014-15.6
For educational institutions, rapid growth in the sector is reflected in increased construction and investment. The current value of annual building approvals in the sector has reached $2.2 billion, levels not seen since the 2009-10 fiscal stimulus programs and the highest of any non-residential sector in the State (see Chart 3.9).
5 Education at a Glance, OECD Indicators (2017), OECD. Data as of 2015 6 The Value of International Education to Australia, April 2016, Deloitte Access Economics

The Economy
3 - 8 Budget Statement 2018-19
Box 3.3: Business investment is set to make a larger contribution to growth
Business investment is a key economic driver, not only for the activity it generates directly, but also because it increases our capital stock. More capital means greater labour productivity, lifting wages, incomes and long-term economic growth.
Chart 3.10: Capacity pressures encouraging new investment
78
79
80
81
82
83
84
85
-30
-20
-10
0
10
20
30
40
Mar-06 Mar-09 Mar-12 Mar-15 Mar-18
Per centIn
dex
Capex intention - 2 quarters adv ance (LHS)
Capacity utilisation (RHS)
Business conditions index (LHS)
Source: NAB Economics and NSW Treasury
Following an extended period of private underinvestment, business are responding to supportive conditions and elevated capacity utilisation (see Chart 3.10). This is becoming evident in construction, where non-residential building approvals indicate a rebound in activity across several sectors—especially education, offices and warehouses.
NSW public engineering work yet to be done has reached $10.5 billion, almost half of the national pipeline of public engineering projects. This is spurring private investment as, in 2017, nearly 70 per cent of public sector engineering work was done by the private sector.
Encouragingly, New South Wales is leading the way in business research and development (R&D) and innovation, accounting for a rising share of national business R&D expenditure in recent years (near 40 per cent in 2015-16, from around 30 per cent in 2007-08). There has been a focus in key sectors such as finance and information technology, where New South Wales makes up more than 50 per cent of national business R&D spending.
3.3 Population growth is driving demand
Population growth in New South Wales has been strong over the past decade, averaging 1.4 per cent, well above the 1.1 per cent average since the early 1970s (see Chart 3.11). Population growth is forecast to remain around ½ a percentage point above the long-term average over the next two years. This strong growth will see the population of New South Wales reach 8 million people over the next 12 months.
Chart 3.11: NSW population growth since Federation
0
1
2
3
4
5
1900 1910 1920 1930 1940 1950 1960 1970 1980 1990 2000 2010
Per
cen
t c
hang
e, t
hrou
gh t
he y
ear
World War One (WW1)
World War Two (WW2)
Series break(a)
Post WW2 'Baby Boomers'
Great Depression
Av erage since 1971 = 1.1
1916: -0.4%
Source: ABS 3101.0, 3105.0.65.001 and NSW Treasury (a) Switch from ‘actual location’ to ‘usual residence’ concept
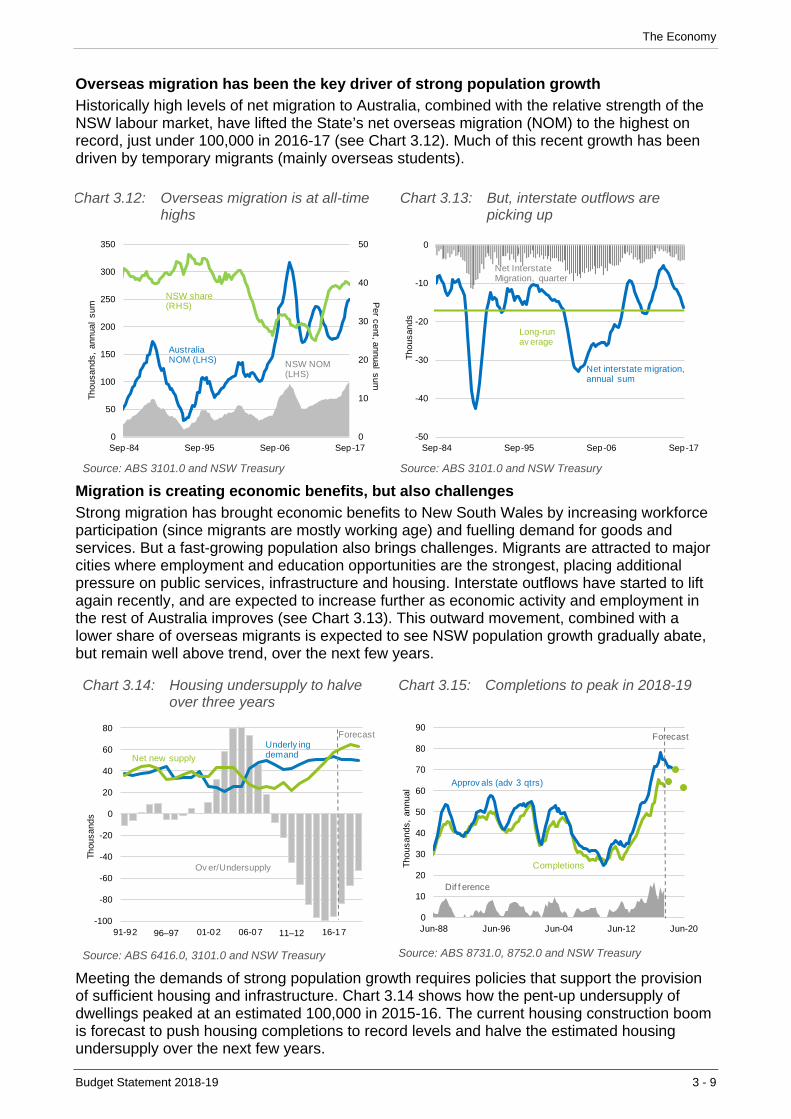
The Economy
Budget Statement 2018-19 3 - 9
Overseas migration has been the key driver of strong population growth
Historically high levels of net migration to Australia, combined with the relative strength of the NSW labour market, have lifted the State’s net overseas migration (NOM) to the highest on record, just under 100,000 in 2016-17 (see Chart 3.12). Much of this recent growth has been driven by temporary migrants (mainly overseas students).
Chart 3.12: Overseas migration is at all-time highs
0
10
20
30
40
50
0
50
100
150
200
250
300
350
Sep-84 Sep-95 Sep-06 Sep-17
Per ce
nt, ann
ual su
m
Thou
sand
s, a
nnua
l su
m
Australia NOM (LHS)
NSW share (RHS)
NSW NOM (LHS)
Source: ABS 3101.0 and NSW Treasury
Chart 3.13: But, interstate outflows are picking up
-50
-40
-30
-20
-10
0
Sep-84 Sep-95 Sep-06 Sep-17
Tho
usan
ds
Net interstate migration, annual sum
Net Interstate Migration, quarter
Long-run av erage
Source: ABS 3101.0 and NSW Treasury
Migration is creating economic benefits, but also challenges
Strong migration has brought economic benefits to New South Wales by increasing workforce participation (since migrants are mostly working age) and fuelling demand for goods and services. But a fast-growing population also brings challenges. Migrants are attracted to major cities where employment and education opportunities are the strongest, placing additional pressure on public services, infrastructure and housing. Interstate outflows have started to lift again recently, and are expected to increase further as economic activity and employment in the rest of Australia improves (see Chart 3.13). This outward movement, combined with a lower share of overseas migrants is expected to see NSW population growth gradually abate, but remain well above trend, over the next few years.
Chart 3.14: Housing undersupply to halve over three years
Source: ABS 6416.0, 3101.0 and NSW Treasury
Chart 3.15: Completions to peak in 2018-19
0
10
20
30
40
50
60
70
80
90
Jun-88 Jun-96 Jun-04 Jun-12 Jun-20
Thousands,
annual
Approv als (adv 3 qtrs)
Completions
Dif f erence
Forecast
Source: ABS 8731.0, 8752.0 and NSW Treasury
Meeting the demands of strong population growth requires policies that support the provision of sufficient housing and infrastructure. Chart 3.14 shows how the pent-up undersupply of dwellings peaked at an estimated 100,000 in 2015-16. The current housing construction boom is forecast to push housing completions to record levels and halve the estimated housing undersupply over the next few years.
-100
-80
-60
-40
-20
0
20
40
60
80
91-92 96–97 01-02 06-07 11–12 16-17
Thou
sand
s
Net new supply
Underly ingdemand
Ov er/Undersupply
Forecast

The Economy
3 - 10 Budget Statement 2018-19
Dwelling completions are expected to peak in 2018-19 (see Chart 3.15). Nonetheless, the pipeline of residential projects is at a record high. Combined with building approvals holding up better than expected, this points to an elongated, but gradually declining profile for dwelling construction over the next two years.
3.4 Consumption boosted by employment, will rely more on wages
Household consumption growth has been solid over the past year, rising by 2.9 per cent, underpinned by outstanding employment growth. These outcomes suggest a more resilient consumer in 2017-18 than was expected given the headwinds from an easing housing market and modest wages growth.
With conditions in the housing market continuing to soften, wealth effects are expected to drag on consumption, particularly over the next year, as households become less willing to further reduce their savings rates. Consumption growth is therefore forecast to be more in line with income growth over the next two years (see Chart 3.16).
Housing market conditions softening
The loss of momentum in the housing market is expected to see house prices remain soft over the next two years, weighed down by tightening credit conditions and a smaller undersupply.
Regulatory changes targeting investors are impacting conditions in New South Wales, where investors account for a high share of housing finance (see Chart 3.17). In the meantime, strong population growth, housing undersupply and historically low interest rates will continue to lend some support.
Chart 3.16: Savings rate to stabilise
-4
-2
0
2
4
6
8
10
-4
-2
0
2
4
6
8
10
93 96 99 02 05 08 11 14 17 20
Per cent, annual av
erage
Per
cen
t cha
nge,
ann
ual
aver
age
Real Consumption (LHS)
Savings Rate (RHS)
Forecast
Source: ABS 5206.0, ABS 5220.0 and NSW Treasury
Chart 3.17: Investors driving the housing market(a)
0
10
20
30
40
50
60
70
Apr -93 Apr-98 Apr-03 Apr -08 Apr-13 Apr-18
Per
cen
t, a
nnua
l av
erag
e
Difference New South Wales
Rest of Australia
Source: ABS 5609.0 and ABS 5671.0
(a) Share of the value of housing finance commitments
A switch away from interest-only loans could see mortgage repayments rise considerably for some households as they transition to principal and interest. Mortgage buffers and low mortgage arrears, however, indicate a reasonably sound financial position for the average household. Also, the recently announced personal tax cuts by the Commonwealth Government would provide some offset, supporting household income in 2019-20.
Rising wages growth will help to underpin consumption going forward
Above-trend employment growth is leading to tighter national labour market conditions and supporting labour income growth (see Chart 3.18). Nevertheless, labour income is forecast to expand by around 4 per cent in 2017-18—well below its long-run average.
Growth in the wage price index (WPI) has been modest at 2.1 per cent over the past year, with support coming from the larger-than-usual 3.3 per cent increase in minimum and award wages in 2017-18 (see Chart 3.19).
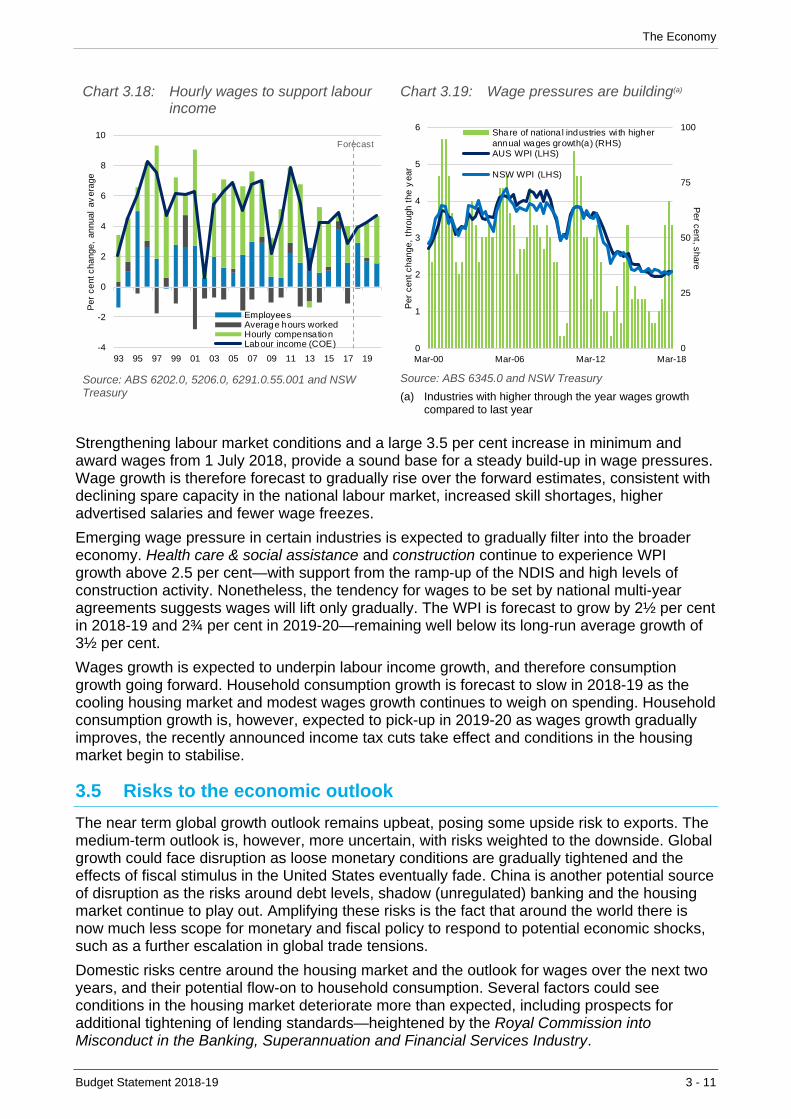
The Economy
Budget Statement 2018-19 3 - 11
Chart 3.18: Hourly wages to support labour income
-4
-2
0
2
4
6
8
10
93 95 97 99 01 03 05 07 09 11 13 15 17 19
Per
cen
t cha
nge,
ann
ual
aver
age
EmployeesAverage hours workedHourly compensationLabour income (COE)
Forecast
Source: ABS 6202.0, 5206.0, 6291.0.55.001 and NSW Treasury
Chart 3.19: Wage pressures are building(a)
0
25
50
75
100
0
1
2
3
4
5
6
Mar-00 Mar-06 Mar-12 Mar-18
Per cent, share
Per
cen
t cha
nge,
thr
ough
the
yea
r
Share of nationa l industries wi th higherannual wages growth(a) (RHS)AUS WPI (LHS)
NSW WPI (LHS)
Source: ABS 6345.0 and NSW Treasury
(a) Industries with higher through the year wages growth compared to last year
Strengthening labour market conditions and a large 3.5 per cent increase in minimum and award wages from 1 July 2018, provide a sound base for a steady build-up in wage pressures. Wage growth is therefore forecast to gradually rise over the forward estimates, consistent with declining spare capacity in the national labour market, increased skill shortages, higher advertised salaries and fewer wage freezes.
Emerging wage pressure in certain industries is expected to gradually filter into the broader economy. Health care & social assistance and construction continue to experience WPI growth above 2.5 per cent—with support from the ramp-up of the NDIS and high levels of construction activity. Nonetheless, the tendency for wages to be set by national multi-year agreements suggests wages will lift only gradually. The WPI is forecast to grow by 2½ per cent in 2018-19 and 2¾ per cent in 2019-20—remaining well below its long-run average growth of 3½ per cent.
Wages growth is expected to underpin labour income growth, and therefore consumption growth going forward. Household consumption growth is forecast to slow in 2018-19 as the cooling housing market and modest wages growth continues to weigh on spending. Household consumption growth is, however, expected to pick-up in 2019-20 as wages growth gradually improves, the recently announced income tax cuts take effect and conditions in the housing market begin to stabilise.
3.5 Risks to the economic outlook
The near term global growth outlook remains upbeat, posing some upside risk to exports. The medium-term outlook is, however, more uncertain, with risks weighted to the downside. Global growth could face disruption as loose monetary conditions are gradually tightened and the effects of fiscal stimulus in the United States eventually fade. China is another potential source of disruption as the risks around debt levels, shadow (unregulated) banking and the housing market continue to play out. Amplifying these risks is the fact that around the world there is now much less scope for monetary and fiscal policy to respond to potential economic shocks, such as a further escalation in global trade tensions.
Domestic risks centre around the housing market and the outlook for wages over the next two years, and their potential flow-on to household consumption. Several factors could see conditions in the housing market deteriorate more than expected, including prospects for additional tightening of lending standards—heightened by the Royal Commission into Misconduct in the Banking, Superannuation and Financial Services Industry.
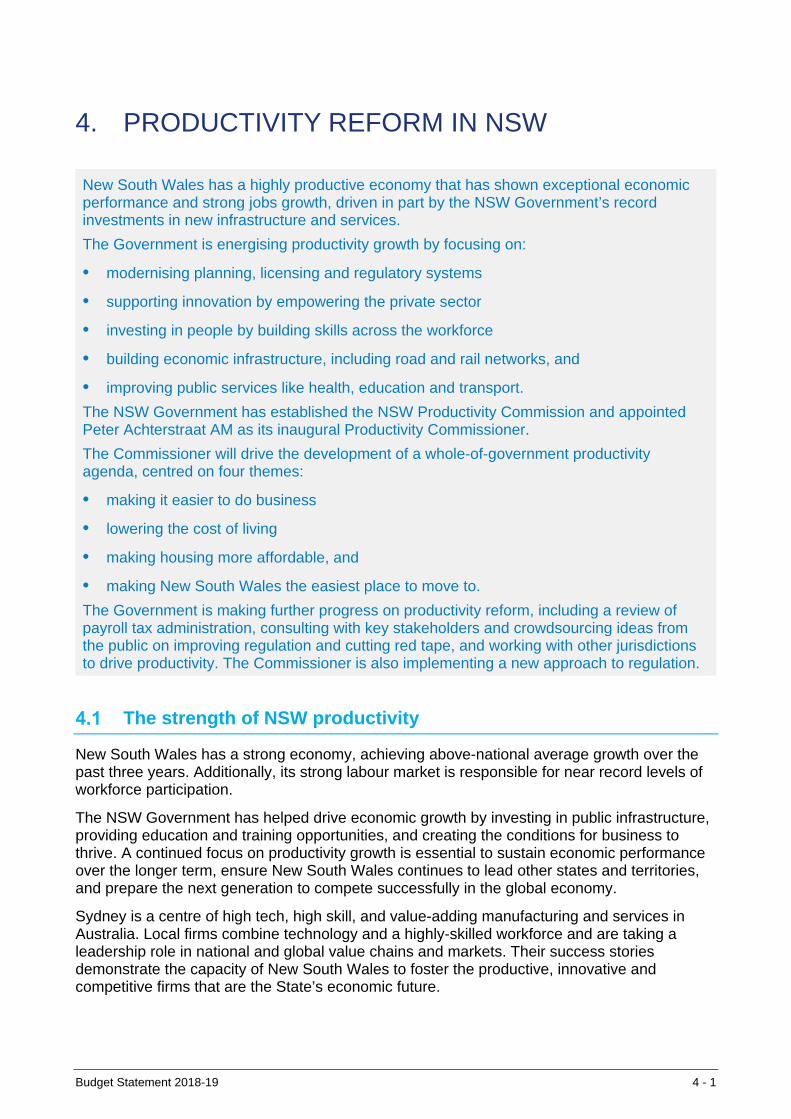
Budget Statement 2018-19 4 - 1
4. PRODUCTIVITY REFORM IN NSW
New South Wales has a highly productive economy that has shown exceptional economic performance and strong jobs growth, driven in part by the NSW Government’s record investments in new infrastructure and services.
The Government is energising productivity growth by focusing on:
• modernising planning, licensing and regulatory systems
• supporting innovation by empowering the private sector
• investing in people by building skills across the workforce
• building economic infrastructure, including road and rail networks, and
• improving public services like health, education and transport.
The NSW Government has established the NSW Productivity Commission and appointed Peter Achterstraat AM as its inaugural Productivity Commissioner.
The Commissioner will drive the development of a whole-of-government productivity agenda, centred on four themes:
• making it easier to do business
• lowering the cost of living
• making housing more affordable, and
• making New South Wales the easiest place to move to.
The Government is making further progress on productivity reform, including a review of payroll tax administration, consulting with key stakeholders and crowdsourcing ideas from the public on improving regulation and cutting red tape, and working with other jurisdictions to drive productivity. The Commissioner is also implementing a new approach to regulation.
The strength of NSW productivity
New South Wales has a strong economy, achieving above-national average growth over the past three years. Additionally, its strong labour market is responsible for near record levels of workforce participation.
The NSW Government has helped drive economic growth by investing in public infrastructure, providing education and training opportunities, and creating the conditions for business to thrive. A continued focus on productivity growth is essential to sustain economic performance over the longer term, ensure New South Wales continues to lead other states and territories, and prepare the next generation to compete successfully in the global economy.
Sydney is a centre of high tech, high skill, and value-adding manufacturing and services in Australia. Local firms combine technology and a highly-skilled workforce and are taking a leadership role in national and global value chains and markets. Their success stories demonstrate the capacity of New South Wales to foster the productive, innovative and competitive firms that are the State’s economic future.

Productivity Reform in NSW
4 - 2 Budget Statement 2018-19
The NSW economy is highly productive, delivering greater Gross State Product (GSP) per hour worked than other states, with the exception of Western Australia, where results are skewed by a large mining sector (see Chart 4.1).
Chart 4.1: NSW productivity performance relative to other states (a)
Source: ABS 5220.0, 6202.0 and NSW Treasury
(a) Size of circle reflects relative size of the state economies
While New South Wales has a high level of productivity, our long-run average productivity growth has been relatively low compared to the other states. This suggests an opportunity for New South Wales to lift its future productivity growth rate and improve living standards further.
Improving living standards through productivity
Productivity grows when businesses, workers and governments produce more with the resources at their disposal. For example, governments can help increase productivity by building transport infrastructure to help workers spend less time on the road and more time on productive activities. Businesses can increase productivity by using new technologies that help workers collaborate; whether they are sitting nearby, working at home or videoconferencing from a regional town. Increasing productivity is essential for ensuring that New South Wales remains the best place to live, work and do business.
Productivity drives jobs growth and wealth creation, and makes it possible for the Government to invest in services such as health and education, while caring for its most vulnerable citizens.
Economic growth in the long run is driven by productivity, population growth and workforce participation — the ‘three Ps’ that determine the size of the economic pie. Looking forward, participation is likely to be constrained by the effect of an ageing population. As more people retire, participation falls. The most sustainable way to improve future living standards as the population grows and ages is to raise productivity.
Chart 4.2 shows how productivity, population and participation have contributed to economic gains over recent years and how growth in per-capita income is driven by productivity growth. The terms of trade boom of the 2000s (due to higher export commodity prices) temporarily boosted purchasing power and allowed income growth to exceed productivity growth. However, the subsequent decline in the terms of trade, as commodity prices came off their peak, resulted in a noticeable slowing of real per-capita income growth in recent years, with labour productivity now the main contributor to growth. The New South Wales experience is mirrored nationally, as Australia adjusts to the end of the mining boom and looks to increase productivity growth to rates that followed the major microeconomic reforms of the 1980s and 1990s. The Productivity Commissioner has been appointed to ensure the NSW Government plays its part to further energise productivity and support continued growth in living standards.
NSW
VIC
QLD
SA
WA
TAS
0.5
1.0
1.5
2.0
2.5
3.0
70 75 80 85 90 95 100 105 110
Pe
r ce
nt,
lon
g ru
n p
rod
uct
ivity
gro
wth
$, GSP per hour worked, 2016-17
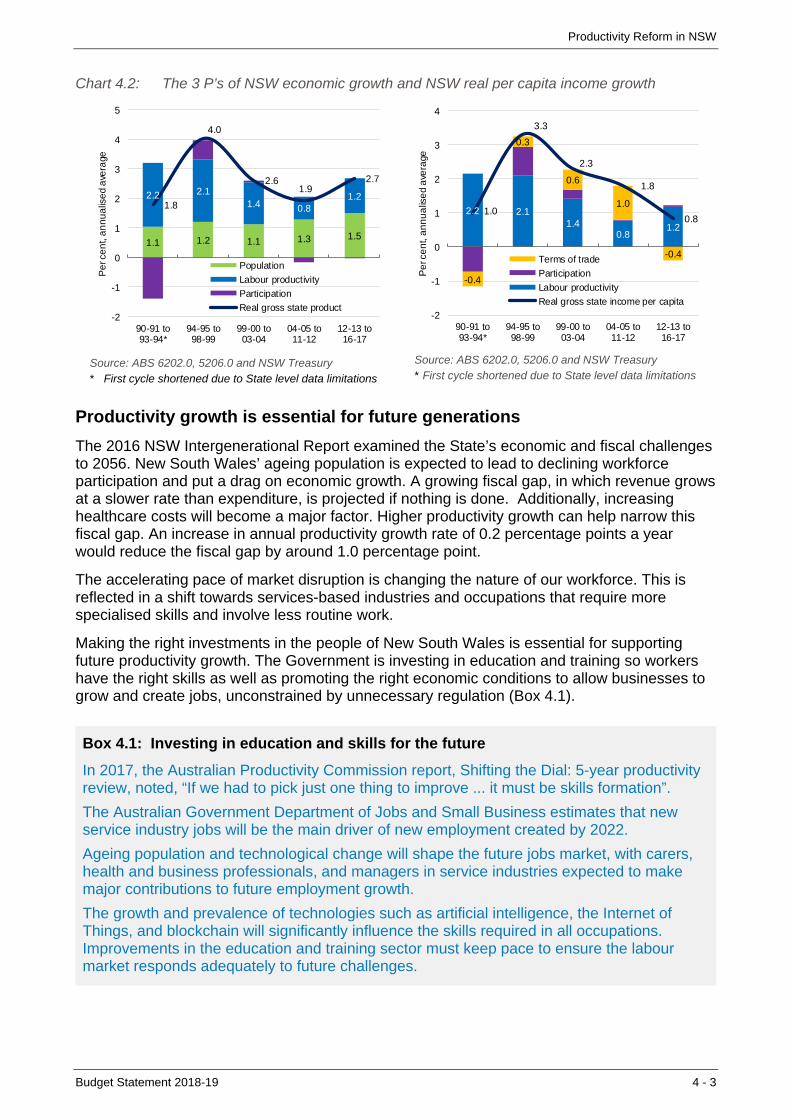
Productivity Reform in NSW
Budget Statement 2018-19 4 - 3
Chart 4.2: The 3 P’s of NSW economic growth and NSW real per capita income growth
1.1 1.2 1.1 1.3 1.5
2.2 2.11.4 0.8
1.21.8
4.0
2.61.9
2.7
-2
-1
0
1
2
3
4
5
90-91 to93-94*
94-95 to98-99
99-00 to03-04
04-05 to11-12
12-13 to16-17
Pe
r ce
nt,
an
nu
alis
ed
ave
rage
Population
Labour productivity
Participation
Real gross state product
Source: ABS 6202.0, 5206.0 and NSW Treasury * First cycle shortened due to State level data limitations
2.2 2.11.4
0.81.2
-0.4
0.3
0.6
1.0
-0.4
1.0
3.3
2.3
1.8
0.8
-2
-1
0
1
2
3
4
90-91 to93-94*
94-95 to98-99
99-00 to03-04
04-05 to11-12
12-13 to16-17
Pe
r ce
nt,
an
nu
alis
ed
ave
rage
Terms of trade
Participation
Labour productivity
Real gross state income per capita
Source: ABS 6202.0, 5206.0 and NSW Treasury * First cycle shortened due to State level data limitations
Productivity growth is essential for future generations
The 2016 NSW Intergenerational Report examined the State’s economic and fiscal challenges to 2056. New South Wales’ ageing population is expected to lead to declining workforce participation and put a drag on economic growth. A growing fiscal gap, in which revenue grows at a slower rate than expenditure, is projected if nothing is done. Additionally, increasing healthcare costs will become a major factor. Higher productivity growth can help narrow this fiscal gap. An increase in annual productivity growth rate of 0.2 percentage points a year would reduce the fiscal gap by around 1.0 percentage point.
The accelerating pace of market disruption is changing the nature of our workforce. This is reflected in a shift towards services-based industries and occupations that require more specialised skills and involve less routine work.
Making the right investments in the people of New South Wales is essential for supporting future productivity growth. The Government is investing in education and training so workers have the right skills as well as promoting the right economic conditions to allow businesses to grow and create jobs, unconstrained by unnecessary regulation (Box 4.1).
Box 4.1: Investing in education and skills for the future
In 2017, the Australian Productivity Commission report, Shifting the Dial: 5-year productivity review, noted, “If we had to pick just one thing to improve ... it must be skills formation”.
The Australian Government Department of Jobs and Small Business estimates that new service industry jobs will be the main driver of new employment created by 2022.
Ageing population and technological change will shape the future jobs market, with carers, health and business professionals, and managers in service industries expected to make major contributions to future employment growth.
The growth and prevalence of technologies such as artificial intelligence, the Internet of Things, and blockchain will significantly influence the skills required in all occupations. Improvements in the education and training sector must keep pace to ensure the labour market responds adequately to future challenges.

Productivity Reform in NSW
4 - 4 Budget Statement 2018-19
NSW Government is delivering on productivity reforms
The NSW Government is supporting productivity outcomes through investing in people; building infrastructure; creating the right regulatory environment to support innovation and competition; and reforming public services to focus on people and provide greater choice.
The Government has implemented a range of productivity reforms as outlined below.
Reforming government regulation and services
The way government regulates and operates services has a significant impact on cost of living for households. The Government has implemented a range of reforms to put downward pressure on prices. For example, reforms to the CTP Green Slip scheme illustrates outcomes that can be achieved through system-focused regulatory reform. Under the new scheme, the average price of a Green Slip has been reduced by around $124.
Reforms to the electricity network reduced average network charges for residential customers. According to the Australian Energy Regulator, a typical Essential Energy residential customer will see network charges fall by around 40 per cent in real terms between 2012-13 and 2018-19, and average residential customer network charges in 2018-19 will be lower than they were in 2009-10 (Chart 4.3). While electricity generation, and wholesale and retail price increases have contributed to overall price rises in recent years, greater electricity network efficiencies have helped moderate these price increases.
Chart 4.3: More efficient and lower cost electricity network in NSW(a)
Source: Australian Energy Regulator, NSW Treasury
(a) Estimated network component of a typical residential customer's bill over time adjusted for inflation (GST incl)
Productivity improvements have resulted in a 10 per cent decrease in real annual water bills for Sydney Water customers between 2015-16 and 2016-17 (Chart 4.4). This was the largest decrease among all major water utility groups nationally, with a typical household seeing savings of around $100 per year. In recent years, Sydney has moved from having among the highest water and wastewater bills of any major city in Australia to the lowest.
$0
$200
$400
$600
$800
$1,000
$1,200
$1,400
$1,600
2010-11 2011-12 2012-13 2013-14 2014-15 2015-16 2016-17 2017-18Rev
2018-19Est
Ne
tow
rk c
om
pon
ent (
20
18-1
9$)
Ausgrid
Endeavour
Essential
Productivity Reform in NSW
Budget Statement 2018-19 4 - 5
Chart 4.4: Efficiencies leading to lower bills for Sydney Water
$1,000
$1,050
$1,100
$1,150
$1,200
$1,250
2009–10 2010–11 2011–12 2012–13 2013–14 2014–15 2015–16 2016–17 2017-18
Real annual bill based on 200kL/a (in 2016-17 dollars)
Through social impact investing (SII) governments, non-government organisations and private investors collaborate to deliver better services for the community, particularly for challenging social issues. SII drives productivity by rewarding service providers for achieving outcomes, instead of merely delivering services. A good example of this is the Newpin program, run by UnitingCare, which helps parents build positive relationships with their children, breaking destructive cycles of abuse and neglect. Newpin’s rate of reuniting children in out-of-home care with their families is 63 per cent over the four years to 30 June 2017, compared with 19 per cent for comparable families not in the program. In this Budget, two new SII opportunities will be progressed to improve homelessness and Aboriginal employment outcomes.
The NSW Government has implemented a 25 per cent reduction to ten of the top parking fines when issued by State agencies. The Government will review all fines, excluding those that may impact road safety, as well as consider options for fixing confusing parking signs. (see Chapter 5 for more information)
Implementing the housing affordability package
Making housing more affordable is a NSW Premier’s Priority, and in June 2017 the Government announced a significant package of measures. The Government abolished stamp duty for first home buyers for properties valued up to $650,000, reduced stamp duty on homes up to $800,000, and abolished duty on lenders’ mortgage insurance. To increase housing supply, the government expanded its Planned Precincts and committed $3 billion to support infrastructure for new and growing communities, among other initiatives. In 2016-17, 63,410 homes were completed, surpassing the Premier’s annual target of 61,000 home completions.
Supporting businesses to thrive in NSW
As part of this Budget, the Government has announced that the payroll tax threshold will be increased progressively from its current level of $750,000 to $1.0 million by 2021-22. Approximately 5,000 firms that would have paid payroll tax will be exempt, avoiding both the tax itself and the associated administrative costs. Firms with a payroll greater than $1.0 million will save up to $13,625 annually from 2021-22.

Productivity Reform in NSW
4 - 6 Budget Statement 2018-19
Service NSW provides a one-stop-shop for people and businesses to make it easier to complete a wide range of personal and business transactions. Its service centres have a customer satisfaction rate of 97 per cent and average waiting time of 7 minutes. As part of the 2018-19 Budget, Service NSW has launched a cost of living service across the State – a tailored one-stop-shop aimed at reducing cost of living pressures for citizens by promoting rebates and incentives available across the NSW Government.
Small businesses have benefited from a reduction in red tape and duplication under the NSW Government’s Easy to do Business pilot program via Service NSW. The Easy to do Business program has been successfully trialled in the cafe, restaurant and small bar sector in four local government areas in New South Wales. Through the pilot, start-up times for small businesses were reduced from 18 months to just three months, and the effort to access 48 separate forms was slashed by introducing a single portal.
Building on the success of the Easy to do Business pilots and under a new Project Agreement for Small Business Regulatory Reform agreed with the Commonwealth, the NSW Government has expanded and accelerated the roll out of the program, making it available statewide for small businesses in the cafe, restaurant and small bar, and the housing construction sectors.
Easy to do Business provides a digital platform for transacting with Commonwealth, State and local government to streamline the end to end journey of starting and operating a business. The program will deliver a range of services through the Easy to do Business online portal, with all regulatory requirements accessible in one place, notification reminders pushed to businesses and personalised support from Business Concierges.
In November 2017, the NSW Parliament passed the most extensive changes to the planning framework in almost 40 years, including enhancing community participation, streamlining local development processes, and strengthening councils’ focus on strategic planning. These reforms introduced a faster and more flexible planning system. More consistent development control plans, the rollout of regional plans and the expansion of the NSW Planning Portal are some examples of productivity-enhancing changes to the planning system.
Box 4.2: Worker compensation reforms improving productivity
The latest SafeWork Australia data shows that NSW has become a safer and more productive place to work. Significant reforms made by the NSW Government since 2012 have led to a decline in the rate of injuries, particularly fatalities.
These reforms have provided greater support for seriously injured workers as well as improved services, reduced red tape, and workplace safety incentives for employers.
In the four years to 2016 (the latest data available) the rate of fatalities averaged 1.5 per 100,000 employees, whereas in the 10 years prior it averaged 2.4 – a 35 per cent reduction. The latest rate of 1.4 per 100,000 employees in 2016 is the lowest rate in New South Wales since Safe Work Australia began reporting in 2003.
The NSW Government reforms have created real incentives for businesses to encourage safe work practices. This has been coupled with reforms driving better support for returning injured workers to work. Supporting workers back into the workplace sooner has a positive effect on the individual, workplace, and wider community.
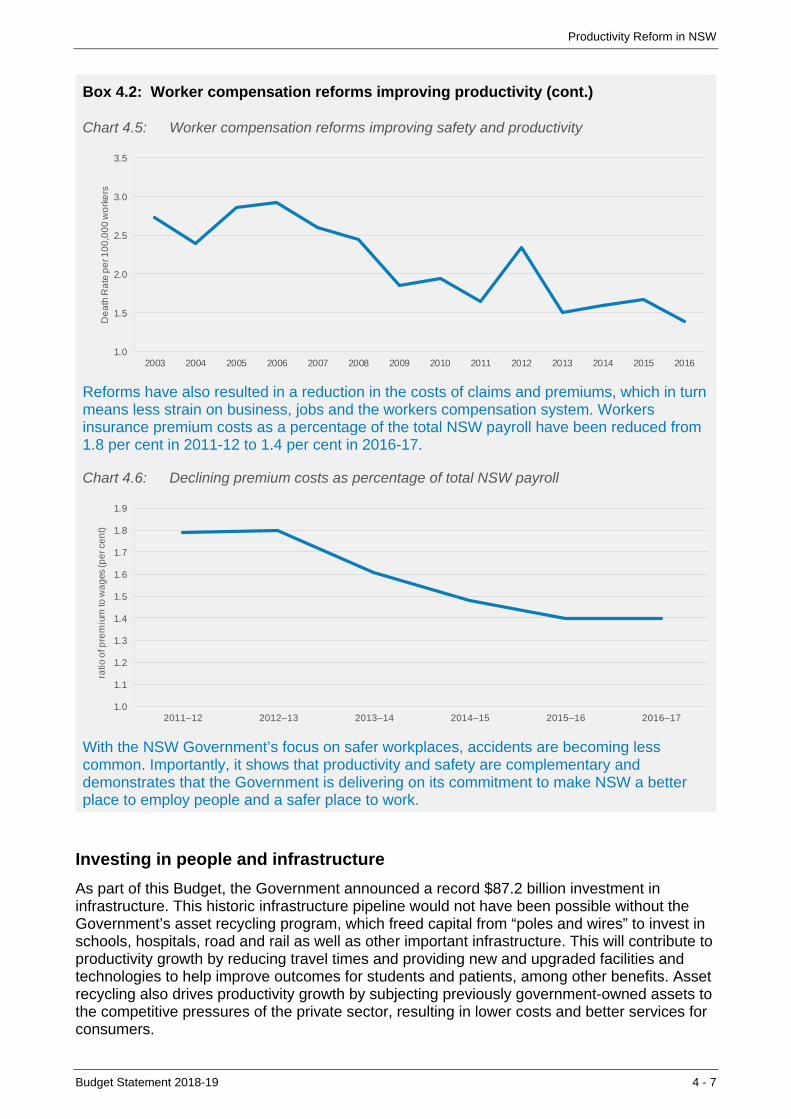
Productivity Reform in NSW
Budget Statement 2018-19 4 - 7
Box 4.2: Worker compensation reforms improving productivity (cont.)
Chart 4.5: Worker compensation reforms improving safety and productivity
1.0
1.5
2.0
2.5
3.0
3.5
2003 2004 2005 2006 2007 2008 2009 2010 2011 2012 2013 2014 2015 2016
De
ath
Ra
te p
er 1
00
,00
0 w
ork
ers
Reforms have also resulted in a reduction in the costs of claims and premiums, which in turn means less strain on business, jobs and the workers compensation system. Workers insurance premium costs as a percentage of the total NSW payroll have been reduced from 1.8 per cent in 2011-12 to 1.4 per cent in 2016-17.
Chart 4.6: Declining premium costs as percentage of total NSW payroll
1.0
1.1
1.2
1.3
1.4
1.5
1.6
1.7
1.8
1.9
2011–12 2012–13 2013–14 2014–15 2015–16 2016–17
ratio
of p
rem
ium
to w
ag
es (p
er c
en
t)
With the NSW Government’s focus on safer workplaces, accidents are becoming less common. Importantly, it shows that productivity and safety are complementary and demonstrates that the Government is delivering on its commitment to make NSW a better place to employ people and a safer place to work.
Investing in people and infrastructure
As part of this Budget, the Government announced a record $87.2 billion investment in infrastructure. This historic infrastructure pipeline would not have been possible without the Government’s asset recycling program, which freed capital from “poles and wires” to invest in schools, hospitals, road and rail as well as other important infrastructure. This will contribute to productivity growth by reducing travel times and providing new and upgraded facilities and technologies to help improve outcomes for students and patients, among other benefits. Asset recycling also drives productivity growth by subjecting previously government-owned assets to the competitive pressures of the private sector, resulting in lower costs and better services for consumers.

Productivity Reform in NSW
4 - 8 Budget Statement 2018-19
Transport infrastructure investments in Sydney, including WestConnex, NorthConnex and the Sydney Metro will support productivity growth by providing better connections for commuters, reducing the cost of congestion, and supporting the development of new communities and town centres.
Record education expenditure along with a package of 100,000 fee-free apprenticeships and TAFE Connected Learning Centres and mobile training units will greatly improve educational outcomes, equipping students and workers for future job opportunities.
Strengthening the productivity and regulatory reform agenda
The NSW Government has appointed Peter Achterstraat AM as Productivity Commissioner to drive microeconomic reform and improve the quality of regulation.
The Commissioner is helping to shape the Government’s productivity agenda, and bringing a fresh approach to regulation as endorsed in the NSW Government’s response to the Independent Review of the NSW Regulatory Policy Framework led by the Hon Nick Greiner AC (the Greiner Review). The Government acknowledges the importance of regulatory reform to productivity growth by assigning responsibility for both to the Treasury portfolio.
Progress on productivity reform cannot be driven by government alone. Identifying and implementing reforms that work requires engaging with business and the community. The Commissioner will consult with stakeholders to identify opportunities for reform.
Box 4.3: New steps in productivity and regulatory reforms
The NSW Productivity Commissioner and NSW Treasury, in partnership with agencies, are leading a range of reforms to improve regulation and productivity.
• Review of payroll tax administration: This review aims to identify opportunities to reduce the cost and burden of compliance. Payroll tax administration can be complex, especially for businesses operating in more than one jurisdiction. The NSW Business Chamber estimated that businesses in New South Wales typically incur an average $10,700 in administrative costs over and above their payroll tax liability. The initial areas of opportunities identified in the review relate to education and guidance for taxpayers, payment processes, transparency on audits and payment plans for outstanding liabilities. The Review is expected to be finalised in the second half of 2018.
• Feedback mechanism on NSW regulations: The Commissioner has established an online portal called Your feedback: help cut red tape, where individuals and businesses can offer ideas on improving regulation and reducing red tape. The feedback will help to prioritise the Commissioner’s efforts to improve the quality of regulation and remove unnecessary costs from the system.
Implementing a new approach to regulation
Thoughtfully designed and appropriately applied regulation can promote economic growth, social welfare and environmental protection.
The NSW Government has, in its response to the Greiner Review, committed to developing a modern, best-practice approach to regulation. The Productivity Commissioner will consider the recommendations included in the Final Report of the Greiner Review and advise Government on the best way of implementing a new regulatory policy framework for New South Wales.
The Greiner Review noted New South Wales has a significant stock of regulations comprising more than 880 Acts over 26,800 pages. Red-tape reduction targets have been used to help simplify legislation and reduce the regulatory burden, but more remains to be done.

Productivity Reform in NSW
Budget Statement 2018-19 4 - 9
The Greiner Review proposes that government agencies act as stewards in managing the existing stock of regulations and improving the design of regulations to come. Under a stewardship approach, agencies monitor regulatory regimes in consultation with businesses and communities. This information is then used to prioritise reviews and propose changes.
Under a stewardship approach, agencies are more empowered to be proactive when it comes to managing their stock of regulations. A regulatory stewardship approach is also at the heart of the policy cycle, comprising service design, delivery and improvement. It requires rethinking the ‘regulation first’ approach, departing from reliance on prescriptive rules, focusing on desired outcomes and examining other options to influence behaviours.
Good regulatory stewards, as proposed by the Greiner Review, focus on their customers, which involves an ongoing conversation with those affected or protected by regulation and making adjustments in response. Regulation should be designed flexibly, informed by robust policy analysis and impact evaluation. This approach puts people at the centre of the regulatory process. It may also include evaluating data derived from testing different regulatory approaches and incrementally changing the design of regulation.
Priority areas for productivity reform
The NSW Government has identified four initial priority areas of focus for the Productivity Commissioner. These will form the basis of stakeholder consultation and collaboration and will open an informed conversation on productivity-enhancing reforms.
Lowering the cost of living
Lowering the cost of living is a priority for the NSW Government. Improving productivity through producing goods and services more efficiently, and putting downward pressure on prices though competition and choice can contribute to lowering prices.
The Commissioner will work with relevant agencies to engage with the community and business sectors to identify areas where competition can be improved, government enterprises can become more efficient, and unnecessary regulation can be removed to reduce the cost of goods and services.
Making it easier to do business
Business drives the State’s economic future and the Government’s role is to provide the best possible conditions for businesses to innovate, create jobs, and deliver goods and services as efficiently as possible. The State’s school and vocational education and training systems play a vital role in educating and training people to be job ready for businesses operating in a changing economic environment.
Unnecessary regulatory barriers, costs and complexity make it harder for businesses to operate and adapt to a modern economy characterised by market disruption and rapid change. The NSW Business Chamber has estimated that businesses spend more than $10 billion every year complying with regulations across all levels of government. The Commissioner will work with agencies across government to tackle business regulation.
Rolling out the Easy to do Business program state wide for small businesses in the cafe, restaurant and small bar, and the housing construction sectors is a tangible example of how the Government is reducing the burden of meeting regulatory requirements.
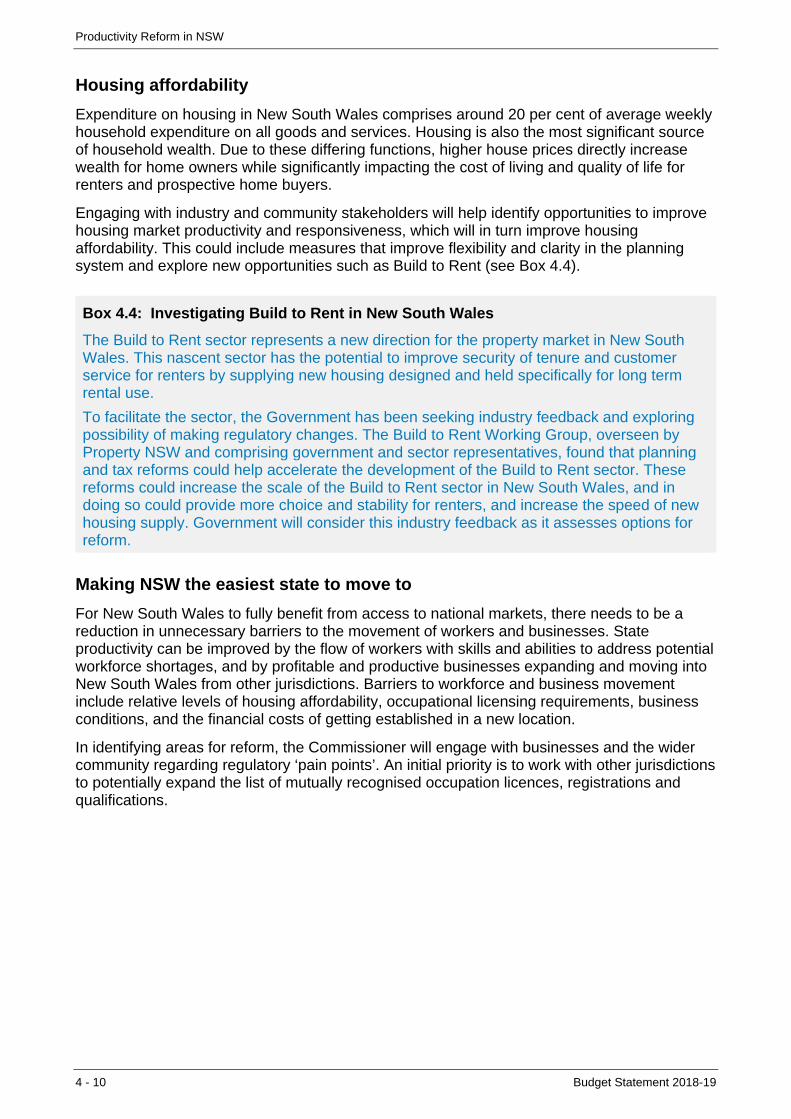
Productivity Reform in NSW
4 - 10 Budget Statement 2018-19
Housing affordability
Expenditure on housing in New South Wales comprises around 20 per cent of average weekly household expenditure on all goods and services. Housing is also the most significant source of household wealth. Due to these differing functions, higher house prices directly increase wealth for home owners while significantly impacting the cost of living and quality of life for renters and prospective home buyers.
Engaging with industry and community stakeholders will help identify opportunities to improve housing market productivity and responsiveness, which will in turn improve housing affordability. This could include measures that improve flexibility and clarity in the planning system and explore new opportunities such as Build to Rent (see Box 4.4).
Box 4.4: Investigating Build to Rent in New South Wales
The Build to Rent sector represents a new direction for the property market in New South Wales. This nascent sector has the potential to improve security of tenure and customer service for renters by supplying new housing designed and held specifically for long term rental use.
To facilitate the sector, the Government has been seeking industry feedback and exploring possibility of making regulatory changes. The Build to Rent Working Group, overseen by Property NSW and comprising government and sector representatives, found that planning and tax reforms could help accelerate the development of the Build to Rent sector. These reforms could increase the scale of the Build to Rent sector in New South Wales, and in doing so could provide more choice and stability for renters, and increase the speed of new housing supply. Government will consider this industry feedback as it assesses options for reform.
Making NSW the easiest state to move to
For New South Wales to fully benefit from access to national markets, there needs to be a reduction in unnecessary barriers to the movement of workers and businesses. State productivity can be improved by the flow of workers with skills and abilities to address potential workforce shortages, and by profitable and productive businesses expanding and moving into New South Wales from other jurisdictions. Barriers to workforce and business movement include relative levels of housing affordability, occupational licensing requirements, business conditions, and the financial costs of getting established in a new location.
In identifying areas for reform, the Commissioner will engage with businesses and the wider community regarding regulatory ‘pain points’. An initial priority is to work with other jurisdictions to potentially expand the list of mutually recognised occupation licences, registrations and qualifications.

Productivity Reform in NSW
Budget Statement 2018-19 4 - 11
Contributing to the national productivity reform agenda
In 2017, the Australian Productivity Commission released Shifting the Dial: 5-year productivity review. This report discussed the scope for reform across well-known drivers such as education, taxation, land-use planning, competition and road transport pricing. It also discussed reform to aid better health service delivery, and using data to drive consumer choice. State governments are involved in most of these reform opportunities. The Commissioner will explore opportunities to progress a broader national microeconomic reform agenda with other jurisdictions and through forums such as the Council on Federal Financial Relations and the Board of Treasurers (BOT).
The NSW Treasurer led the formation of the BOT to work on policy areas that solve common issues (see Box 5.4 in Chapter 5 of this Budget Statement). The BOT is developing a joint agenda for productivity-enhancing reforms.
Budget Statement 2018-19 5 - 1
5. REVENUE
Total revenue for New South Wales in 2018-19 is estimated at $81.1 billion. This is $326.4 million more than anticipated in the 2017-18 Half-Yearly Review (HYR), driven by stronger grant revenue and investment distributions, partially offset by lower transfer duty.
The NSW Government’s revenue in 2018-19 and over the forward estimates reflects the move to a historic low GST relativity for New South Wales and a softening in residential transfer duty.
New South Wales has embarked on a significant reform agenda, fuelled by asset recycling and public investment which has driven the State economy’s performance. The State’s falling GST share is a consequence of its economic success – this means a significant proportion of GST is being redistributed to other states.
At the same time as a historic low in the NSW GST relativity, transfer duty revenue growth is moderating. This is partly explained by the Government’s housing affordability measures, which have seen a significant increase in the number of first-home buyers, who are exempt from transfer duty.
Transfer duty is forecast to grow at an average annual rate of 1.5 per cent in the four years to 2021-22; compared to 2.8 per cent in the four years to 2020-21 forecast in the 2017-18 Budget.
Despite these revenue challenges, fiscal discipline enables this Budget to introduce further tax cuts, to ensure that New South Wales is the best place to do business. The payroll tax threshold will be increased from $750,000 to $850,000 from 1 July 2018 and then progressively increased to $1.0 million by 2021-22.
Ten of the most common level 2 parking fines issued by the NSW Government will be reduced by 25 per cent in the first step of a major overhaul. New legislation will be introduced to allow local governments and other authorities the flexibility to charge lower amounts.
5.1 2018-19 Budget revenue measures
New revenue measures announced in the 2018-19 Budget will help reduce costs for small businesses and continue the Government’s record in delivering tax cuts. There are also new measures to align taxes with other jurisdictions and improve the fairness of existing government fines and charges.
Table 5.1: Revenue measures announced in the 2018-19 Budget
2018-19 2019-20 2020-21 2021-22$m $m $m $m
A new $1 million payroll tax threshold (123) (187) (252) (319)
Weight tax concession for caravans (12) (12) (13) (13)
Reducing top ten level 2 parking fines issued by the NSW Government (2) (2) (2) (2)
Point of consumption wagering tax 40 95 100 120
Road Safety Plan 2021 40 141 115 101
Total New Measures (57) 36 (51) (113)

Revenue
5 - 2 Budget Statement 2018-19
A new $1 million payroll tax threshold
Over the next four years, the payroll tax threshold will be increased progressively from its current level of $750,000 to $1.0 million. The threshold will be $850,000 in 2018-19, $900,000 in 2019-20, $950,000 in 2020-21 and $1.0 million in 2021-22. By 2021-22, approximately 5,000 firms that would have paid payroll tax will be exempt, avoiding both the tax itself and the administrative costs of complying with the payroll tax system. Firms with payroll greater than $1.0 million will also save up to $13,625 annually from 2021-22 (see Box 5.1). This measure will reduce payroll tax revenue by $881.0 million in the four years to 2021-22.
Box 5.1: Higher payroll tax threshold to support small business
From 1 July 2018 the tax-free threshold for payroll tax will increase from $750,000 to $850,000. It will further increase by $50,000 in each subsequent year to reach $1.0 million in 2021-22. Taxable payroll includes salaries, superannuation, bonuses and fringe benefits paid to workers in New South Wales.
The increased thresholds will reduce the number of NSW small businesses subject to payroll tax by around 2,000 in 2018-19. This will grow to around 5,000 in 2021-22, of which around 1,500 are expected to be based outside of Sydney (see Chart 5.1). All industry sectors are expected to benefit from this reform, including more than 1,000 businesses in the manufacturing and construction sectors, as well as more than 800 businesses providing professional, scientific and technical services. These small businesses will be relieved of the cost pressures of payroll tax, as well as the administrative complexity of complying with payroll tax obligations.
Chart 5.1: Payroll tax paying businesses affected by threshold changes
87%
8%
4%
1%
13%
Sydney Outside Sydney Other
Businesses that will no longer paypay roll tax
Businesses that w ill pay a reduced average tax rate
By 2021-22, firms that continue to be liable for payroll tax will save up to $13,625 each year as a result of the increased threshold. These cost savings could encourage new business investment and support the employment of up to 3,500 more workers by 2021-22 (see Chart 5.2).
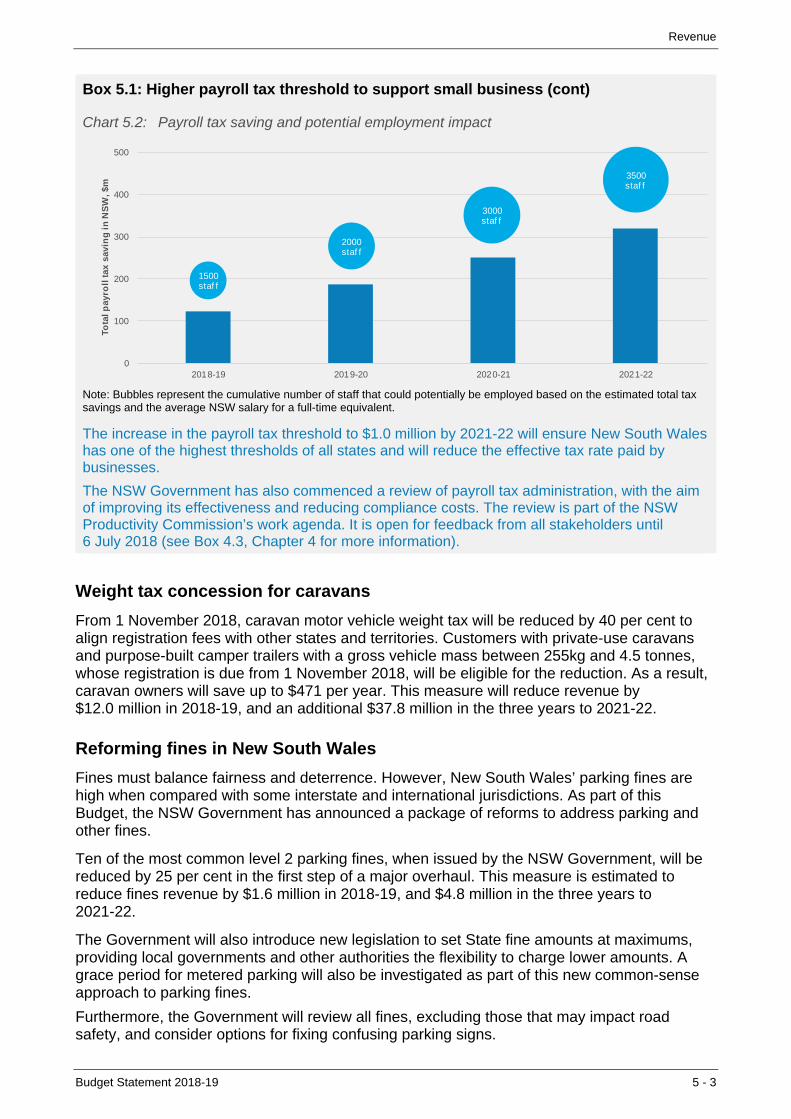
Revenue
Budget Statement 2018-19 5 - 3
Box 5.1: Higher payroll tax threshold to support small business (cont)
Chart 5.2: Payroll tax saving and potential employment impact
0
100
200
300
400
500
2018-19 2019-20 2020-21 2021-22
Tota
l p
ayro
ll ta
x s
avin
g i
n N
SW
, $m
1500 staf f
2000 staf f
3000 staf f
3500staf f
Note: Bubbles represent the cumulative number of staff that could potentially be employed based on the estimated total tax savings and the average NSW salary for a full-time equivalent.
The increase in the payroll tax threshold to $1.0 million by 2021-22 will ensure New South Wales has one of the highest thresholds of all states and will reduce the effective tax rate paid by businesses.
The NSW Government has also commenced a review of payroll tax administration, with the aim of improving its effectiveness and reducing compliance costs. The review is part of the NSW Productivity Commission’s work agenda. It is open for feedback from all stakeholders until 6 July 2018 (see Box 4.3, Chapter 4 for more information).
Weight tax concession for caravans
From 1 November 2018, caravan motor vehicle weight tax will be reduced by 40 per cent to align registration fees with other states and territories. Customers with private-use caravans and purpose-built camper trailers with a gross vehicle mass between 255kg and 4.5 tonnes, whose registration is due from 1 November 2018, will be eligible for the reduction. As a result, caravan owners will save up to $471 per year. This measure will reduce revenue by $12.0 million in 2018-19, and an additional $37.8 million in the three years to 2021-22.
Reforming fines in New South Wales
Fines must balance fairness and deterrence. However, New South Wales’ parking fines are high when compared with some interstate and international jurisdictions. As part of this Budget, the NSW Government has announced a package of reforms to address parking and other fines.
Ten of the most common level 2 parking fines, when issued by the NSW Government, will be reduced by 25 per cent in the first step of a major overhaul. This measure is estimated to reduce fines revenue by $1.6 million in 2018-19, and $4.8 million in the three years to 2021-22.
The Government will also introduce new legislation to set State fine amounts at maximums, providing local governments and other authorities the flexibility to charge lower amounts. A grace period for metered parking will also be investigated as part of this new common-sense approach to parking fines.
Furthermore, the Government will review all fines, excluding those that may impact road safety, and consider options for fixing confusing parking signs.

Revenue
5 - 4 Budget Statement 2018-19
Point of consumption wagering tax
From 1 January 2019, the NSW Government will introduce a 10 per cent point of consumption (PoC) tax on wagering. A tax-free threshold of $1.0 million per year will apply for all operators. This will be applied to all bets, including those placed online or by telephone with interstate wagering operators by New South Wales residents. Under a PoC tax, revenue is collected according to a customer’s location, as opposed to the location of the wagering operator. This measure is expected to raise $40.0 million in 2018-19 and $315.0 million in the three years to 2021-22.
There have been significant changes in the gambling market and the tax system needs to be updated to reflect and properly capture an increasingly digital environment. New South Wales will join Victoria, South Australia, Western Australia, Queensland and the Australian Capital Territory who have either introduced or committed to implementing PoC wagering taxes.
In early 2018, the Government released a discussion paper seeking stakeholders’ views on whether wagering taxes should be updated in New South Wales. A number of submissions were received and considered by the Government in designing the PoC tax.
The Government will ensure that the NSW racing industry, including thoroughbreds, harness racing and greyhounds, is not negatively affected by the PoC tax. To this end, additional funding equal to 2 per cent of all wagering operators’ taxable net wagering revenue in New South Wales will be directed to the racing industry.
Road Safety Plan 2021 (Towards Zero Program)
The Government has announced a number of measures to work towards the State Priority Target of a 30 per cent reduction in road fatalities by 2021 (compared to 2008-2010 levels). These measures include additional NSW Police Highway Patrol Officers in regional NSW and roadside alcohol breath testing, expansion of the heavy vehicle average speed camera program, as well as doubling the mobile drug testing program. Road safety initiatives are expected to generate additional revenue of up to $40.1 million in 2018-19. All of the revenue from this measure will be used for the Road Safety Plan 2021. Overall, the Government has committed $1.9 billion over 5 years to improve road infrastructure and deliver safety initiatives.
5.2 General government revenue
The revenue raised by the Government funds essential services and the construction of infrastructure across New South Wales.
General government revenue is estimated to be $80.5 billion in 2017-18, $576.1 million higher than forecast in the 2017-18 Budget and $619.0 million higher than forecast in the HYR (see Chart 5.3). The most important sources of these changed estimates since the 2017-18 Budget are a $340.7 million upward revision in GST revenue, an $886.8 million upward revision in other dividends and distributions, and a $1.0 billion downward revision in transfer duty.

Revenue
Budget Statement 2018-19 5 - 5
Chart 5.3: Changes in 2017-18 revenue – Half-Yearly Review to 2018-19 Budget
78,500
79,000
79,500
80,000
80,500
81,000
2017-18HYR totalrevenue
Policymeasures
Taxationrevenue
GST Royalties Dividends,income taxequiva lentsand otherdividends
anddistributions
Fines,regulatoryfees and
otherrevenue
Sales ofgoods andservices
Grantrevenue
(excludingGST)
Interestincome
2018-19Budget total
revenue
$ m
illi
on
s
In 2018-19, revenue is forecast to reach $81.1 billion, $620.3 million higher than revenue in 2017-18. The forecast is $857.2 million higher than forecast in the 2017-18 Budget and $326.4 million higher than at the HYR. Taxation revenue will provide 38.4 per cent of this total, while Commonwealth grants, including GST, will provide 39.1 per cent (see Chart 5.4).
Chart 5.4: Composition of total revenue, 2018-19
Taxation38%
Commonwealth - General purpose
23%
Commonwealth - National Agreements
12%
Commonwealth - National Partnerships
4%
Other Commonwealth payments
0%
Other grants 0%
Sale of Goods and Services
12%
Dividend, income taxequivalents & other
distributions 4%
Royalties 2%
Fines, fees, interest and other revenues
4%
Over the four years to 2021-22, general government revenue is expected to grow at an average annual rate of 2.5 per cent (Table 5.2). Excluding National Partnerships, some of which are expiring over the forecast period, the four-year growth rate is 2.9 per cent. Taxation revenue is forecast to grow at an average annual rate of 3.6 per cent over the four years to 2021-22, despite the influence of a slowing property market on transfer duty revenue in the near term. GST revenue is expected to grow at an average annual rate of 3.4 per cent over the four years to 2021-22.
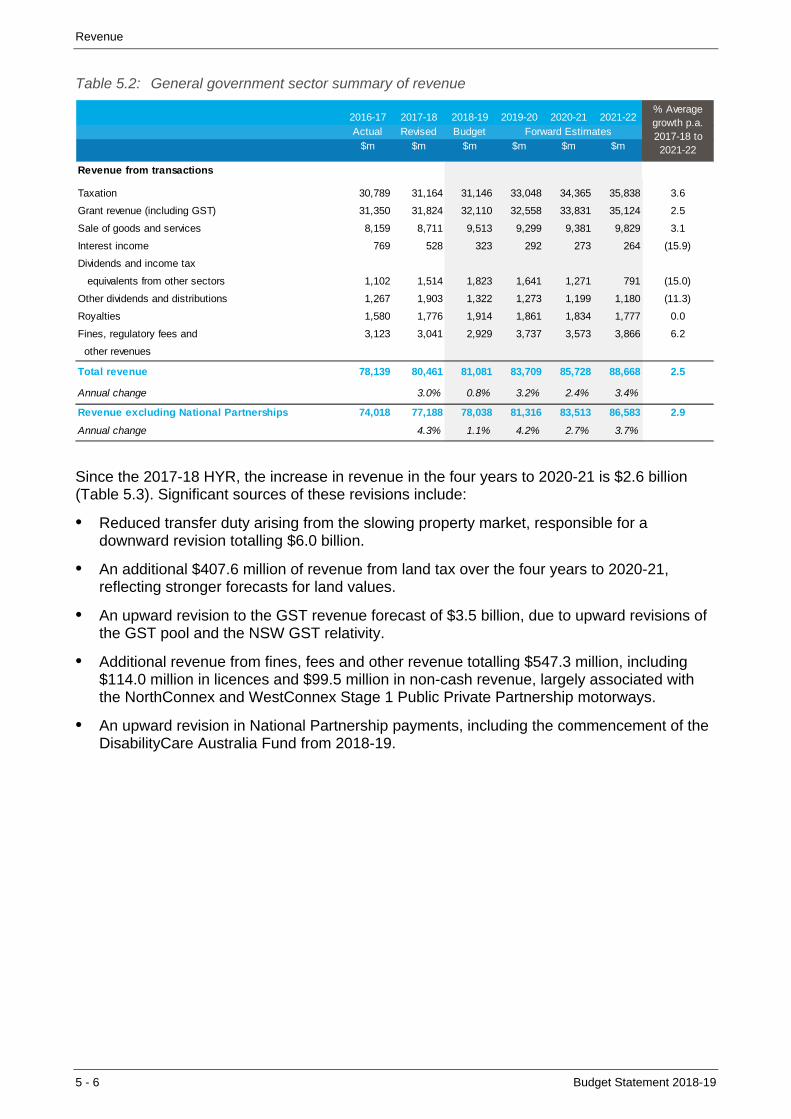
Revenue
5 - 6 Budget Statement 2018-19
Table 5.2: General government sector summary of revenue
2016-17 2017-18 2018-19 2019-20 2020-21 2021-22Actual Revised Budget
$m $m $m $m $m $m
Revenue from transactions
Taxation 30,789 31,164 31,146 33,048 34,365 35,838 3.6
Grant revenue (including GST) 31,350 31,824 32,110 32,558 33,831 35,124 2.5
Sale of goods and services 8,159 8,711 9,513 9,299 9,381 9,829 3.1
Interest income 769 528 323 292 273 264 (15.9)
Dividends and income tax
equivalents from other sectors 1,102 1,514 1,823 1,641 1,271 791 (15.0)
Other dividends and distributions 1,267 1,903 1,322 1,273 1,199 1,180 (11.3)
Royalties 1,580 1,776 1,914 1,861 1,834 1,777 0.0
Fines, regulatory fees and 3,123 3,041 2,929 3,737 3,573 3,866 6.2
other revenues
Total revenue 78,139 80,461 81,081 83,709 85,728 88,668 2.5
Annual change 3.0% 0.8% 3.2% 2.4% 3.4%
Revenue excluding National Partnerships 74,018 77,188 78,038 81,316 83,513 86,583 2.9
Annual change 4.3% 1.1% 4.2% 2.7% 3.7%
% Average growth p.a. 2017-18 to 2021-22
Forward Estimates
Since the 2017-18 HYR, the increase in revenue in the four years to 2020-21 is $2.6 billion (Table 5.3). Significant sources of these revisions include:
• Reduced transfer duty arising from the slowing property market, responsible for a downward revision totalling $6.0 billion.
• An additional $407.6 million of revenue from land tax over the four years to 2020-21, reflecting stronger forecasts for land values.
• An upward revision to the GST revenue forecast of $3.5 billion, due to upward revisions of the GST pool and the NSW GST relativity.
• Additional revenue from fines, fees and other revenue totalling $547.3 million, including $114.0 million in licences and $99.5 million in non-cash revenue, largely associated with the NorthConnex and WestConnex Stage 1 Public Private Partnership motorways.
• An upward revision in National Partnership payments, including the commencement of the DisabilityCare Australia Fund from 2018-19.

Revenue
Budget Statement 2018-19 5 - 7
Table 5.3: Revenue reconciliation
2017-18 2018-19 2019-20 2020-21
Revised Budget
$m $m $m $m
Revenues - 2017-18 Budget 79,885 80,224 82,471 83,770
Policy Measures 41 (63) (55) (56)
Parameter and other budget variations (84) 593 726 880
Total movement from 2017-18 Budget to 2017-18 HYR (43) 531 671 824
Revenues - 2017-18 Half - Yearly Review 79,842 80,755 83,142 84,594
Policy measures
Revenue measures announced in the 2018-19 Budget ... (57) 36 (51)
Other revenue measures 4 200 410 428
Total policy measures since 2017-18 HYR 4 144 446 377
Parameter and other budget variations
Transfer duty (565) (1,936) (1,789) (1,769)
Payroll tax (39) (5) 1 2
Land tax 42 117 138 110
Other taxes 315 125 122 97
Royalties 46 189 219 218
GST 221 737 1,199 1,318
National Partnerships payments (308) 441 533 940
National Agreement payments 28 138 220 329
Other Commonwealth payments and other grants 293 139 (67) (80)
Interest income 162 31 8 4
Sales of goods and services (304) (196) (451) 79
Dividends and income tax equivalents from other sectors (189) 445 46 (197)
Other dividends and distributions 761 (11) (91) (279)
Fines, regulatory fees and other revenues 151 (4) 239 167
Other (0) (27) (207) (183)
Total parameter and other budget variations 615 182 121 757
Total movement from 2017-18 HYR to 2018-19 Budget 619 326 567 1,134
Revenues - 2018-19 Budget 80,461 81,081 83,709 85,728
Forward Estimates
5.3 Taxation revenue
State taxation revenue is forecast to be $31.1 billion in 2018-19 (see Table 5.4). Payroll tax is the largest single source of taxation revenue, providing 29.4 per cent of the total in 2018-19 (see Chart 5.5), overtaking transfer duty, which is forecast to provide 24.7 per cent. The pace of growth is expected to slow to 3.6 per cent over the next four years, compared with 6.4 per cent over the four years to 2017-18. This largely reflects a slow-down in the property market, partially offset by more robust land tax and other taxes.

Revenue
5 - 8 Budget Statement 2018-19
Table 5.4: General government sector – summary of taxation revenue
2016-17 2017-18 2018-19 2019-20 2020-21 2021-22
Actual Revised Budget
$m $m $m $m $m $m
Stamp duties Transfer duty 9,677 8,673 7,693 8,333 8,765 9,220 1.5 Insurance 954 989 980 1,026 1,075 1,133 3.5 Mortgages 15 ... ... ... ... ... -Marketable securities 13 ... ... ... ... ... -Motor vehicles 823 837 850 884 917 952 3.3 Other 0 0 0 0 0 0 ...
11,482 10,499 9,523 10,243 10,757 11,305 1.9
Payroll tax 8,168 8,786 9,150 9,593 10,050 10,496 4.5
Land tax 3,171 3,833 4,293 4,612 4,775 4,858 6.1
Taxes on motor vehicleownership and operation
Weight tax 2,079 2,181 2,264 2,385 2,520 2,669 5.2
Vehicle registration and 422 435 445 463 488 514 4.3 transfer feesOther motor vehicle taxes 40 41 44 46 48 50 5.1
2,541 2,657 2,753 2,894 3,056 3,233 5.0
Gambling and betting taxesRacing 111 113 141 184 166 187 13.3 Club gaming devices 772 781 803 827 854 881 3.1 Hotel gaming devices 730 793 833 874 919 966 5.0 Lotteries and lotto 346 351 359 362 373 379 1.9 Casino 294 289 296 394 305 314 2.2 Other gambling & betting 17 15 16 16 17 17 3.3
2,271 2,342 2,447 2,658 2,634 2,744 4.0
Other taxes and levies
Health insurance levy 199 205 212 220 230 241 4.1
Parking space levy 105 108 110 113 116 119 2.5 Emergency services levy contributions 785 794 780 824 788 852 1.8
Emergency services council contributions 127 124 131 125 135 142 3.5
Waste and environment levy 726 727 568 539 545 532 (7.5)
Government guarantee fee 397 288 313 344 386 419 9.8 Private transport operators levy 13 24 77 77 77 31 6.8 Pollution control licences 25 27 28 29 29 30 2.5 Other taxes 781 750 761 776 786 836 2.8
3,156 3,047 2,979 3,047 3,093 3,202 1.2
Total taxation revenue 30,789 31,164 31,146 33,048 34,365 35,838 3.6
Annual change 1.2% -0.1% 6.1% 4.0% 4.3%
% Average growth p.a. 2017-18 to 2021-22
Forward Estimates

Revenue
Budget Statement 2018-19 5 - 9
Chart 5.5: Composition of taxation revenue, 2018-19
Payroll tax29%
Land tax14%
Taxes on motor vehicle ownership and operation
9%
Gambling and betting taxes8%
Other tax revenue10%
Transfer duty25%
Other stamp duties 6%
Transfer duty
Transfer duty revenue is expected to be $8.7 billion in 2017-18, a downward revision of $565.0 million since the 2017-18 HYR and $1.0 billion since the 2017-18 Budget. These revisions reflect declining property market transaction volumes and prices, a significant shift in the composition of transactions away from investors and toward first-home buyers (Box 5.2), as well as the success of measures to introduce more housing supply.
Transfer duty revenue over the three years to 2020-21 has been revised down by $5.5 billion since the 2017-18 HYR, reflecting lower revenue in 2017-18 and lower forecasts for the growth of property market transactions and prices. While this revision is significant in dollar terms, revenue growth has been strong for an extended period, and the downturn is moderate compared with historic variations in transfer duty. The State’s property market continues to be supported by strong income and population growth, a robust residential housing pipeline and favourable interest rates.
The residential property market provides the vast bulk of transfer duty revenue. Revenue from residential transactions is expected to be $6.3 billion in 2017-18, providing 72.5 per cent of transfer duty revenue. This is $558.0 million, or 8.1 per cent, less than forecast at the HYR. Revenue from residential transactions is expected to reach $5.6 billion in 2018-19, a 10.9 per cent decline from 2017-18. Residential transfer duty is forecast to return to positive growth in 2019-20, averaging 2.4 per cent per annum in the four years to 2021-22.
Volatility in residential transaction volumes, and the timing of turning points in market sentiment, are the key challenges in forecasting transfer duty. Volumes are significantly more volatile than prices, in part because owners tend to resist selling when prices fall in nominal terms.
In recent years the number of residential property transactions has been significantly higher than the long-run trend, increasing the likelihood of a return to more typical levels. Where residential volumes peaked at around 210,000 in 2017, the annual volume is now expected to fall to around 183,000 transactions in 2018-19, before returning to its long-run trend level of about 200,000 in subsequent years. Volume growth will continue to be supported by population growth of around 1.4 per cent across the forecast period.

Revenue
5 - 10 Budget Statement 2018-19
Residential price growth, as measured by the average consideration of properties transacted, tends to lag movements in residential volumes by several months. In the near term, declining auction clearance rates suggest that price growth will continue to weaken until Spring 2018, with a forecast 7.5 per cent fall in average prices from their peak in 2017. Thereafter, prices are forecast to remain stable through 2018-19. Positive price growth is expected to resume from early in 2019-20, reaching an annual rate of 3.5 per cent by mid 2020, consistent with forecast growth of average compensation of employees (see Chart 5.6).
Chart 5.6: Residential prices and auction clearance rates
40
45
50
55
60
65
70
75
80
85
90
-15
-10
-5
0
5
10
15
20
25
Jun-06 Jun-07 Jun-08 Jun-09 Jun-10 Jun-11 Jun-12 Jun-13 Jun-14 Jun-15 Jun-16 Jun-17 Jun-18 Jun-19 Jun-20 Jun-21 Jun-22
Per
cen
t
Pe
r ce
nt
gro
wth
, th
rou
gh
th
e y
ear
Price growth LHS Forecast LHS Auction clearance rate (advanced 2 quarters s.a.) RHS
(a) Source: Australian Property Monitor, Revenue NSW, NSW Treasury
Revenue from commercial property transactions in 2017-18 is expected to be around $2.2 billion, of which around $200 million is attributable to one-off large transactions that are not expected to be repeated in future years. Removing the influence of these one-off large transactions, revenue from commercial transactions is expected to grow at an average annual rate of around 3.2 per cent in the four years to 2021-22.
Consistent with standard NSW practice, the expected impact of asset sales is not incorporated until transactions are complete. The Government is planning to sell 51 per cent of WestConnex, after which additional transfer duty associated with the sale will be received.
The reduced share of investors and increased number of owner-occupiers in the property market is also expected to reduce foreign investor surcharge transfer duty relative to previous forecasts. Revenue from foreign investor surcharge transfer duty is expected to provide around $210 million in revenue in 2017-18, and around $571.0 million in the four years to 2021-22.
During 2016-17, 5,776 transactions were subject to foreign investor surcharge transfer duty, while around 2,000 transactions are now expected to incur the surcharge each year. The decline in foreign investor volumes has been driven by several factors including increased transfer duty and land tax surcharges applying since July 2017, the general downturn in the Sydney property market, national changes to foreign investor approval rules, Commonwealth taxation of vacant homes owned by foreigners, and macroprudential measures affecting domestic bank lending to foreign investors.

Revenue
Budget Statement 2018-19 5 - 11
Box 5.2: First-home buyer numbers 3.5 times higher than last year
On 1 June 2017, the NSW Government announced a comprehensive housing affordability package aimed at supporting first-home buyers. The package provides stamp duty relief, reforms the planning system to boost housing supply and delivers infrastructure to support growing communities across the State.
To give first-home buyers a better opportunity to own a home, the housing package abolished stamp duty for first-home buyers on new and existing homes of up to $650,000 in value, with stamp duty reductions for properties between $650,000 and $800,000. The package also offered $10,000 grants for first-home buyers purchasing new homes up to $600,000. The maximum benefit available for first-home buyers is $34,361 (Chart 5.7).
Chart 5.7: Savings for first-home buyers
0
5,000
10,000
15,000
20,000
25,000
30,000
35,000
40,000
$500,000 $550,000 $600,000 $650,000 $700,000 $710,000 $750,000 $775,000 $800,000
$ s
avin
gs
Purchase price
Savings for fi rst-home buyers of new dwellings Savings for fi rst-home buyers of existing dwellings
Between July 2017 and May 2018 around 30,000 first-home buyers received stamp duty concessions and exemptions worth around $435.0 million. The number of first-home buyers is now more than 3.5 times higher than in the same period in 2016-17. Where first-home buyer concessions made up around 6.7 per cent of property transactions worth less than $800,000 during 2016-17, their share of the total residential transactions within this price range has now risen to around 25.4 per cent (Chart 5.9).
Chart 5.8: Composition of first-home buyer concessions for dwellings less than $800,000
-200
-100
0
100
200
300
400
-40
-20
0
20
40
60
Apr-11 Oct-11 Apr-12 Oct-12 Apr-13 Oct-13 Apr-14 Oct-14 Apr-15 Oct-15 Apr-16 Oct-16 Apr-17 Oct-17 Apr-18
Per
ce
nt g
row
th,
thro
ug
h t
he
yea
r
Per
ce
nt g
row
th,
thro
ug
h t
he
yea
r
Tota l residential volume growth LHS First-home buyers volume growth RHS

Revenue
5 - 12 Budget Statement 2018-19
Box 5.2: First-home buyer numbers 3.5 times higher than last year (cont)
Chart 5.9: Total first-home buyer concessions
0
500
1000
1500
2000
2500
3000
3500
4000
0
5
10
15
20
25
30
Perc
en
tag
e s
hare
of
FH
B
Proportion of tota l volumes under $800k made up by first-home buyers LHS
Number of first-home buyer concessions RHS
Other stamp duties
Other stamp duties include insurance duty and motor vehicle registration duty. In 2017-18, revenue from these duties is expected to reach $1.8 billion, an upward revision of $65.0 million since the 2017-18 HYR. Insurance duty collections are expected to grow by 3.5 per cent over the four years to 2021-22. Motor vehicle registration duty is forecast to grow at an average annual rate of 3.3 per cent over the four years to 2021-22.
Payroll tax
Payroll tax revenue in 2017-18 is expected to be $8.8 billion, an upward revision of $151.9 million since the 2017-18 Budget and a downward revision of $38.6 million since the 2017-18 HYR.
Payroll tax revenue of $9.2 billion is forecast for 2018-19, growing by 4.1 per cent from 2017-18, and providing the largest source of taxation revenue. Payroll tax revenue over the four years to 2021-22 is forecast to grow at an average annual rate of 4.5 per cent.
Payroll tax revenue will be supported by strong employment and wage growth over the four years to 2021-22. Wage growth is forecast to gradually rise over the forward estimates, consistent with declining spare capacity in the national labour market, increased skill shortages, higher advertised salaries and fewer wage freezes. Employment growth is expected to reach 3 per cent in 2017-18, and to moderate over the forecast period as the NSW labour market reaches near full-employment by 2019-20. Strong employment is in turn expected to drive higher wage growth over the forecast period.
Growth of payroll tax revenue as a result of the strength of the economy will be moderated by increases in the tax-free threshold over four years, from the current $750,000 to $1.0 million in 2021-22, to support NSW businesses (see Box 5.1).

Revenue
Budget Statement 2018-19 5 - 13
Land tax
Land tax revenue in 2017-18 is expected to be $3.8 billion, an increase of $42.0 million since the 2017-18 HYR forecast.
Land tax revenue is expected to grow by 6.1 per cent on average over the four years to 2021-22. Average land values are forecast to grow by 7 per cent in 2017-18 and to grow at an average rate of 1.7 per cent in the four years to 2021-22, reflecting the general property market slowdown. Because of the three-year averaging of land values, growth of land values in recent years will continue to support strong land tax growth over the next two years.
Taxes on motor vehicle ownership and operation
Weight tax remains broadly in line with expectations at the 2017-18 HYR, reaching an estimated $2.2 billion in 2017-18 and growing at an average annual rate of 5.2 per cent over the four years to 2021-22. Growth of the vehicle stock will contribute to growth of weight tax over the forward estimates. Revenue from vehicle registration and transfer fees is broadly in line with expectations in the 2017-18 HYR and is forecast to grow at an average annual rate of 4.3 per cent over the four years to 2021-22.
Gambling and betting taxes
Gambling tax revenue is forecast to grow by 4 per cent over the four years to 2021-22. A change in the accounting treatment of the share of lotteries revenue collected on behalf of the Australian Capital Territory has seen a downward adjustment in overall lotteries revenue. An offsetting adjustment has been made in fines, regulatory fees and other revenue.
Racing revenue is estimated at $141.3 million in 2018-19, and is forecast to grow by 13.3 per cent over the four years to 2021-22. This growth includes revenue from the point of consumption tax, which is estimated to raise $355.0 million in the four years to 2021-22.
Other taxes
Other taxes and levies will provide $3.0 billion in 2018-19, growing at an average annual rate of 1.2 per cent in the four years to 2021-22. Revenue from the government guarantee of debt levy is forecast to grow at an average annual rate of 9.8 per cent, driven by increased debt of State Owned Corporations as they revise their capital structures and increase capital spending during the forecast period.
5.4 Grant revenue
New South Wales is expected to receive $31.7 billion in grants in 2018-19 from the Commonwealth Government. These include GST payments, National Agreements, National Partnerships and other Commonwealth payments (see Table 5.5).
Total grant revenue is expected to increase at an average annual rate of 2.5 per cent over the four years to 2021-22. Revenue growth during this period is affected by the expiry of a number of National Partnerships, such as the Asset Recycling Initiative, Adult Public Dental National Partnership and Universal Access to Early Childhood Education National Partnership. The NSW Government is currently negotiating with the Commonwealth Government to secure its fair share of national funding under new agreements (see Box 5.4).
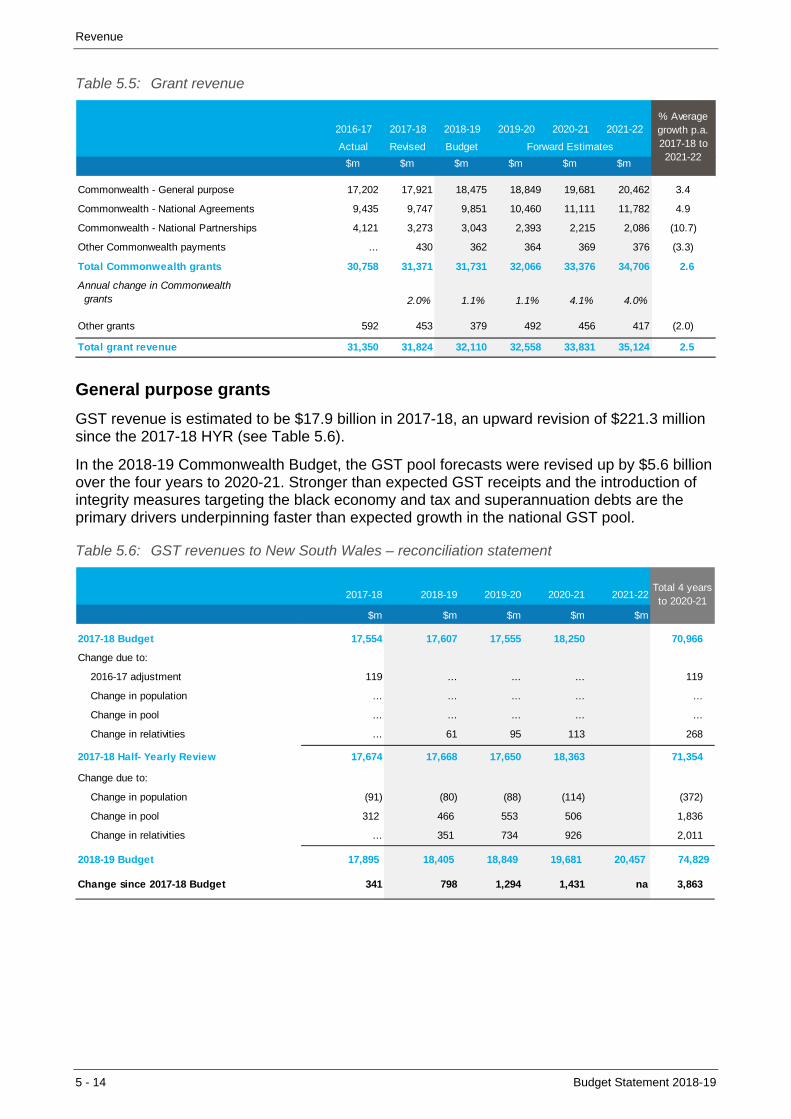
Revenue
5 - 14 Budget Statement 2018-19
Table 5.5: Grant revenue
2018-19 2019-20 2020-21 2021-22
Actual Revised Budget
$m $m $m $m $m $m
Commonwealth - General purpose 17,202 17,921 18,475 18,849 19,681 20,462 3.4
Commonwealth - National Agreements 9,435 9,747 9,851 10,460 11,111 11,782 4.9
Commonwealth - National Partnerships 4,121 3,273 3,043 2,393 2,215 2,086 (10.7)
Other Commonwealth payments ... 430 362 364 369 376 (3.3)
Total Commonwealth grants 30,758 31,371 31,731 32,066 33,376 34,706 2.6
Annual change in Commonwealth grants 2.0% 1.1% 1.1% 4.1% 4.0%
Other grants 592 453 379 492 456 417 (2.0)
Total grant revenue 31,350 31,824 32,110 32,558 33,831 35,124 2.5
% Average growth p.a.2017-18 to 2021-22
Forward Estimates
2016-17 2017-18
General purpose grants
GST revenue is estimated to be $17.9 billion in 2017-18, an upward revision of $221.3 million since the 2017-18 HYR (see Table 5.6).
In the 2018-19 Commonwealth Budget, the GST pool forecasts were revised up by $5.6 billion over the four years to 2020-21. Stronger than expected GST receipts and the introduction of integrity measures targeting the black economy and tax and superannuation debts are the primary drivers underpinning faster than expected growth in the national GST pool.
Table 5.6: GST revenues to New South Wales – reconciliation statement
2017-18 2018-19 2019-20 2020-21 2021-22
$m $m $m $m $m
2017-18 Budget 17,554 17,607 17,555 18,250 70,966
Change due to:
2016-17 adjustment 119 ... ... ... 119
Change in population ... ... ... ... ...
Change in pool ... ... ... ... ...
Change in relativities ... 61 95 113 268
2017-18 Half- Yearly Review 17,674 17,668 17,650 18,363 71,354
Change due to:
Change in population (91) (80) (88) (114) (372)
Change in pool 312 466 553 506 1,836
Change in relativities ... 351 734 926 2,011
2018-19 Budget 17,895 18,405 18,849 19,681 20,457 74,829
Change since 2017-18 Budget 341 798 1,294 1,431 na 3,863
Total 4 years to 2020-21
Revenue
Budget Statement 2018-19 5 - 15
In April 2018, the Commonwealth Grants Commission (CGC) recommended the final per capita relativity for New South Wales for 2018-19 which, at 0.855, was higher than anticipated in the 2017-18 HYR. New South Wales’ per capita GST share is anticipated to fall across the four years to 2021-22, reflecting its economic and fiscal strength. However, the relativity is forecast to decline at a slower rate than was previously anticipated due to the softening of the property market in New South Wales and a strengthened fiscal outlook for other states and territories.
Despite these improvements, this should not mask that the NSW share of GST is a reflection of a system that penalises strong performing states (see Box 5.3).
Over the four years to 2021-22, GST revenue is expected to grow on average by 3.4 per cent per annum, while the national GST pool is expected to grow at an average annual rate of 5.1 per cent. New South Wales’ share of the pool will steadily decline over the four years to a historic low in 2021-22, reaching around 83 per cent of the revenue it would receive under an equal per capita allocation of the GST pool (see Box 5.4). The Government continues to advocate that the people of New South Wales should not be penalised for their hard work in delivering our strong economy. The Government will continue to seek a fairer system for allocation of the GST pool between the states and territories.
Partially offsetting the improved outlook for the GST pool is a decrease in New South Wales’ national population share. The NSW share of the national population is forecast to decline from 31.94 per cent in 2017-18 to 31.85 per cent in 2021-22.
Box 5.3: GST relativity affected by NSW’s strong fiscal position
The State’s GST revenues are forecast to grow at an average annual rate of 3.4 per cent over the four years to 2021-22, despite a forecast decline in the NSW share of GST revenue per capita (the NSW relativity), and a forecast declining share of Australia’s population. The updated forecasts take into consideration the CGC’s 2018 Update in April 2018 and recent fiscal developments in New South Wales and other jurisdictions. New South Wales’ relativity is currently expected to decline from a high of 0.975 in 2014-15 to a historic low of 0.830 in 2021-22, reflecting its strong fiscal capacity relative to other states in recent years.
Weakening New South Wales transfer duty revenue, improved royalty collections in the mining states and a strengthening fiscal position in Victoria are expected to cushion the decline in New South Wales’ forecast relativities compared with the forecasts at the 2017-18 HYR.
The NSW Government continues to advocate for an equal per capita distribution of the GST, greater simplification of the CGC methodology and a more meaningful role for states in the administration of Horizontal Fiscal Equalisation. If GST were distributed on an equal per capita basis, New South Wales would receive an additional $2.4 billion in 2017-18 and $3.1 billion in 2018-19, rising to $4.2 billion in 2021-22, for a total of $16.8 billion from 2017-18 to 2021-22 (see Chart 5.10).
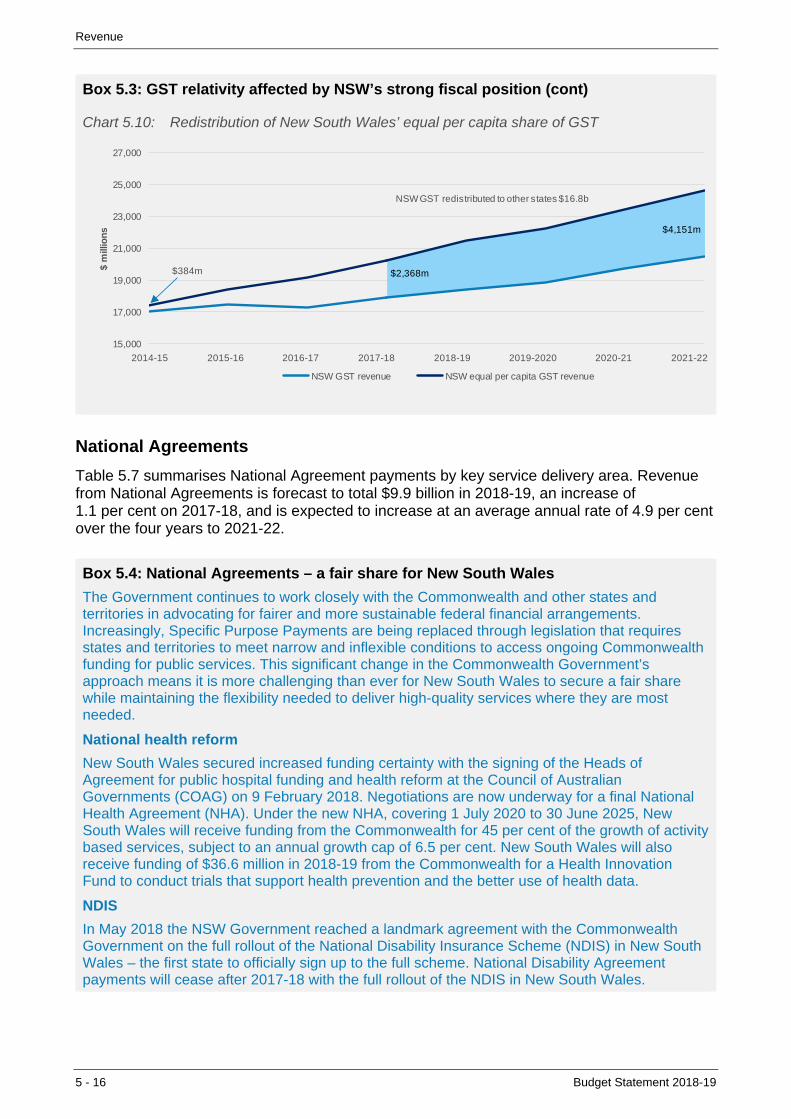
Revenue
5 - 16 Budget Statement 2018-19
Box 5.3: GST relativity affected by NSW’s strong fiscal position (cont)
Chart 5.10: Redistribution of New South Wales’ equal per capita share of GST
15,000
17,000
19,000
21,000
23,000
25,000
27,000
$ m
illio
ns
NSW GST revenue NSW equal per capita GST revenue
2014-15 2015-16 2016-17 2017-18 2018-19 2019-2020 2020-21 2021-22
NSW GST redistributed to other states $16.8b
$4,151m
$2,368m$384m
National Agreements
Table 5.7 summarises National Agreement payments by key service delivery area. Revenue from National Agreements is forecast to total $9.9 billion in 2018-19, an increase of 1.1 per cent on 2017-18, and is expected to increase at an average annual rate of 4.9 per cent over the four years to 2021-22.
Box 5.4: National Agreements – a fair share for New South Wales
The Government continues to work closely with the Commonwealth and other states and territories in advocating for fairer and more sustainable federal financial arrangements. Increasingly, Specific Purpose Payments are being replaced through legislation that requires states and territories to meet narrow and inflexible conditions to access ongoing Commonwealth funding for public services. This significant change in the Commonwealth Government’s approach means it is more challenging than ever for New South Wales to secure a fair share while maintaining the flexibility needed to deliver high-quality services where they are most needed.
National health reform
New South Wales secured increased funding certainty with the signing of the Heads of Agreement for public hospital funding and health reform at the Council of Australian Governments (COAG) on 9 February 2018. Negotiations are now underway for a final National Health Agreement (NHA). Under the new NHA, covering 1 July 2020 to 30 June 2025, New South Wales will receive funding from the Commonwealth for 45 per cent of the growth of activity based services, subject to an annual growth cap of 6.5 per cent. New South Wales will also receive funding of $36.6 million in 2018-19 from the Commonwealth for a Health Innovation Fund to conduct trials that support health prevention and the better use of health data.
NDIS
In May 2018 the NSW Government reached a landmark agreement with the Commonwealth Government on the full rollout of the National Disability Insurance Scheme (NDIS) in New South Wales – the first state to officially sign up to the full scheme. National Disability Agreement payments will cease after 2017-18 with the full rollout of the NDIS in New South Wales.

Revenue
Budget Statement 2018-19 5 - 17
Box 5.4: National Agreements – a fair share for New South Wales (cont)
The New South Wales funding contribution to the NDIS will exceed $3.0 billion in 2018-19, and will grow at an average rate of 4 per cent per annum. The Commonwealth Government will pay the balance of all NDIS costs above the NSW contribution. Additionally, Commonwealth funding under the DisabilityCare Australia Fund National Partnership is expected to provide $547.0 million in 2018-19, and $3.1 billion over the life of the Partnership Agreement, terminating at the end of 2023-24.
Housing
Under Commonwealth legislation, the new National Housing and Homelessness Agreement (NHHA) is intended to commence from 2018-19. Under this Agreement, New South Wales would continue to receive the same level of funding it received under the previous National Affordable Housing Agreement and the National Partnership Agreement on Homelessness – both of which cease at the end of 2017-18. New South Wales continues to negotiate with the Commonwealth regarding certain aspects of the new Agreement. A key focus is how to ensure New South Wales retains flexibility to use Commonwealth funding to deliver the greatest benefits to the social housing and homelessness sectors. In comparison, the Commonwealth seeks to direct such funding to achieve broader housing objectives, even though no additional federal funding has been provided.
Table 5.7: National Agreement and other payments to New South Wales
Actual Revised Budget
$m $m $m $m $m $m
Health 6,018 6,068 6,463 6,883 7,330 7,807 6.5
Education 2,037 2,269 2,427 2,600 2,787 2,974 7.0
Skills and workforce development 473 480 485 492 500 508 1.4
Affordable housing 430 435 477 485 493 493 3.2
Disability 477 495 ... ... ... ... (100.0)
Total National Agreement and other payments 9,435 9,747 9,851 10,460 11,111 11,782 4.9
% Average growth p.a.2017-18 to 2021-22
Forward Estimates
2016-17 2017-18 2018-19 2019-20 2020-21 2021-22
National Partnerships
The Commonwealth Government provides National Partnership payments to support specified projects or achieve service delivery improvements. New South Wales will receive $9.7 billion in National Partnership payments over the four years to 2021-22 (see Table 5.8).
A new National Land Transport Agreement for the period from 2019 to 2024 is expected to be finalised with the Commonwealth during 2018-19. The Commonwealth announced in their 2018-19 Budget funding toward a Macquarie Park Transport Interchange, providing $5.0 million in 2018-19 and $60.0 million over the four years to 2021-22.
The Asset Recycling Initiative (ARI) will expire in 2018-19, when New South Wales is expected to receive the final payment of $335.2 million. New South Wales has received more than any other state from this one-off initiative designed to encourage the divestment of assets and reinvestment of the proceeds into new productive infrastructure. The ARI proceeds form part of total asset sale proceeds received by the State, which have been put toward projects aimed at improving the productivity and competitiveness of the New South Wales economy.

Revenue
5 - 18 Budget Statement 2018-19
New South Wales will receive $5.4 million in 2018-19 under the Essential Vaccines National Partnership, a downward revision of $39.1 million since the HYR. From 1 July 2018, the Commonwealth Government will provide the bulk of vaccines directly.
Table 5.8: National Partnership payments to New South Wales
Actual Revised Budget
$m $m $m $m $m $m
Roads and rail including ARI 3,341 2,451 1,921 1,421 1,312 1,179 (16.7)
Education and skills 305 226 179 154 108 96 (19.4)
Disability 176 186 547 607 618 630 35.7
Health 123 115 124 51 50 45 (20.7)
Housing 30 30 ... ... ... ... (100.0)
Environment 61 171 108 45 36 36 (32.3)
Other 85 94 164 114 90 100 1.4
2021-22% Average growth p.a. 2017-18 to 2021-22
Forward Estimates2016-17 2020-212018-19 2019-202017-18
Box 5.5: Taking the lead on federal financial relations
The NSW Government will pursue a fairer and more dynamic form of federalism in its relations with the Commonwealth Government, other states and territories in 2018-19. The Board of Treasurers, established in October 2017, is set to play an instrumental role in building consensus on issues of common interest, advancing national reform priorities and fostering more constructive and effective engagement with the Commonwealth Government. The Board of Treasurers has agreed to:
Establish a clear path for states and territories to play a leadership role in advancing national reform priorities, with a near-term focus on productivity-enhancing reforms as outlined in the Productivity Commission’s report Shifting the Dial: 5 year productivity review.
Ensure negotiations with the Commonwealth contribute to funding certainty and stability, while maintaining the States’ autonomy and flexibility necessary to continue delivering high-quality services and infrastructure.
First proposed by the NSW Government in 2017, the Board of Treasurers has met on two occasions, progressing an agenda to lift national productivity and ensure states and territories continue to deliver the high-quality services that matter most to our citizens. At their May 2018 meeting, the Board of Treasurers identified priority areas for productivity-enhancing reforms.
5.5 Other revenues
Sale of goods and services
Sale of goods and services are expected to reach $8.7 billion in 2017-18, and are forecast to grow by 3.1 per cent in the four years to 2021-22.
Revenue received by the Department of Health for delivery of veterans’ services on behalf of the Commonwealth Government is forecast to be $287.1 million in 2017-18. Under a new Hospital Services Arrangement, commencing on 1 December 2017, guaranteed minimum funding will be provided until 2019-20, and thereafter funding will be based on an agreed ‘national efficient price’.

Revenue
Budget Statement 2018-19 5 - 19
Fees for service are expected to reach $2.0 billion in 2017-18 and to grow at an average annual rate of 4.9 per cent in the four years to 2020-21. Within this period, changes from year to year are explained largely by timing of the More Trains More Services and New Intercity Fleet programs and their impact on revenue received by Transport for NSW for services provided to Rail Corporation NSW.
Table 5.9: Sale of goods and services
2016-17 2017-18 2018-19 2019-20 2020-21 2021-22Actual Revised Budget
$m $m $m $m $m $m
Rents and leases 247 246 245 236 248 245
Fees for service 1,981 2,015 2,977 2,607 2,373 2,442
Entry fees 58 66 57 57 58 58
Patient fees and hospital charges 1,005 1,085 1,166 1,216 1,242 1,269
Department of Veterans' Affairs 324 287 240 200 416 435
Court fees 131 128 129 132 133 135
Road tolls 153 156 157 159 161 162
Other sales of goods and services 4,260 4,727 4,542 4,692 4,750 5,083
Sale of goods and services 8,159 8,711 9,513 9,299 9,381 9,829
Forward Estimates
Interest income
Interest income includes returns on managed bond investments, including investments made by TCorp, and interest earned on bank deposits. In 2017-18, interest income has been revised up by $161.8 million since the 2017-18 HYR, due to higher cash holdings from major asset sale proceeds and lower than budgeted expenditure. Interest income is forecast to decline at an average annual rate of 15.9 per cent over the four years to 2021-22, as investment funds are shifted to other distributions.
Dividends and income tax equivalents
State-owned corporations pay dividends that provide a commercially appropriate return on government investment. These dividends support investment in essential government services.
Dividends and income tax equivalents have been revised down by $189.2 million in 2017-18 since the 2017-18 HYR following changes to the timing of dividend payments. In 2018-19, dividends and income tax equivalents will provide $1.8 billion of revenue and $5.5 billion over the four years to 2021-22 (see Chapter 8 for further detail).
Other dividends and distributions
Other dividends and distributions are forecast to increase by 50.2 per cent in 2017-18. Between 2017-18 and 2021-22, other dividends and distributions are expected to fall by $722.6 million. This reflects the sale of the State’s share of Snowy Hydro to the Commonwealth Government and lower distributions from other equity investments as underlying funds are spent on infrastructure.
Investment returns from investment funds are making an increasing contribution to revenue. This reflects the Government’s strategy to invest asset recycling proceeds over a horizon matching the requirements for infrastructure delivery. Distributions from the NSW Infrastructure Future Fund are expected to be $808.8 million in 2017-18, and are forecast to decrease at an average annual rate of 27.5 per cent over the four years to 2021-22 as infrastructure projects are delivered.

Revenue
5 - 20 Budget Statement 2018-19
Over the four years to 2021-22, greater exposure to financial markets of investment funds under management may increase revenue volatility for other dividends and distributions.
Royalties
Mineral royalties are expected to provide $1.8 billion of revenue in 2017-18, an upward revision of $110.8 million since the 2017-18 Budget and $46.5 million since the 2017-18 HYR.
Royalty revenue over the four years to 2021-22 will total $7.4 billion, an upward revision of $813.4 million since the 2017-18 HYR. The revision reflects long-term price forecasts, expectations of steady growth in coal export volumes and a slight depreciation in the Australian dollar.
Coal export volumes will be supported by strong demand from India, Japan, South Korea and China. The spot price for thermal coal is currently around US$94 per tonne, but market expectations suggest a gradual moderation of thermal coal prices over the next four years. Royalty estimates are susceptible to changes in global coal production, import and export restrictions in China, and exchange rate fluctuations.
Fines, regulatory fees, licences and other revenue
Total revenue from fines, licences and other sources is $3.0 billion for 2017-18, and is forecast to grow at an average annual rate of 6.2 per cent over the four years to 2021-22.
Fines revenue is expected to increase at an average annual rate of 7.9 per cent over the four years to 2021-22, reflecting underlying growth of fines revenue and road safety initiatives. This growth is partially offset by a reduction in parking fines issued by state government agencies, which is expected to reduce fines revenue by $6.4 million over the four years to 2021-22 (see Section 5.1 for additional detail).
Licence revenue will be $210.0 million in 2017-18, a $34.2 million revision since the 2017-18 HYR reflecting a greater than expected uptake of 10-year drivers licences. Licence revenue is forecast to fall in 2021-22 due to a recurring cycle in the pattern of drivers licence renewals.
Other revenues are forecast to grow at an average annual rate of 6.2 per cent over the four years to 2021-22. The greatest contribution to this growth arises from non-cash revenue associated with the accounting recognition of the NorthConnex and WestConnex Stage 1 Public Private Partnership motorways. These non-cash revenues will accrue each year as a right to receive until the concessions end.
Expansion of Special Infrastructure Contributions across metropolitan precincts will also generate revenue to deliver infrastructure required to support the development of growing communities. Other revenues in 2021-22 are boosted by planned sales of development sites.
Table 5.10: Fines, regulatory fees, licences and other revenues
2016-17 2017-18 2018-19 2019-20 2020-21 2021-22
Actual Revised Budget
$m $m $m $m $m $m
Fines 584 632 698 819 821 857
Regulatory fees 146 139 155 171 173 178
Licences 190 210 220 226 243 211
Other revenues 2,204 2,060 1,856 2,521 2,336 2,620
Total fines, regulatory fees, licences and other revenues 3,123 3,041 2,929 3,737 3,573 3,866
Forward Estimates

Budget Statement 2018-19 6 - 1
6. EXPENDITURE
• The 2018-19 Budget harnesses the Government’s record of strong fiscal management, with focused expenditure to deliver better essential services, more support, and new and improved infrastructure for communities across the State, to make New South Wales an even better place to live.
• Expenses for 2018-19 are estimated to be $79.7 billion. This includes major investments in frontline services, supporting better care in our hospitals, world class education in our schools, and transport links that are fast, convenient and easy to access.
• Expense growth is forecast to be lower than estimated at the 2017-18 Half-Yearly Review, growing at an average of 3.2 per cent per annum over the budget and forward estimates. This reflects the Government’s commitment to sustain the State’s fiscal and economic strength in the long term.
• To reduce back-office costs and focus expenditure where it is needed most, the 2018-19 Budget includes a number of savings and efficiency measures, including an extension of the efficiency dividend from two to three per cent.
• The Government’s record infrastructure program continues, with forecast capital investment of $87.2 billion over the budget and forward estimates (including $65.7 billion within the general government sector). This includes major health, education, road and transport projects to support current and future generations, as well as local infrastructure to make communities more liveable by improving parks, cultural and sporting precincts, and creating more open and green spaces.
6.1 General government recurrent expenses
General government sector (GGS) recurrent expenses include the costs of delivering services such as education, health, public transport and other frontline services. Recurrent expenses include grants and subsidies, depreciation and other operating expenses, as well as the salaries and wages for teachers, nurses and police.
Expenses in 2017-18 are expected to be $76.5 billion, which is $664.5 million lower than estimated in the 2017-18 Budget. This decrease is primarily driven by the reprofiling of expenditure across the budget and forward estimates to better align with planned project and service delivery schedules.
Expenses in 2018-19 are forecast to be $79.7 billion. This is 4.1 per cent higher than 2017-18, reflecting investments to improve disability and hospital services, public transport upgrades, and additional support for our police and justice system.
Annual expense growth across the budget and forward estimates is expected to remain below long-term average revenue growth of 5.6 per cent, in line with the Government’s commitments outlined in the Fiscal Responsibility Act 2012 (FRA).
Expenditure as a percentage of GSP is expected to fall from 12.6 per cent in 2018-19 to 12.0 per cent in 2021-22. Over the longer term, between 2010-11 and 2021-22, expenses as a share of GSP are forecast to decline by 0.8 of a percentage point, reflecting the Government’s responsible fiscal management and efficient service delivery.
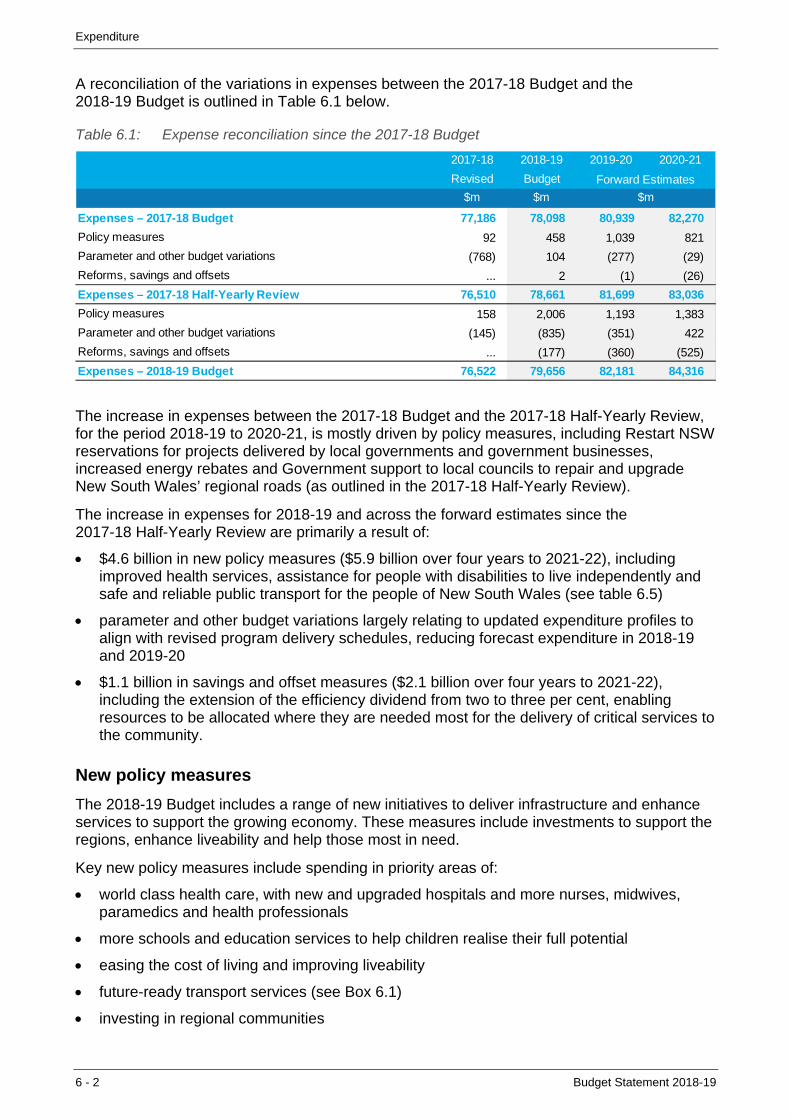
Expenditure
6 - 2 Budget Statement 2018-19
A reconciliation of the variations in expenses between the 2017-18 Budget and the 2018-19 Budget is outlined in Table 6.1 below.
Table 6.1: Expense reconciliation since the 2017-18 Budget
2017-18 2018-19 2019-20 2020-21
Revised Budget
$m $m
Expenses – 2017-18 Budget 77,186 78,098 80,939 82,270
Policy measures 92 458 1,039 821
Parameter and other budget variations (768) 104 (277) (29)
Reforms, savings and offsets ... 2 (1) (26)
Expenses – 2017-18 Half-Yearly Review 76,510 78,661 81,699 83,036
Policy measures 158 2,006 1,193 1,383
Parameter and other budget variations (145) (835) (351) 422
Reforms, savings and offsets ... (177) (360) (525)
Expenses – 2018-19 Budget 76,522 79,656 82,181 84,316
$m
Forward Estimates
The increase in expenses between the 2017-18 Budget and the 2017-18 Half-Yearly Review, for the period 2018-19 to 2020-21, is mostly driven by policy measures, including Restart NSW reservations for projects delivered by local governments and government businesses, increased energy rebates and Government support to local councils to repair and upgrade New South Wales’ regional roads (as outlined in the 2017-18 Half-Yearly Review).
The increase in expenses for 2018-19 and across the forward estimates since the 2017-18 Half-Yearly Review are primarily a result of:
$4.6 billion in new policy measures ($5.9 billion over four years to 2021-22), including improved health services, assistance for people with disabilities to live independently and safe and reliable public transport for the people of New South Wales (see table 6.5)
parameter and other budget variations largely relating to updated expenditure profiles to align with revised program delivery schedules, reducing forecast expenditure in 2018-19 and 2019-20
$1.1 billion in savings and offset measures ($2.1 billion over four years to 2021-22), including the extension of the efficiency dividend from two to three per cent, enabling resources to be allocated where they are needed most for the delivery of critical services to the community.
New policy measures
The 2018-19 Budget includes a range of new initiatives to deliver infrastructure and enhance services to support the growing economy. These measures include investments to support the regions, enhance liveability and help those most in need.
Key new policy measures include spending in priority areas of:
world class health care, with new and upgraded hospitals and more nurses, midwives, paramedics and health professionals
more schools and education services to help children realise their full potential
easing the cost of living and improving liveability
future-ready transport services (see Box 6.1)
investing in regional communities

Expenditure
Budget Statement 2018-19 6 - 3
improving our sports, arts and cultural facilities
helping the vulnerable and supporting those in need
creating jobs, increasing productivity and making New South Wales a great place to do business
helping young people get ahead
supporting our justice system and protecting our communities
empowering Indigenous communities
preserving our natural environment
futureproofing New South Wales and planning for the future of Western Sydney.
Box 6.1: More Trains, More Services
The 2018-19 Budget increases Government investment to $648.2 million in 2018-19 ($1.6 billion over four years) to commence critical replacement of end-of-life signaling systems under the Automated Systems phase of the More Trains, More Services program. This funding will also support a business case and planning for further stages of the program.
More Trains, More Services is looking at ways to transform the existing rail network and Sydney’s busiest train lines with world-class technology. This includes creating high capacity ‘turn up and go’ services using digital systems, infrastructure upgrades and enhanced rail fleet.
This program will focus on delivering express services for Western Sydney and investigate critical capacity upgrades for the T4 Eastern Suburbs and Illawarra Line, T8 Airport and South Line and South Coast Line.
Parameter and other budget variations
Parameter and other budget variations are changes affecting the cost, timing and delivery of services largely outside government control. These include changes to broader economic factors, population or demand growth, accounting adjustments and variations to Commonwealth Government grants.
Significant parameter and other budget variations that have increased expenditure in 2018-19 and across the forward estimates, relative to the 2017-18 Half-Yearly Review include:
$346.5 million over 2020-21 and 2021-22 to recognise payments associated with the Public Private Partnership delivery of the new Grafton Correctional Centre
$327.3 million in 2018-19 and 2019-20 for expenses associated with the delivery of Sydney Metro Northwest, creating future ready transport that supports a growing economy
an additional $283.8 million over four years to support increased NSW Government school enrolments, including expenditure to support students with disability and provide the educational foundations for success
$153.8 million over four years for the reclassification of capital expenditure to grants to local government for the delivery of transport assets to increase transport accessibility and reduce commuting times

Expenditure
6 - 4 Budget Statement 2018-19
higher depreciation expenses, including $714.6 million over four years associated with the revaluation and reclassification of regional rail infrastructure and education building assets. This increase is partially offset by a reduction in depreciation over four years as a result of accounting adjustments and the revaluation of some transport assets.
Managing growth in expenses
Managing expense growth at sustainable levels is critical to the Government’s fiscal strategy, with the 2018-19 Budget including a range of savings and offset measures totalling $2.1 billion over the four years to 2021-22. As a result, average expense growth across the budget and forward estimates is expected to be 3.2 per cent, a reduction since the 2017-18 Half-Yearly Review.
The Government continues to deliver on its FRA targets, with annual expense growth from 2018-19 to 2021-22 forecast to remain below long-term average revenue growth of 5.6 per cent (see Chapter 2).
Savings and offset measures in the 2018-19 Budget include:
the annual efficiency dividend on agencies will be increased from the current rate of 2.0 per cent to a rate of 3.0 per cent from 2018-19 for four years. The efficiency dividend will continue to target back office savings. This is expected to attain an additional net saving of $1.6 billion over four years
agency specific savings of $430.7 million across the budget and forward estimates, which have been reallocated to higher priority areas of need.
Table 6.2 below outlines the total impact of whole-of-government savings and efficiencies implemented since 2011-12, totalling $30.8 billion from 2017-18 to 2021-22.
Table 6.2: Whole-of-government efficiencies since 2011-12
2017-18 2018-19 2019-20 2020-21 2021-22 Total
Budget
$m $m $m $m $m $m
2011-12 to 2017-18 commitments(a)5,298 5,605 5,914 6,164 6,174 29,154
2018-19 commitments
Efficiency dividend ... 139 275 408 803 1,625
Total savings 5,298 5,744 6,189 6,572 6,977 30,780
Forward estimates
(a) 2011-12 to 2017-18 commitments are based on total amounts published in 2017-18 Budget Paper No. 1, and have been adjusted to reflect Government decisions made since the 2017-18 Budget
The NSW Public Sector Wages Policy continues to support expense management, providing a fair, transparent and effective strategy to manage wage growth. The policy is expected to avoid additional costs of $5.8 billion over the four years to 2021-22.
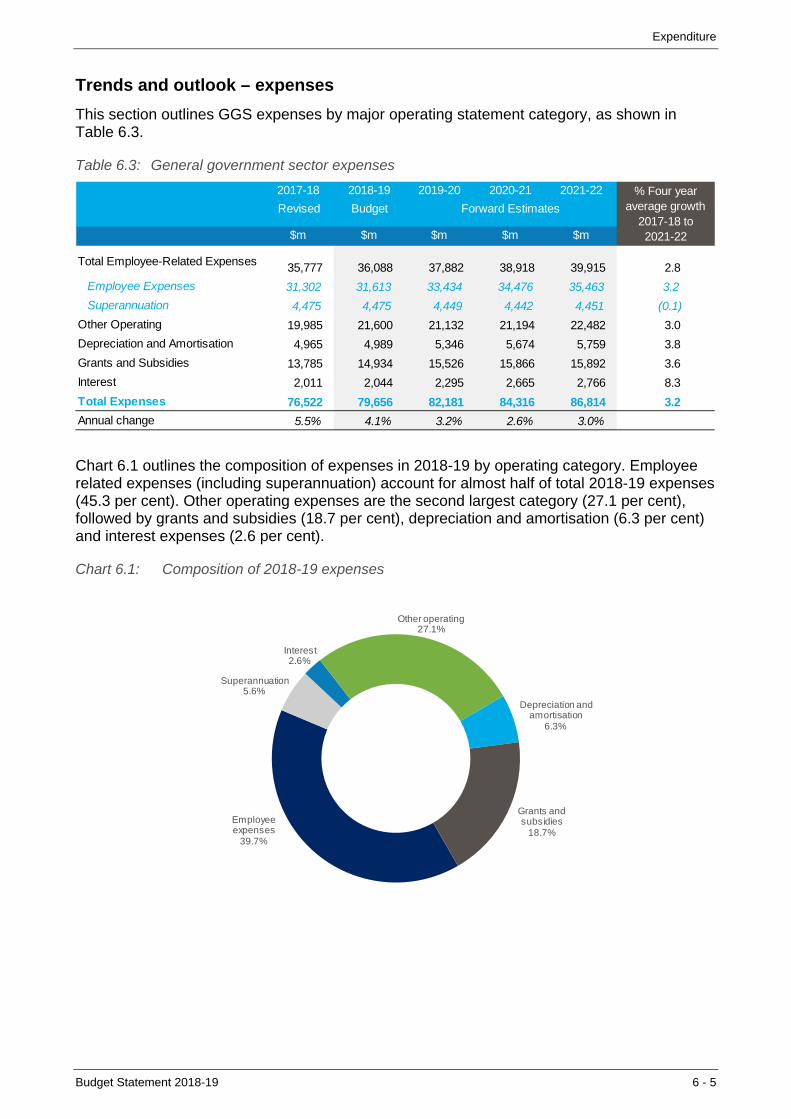
Expenditure
Budget Statement 2018-19 6 - 5
Trends and outlook – expenses
This section outlines GGS expenses by major operating statement category, as shown in Table 6.3.
Table 6.3: General government sector expenses
2017-18 2018-19 2019-20 2020-21 2021-22
Revised Budget
$m $m $m $m $m
Total Employee-Related Expenses 35,777 36,088 37,882 38,918 39,915 2.8
Employee Expenses 31,302 31,613 33,434 34,476 35,463 3.2
Superannuation 4,475 4,475 4,449 4,442 4,451 (0.1)
Other Operating 19,985 21,600 21,132 21,194 22,482 3.0
Depreciation and Amortisation 4,965 4,989 5,346 5,674 5,759 3.8
Grants and Subsidies 13,785 14,934 15,526 15,866 15,892 3.6
Interest 2,011 2,044 2,295 2,665 2,766 8.3
Total Expenses 76,522 79,656 82,181 84,316 86,814 3.2
Annual change 5.5% 4.1% 3.2% 2.6% 3.0%
% Four year average growth
2017-18 to 2021-22
Forward Estimates
Chart 6.1 outlines the composition of expenses in 2018-19 by operating category. Employee related expenses (including superannuation) account for almost half of total 2018-19 expenses (45.3 per cent). Other operating expenses are the second largest category (27.1 per cent), followed by grants and subsidies (18.7 per cent), depreciation and amortisation (6.3 per cent) and interest expenses (2.6 per cent).
Chart 6.1: Composition of 2018-19 expenses
Employee expenses
39.7%
Superannuation5.6%
Interest2.6%
Other operating27.1%
Depreciation and amortisation
6.3%
Grants and subsidies
18.7%
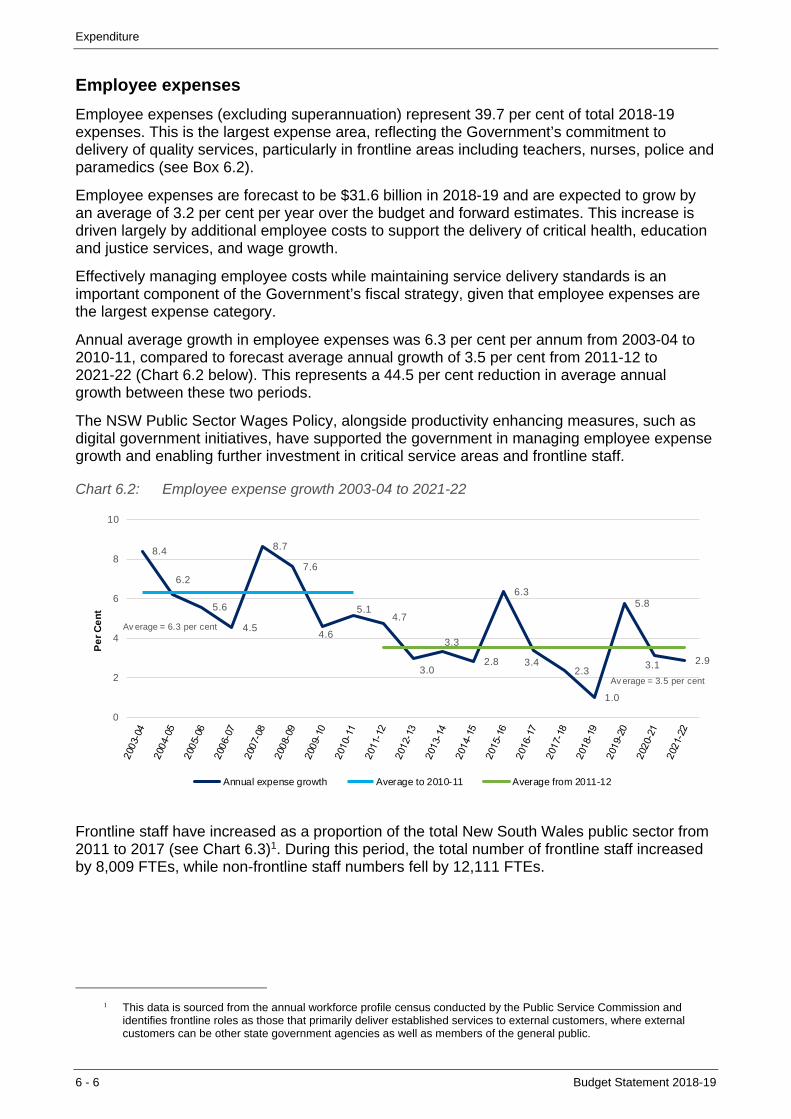
Expenditure
6 - 6 Budget Statement 2018-19
Employee expenses
Employee expenses (excluding superannuation) represent 39.7 per cent of total 2018-19 expenses. This is the largest expense area, reflecting the Government’s commitment to delivery of quality services, particularly in frontline areas including teachers, nurses, police and paramedics (see Box 6.2).
Employee expenses are forecast to be $31.6 billion in 2018-19 and are expected to grow by an average of 3.2 per cent per year over the budget and forward estimates. This increase is driven largely by additional employee costs to support the delivery of critical health, education and justice services, and wage growth.
Effectively managing employee costs while maintaining service delivery standards is an important component of the Government’s fiscal strategy, given that employee expenses are the largest expense category.
Annual average growth in employee expenses was 6.3 per cent per annum from 2003-04 to 2010-11, compared to forecast average annual growth of 3.5 per cent from 2011-12 to 2021-22 (Chart 6.2 below). This represents a 44.5 per cent reduction in average annual growth between these two periods.
The NSW Public Sector Wages Policy, alongside productivity enhancing measures, such as digital government initiatives, have supported the government in managing employee expense growth and enabling further investment in critical service areas and frontline staff.
Chart 6.2: Employee expense growth 2003-04 to 2021-22
8.4
6.2
5.6
4.5
8.7
7.6
4.6
5.14.7
3.0
3.3
2.8
6.3
3.42.3
1.0
5.8
3.1 2.9
0
2
4
6
8
10
Pe
r C
en
t
Annual expense growth Average to 2010-11 Average from 2011-12
Av erage = 6.3 per cent
Av erage = 3.5 per cent
Frontline staff have increased as a proportion of the total New South Wales public sector from 2011 to 2017 (see Chart 6.3)1. During this period, the total number of frontline staff increased by 8,009 FTEs, while non-frontline staff numbers fell by 12,111 FTEs.
1 This data is sourced from the annual workforce profile census conducted by the Public Service Commission and
identifies frontline roles as those that primarily deliver established services to external customers, where external customers can be other state government agencies as well as members of the general public.

Expenditure
Budget Statement 2018-19 6 - 7
Chart 6.3: Proportion of frontline and non-frontline staff from 2011 to 2017
85
86
87
88
89
90
0
50,000
100,000
150,000
200,000
250,000
300,000
350,000
2011 2012 2013 2014 2015 2016 2017
Fro
ntl
ine
em
plo
yees
as
a %
of t
ota
l
No
of E
mp
loye
es (F
TE
s)
Non-Frontline Frontline Proportion of Frontline
Box 6.2: Increasing frontline staff
The 2018-19 Budget continues the Government’s investment in increasing frontline staff, supporting the delivery of state outcomes including protecting vulnerable people, building strong educational foundations and improving services in our hospitals. This includes funding for:
• an additional 950 nurses and midwives, including clinical nurse/midwife educators; 300 additional doctors, including specialists; and an additional 120 allied health workers, such as physiotherapists, occupational therapists and pharmacists
• 883 extra teachers in 2018-19 to meet increasing school enrolment growth and ensure the continued delivery of high quality educational outcomes
• an additional 100 child protection workers to ensure more children are supported through the child protection system
• 100 additional specialist police officers and highway patrol officers to promote road safety and help in creating safer communities
• an additional 200 paramedics (700 over four years) and 13 call centre staff (50 over four years) to improve ambulance response times, reduce paramedic fatigue and promote safety
• up to an additional 253 front-line educators in TAFE to support planned growth for trade and other skills
• additional train drivers and guards to support the More Trains, More Services program.
Superannuation expenses
Superannuation expenses are forecast to remain relatively stable across the budget and forward estimates, declining by an average of 0.1 per cent per annum. This decrease largely reflects a reduction in defined benefit superannuation liabilities, in line with the Government’s FRA commitment to fully fund these liabilities by 2030. This decrease is partially offset by increased superannuation accumulation scheme expenses, primarily associated with additional health and education employee costs.

Expenditure
6 - 8 Budget Statement 2018-19
Other operating expenses
Other operating expenses represent 27.1 per cent of total expenses in 2018-19 and are expected to increase by an average of 3.0 per cent per annum across the budget and forward estimates.
In 2018-19, other operating expenses are forecast to increase by 8.1 per cent from 2017-18 to $21.6 billion. This growth is primarily driven by investment in transport projects, including Sydney Metro Northwest and More Trains, More Services, higher health related expenses to improve hospital services and create healthier communities, and the reprofiling of transport and education projects to reflect updated delivery schedules.
Other operating expenses are then expected to stabilise across the forward estimates, reflecting continued investment in key services, including health, education and transport.
Grants and subsidies
Grants and subsidies include payments to other sectors of government, local government, community groups and non-profit organisations for the delivery of services and infrastructure projects. Grants and subsidies are expected to be $14.9 billion in 2018-19 and form 18.7 per cent of 2018-19 total expenses. Chart 6.4 below outlines the composition of grants and subsidies in 2018-19 by recipient.
Chart 6.4: Composition of grants and subsidies in 2018-19 by sector
Commonwealth government
18.4%
NSW local government
10.1%
NSW public non-financial corporations
19.8%
Other private sector parties39.3%
Other grants and transfers
12.4%
Grants and subsidies are expected to increase by an average of 3.6 per cent annually over the budget and forward estimates, largely driven by increases in grants to the Commonwealth government, local governments and the PNFC sector. These increases reflect the ongoing transition to the National Disability Insurance Scheme (NDIS), increases in funding grants to non-government schools, as well as grants to local governments (including Restart NSW grants).
Grants to local governments and councils are forecast to increase by over 50 per cent between 2017-18 and 2018-19. These payments support the delivery of roads and other transport systems, as well as upgrades to critical infrastructure and water security in rural and regional communities.

Expenditure
Budget Statement 2018-19 6 - 9
Depreciation and amortisation
Depreciation and amortisation expenditure is forecast to be $5.0 billion in 2018-19, and is expected to increase by an average of 3.8 per cent per annum over the budget and forward estimates.
The Government’s record infrastructure program is driving this increase in depreciation, with higher depreciation costs associated with rail and other transport projects and the revaluation of education buildings. This is partially offset by a reduction in depreciation expenses as a result of revised accounting treatment and the revaluation of some transport assets.
Interest
Interest expenses in 2018-19 are forecast to be $2.0 billion and are expected to increase by an average of 8.3 per cent annually over the four years to 2021-22. This increase is primarily associated with the State’s investment in the record infrastructure program as government looks towards low cost borrowing options to help deliver infrastructure projects and enhanced services. Interest revenues are shown in section 5.5 of this Budget Statement.
6.2 General government capital expenditure
Table 6.4 below provides a reconciliation of the changes in GGS capital expenditure from the 2017-18 Budget to the 2018-19 Budget.
Table 6.4: Capital expenditure reconciliation
2017-18 2018-19 2019-20 2020-21
$m $m $m $m
14,515 16,490 10,707 7,938
610 1,810 2,103 2,300
(800) 351 91 494
14,325 18,651 12,902 10,732
(204) 1,397 3,019 4,268
(1,836) (2,718) 1,408 1,585
12,285 17,329 17,329 16,585Capital - 2018-19 Budget
Capital - 2017-18 Budget
Policy measures
Parameter and other budget variations
Capital - 2017-18 Half-Yearly Review
Policy measures
Parameter and other budget variations
General government sector capital expenditure includes the capital investment program of general government agencies and excludes public non-financial corporations such as the Rail Corporation of New South Wales/Transport Asset Holding Entity, Sydney Opera House Trust and the Sydney Olympic Park Authority.
In 2018-19 general government capital expenditure is forecast to be $17.3 billion, an increase of 41.1 per cent from 2017-18. The variation in capital expenditure in 2017-18 and 2018-19 largely reflects changed expenditure profiles to align with updated project delivery schedules. General government sector capital expenditure is expected to be $65.7 billion over the four years to 2021-22.
General government capital expenditure in the 2018-19 Budget has increased by $9.1 billion over four years (to 2021-22) compared to the four years to 2020-21 estimated in the 2017-18 Half-Yearly Review. This increase is primarily driven by new policy measures including new investments in the transport sector and recognising the forecast impact of spending $5.4 billion reserved in Restart NSW over the four years to 2021-22.
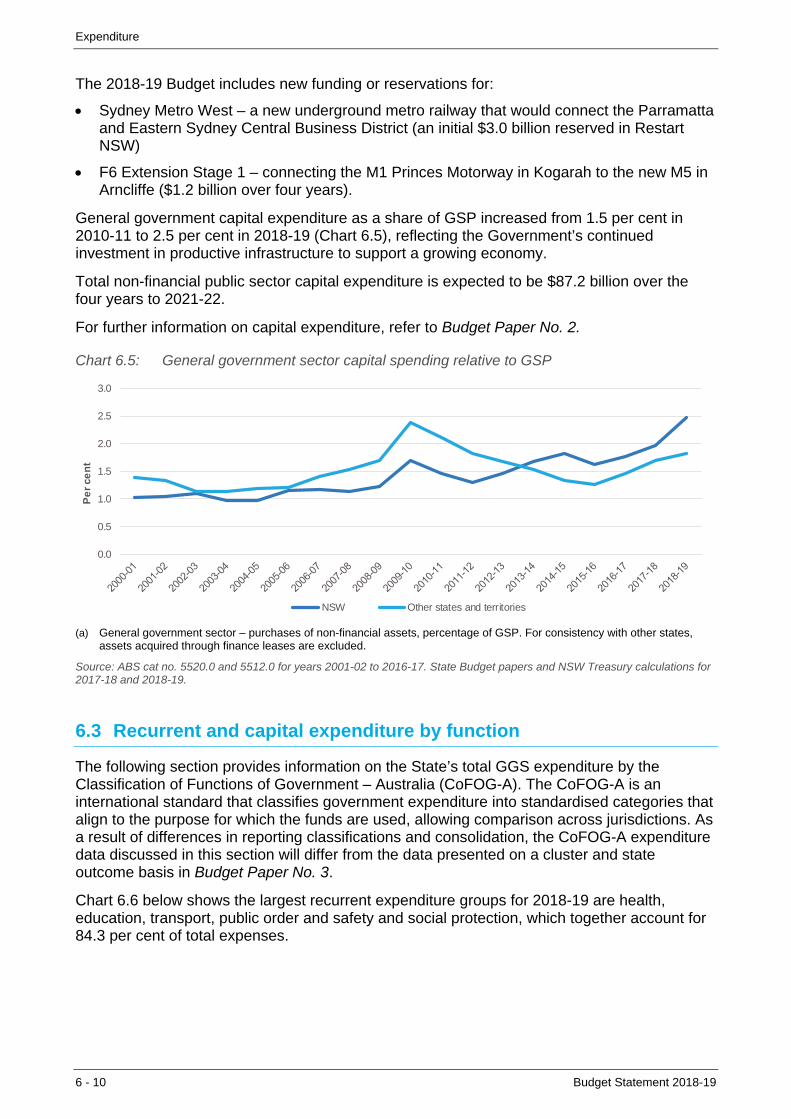
Expenditure
6 - 10 Budget Statement 2018-19
The 2018-19 Budget includes new funding or reservations for:
Sydney Metro West – a new underground metro railway that would connect the Parramatta and Eastern Sydney Central Business District (an initial $3.0 billion reserved in Restart NSW)
F6 Extension Stage 1 – connecting the M1 Princes Motorway in Kogarah to the new M5 in Arncliffe ($1.2 billion over four years).
General government capital expenditure as a share of GSP increased from 1.5 per cent in 2010-11 to 2.5 per cent in 2018-19 (Chart 6.5), reflecting the Government’s continued investment in productive infrastructure to support a growing economy.
Total non-financial public sector capital expenditure is expected to be $87.2 billion over the four years to 2021-22.
For further information on capital expenditure, refer to Budget Paper No. 2.
Chart 6.5: General government sector capital spending relative to GSP
0.0
0.5
1.0
1.5
2.0
2.5
3.0
Pe
r ce
nt
NSW Other states and territories
(a) General government sector – purchases of non-financial assets, percentage of GSP. For consistency with other states, assets acquired through finance leases are excluded.
Source: ABS cat no. 5520.0 and 5512.0 for years 2001-02 to 2016-17. State Budget papers and NSW Treasury calculations for 2017-18 and 2018-19.
6.3 Recurrent and capital expenditure by function
The following section provides information on the State’s total GGS expenditure by the Classification of Functions of Government – Australia (CoFOG-A). The CoFOG-A is an international standard that classifies government expenditure into standardised categories that align to the purpose for which the funds are used, allowing comparison across jurisdictions. As a result of differences in reporting classifications and consolidation, the CoFOG-A expenditure data discussed in this section will differ from the data presented on a cluster and state outcome basis in Budget Paper No. 3.
Chart 6.6 below shows the largest recurrent expenditure groups for 2018-19 are health, education, transport, public order and safety and social protection, which together account for 84.3 per cent of total expenses.
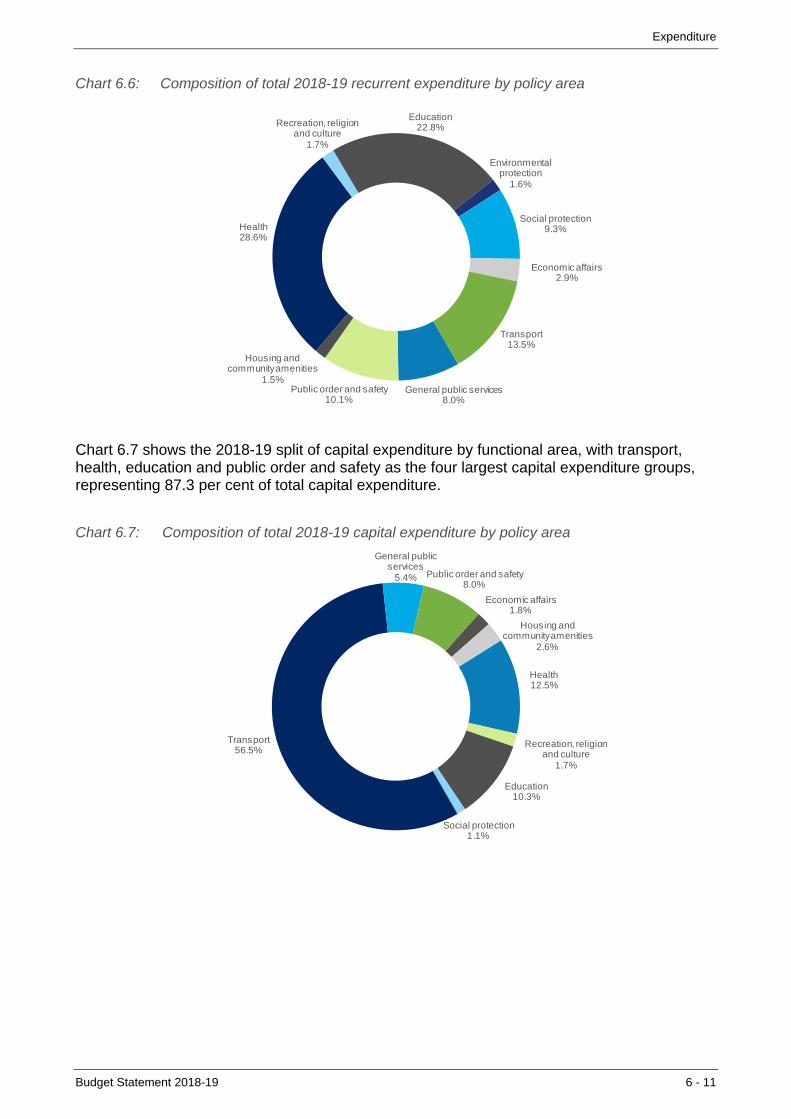
Expenditure
Budget Statement 2018-19 6 - 11
Chart 6.6: Composition of total 2018-19 recurrent expenditure by policy area
General public services8.0%
Public order and safety10.1%
Housing and community amenities
1.5%
Health28.6%
Recreation, religion and culture
1.7%
Education22.8%
Environmental protection
1.6%
Social protection9.3%
Economic affairs2.9%
Transport13.5%
Chart 6.7 shows the 2018-19 split of capital expenditure by functional area, with transport, health, education and public order and safety as the four largest capital expenditure groups, representing 87.3 per cent of total capital expenditure.
Chart 6.7: Composition of total 2018-19 capital expenditure by policy area
Transport56.5%
General public services
5.4% Public order and safety8.0%
Economic affairs1.8%
Housing and community amenities
2.6%
Health12.5%
Recreation, religion and culture
1.7%
Education10.3%
Social protection1.1%
Expenditure
6 - 12 Budget Statement 2018-19
Health
Recurrent health expenses for 2018-19 are expected to be $22.8 billion, representing 28.6 per cent of total expenses. This spending delivers improved service levels in hospitals, ambulance and emergency services and enhanced patient services to get the best health outcomes for the people of New South Wales.
The 2018-19 Budget is investing in a range of health measures, including additional support for new parents and their children, investment in medical research, increased numbers of paramedics and ambulance call centre staff, mental health reform, and additional drug and alcohol services.
Capital expenditure for health in 2018-19 is $2.2 billion, or 12.5 per cent of total 2018-19 GGS capital expenditure.
This will provide for significant upgrades to facilities in metropolitan areas, including critical upgrades to meet demand in growth areas. New works include redeveloping the Liverpool Health and Academic Precinct, $35.0 million for the Griffith Hospital Redevelopment Stage 1, $25.0 million for the Bankstown-Lidcombe Hospital (emergency department) and $11.5 million for refurbishing birthing suites and theatres at St George Hospital.
Major health capital investment is also being made across rural and regional areas (see Box 6.3).
Box 6.3: Supporting rural and regional health infrastructure
The Government continues to support greater access to quality healthcare in rural and regional communities. Over $2.3 billion in recurrent and capital expenditure has been earmarked in the 2018-19 Budget for the Health capital program. This is part of more than $8 billion being invested over four years to continue major capital upgrades, redevelopments and construction of new health facilities.
New 2018-19 projects for rural and regional communities include:
• the State-wide Mental Health Program, to improve the quality of care for people living with mental illness and better support their families and carers. This will provide specialist beds to enable the whole-of-government reform of mental health care and will enable more care to be delivered in the community rather than in hospitals
• Griffith Hospital Redevelopment Stage 1
• Western Cancer Care Centre Dubbo, jointly funded with the Commonwealth Government, delivering an integrated cancer diagnostic and treatment service
• Expanding the scope of hospital redevelopments underway at Grafton, Inverell, Manning, Coffs Harbour, Cooma and Bowral
• Rural Health Infrastructure Program, which will provide hospital upgrades at Tenterfield, Dungog, Scone and Gloucester
• Port Macquarie Hospital car park and Wyong Hospital car park
• Planning for future new works at John Hunter, Albury Hospital medical care and obstetric and neonatal services, Shoalhaven (Nowra) and Goulburn ambulatory care.
Expenditure
Budget Statement 2018-19 6 - 13
Education
Budgeted expenses for education in 2018-19 are expected to be $18.1 billion, or 22.8 per cent of total recurrent expenses. Expenses in the education sector include the Government’s continued investment in pre-primary, primary and secondary education, technical and tertiary education, as well as expenses to empower Aboriginal communities and equip teachers with the best skills to teach our young people.
Government expenditure in pre-primary, primary and secondary education is $12.6 billion, including significant new expenditure towards early childhood education (see Box 6.4). Expenditure on tertiary, technical and further education is $2.1 billion in 2018-19, including 100,000 fee-free apprenticeships under Smart and Skilled to improve the take up of apprenticeships.
Education capital expenditure for 2018-19 is expected to be $1.8 billion, representing 10.3 per cent of total capital GGS expenditure.
Capital investment in the 2018-19 Budget will build on a record schools infrastructure program, with works on over 40 new and upgraded school projects and planning for over 20 new and upgraded schools to begin in 2018-19. The Government has also committed $500.0 million over five years from 2018-19 to enhance the quality and comfort of indoor learning spaces through the rollout of reverse cycle air-conditioning and improved ventilation in government schools.
Box 6.4: Investing in early childhood education
Research shows that children who participate in a quality early childhood education program are more likely to arrive at school equipped with the social, cognitive and emotional skills necessary to engage in learning, with lifelong benefits.
To ensure all children in New South Wales get the best start in life, the Government is investing an additional $197.8 million over four years to expand and strengthen the Start Strong program for early childhood education. This will ease the cost pressures faced by families and enable greater access to a quality early childhood education.
This additional investment will:
• assist in reducing cost pressures for over 38,000 children attending community preschools who currently benefit from Start Strong subsidies
• expand universal access to the Start Strong program for 3-year olds, making New South Wales the first State in Australia to do so, allowing an additional 6,500 children to access Start Strong subsidies in 2019
• provide $42.1 million in capital grants to support the creation of around 4,800 new enrolment places, primarily in areas with a current undersupply of community preschools.
Expenditure
6 - 14 Budget Statement 2018-19
Transport
Recurrent 2018-19 expenditure on transport forms 13.5 per cent of total 2018-19 expenditure and totals $10.7 billion. This reflects the Government’s focus on delivering a safe and reliable travel system that connects regional and metropolitan areas and supports a growing economy and population.
The Government has committed significant recurrent expenditure in 2018-19 towards improved public transport services and infrastructure. This includes $648.2 million invested in the More Trains, More Services program (see Box 6.1).
Capital expenditure on transport in 2018-19 is forecast to be $9.8 billion, or 56.5 per cent of total capital expenditure and contributes to continuing investment for accessible and future ready transport infrastructure projects, such as:
$3.0 billion over four years for the planning and implementation of Sydney Metro West, a new metro railway that would connect the Parramatta and Eastern Sydney Central Business District (Restart NSW reservation)
$1.2 billion additional funding over four years to progress stage one of the F6 Extension, extending the M1 Motorway from Arncliffe to Kogarah
$1.2 billion to continue the New South Wales and Commonwealth funded Pacific Highway upgrade program, including continuing construction between Woolgoolga and Ballina and planning for the Coffs Harbour bypass
$556.2 million over four years for planning and early works for the Western Harbour Tunnel and Beaches Link.
Box 6.5: Improving public transport accessibility
The Government is supporting increased equity and accessibility within the transport system, by committing almost $1 billion in 2018-19 to provide more choice for people with mobility constraints and better connections to places of employment, education, business and enjoyment. Key initiatives include:
• $133 million for lifts and escalators that provide greater access to train stations and wharves. This will enhance accessibility for those with a disability or those carrying prams and luggage
• $87 million for Community Transport and Home and Community Care services to assist people who have difficulties accessing transport
• $15 million to install lifts on the north and south ends of the eastern walkway of the Sydney Harbour Bridge. The new lifts will allow access to the walkway by those who are mobility impaired including people with a disability, prams or people who have difficulty climbing stairs.
In addition, the Government is continuing to support affordable access to public transport with $1.2 billion in 2018-19 in public transport concessions, including concessions for pensioners, seniors, people with disabilities and the school student transport scheme.

Expenditure
Budget Statement 2018-19 6 - 15
Public order and safety
Police, civil and fire protection services, prisons and law courts all operate to create safer communities and ensure the effective functioning of New South Wales’ justice system.
Recurrent expenditure on public order and safety in 2018-19 is expected to be $8.0 billion, making up 10.1 per cent of total recurrent expenditure.
Spending on police services and law courts is expected to be $4.9 billion in 2018-19. This expenditure contributes towards reducing violent crime, breaking the cycle of reoffending, improving road safety, as well the effective administration of law courts, tribunals and the delivery of legal services.
This includes $288.2 million over four years to support the re-engineering of the NSW Police Force, providing greater flexibility and resources to effectively address and respond to crime.
Capital spending on public order and safety is forecast to be $1.4 billion, or 8.0 per cent of total 2018-19 capital expenditure. This expenditure is primarily relates to the ongoing implementation of the Prison Bed Capacity Program and police station redevelopments across regional and metropolitan New South Wales.
Box 6.6: Continuing to protect against terrorism
The Government continues to make substantial new investments to safeguard the community against terrorism and reduce the risk of violent extremism, including:
• $89.3 million over four years to enable post-sentence detention in a correctional centre or supervision in the community of offenders who pose a high risk of committing a terrorism offence
• $52.6 million over four years to implement the National Facial Biometric Matching Capability in New South Wales, increasing the capability to identify suspects or victims of terrorist or other criminal activity
• $36.2 million over two years to maximise protection for staff and the public at the Sydney Opera House
• $5.5 million in 2018-19 to maintain counter terrorism security at New South Wales courts
• $4.9 million in 2018-19 for the protection of critical transport infrastructure and public assets from acts of terror
• $2.9 million over four years to support additional security measures for public events delivered by the Premier’s department
• $1.6 million over two years for a specialist Countering Violent Extremism Team within the Juvenile Justice system to identify and manage radicalised youths, or those at risk of radicalisation.

Expenditure
6 - 16 Budget Statement 2018-19
Social protection
The 2018-19 Budget includes $7.4 billion to help protect the vulnerable, break disadvantage and support people with disability, representing 9.3 per cent of total GGS expenditure. Additional investment in the 2018-19 Budget continues to support clients in the transition to the NDIS, reduce homelessness and improve the child protection system.
Box 6.7: Social protection initiatives – caseworkers
Every child deserves a safe and permanent home where they can develop strong, loving relationships and a sense of belonging that gives them the very best start in life. To support this, the Government is investing an additional $59.1 million over four years in the NSW statutory child protection system, including 100 new workers to ensure more children are supported through the child protection system and investment over the next two years to help achieve the goal of more than 1,000 open adoptions over the next four years.
These investments build on the $63 million over four years provided in the 2017-18 Budget to improve child protection casework practice.
Housing and community amenities
The Government will spend an estimated $1.2 billion in 2018-19 on housing and community amenities, reflecting its priority to create strong and vibrant communities, enhance environmental protection, ensure energy and water security and improve liveability (see Box 6.8).
Box 6.8: Creating green places and open spaces
The Government is improving liveability for communities across New South Wales, allocating $287.5 million over five years from 2018-19 towards expanding and enhancing open spaces and parklands, including:
• $100 million for the acquisition of green and open space for public use across the Greater Sydney region
• the $100 million Greater Sydney Sports Facility Fund, reserved from Restart NSW, to develop or upgrade local sports facilities, including ovals, dressing rooms, kiosks, and equipment to assist families and children in living healthier lifestyles
• $37.5 million to partner with communities, councils and businesses to increase the average tree canopy across Sydney, by planting an extra five million native trees
• the $30 million Share our Space program, opening more than 80 public schools to the public throughout school holidays to encourage greater use of school facilities such as playgrounds, ovals and sport courts
• the $20 million Everyone Can Play in NSW program, reserved from Restart NSW, creating inclusive and engaging play spaces for children.

Expenditure
Budget Statement 2018-19 6 - 17
6.4 Recurrent expense measures statement
The Government continues to invest in services and projects for communities across regions and cities of New South Wales, aimed at improving the lives of residents.
Table 6.5 shows the impact of new policy measures by cluster. The table displays the expense impact of these measures, and does not include associated revenue or capital expenditure.
Table 6.5: New recurrent policy measures since the 2017-18 Half-Yearly Review by Cluster (a)(b)
2018-19 2019-20 2020-21 2021-22 Four yearDescription of major initiatives Budget Forward estimates Total
$m $m $m $m $m
Education 88.7 92.9 109.8 149.6 441.0 Supporting greater access and eligibility to early childhood education under the Start Strong program.
Introduction of a Creative Kids Rebate to support New South Wales school-aged children access structured creative and cultural activities.
Additional placements for Indigenous students in the Clontarf Foundation school-based mentoring program, supporting at risk students to fully engage in schooling and reach their potential.
Establishment of the Aboriginal Languages Trust.
Family and Community Services
233.3 204.8 189.8 203.1 831.0 Supporting people with a disability in the NDIS and the transition of services to the non-government sector.
Implementation of the NSW Homelessness Strategy.
Additional investment in the child protection system, including more caseworkers and the continuation of the Adoptions Taskforce.
Aboriginal Social Housing Strategy to deliver innovative new housing solutions and support for Aboriginal people and build the Aboriginal Community Housing sector.
Finance, Services and Innovation
55.5 131.3 56.1 67.6 310.6 Additional funding towards the Critical Communication Enhancement Program, aiding in the delivery of emergency, law enforcement and essential community services.
Boosting the NSW Government’s capability and preparedness against cyber security threats.
Funding to launch a cost of living service – a tailored one-stop-shop aimed at reducing cost pressures for citizens by promoting rebates and initiatives across the NSW Government.
Health 529.7 267.9 173.7 145.5 1,116.8 Protecting and improving the wellbeing of new parents and their babies through a new parents’ package.
Employing an additional 200 paramedics and 13 ambulance call centre staff, as well as additional funding to support the rollout of the Critical Communications Enhancement Program.
Investing in medical research to help fight diseases and keep our community healthier longer, including funding for cardiovascular disease and paediatric precision medicine.
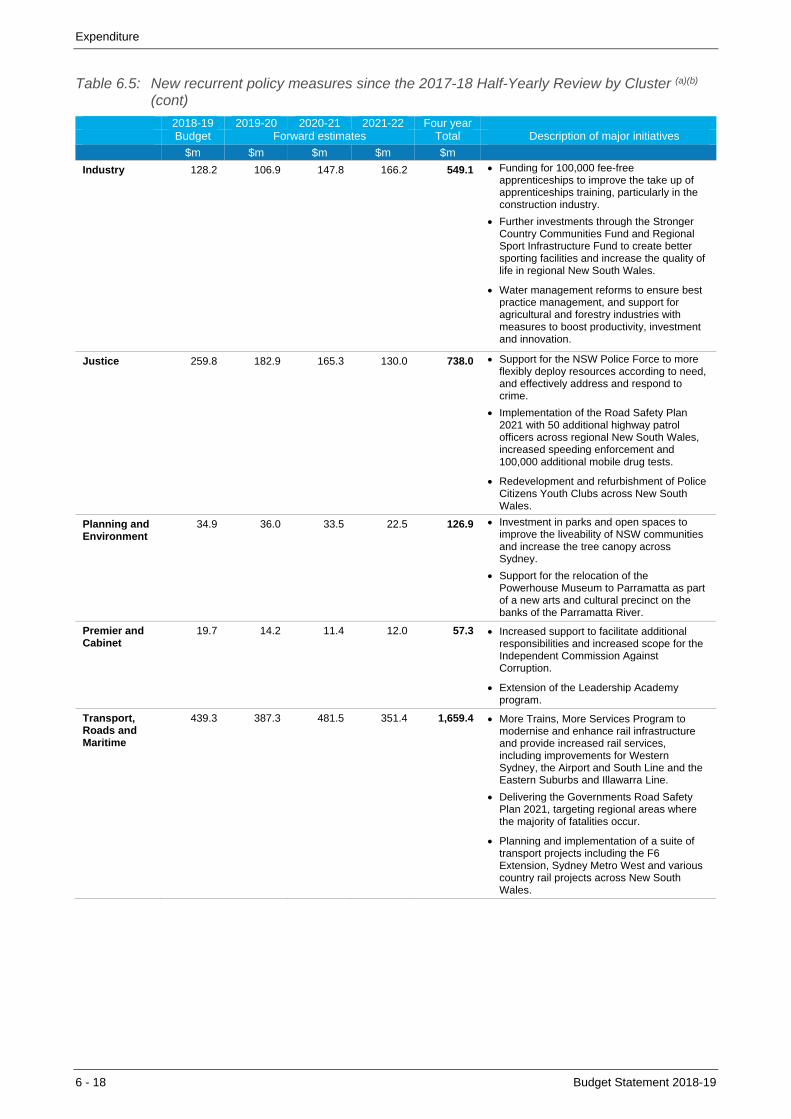
Expenditure
6 - 18 Budget Statement 2018-19
Table 6.5: New recurrent policy measures since the 2017-18 Half-Yearly Review by Cluster (a)(b)
(cont)
2018-19 2019-20 2020-21 2021-22 Four year Budget Forward estimates Total Description of major initiatives
$m $m $m $m $m
Industry 128.2 106.9 147.8 166.2 549.1 Funding for 100,000 fee-free apprenticeships to improve the take up of apprenticeships training, particularly in the construction industry.
Further investments through the Stronger Country Communities Fund and Regional Sport Infrastructure Fund to create better sporting facilities and increase the quality of life in regional New South Wales.
Water management reforms to ensure best practice management, and support for agricultural and forestry industries with measures to boost productivity, investment and innovation.
Justice 259.8 182.9 165.3 130.0 738.0 Support for the NSW Police Force to more flexibly deploy resources according to need, and effectively address and respond to crime.
Implementation of the Road Safety Plan 2021 with 50 additional highway patrol officers across regional New South Wales, increased speeding enforcement and 100,000 additional mobile drug tests.
Redevelopment and refurbishment of Police Citizens Youth Clubs across New South Wales.
Planning and Environment
34.9 36.0 33.5 22.5 126.9 Investment in parks and open spaces to improve the liveability of NSW communities and increase the tree canopy across Sydney.
Support for the relocation of the Powerhouse Museum to Parramatta as part of a new arts and cultural precinct on the banks of the Parramatta River.
Premier and Cabinet
19.7 14.2 11.4 12.0 57.3 Increased support to facilitate additional responsibilities and increased scope for the Independent Commission Against Corruption.
Extension of the Leadership Academy program.
Transport, Roads and Maritime
439.3 387.3 481.5 351.4 1,659.4 More Trains, More Services Program to modernise and enhance rail infrastructure and provide increased rail services, including improvements for Western Sydney, the Airport and South Line and the Eastern Suburbs and Illawarra Line.
Delivering the Governments Road Safety Plan 2021, targeting regional areas where the majority of fatalities occur.
Planning and implementation of a suite of transport projects including the F6 Extension, Sydney Metro West and various country rail projects across New South Wales.

Expenditure
Budget Statement 2018-19 6 - 19
Table 6.5: New recurrent policy measures since the 2017-18 Half-Yearly Review by Cluster (a (b)
(cont)
2018-19 2019-20 2020-21 2021-22 Four year Budget Forward estimates Total Description of major initiatives
$m $m $m $m $m
Treasury 251.8 (207.3) 48.3 71.9 164.7 Establishing a Productivity Commission focused on making it easier to do business, lowering the cost of living, housing affordability and making New South Wales the easiest state to move to.
Restart NSW grants to local governments, community organisations and other sectors.
Funding community investments to improve wellbeing through My Community Dividend, with local communities to vote on preferred projects.
Other (35.0) (24.1) (34.2) (43.1) (136.4) This reflects whole-of-government measures and items that cannot be attributed to an individual cluster, as well as the transfer of Restart NSW commitments into agency budgets.
Savings and Offsets
Whole-of-Government
(139.3) (275.1) (408.0) (802.7) (1,625.2) Increase of the efficiency dividend, targeting back office savings and productivity.
Agency Specific
(37.6) (85.3) (117.3) (190.5) (430.7) Agency specific savings and efficiency measures.
(a) A positive figure increases expenses, a negative figure decreases expenses (b) These figures represent the net expense impact for new policy measures

Budget Statement 2018-19 7 - 1
7. MANAGING THE STATE’S ASSETS AND LIABILITIES
New South Wales’ net worth has surpassed a quarter of a trillion dollars, a year earlier than expected. Net worth is expected to be $261.1 billion at June 2018, rising to $305.9 billion by June 2022, the highest of all Australian states.
Growth in the State’s net worth has been supported by the Government investing operating surpluses and asset recycling proceeds into new infrastructure, including rail, roads, hospitals and schools across the NSW community.
Reflecting the Government’s succesful asset recycling program, funds invested in the New South Wales Infrastructure Future Fund (NIFF) have reached a new high of $19.3 billion, delivering returns of 6.3 per cent per annum since its inception. Non-financial assets are projected to grow to $269.1 billion by June 2022 as the NIFF is reinvested along with operating surpluses, and modest borrowings into infrastructure.
Net debt in the general government sector (GGS) is expected to be negative for the third consecutive year and is projected to reach negative $9.8 billion at June 2018.
New South Wales’ net debt is at a historic low of negative 1.6 per cent of GSP at June 2018 – lower than all other mainland states.
The 2018-19 Budget continues the implementation of the Government’s balance sheet reform agenda. This agenda will support the State’s triple-A credit rating and optimise the use of the State’s assets and liabilities.
7.1 Reforming the State’s balance sheet
The Government continues to implement its financial reform agenda to promote greater balance sheet resilience and enhance the State’s management of financial risk. Progress on key reforms include:
establishing the NSW Generations Fund to help maintain debt at sustainable levels to support the principles of the Fiscal Responsibility Act 2012 (FRA)
continuing to seek best practice advice from the Asset and Liability Committee (ALCO) on balance sheet management (see Box 7.1)
improvements in financial risk management, including a new whole-of-government Foreign Exchange (FX) risk policy to manage currency exposure when government agencies and businesses buy or sell goods and services to or from overseas. This policy has been developed and implemented in partnership with NSW Treasury Corporation (TCorp)
further cash management reforms, including internalisation of up to an additional $2.0 billion in cash balances over the four years to June 2022, building upon $3.0 billion in cash centralised to date.

Managing the State’s Assets and Liabilities
7 - 2 Budget Statement 2018-19
NSW Generations Fund
The NSW Generations Fund (NGF) will be established in 2018 to support intergenerational equity and promote New South Wales as a leader in participatory budgeting and community engagement. The NGF supports the FRA and will help maintain the State’s triple-A credit rating.
The NGF is a long-term fund that will grow over time to support debt retirement and provide capacity to fund community-focused initiatives.
The Government will seed the NGF with an initial $3.0 billion from balance sheet reserves. The future minority interest in WestConnex will be deposited in the NGF, once the transaction is complete.
This reflects a continuation of the Government’s approach to sustainable balance sheet management, by utilising the strength of the State’s fiscal position to deliver greater benefit to NSW communities now and into the future.
Overview of key changes in 2017-18 since the 2017-18 Half-Yearly Review (HYR)
Since the 2017-18 HYR (see Table 7.1), key balance sheet movements include:
a decrease in estimated net debt at June 2018 from negative $2.9 billion at the 2017-18 Half-Yearly Review to an estimated negative $9.8 billion in this Budget. The movement in net debt has been driven by the sale of the State’s interests in Snowy Hydro, higher than anticipated cash balances from cash management reforms and strong investment returns in the NIFF
an increase in estimated net worth at June 2018 from $247.6 billion at the 2017-18 Half-Yearly Review to an estimated $261.1 billion in this Budget, driven primarily by growth in the State’s assets while liabilities have remained broadly constant.
Key balance sheet aggregates of the GGS
June 2017 June 2018 June 2018 June 2019 June 2020 June 2021 June 2022
Actual HYR Revised Budget Forward Estimates
Total Assets ($m) 354,358 368,783 382,900 389,648 403,757 419,402 431,576
Financial Assets ($m) 169,315 166,575 171,320 162,920 160,600 161,958 162,440
Non-Financial Assets ($m) 185,043 202,209 211,580 226,728 243,157 257,443 269,136
Total Liabilities ($m) 127,887 121,192 121,825 119,521 122,461 125,419 125,700
Net Worth ($m) 226,471 247,591 261,075 270,127 281,296 293,983 305,876
Net Worth as a per cent of GSP 39.3 40.9 43.1 42.9 42.8 42.6 42.2
Net Debt ($m) (9,344) (2,935) (9,797) 2,559 14,133 22,207 28,660
Net Debt as a per cent of GSP (1.6) (0.5) (1.6) 0.4 2.1 3.2 4.0
Managing the State’s Assets and Liabilities
Budget Statement 2018-19 7 - 3
Box 7.1: Asset and Liability Committee drives balance sheet reform
The NSW Government’s creation of a whole-of-government Asset and Liability Committee (ALCO) in 2015 was a world first for government. ALCO provides best-practice advice to the Treasury Secretary on managing the State’s balance sheet.
ALCO uses a whole-of-government view to form its advice, with the goals of maintaining New South Wales’ triple-A credit rating, monitoring the State’s Significant Financial Risks, and ensuring the integrity of the State’s reputation.
During 2017-18, ALCO recommended a number of policy actions and frameworks to help manage the State’s financial risks and opportunities. These include:
expanding the scope of ongoing cash management reforms to provide the State with a whole-of-government view on the use of surplus funds. Approximately $3.0 billion has been brought under centralised management to date
endorsing a new whole-of-government Foreign Exchange (FX) Risk Policy (to take effect on 1 July 2018) to provide a cost-efficient arrangement for managing the State’s FX risk, with significant estimated savings
expanding the strategic management of the State’s debt portfolio to guard against potential interest rate rises and to reduce interest costs where possible, including extending the average weighted life of the GGS debt portfolio towards eight years
endorsing the establishment of a ‘sustainability bond’ program to further diversify and expand the State’s bond investor base and to raise awareness of the Government’s social and environmental initiatives.
ALCO will continue exploring opportunities to improve the management of the State’s assets and liabilities to ensure balance sheet and fiscal risks are managed in a strong and disciplined manner.
7.2 Net debt
New South Wales’ net debt remains at record low levels, driven primarily by the Government’s successful asset recycling transactions.
The projection for net debt at June 2018 is negative $9.8 billion. The State is to receive $4.2 billion from the divestment of its share of Snowy Hydro to the Commonwealth Government, which has largely offset increased infrastructure spending in 2017-18 and kept GGS net debt at broadly the same level as at June 2017.
Net debt is projected to reach $28.7 billion by June 2022 as the State implements its record infrastructure program by using its strong budget surpluses, drawing down on asset recycling proceeds and modestly increasing its borrowings (see Chart 7.1).
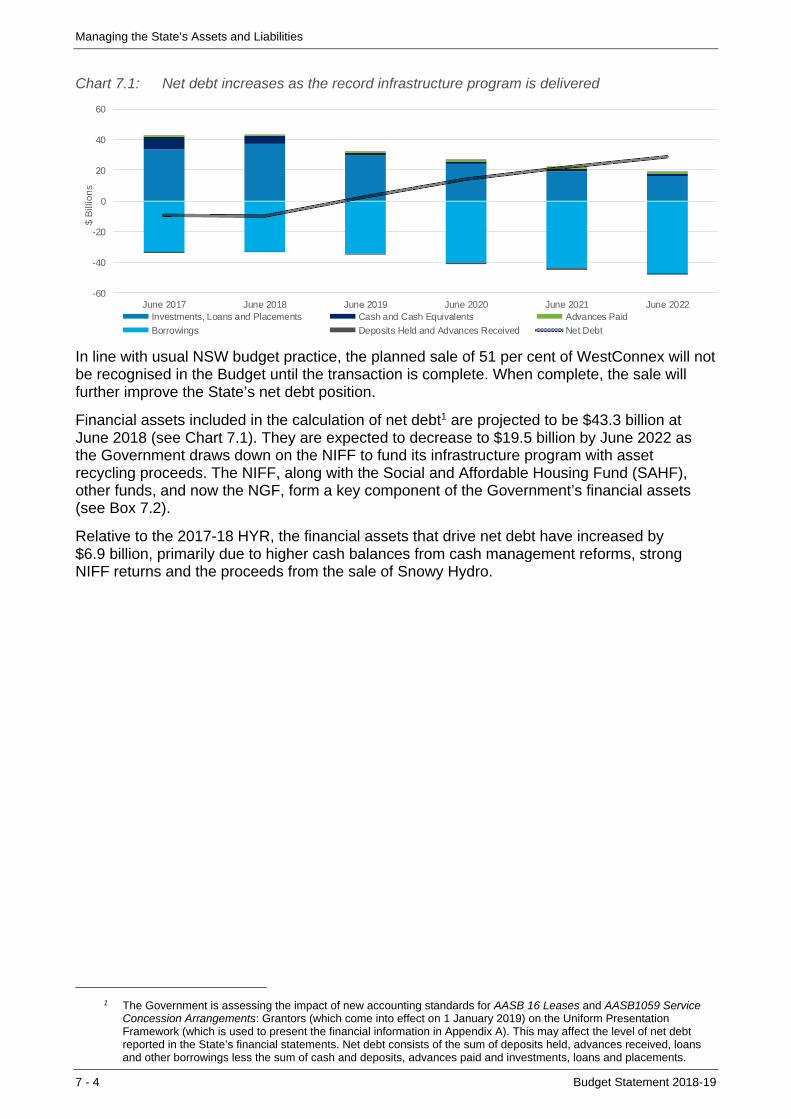
Managing the State’s Assets and Liabilities
7 - 4 Budget Statement 2018-19
Chart 7.1: Net debt increases as the record infrastructure program is delivered
-60
-40
-20
0
20
40
60
June 2017 June 2018 June 2019 June 2020 June 2021 June 2022
$ B
illio
ns
Investments, Loans and Placements Cash and Cash Equivalents Advances Paid
Borrowings Deposits Held and Advances Received Net Debt
In line with usual NSW budget practice, the planned sale of 51 per cent of WestConnex will not be recognised in the Budget until the transaction is complete. When complete, the sale will further improve the State’s net debt position.
Financial assets included in the calculation of net debt1 are projected to be $43.3 billion at June 2018 (see Chart 7.1). They are expected to decrease to $19.5 billion by June 2022 as the Government draws down on the NIFF to fund its infrastructure program with asset recycling proceeds. The NIFF, along with the Social and Affordable Housing Fund (SAHF), other funds, and now the NGF, form a key component of the Government’s financial assets (see Box 7.2).
Relative to the 2017-18 HYR, the financial assets that drive net debt have increased by $6.9 billion, primarily due to higher cash balances from cash management reforms, strong NIFF returns and the proceeds from the sale of Snowy Hydro.
1 The Government is assessing the impact of new accounting standards for AASB 16 Leases and AASB1059 Service
Concession Arrangements: Grantors (which come into effect on 1 January 2019) on the Uniform Presentation Framework (which is used to present the financial information in Appendix A). This may affect the level of net debt reported in the State’s financial statements. Net debt consists of the sum of deposits held, advances received, loans and other borrowings less the sum of cash and deposits, advances paid and investments, loans and placements.

Managing the State’s Assets and Liabilities
Budget Statement 2018-19 7 - 5
Box 7.2: Active management of the State’s financial assets – NIFF and SAHF
New South Wales Infrastructure Future Fund (NIFF)
The NIFF was established by the NSW Government in December 2016 as a vehicle to invest the net proceeds from the State’s asset recycling program, making it the single largest holding of the State’s financial investments. The NIFF is managed by TCorp, to deliver superior returns to the Government’s cash portfolio and match investment maturities with expected infrastructure expenditure profiles.
The NIFF had a balance of approximately $19.3 billion as at 31 May 2018, having made a return of 6.3 per cent per annum since its inception. Returns from the NIFF help support the budget result, but are also a source of volatility across the forward estimates.
Investments within the NIFF are managed to align with the required spending profiles of critical infrastructure projects that form part of the Restart NSW and Rebuilding NSW programs. To date, $9.8 billion of Restart projects have been funded, while an additional $5.1 billion has been forecast for funding in 2018-19 (see Chapter 3 of the Infrastructure Statement).
Social and Affordable Housing Fund (SAHF)
The Government also established the SAHF in August 2017 to provide more housing for vulnerable people across the State, with coordinated access to tailored support. The SAHF had a balance of approximately $1.2 billion as at 31 May 2018, having made a return of 6.9 per cent per annum since its inception.
TCorp actively manages the SAHF through an investment trust, with the aim of maximising the volume of housing that can be provided. ALCO’s oversight of the investments of the SAHF ensures it invests carefully, in recognition of the importance of maintaining funding certainty for new social and affordable housing stock.
Liabilities included in the calculation of net debt (see Table 7.2) are projected to be $33.5 billion at June 2018, broadly in line with 2017-18 HYR estimates. Over the four years to June 2022, these liabilities are projected to increase to $48.2 billion, driven by increased borrowings and the inclusion of finance leases for Sydney CBD Light Rail and Sydney Metro Northwest on the balance sheet.
The Government has lengthened the average weighted maturity profile of its debt portfolio to eight years, which reduces liquidity and refinancing risk by better matching liabilities with the infrastructure assets they are funding. This also enables the Government to leverage its triple-A credit rating to secure relatively low-cost debt in the current low-interest rate environment.
7.3 Net worth
GGS net worth is expected to be $261.1 billion at June 2018 (see Chart 7.2), and is projected to be $305.9 billion by June 2022; the highest of all States and Territories (see Chart 7.3)2. Net worth at June 2018 is estimated to have increased by $13.5 billion relative to the estimate contained in the 2017-18 HYR, due primarily to the reinvestment of net operating cash in the Government’s record infrastructure program, asset recycling and asset revaluations.
2 Net worth measures the overall wealth of the State and is calculated by taking the difference between total assets and
total liabilities.
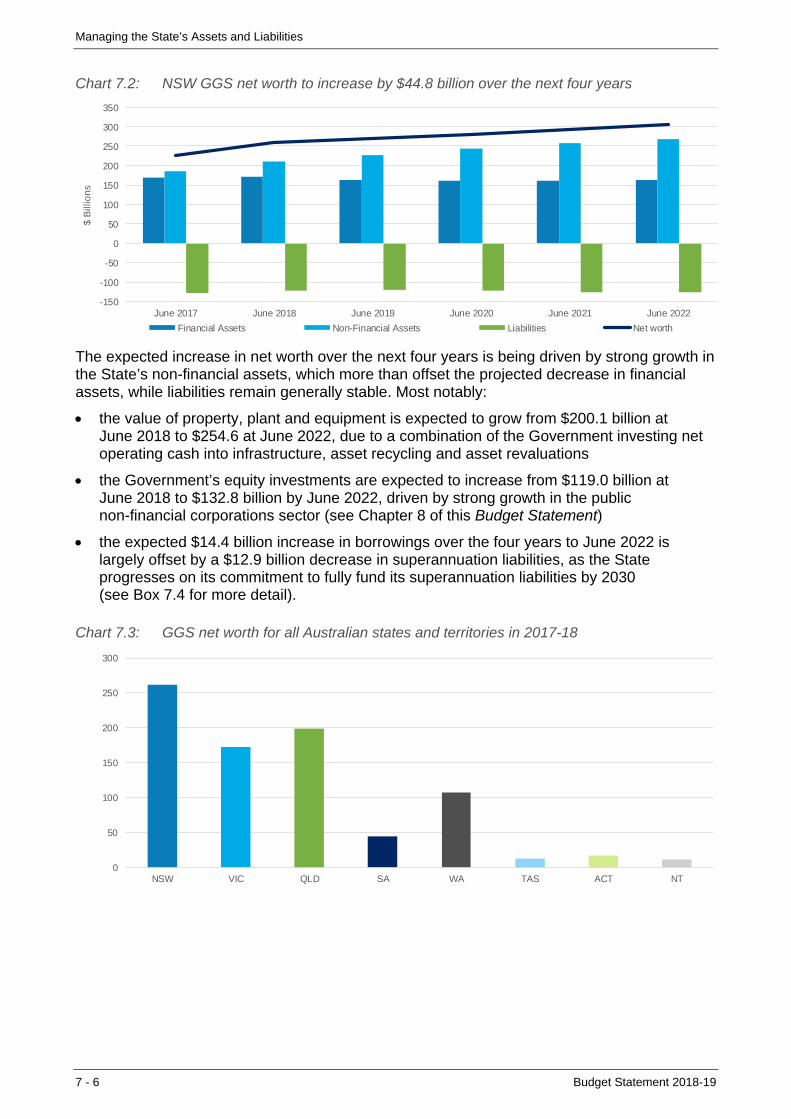
Managing the State’s Assets and Liabilities
7 - 6 Budget Statement 2018-19
Chart 7.2: NSW GGS net worth to increase by $44.8 billion over the next four years
-150
-100
-50
0
50
100
150
200
250
300
350
June 2017 June 2018 June 2019 June 2020 June 2021 June 2022
$ B
illio
ns
Financial Assets Non-Financial Assets Liabilities Net worth
The expected increase in net worth over the next four years is being driven by strong growth in the State’s non-financial assets, which more than offset the projected decrease in financial assets, while liabilities remain generally stable. Most notably:
the value of property, plant and equipment is expected to grow from $200.1 billion at June 2018 to $254.6 at June 2022, due to a combination of the Government investing net operating cash into infrastructure, asset recycling and asset revaluations
the Government’s equity investments are expected to increase from $119.0 billion at June 2018 to $132.8 billion by June 2022, driven by strong growth in the public non-financial corporations sector (see Chapter 8 of this Budget Statement)
the expected $14.4 billion increase in borrowings over the four years to June 2022 is largely offset by a $12.9 billion decrease in superannuation liabilities, as the State progresses on its commitment to fully fund its superannuation liabilities by 2030 (see Box 7.4 for more detail).
Chart 7.3: GGS net worth for all Australian states and territories in 2017-18
0
50
100
150
200
250
300
NSW VIC QLD SA WA TAS ACT NT

Managing the State’s Assets and Liabilities
Budget Statement 2018-19 7 - 7
Financial assets
The State’s total financial assets are projected to be $171.3 billion at June 2018, decreasing to $162.4 billion by June 2022 (see Chart 7.4). Growth in the value of the State’s equity investments partially offset expected falls in financial assets at fair value as funds invested in the NIFF are drawn down to deliver the State’s infrastructure program.
Chart 7.4: GGS financial assets reflect asset divestments and cash management reforms
0
20
40
60
80
100
120
140
160
180
June 2017 June 2018 June 2019 June 2020 June 2021 June 2022
$ B
illio
ns
Equity Investments Financial Assets at Fair Value Cash and Cash Equivalents Receivables Other Financial Assets
The State’s equity investments in other public-sector entities increased by $1.9 billion relative to the 2017-18 HYR estimate, and combined with cash management reforms and strong NIFF returns, has resulted in financial assets at June 2018 increasing by $4.7 billion over this same period.
Non-financial assets
The State’s non-financial assets are projected to be $211.6 billion at June 2018, a $9.4 billion increase relative to the 2017-18 HYR estimate. This figure is expected to increase to $269.1 billion by June 2022, driven primarily by asset revaluations and the Government’s large infrastructure program (see Chart 7.5).
Over the next four years, the largest movement in property, plant and equipment is in infrastructure systems, which are forecast to rise from $105.1 billion at June 2018 to $150.7 billion in June 2022, as the Government invests heavily in public transport infrastructure.
Land and buildings are projected to grow from an expected $84.8 billion at June 2018 to $94.6 billion in June 2022, driven by investment in schools and hospitals, and asset revaluations in the education sector. This growth in land and buildings is happening concurrently to the implementation of the State’s Property Infrastructure Policy (see Box 7.3).
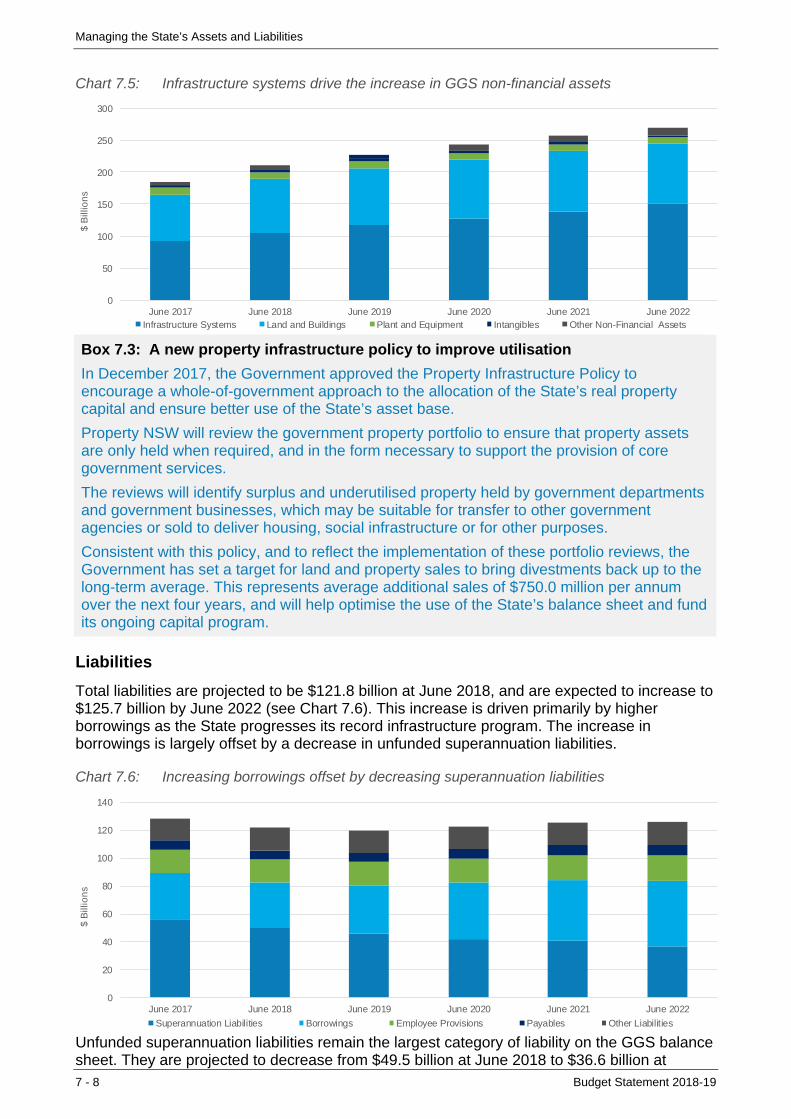
Managing the State’s Assets and Liabilities
7 - 8 Budget Statement 2018-19
Chart 7.5: Infrastructure systems drive the increase in GGS non-financial assets
0
50
100
150
200
250
300
June 2017 June 2018 June 2019 June 2020 June 2021 June 2022
$ B
illio
ns
Infrastructure Systems Land and Buildings Plant and Equipment Intangibles Other Non-Financial Assets
Box 7.3: A new property infrastructure policy to improve utilisation
In December 2017, the Government approved the Property Infrastructure Policy to encourage a whole-of-government approach to the allocation of the State’s real property capital and ensure better use of the State’s asset base.
Property NSW will review the government property portfolio to ensure that property assets are only held when required, and in the form necessary to support the provision of core government services.
The reviews will identify surplus and underutilised property held by government departments and government businesses, which may be suitable for transfer to other government agencies or sold to deliver housing, social infrastructure or for other purposes.
Consistent with this policy, and to reflect the implementation of these portfolio reviews, the Government has set a target for land and property sales to bring divestments back up to the long-term average. This represents average additional sales of $750.0 million per annum over the next four years, and will help optimise the use of the State’s balance sheet and fund its ongoing capital program.
Liabilities
Total liabilities are projected to be $121.8 billion at June 2018, and are expected to increase to $125.7 billion by June 2022 (see Chart 7.6). This increase is driven primarily by higher borrowings as the State progresses its record infrastructure program. The increase in borrowings is largely offset by a decrease in unfunded superannuation liabilities.
Chart 7.6: Increasing borrowings offset by decreasing superannuation liabilities
0
20
40
60
80
100
120
140
June 2017 June 2018 June 2019 June 2020 June 2021 June 2022
$ B
illio
ns
Superannuation Liabilities Borrowings Employee Provisions Payables Other Liabilities Unfunded superannuation liabilities remain the largest category of liability on the GGS balance sheet. They are projected to decrease from $49.5 billion at June 2018 to $36.6 billion at

Managing the State’s Assets and Liabilities
Budget Statement 2018-19 7 - 9
June 2022 as the Government works to eliminate GGS unfunded superannuation liabilities by 2030 (see Box 7.4)3.
Employee provisions, which include long service leave, are the next largest category of liabilities. The GGS is projected to hold $16.8 billion of employee provisions at June 2018, increasing to $18.0 billion by June 2022.
Box 7.4: Funding the State’s superannuation liabilities
The Government remains committed to fully funding its superannuation liabilities by June 2030, consistent with the Fiscal Responsibility Act 2012.
To achieve this, the Government’s long-term funding program involves contributing $1.6 billion in the 2018-19 financial year towards funding the liabilities, with this amount to increase at a rate of five per cent per annum until 2030 (see Chart 7.7).
Chart 7.7: Government superannuation contributions until 2030
0.0
0.5
1.0
1.5
2.0
2.5
3.0
2016-17 2017-18 2018-19 2019-20 2020-21 2021-22 2022-23 2023-24 2024-25 2025-26 2026-27 2027-28 2028-29 2029-30
$ B
illio
ns
Management of the State’s superannuation liability undergoes a triennial review to ensure it is appropriate to meet the 2030 funding target, taking into account demographic changes and economic drivers, such as inflation and investment returns. The 2015 Triennial Review of the State Super schemes stated that the current funding plan appears reasonable to meet this target.
The 2018 Triennial Review into the State’s superannuation liabilities is currently underway. Depending on the outcome of the review, the funding plan may be modified to ensure that the Government remains on track to meet its target.
3 There are two methods for valuing unfunded superannuation liabilities. For reporting purposes, as noted above and
presented in the balance sheet, liabilities are calculated in accordance with AASB 119 Employee Benefits, which requires future payments to be discounted at the Commonwealth Government Securities rate.
For funding purposes, AASB 1056 Superannuation Entities is used, which discounts future payments by the expected long-term return on a fund’s assets, resulting in a more realistic measure of the present value of the liabilities. On this basis, the unfunded liability is expected to be $15.4 billion at June 2018, and is forecast to decrease to $13.8 billion by June 2022.

Budget Statement 2018-19 8 - 1
8. COMMERCIAL PERFORMANCE IN THE BROADER PUBLIC SECTOR
• The broader public sector comprises the total state government in New South Wales and includes the general government sector (GGS), public non-financial corporations (PNFC) sector and public financial corporations (PFC) sector.
• The PNFC and PFC sectors are guided by a Commercial Policy Framework (CPF), which applies private business disciplines to government businesses and supports them to operate efficiently and in consumers’ best interests. The NSW Government continues to align the CPF with best practice.
• The total dividends and tax equivalent payments received by the GGS from the PNFC and PFC sectors in 2017-18 are $1.5 billion, which is $106.5 million lower than estimated at the 2017-18 Budget. This is a result of lower dividends and tax receipts from the energy as well as property and resources sectors.
8.1 Overview of the broader public sector
The broader public sector is made up of entities within the public financial corporations (PFC) sector and non-financial public sector (NFPS). The NFPS is comprised of the general government sector (GGS) and the public non-financial corporations (PNFC) sector:
entities within the GGS are funded mainly by taxation revenue and provide services such as health, education and emergency services
entities within the PNFC sector operate on a more commercial basis and are able to recover most of their costs by charging consumers for services such as transport, water and electricity distribution
the PFC sector provides financial management services to the government and insurance services to the people of New South Wales
entities in the PNFC sector include State Owned Corporations (SOCs) set up under the State Owned Corporations Act 1989 to operate with a greater degree of commerciality and autonomy than entities in the GGS.
A full list of NSW public sector entities according to their classification as a GGS, PNFC or PFC entity is provided at Appendix A3 of this Budget Statement.
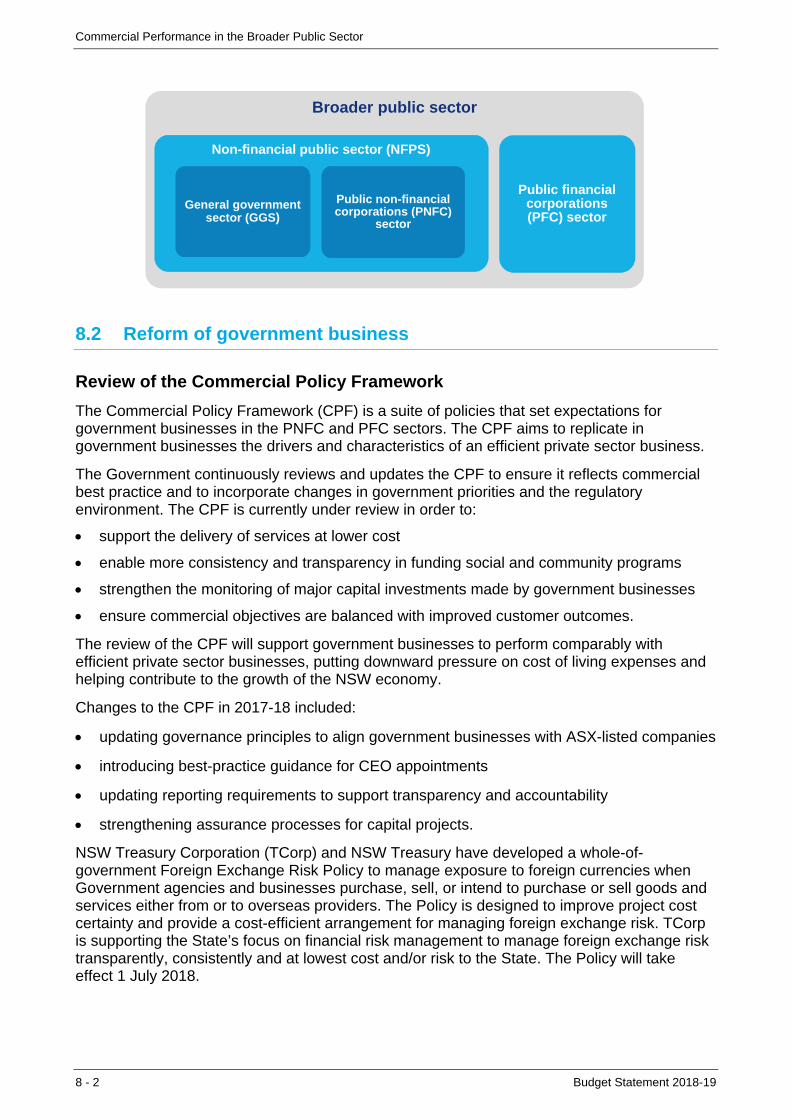
Commercial Performance in the Broader Public Sector
8 - 2 Budget Statement 2018-19
8.2 Reform of government business
Review of the Commercial Policy Framework
The Commercial Policy Framework (CPF) is a suite of policies that set expectations for government businesses in the PNFC and PFC sectors. The CPF aims to replicate in government businesses the drivers and characteristics of an efficient private sector business.
The Government continuously reviews and updates the CPF to ensure it reflects commercial best practice and to incorporate changes in government priorities and the regulatory environment. The CPF is currently under review in order to:
support the delivery of services at lower cost
enable more consistency and transparency in funding social and community programs
strengthen the monitoring of major capital investments made by government businesses
ensure commercial objectives are balanced with improved customer outcomes.
The review of the CPF will support government businesses to perform comparably with efficient private sector businesses, putting downward pressure on cost of living expenses and helping contribute to the growth of the NSW economy.
Changes to the CPF in 2017-18 included:
updating governance principles to align government businesses with ASX-listed companies
introducing best-practice guidance for CEO appointments
updating reporting requirements to support transparency and accountability
strengthening assurance processes for capital projects.
NSW Treasury Corporation (TCorp) and NSW Treasury have developed a whole-of-government Foreign Exchange Risk Policy to manage exposure to foreign currencies when Government agencies and businesses purchase, sell, or intend to purchase or sell goods and services either from or to overseas providers. The Policy is designed to improve project cost certainty and provide a cost-efficient arrangement for managing foreign exchange risk. TCorp is supporting the State’s focus on financial risk management to manage foreign exchange risk transparently, consistently and at lowest cost and/or risk to the State. The Policy will take effect 1 July 2018.
Broader public sector
Public financial corporations (PFC) sector
Non-financial public sector (NFPS)
Public non-financial corporations (PNFC)
sector
General government sector (GGS)

Commercial Performance in the Broader Public Sector
Budget Statement 2018-19 8 - 3
In line with private sector best practice and Commonwealth government businesses, the NSW Government has updated its policy regarding how ‘for-profit’ public sector entities measure long-term employee liabilities such as superannuation. Going forward, these liabilities will be discounted using the High Quality Corporate Bond rate.
The Government Sector Finance Bill (GSF Bill) will enable the State to centralise liquidity management by including PNFC entities within the centralised banking system. This means that the State can improve balance sheet efficiency by reducing borrowing and finance costs. Refer to Box 2.2 in Chapter 2 of this Budget Statement for more details on the GSF Bill.
These initiatives will enable more efficient use of capital thereby supporting the funding of the Government’s infrastructure program.
Water
Sydney Water is updating its wastewater infrastructure to support an additional 500,000 people in Sydney’s West by 2040 under the Lower South Creek Treatment Program, providing significant improvements to the quality, capacity and reliability of the wastewater system in the area. This includes investing $117 million to increase the capacity of the Riverstone wastewater treatment facilities, as well as investing $300 million for a new biological nutrient removal plant at Quakers Hill and enhanced wastewater treatment facilities at St Marys.
Since September 2017, Sydney Water has been progressively rolling out a new Customer Hub to provide a stronger and more seamless customer experience. This includes providing, in real time, service disruption and planning information to customers via electronic customer communication tools as well as real time proactive web and phone feedback channels.
Sydney Water is also investing in the Customer Experience Platform (CxP), an information technology project due to begin rolling out in mid-2019 and to be completed in 2020, which will deliver a new billing and data management system to improve the customer experience.
Box 8.1: Sydneysiders save more on water compared with other major cities
Water and wastewater customers in Sydney have gone from paying among the highest of any major city in Australia to the lowest as a result of the NSW Government’s strong financial management, prudent investment decision making and focus on operational efficiency.
This has resulted in a 10 per cent decrease in annual water bills for Sydney Water customers between 2015-16 and 2016-17. This was the largest decrease among all major utility groups nationally, with a typical household seeing savings of around $100 per year (see Chart 4.4).
The Government has committed to securing the long-term water supply to the Broken Hill community by constructing a 270 km pipeline from the Murray River. Water NSW is managing the construction, which is scheduled for completion by December 2018.
In May 2017, the NSW Government released Resilient Valley, Resilient Communities – the Hawkesbury-Nepean Valley Flood Risk Management Strategy. The Strategy, which was developed by Infrastructure NSW, concluded that raising the Warragamba Dam wall height by approximately 14 metres would be the best option to reduce flood risk from the Warragamba River. WaterNSW, which owns and operates Warragamba Dam, is currently undertaking an environmental assessment for the project. The NSW Government has allocated $58 million to deliver the first stage of the Flood Strategy, which includes $30 million for planning, environmental assessments and community consultation for raising the Dam wall as well as $28 million for better flood forecasting, emergency planning and improved evacuation signage.

Commercial Performance in the Broader Public Sector
8 - 4 Budget Statement 2018-19
The project is scheduled to be built by 2024 subject to completion of environmental assessments and other planning and government approvals.
Hunter Water is undertaking technology improvements to transform how the business interacts with customers and the community. Hunter Water is refreshing its billing system, redeveloping its website to include enhanced account management and transactional capability, introducing customer support tools including web chat, and increasing visibility and management of water usage with new data analytics. Digital technology will also be used to improve operating performance and revenue and risk management.
Energy
Reforms to the electricity transmission and distribution network reduced average customer network charges for residential customers by 30 per cent in real terms in 2017-18 compared with 2013-14.
According to the Australian Energy Regulator, a typical Essential Energy residential customer will see network charges fall by 40 per cent in real terms between 2012-13 and 2018-19, and average residential customer network charges in 2018-19 will be lower than they were in 2009-10. This has put downward pressure on prices as Essential Energy continues to streamline its operations and invest in innovative and enabling technologies to deliver a safe, reliable and efficient electricity network to its customers. While electricity generation, and wholesale and retail price increases have contributed to overall price rises in recent years, greater electricity network efficiencies have significantly moderated these price increases.
More efficient and lower cost electricity networks in New South Wales (a)
0
200
400
600
800
1000
1200
1400
1600
2010-11 2011-12 2012-13 2013-14 2014-15 2015-16 2016-17 2017-18Rev
2018-19Est
Net
owrk
com
pone
nt (
2018
-19$
)
Ausgrid
Endeavour
Essential
Source: Australian Energy Regulator, NSW Treasury
(a) Estimated network component of a typical residential customer’s bill over time adjusted for inflation (GST included).
Transport
The Port Authority of NSW is proposing to build a multi-user terminal to import bulk materials through Glebe Island. This will play a vital role in Sydney’s concrete supply chain. Currently, most materials involved in concrete production are delivered to Sydney by road. With demand for concrete in Sydney expected to continue to increase as a result of large infrastructure projects including WestConnex and Sydney Metro West, the new facility will improve supply chain efficiency and lower the number of trucks on the road, helping to reduce congestion on the road network. The terminal is forecast to be operational in the third quarter of 2019.
Commercial Performance in the Broader Public Sector
Budget Statement 2018-19 8 - 5
The number of cruise vessel visits to Sydney has increased nearly three-fold over the past decade, with 346 visits expected in 2017-18. Growth is expected to continue and the Port Authority continues to explore opportunities to improve the operational efficiency of its cruise terminals. For example, the Port Authority is replacing the gangways at the Overseas Passenger Terminal in order to improve the flow of passengers from 500 to 1,200 passengers every 30 minutes.
The Transport Asset Holding Entity will optimise the existing transport asset base to enable a more effective, efficient and commercial approach to asset management. The Government continues to develop the final operating model and expects it will be in operation from 2019.
Tourism
Sydney Opera House is undergoing a $202 million upgrade for Stage 1 Renewal works funded by Restart NSW. The Concert Hall upgrades will modernise the Opera House’s largest and most popular venue, greatly improving acoustics, theatre machinery systems and wheelchair accessible seating, as well as extending and automating stage configuration. These improvements to this world class venue will enrich the experience for the eight million tourists who visit the global icon each year.
The entry and foyer upgrades will enhance the visitor experience by increasing pedestrian accessibility under the Monumental Steps, and upgrading the main box office. A new Creative Learning Centre will repurpose the north-western corner of the building, currently used for offices, into a multi-purpose space for education and creative activities. A new premium function centre within the building envelope on the north-eastern end of the building will have one of the world’s best views and will allow the removal of the existing function marquee. A $36.2 million security system upgrade is also being implemented to maximise protection for the public and staff at the Sydney Opera House.
The 10-year Visitor Experience capital program at Taronga Zoo, Sydney and Taronga Western Plains Zoo, Dubbo commenced in 2016-17. The $165 million program will enhance the capacity of the organisation to offer impressive visitor experiences through its unique collection of animals and related educational exhibits.
Forestry
The Government has approved a $71.8 million forestry package to support an innovative, thriving and sustainable forestry industry. The package includes:
Innovation fund: $34.0 million over four years in loans and related expenses to assist the State’s forestry industry to adjust to local wood supply changes through innovation
Plantation investment: $24.0 million to the Forestry Corporation of NSW to invest in plantations. This will help increase supply and support sustainable timber harvesting
Mapping and environmental monitoring: $9.2 million over four years in world-class forest mapping and environmental monitoring to underpin a sustainable forestry industry
Training: $4.6 million over four years for a training and accreditation scheme for forestry industry contractors in safety and environmental practices, and governance.
Property
Landcom has shifted its focus to improving the supply, diversity and affordability of new housing in Sydney and regional New South Wales. This follows the reallocation of the Major Urban Transformation Projects from Landcom to UrbanGrowth NSW Development Corporation and Hunter Development Corporation in the second half of 2017.

Commercial Performance in the Broader Public Sector
8 - 6 Budget Statement 2018-19
Landcom is also focused on delivering its existing projects, which are primarily located in Western Sydney. These projects will contribute to its target of delivering 20,000 new home sites over the four years to March 2019. As at 31 May 2018, 16,860 new home sites had been delivered and Landcom is on track to achieve its target.
Box 8.2: Landcom: delivering affordable housing across New South Wales
In November 2017, Landcom released its Housing Affordability and Diversity Policy, under which it has committed to deliver 5-10 per cent of all new housing as affordable housing provided by Community Housing Providers.
Landcom has commenced a program of Demonstration Projects to test housing affordability solutions that are replicable, commercially viable and meet a range of demographic needs. These projects will adopt innovative approaches to design, planning and finance, and play a key role in demonstrating to the industry that new approaches can improve housing affordability and diversity.
The program of Demonstration Projects will be ongoing, with the first tranche of four projects to be launched later this year. The four demonstration sites will provide affordable housing options for first home buyers, downsizers and renters and will test different design options including micro lots, vertical villages and compact apartments. Three of the demonstration sites will be located in Greater Sydney and one will be located in regional New South Wales.
8.3 Non-financial public sector
For the NFPS, the $1.3 billion net operating balance in 2017-18 is $1.2 billion higher than forecast in the 2017-18 Budget. This is due to a stronger result for the GGS. The NFPS net operating balance is lower over the forward estimates than forecast in the 2017-18 Budget due to lower revenue forecasts in the GGS and PNFC sectors.
Further details on GGS performance are in Chapters 5 and 6 of this Budget Statement.
Components of the non-financial public sector net operating balance
5.1
1.3
-1.8 -1.6 -1.5
-0.8
-4.0
-3.0
-2.0
-1.0
0.0
1.0
2.0
3.0
4.0
5.0
6.0
7.0
2016-17Actual
2017-18Revised
2018-19Budget
2019-20Estimate
2020-21Estimate
2021-22Estimate
$ b
illio
ns
General Government PNFC Intra-government transactions (a) NFPS
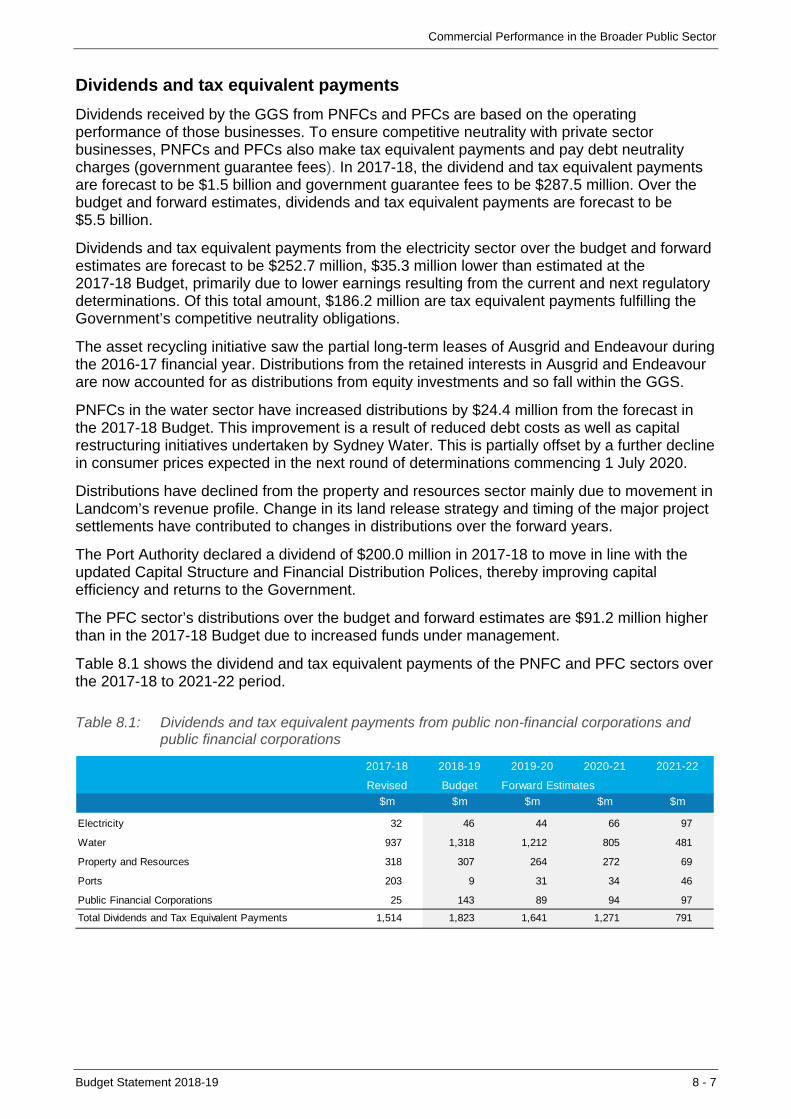
Commercial Performance in the Broader Public Sector
Budget Statement 2018-19 8 - 7
Dividends and tax equivalent payments
Dividends received by the GGS from PNFCs and PFCs are based on the operating performance of those businesses. To ensure competitive neutrality with private sector businesses, PNFCs and PFCs also make tax equivalent payments and pay debt neutrality charges (government guarantee fees). In 2017-18, the dividend and tax equivalent payments are forecast to be $1.5 billion and government guarantee fees to be $287.5 million. Over the budget and forward estimates, dividends and tax equivalent payments are forecast to be $5.5 billion.
Dividends and tax equivalent payments from the electricity sector over the budget and forward estimates are forecast to be $252.7 million, $35.3 million lower than estimated at the 2017-18 Budget, primarily due to lower earnings resulting from the current and next regulatory determinations. Of this total amount, $186.2 million are tax equivalent payments fulfilling the Government’s competitive neutrality obligations.
The asset recycling initiative saw the partial long-term leases of Ausgrid and Endeavour during the 2016-17 financial year. Distributions from the retained interests in Ausgrid and Endeavour are now accounted for as distributions from equity investments and so fall within the GGS.
PNFCs in the water sector have increased distributions by $24.4 million from the forecast in the 2017-18 Budget. This improvement is a result of reduced debt costs as well as capital restructuring initiatives undertaken by Sydney Water. This is partially offset by a further decline in consumer prices expected in the next round of determinations commencing 1 July 2020.
Distributions have declined from the property and resources sector mainly due to movement in Landcom’s revenue profile. Change in its land release strategy and timing of the major project settlements have contributed to changes in distributions over the forward years.
The Port Authority declared a dividend of $200.0 million in 2017-18 to move in line with the updated Capital Structure and Financial Distribution Polices, thereby improving capital efficiency and returns to the Government.
The PFC sector’s distributions over the budget and forward estimates are $91.2 million higher than in the 2017-18 Budget due to increased funds under management.
Table 8.1 shows the dividend and tax equivalent payments of the PNFC and PFC sectors over the 2017-18 to 2021-22 period.
Table 8.1: Dividends and tax equivalent payments from public non-financial corporations and public financial corporations
2017-18 2018-19 2019-20 2020-21 2021-22
Revised Budget Forward Estimates
$m $m $m $m $m
Electricity 32 46 44 66 97
Water 937 1,318 1,212 805 481
Property and Resources 318 307 264 272 69
Ports 203 9 31 34 46
Public Financial Corporations 25 143 89 94 97
Total Dividends and Tax Equivalent Payments 1,514 1,823 1,641 1,271 791

Commercial Performance in the Broader Public Sector
8 - 8 Budget Statement 2018-19
Capital expenditure
In 2017-18, capital expenditure within the PNFC sector is forecast at $6.1 billion, $1.6 billion lower than forecast in the 2017-18 Budget. This result was driven by updates to the capital spend profile by Rail Corporation New South Wales and Sydney Motorway Corporation.
Capital expenditure within the PNFC sector over the budget and forward estimates will be $21.5 billion. This is $1.5 billion lower than forecast in the 2017-18 Budget for the period 2017-18 to 2020-21. The main reason for the reduction is the fact that in 2017-18, $2.0 billion was spent on the WestConnex project, and this spend is not included in the current budget and forward estimates period (2018-19 to 2021-22).
Chart 8.3 shows capital expenditure in the PNFC sector from 2017-18 to 2021-22. Box 8.3 provides information on the building and financing of the $16.8 billion WestConnex project.
Further details on the Government’s capital expenditure strategy is provided in Budget Paper No.2: Infrastructure Statement.
Capital expenditure of the public non-financial corporations sector
0.0
1.0
2.0
3.0
4.0
5.0
6.0
7.0
8.0
2017-18 2018-19 2019-20 2020-21 2021-22
$ b
illio
ns
Capital expenditure falls from a high of $7.1 billion in 2018-19 to $4.7 billion in 2021-22 reflecting completion of Stages 1 and 2 of the WestConnex project and lower spend on Stage 3, the completion of current train acquisition projects and the completion of the $360 million Western Sydney Stadium by Venues NSW.

Commercial Performance in the Broader Public Sector
Budget Statement 2018-19 8 - 9
Box 8.3: WestConnex
WestConnex is the largest road project in Australia under construction, providing 33 kilometres of motorway, two thirds of which will be underground.
More than 1,000 contracts have been signed with NSW-based suppliers and 10,000 direct and indirect jobs will be created during construction and delivery, delivering more than $20 billion in economic benefits for New South Wales.
Sale process
On 16 August 2017, the Government announced it would proceed with the sale of 51 per cent of WestConnex (including Sydney Motorway Corporation) to help fund the M4-M5 Link.
The binding bid phase of the sale commenced in March 2018, with the sale to be completed around mid-year. Once the transaction is complete, the future minority interest in WestConnex will be included in the NSW Generations Funds, a world-first sovereign fund established for the people of New South Wales for today and tomorrow (refer to Chapter 1 of this Budget Statement for more information).
In line with private sector best practice and Commonwealth government businesses, the NSW Government has updated its policy regarding how ‘for-profit’ public sector entities measure long-term employee liabilities such as superannuation. Going forward, these liabilities will be discounted using the High Quality Corporate Bond rate.
8.4 Public financial corporation sector
The PFC sector includes NSW Treasury Corporation (TCorp) and Insurance and Care NSW (icare).
TCorp is the State’s central financing authority and funds management agency. TCorp has been the central financing authority for New South Wales since its inception in 1983. TCorp accesses cost-effective funding from the domestic and international capital markets utilising the NSW Government’s triple-A rating, which delivers significant economies of scale.
These funds are then on-lent to NSW Public Sector Agencies. In the last year, TCorp has worked with its borrowing clients to lengthen their debt profiles. The lengthening was achieved through issuing a new 2029 bond and a new 20-year bond (which is the longest dated TCorp bond issued in the domestic market). TCorp and NSW Treasury have also developed a whole-of-government Foreign Exchange Risk Policy to manage currency exposure when Government agencies and businesses buy or sell goods and services to or from overseas. Further information on this reform can be found in Chapter 7 of this Budget Statement.
TCorp is a top 10 Australian investment manager and manages funds on behalf of icare, State Super and the NSW Infrastructure Future Fund (NIFF), among other clients. TCorp’s total funds under management have increased by $13.6 billion to $92.9 billion over the past year, largely due to new funds flowing into the NIFF, which reached $19.3 billion on 31 May 2018.
TCorp continues to benefit from the centralised funds management model implemented in 2017, where core funds management activities were amalgamated in TCorp. In 2017, $52 billion in TCorp, icare and State Super assets under custody were successfully transitioned to a single custodian, JP Morgan. This allowed TCorp to achieve recurring annual cost savings of $34.2 million for the State through lower external provider fees, operational efficiencies and consolidated investment capabilities.
As part of the Government’s Fit for the Future package, local government councils were given the opportunity to borrow from TCorp to invest in new community infrastructure and upgrade existing assets. TCorp’s participation in local government lending provides a range of benefits including increased competition resulting in lower borrowing costs.

Commercial Performance in the Broader Public Sector
8 - 10 Budget Statement 2018-19
Local councils are also investing in TCorpIM Funds, which provide competitive returns at lower fees than equivalent products available from commercial financial institutions. Since it began offering services to councils in 2015, TCorp has provided approximately $300 million in debt funding to local councils and now has just under $450 million in council assets under management (as at 31 May 2018). The local government lending program is forecast to deliver significant savings to NSW rate-payers.
The PFC sector also includes icare, the Government’s social insurer operating with a commercial mind and a social heart and a purpose to protect and insure the State’s people, businesses and assets. Over the past 12 months, icare has:
improved customer experiences by digitising policy and billing to interact directly with employers and NSW Government agencies
designed and delivered a segmented claims service model that prioritises injured workers according to their needs
simplified the eligibility process for people with a dust disease, with applicants now supported through a simple and personal phone-based interview
designed and implemented the Medical Support Panel which has reduced return to work times from around six weeks to less than six days for referred claims
established the Workers Care program, ensuring severely injured people receive leading care services irrespective of the scheme under which they are insured
committed $26.3 million in funding through the icare Foundation to prevent injury and help injured people return to work and life.
Since 2011, the NSW Government has undertaken significant reforms tackling the prevalence and severity of workplace injuries. At 1.4 per 100,000 employees, the rate of workplace fatalities is the lowest in New South Wales since Safe Work Australia began reporting in 2003. Coupled with organisational and operational efficiencies, such as the creation of the State Insurance Regulatory Authority, SafeWork NSW and icare, the NSW workers compensation system is now working for NSW workers and businesses creating safe and productive workplaces, with lower workers compensation insurance premiums and better return to work outcomes (see Chapter 4).
Workers compensation insurance premiums as a share of wages
1.00%
1.10%
1.20%
1.30%
1.40%
1.50%
1.60%
1.70%
1.80%
1.90%
2011-12 2012-13 2013-14 2014-15 2015-16 2016-17
Ins
uran
ce a
s a
per
cent
age
of N
SW
wag
es
Source: State Insurance and Regulatory Authority

Budget Statement 2018-19 A1 - 1
A1. STATEMENT OF FINANCES
This appendix presents the financial aggregates for the 2018-19 Budget.
Financial aggregates in this appendix are prepared in line with:
• the Uniform Presentation Framework (UPF) endorsed by the Australian Loan Council
• Australian Accounting Standard AASB 1049 Whole of Government and General Government Sector Financial Reporting, which adopts a harmonised Government Finance Statistics (GFS)/Generally Accepted Accounting Principles (GAAP) reporting basis.
UPF Tables also include disclosures that identify ‘convergence’ differences as explained on pages A1-4 and A1-5.
A six-year time series is provided from 2016-17 to 2021-22 for the general government sector (GGS), public non-financial corporations (PNFC) sector, and consolidated non-financial public sector (NFPS).
The Australian Bureau of Statistics (ABS) released a revised GFS-based Government Finance Estimates publication in December 2015 became effective from 1 July 2017.
The UPF is currently under review following the ABS’ release of their revised GFS publication. The presentation requirements of the current UPF have been adopted in this chapter with the exception of the expenses by function tables that are now presented using the COFOG-A hierarchy. The tables that previously showed the derivation of the GFS cash surplus/(deficit) have also been excluded as under the new GFS framework there is no longer a distinction between the AASB 1049 and GFS derived cash surplus/(deficit).
An analysis of general government expenses is presented in Chapter 6: Expenditure, and looks at each element of expenses by COFOG-A category.
Appendix A2 outlines the accounting policies and forecast assumptions adopted in the Budget. The Operating Statements as per Table A1.1, Table A1.9 and Table A1.12 quantifies the impact on the forward estimates from 2018-19 to 2021-22.
The Commonwealth Treasurer wrote to all State and Territory Premiers and Chief Ministers, seeking their agreement to several changes concerning the Australian Loan Council and Uniform Presentation Framework (UPF). This has resulted in the removal of the Loan Council reporting requirements from the UPF, and the transfer of the administration of the UPF to the Council on Federal Financial Relations. Commonwealth Treasury has confirmed they will not be seeking Loan Council nominations for 2018-19. Following these decisions, Loan Council reporting was removed from the UPF publication for Budget 2018-19.

Statement of Finances
A1 - 2 Budget Statement 2018-19
Introduction
This appendix presents financial aggregates for the GGS, PNFC sector and NFPS. These aggregates are prepared in line with the revised UPF agreed by the Australian Loan Council in March 2008.
The objective of the UPF is to facilitate a better understanding of individual government’s budget papers and provide for more meaningful comparisons of each government’s financial results and projections.
The format of the aggregates is based on reporting standards set out by the Australian Accounting Standards Board – AASB 1049 Whole of Government and General Government Sector Financial Reporting, which adopts a harmonised GFS-GAAP reporting basis.
The UPF financial aggregates:
allow consistent comparisons between the financial position of Australian governments
facilitate time series comparisons since they are relatively unaffected by changes in public sector administrative structures
permit an assessment of how public sector transactions affect the economy by providing data classified by economic type.
Uniform Presentation Framework
The NSW Government financial tables in this appendix are prepared under the UPF.1 Additional disclosures explain matters specific to New South Wales.
Framework
The UPF tables are in line with AASB 1049 which:
adopts generally accepted accounting principles (GAAP) definitions, including recognition and measurement principles in almost all cases
amends presentation requirements to encompass a comprehensive result that retains the GAAP classification system but overlays it with the transactions and other economic flows classification system based on GFS
expands the disclosure requirements to include key fiscal aggregates required by GFS.
Due to differences in reporting classifications, GFS financial aggregates released by the ABS will differ from UPF aggregates. These ‘convergence’ differences are not generally material for New South Wales, apart from GFS’s treatment of prepayments and the exclusion of deferred tax, settlement provisions and obligation payments. For more information on other differences, see the primary financial statements later in this appendix. For details and amounts of the key 2016-17 convergence differences, see pages 7-141 to 7-146 of the 2016-17 Report on State Finances.
1 The complete Uniform Presentation Framework 2008 is available on the Commonwealth Treasury website
www.treasury.gov.au. Extracts from the manual are included in this appendix to explain key concepts while the glossary to this budget paper also includes key UPF terms.
Statement of Finances
Budget Statement 2018-19 A1 - 3
Historical Series
To ensure a consistent historical series of fiscal aggregates, all jurisdictions have agreed to backcast published historical data on a best endeavours basis. For example, historic information in the consolidated operating statements has been recast on the basis of available dissections between GFS transactions and other economic flows.
Fiscal measures
UPF reporting measures evaluate the soundness of a government’s fiscal position and the fiscal policy effect on the economy. The fiscal measures in the UPF framework are:
net operating balance
net lending/borrowing (fiscal balance)
net worth
change in net worth (comprehensive result)
net debt
net financial worth
net financial liabilities
cash surplus/(deficit).
Definitions of these measures are set out in the glossary to this budget paper.
Flow measures (net operating balance, net lending/borrowing and change in net worth) show changes in the fiscal position during the reporting period, reflecting the impact of government decisions and actions, and re-measurement effects during that time. Flows represent the creation, transformation, exchange, transfer or extinction of economic value.
Stock measures (net worth, net debt, net financial worth and net financial liabilities) highlight a government’s fiscal position at a point in time, providing information on the aggregate results of past decisions.
Primary Financial Statements
UPF Presentation
Public sector estimates and outcomes are presented on an accrual accounting basis in three AASB 1049 based primary statements: the operating statement, including other economic flows; the balance sheet; and the cash flow statement. AASB 1049 adopts GFS principles where this does not conflict with GAAP. Details of key convergence differences between GFS and GAAP are explained in this appendix. The following statements form the UPF’s core reporting requirements. Appendix A2 sets out the significant accounting policies and forecast assumptions adopted by New South Wales.

Statement of Finances
A1 - 4 Budget Statement 2018-19
Operating Statement
The operating statement:
presents information on transactions (revenue and expenses) and other economic flows (revaluations and adjustments)
captures the composition of revenues and expenses and the net cost of government activities within a fiscal year
shows the full cost of resources consumed by the government in achieving its objectives and the extent that these costs are met from various revenue sources
shows information on capital expenditure and asset sales to derive a net lending/borrowing position.
The operating statement also reports three major fiscal measures:
net operating balance which is calculated as revenue minus expenses from transactions. New South Wales recognises its budget result as the net operating balance for the general government sector
total change in net worth (comprehensive result) which starts with the net operating balance and includes other economic flows such as revaluations
net lending (fiscal balance) which starts with the net operating balance and includes net capital expenditure but excludes depreciation, giving the best indicator of a jurisdiction’s call on financial markets.
Convergence differences in the Operating Statement
The main differences in treatment between the NSW GFS operating statement and the harmonised AASB 1049 operating statement presented are below:
the harmonised aggregates exclude selected Australian Government transfer payment revenues and expenses that pass through the State’s accounts. The ABS requires such payments to be grossed up in GFS reports. However, they are excluded from the AASB 1049 UPF reports as the NSW Government has no control over them. For information on the gross value of these grants see footnotes to the grants revenue and expense Table A1.5
grants are recognised when the State gains control over the assets. Control is normally obtained when the cash is received
dividends paid by the PNFC and PFC sectors to the GGS are recognised as an expense in GFS (in the PNFC and PFC sector operating statements), but they are treated as an equity transaction for AASB 1049
GFS may treat a transaction as a repayment of equity in circumstances where accounting standards would record a dividend payment
a liability is recognised in the UPF balance sheet for prepaid licence concession receipts. Income is subsequently recognised from amortising the prepaid licence over the concession period. GFS treats this as a sale of a non-produced intangible asset in the period that the prepayment is received.

Statement of Finances
Budget Statement 2018-19 A1 - 5
Balance Sheet
The balance sheet:
records the value of financial and non-financial assets and liabilities of governments, at the end of each financial year
shows the resources at the government’s disposal and the type and valuation of its liabilities
reveals the make-up of the government’s financial assets, its fixed asset holdings, and the extent of liabilities such as borrowings and unfunded superannuation
allows comparisons of asset and liability levels between jurisdictions and time periods.
The UPF balance sheet fiscal aggregates include net worth, net financial worth, net financial liabilities and net debt.
Convergence differences in the Balance Sheet
The main differences in treatment between the GFS balance sheet and the harmonised AASB 1049 balance sheet presented here include the following:
allowance for doubtful debts is recognised and reported in the UPF balance sheet, but is excluded from the GFS balance sheet, as GFS does not recognise an economic event has occurred
a prepaid income liability is recognised in the UPF balance sheets for unamortised prepaid licences. This liability is excluded from the GFS balance sheet, which treats the prepaid income as an upfront sale of a non-produced intangible asset
GFS balance sheets exclude deferred tax assets and deferred tax liabilities, but they are reported in accounting balance sheets. The convergence difference only affects GGS, PNFC and PFC sector balance sheets, as the assets and liabilities are eliminated for the consolidated non-financial public sector and Total Public Sector balance sheets
GFS balance sheets also do not recognise other settlement provisions and obligation payments as there is no present counterparty to the transactions
net financial worth and net financial liabilities aggregates are affected by the differing treatments for prepayments. Prepayments are treated in GFS as a receivable (financial asset), but in the UPF they are classified as a non-financial asset under AASB 1049. While this difference affects net financial liabilities and net financial worth, it does not affect net debt and net worth aggregates
the revised ABS GFS Manual presents debt in a matrix format, with no single net debt aggregate identified. In this publication net debt is reported in accordance with the current UPF as the sum of deposits held, government securities, loans and other borrowing, minus the sum of cash and deposits, advances paid and investments, loans and placements
by definition, GFS net worth for the PNFC and PFC sectors will always be zero, as owner’s equity is classified as equivalent to a liability. However, under the UPF, liabilities exclude owner’s equity.

Statement of Finances
A1 - 6 Budget Statement 2018-19
Cash Flow Statement
The cash flow statement reveals how a government obtains and expends cash. It shows how government cash inflows and outflows are allocated between various activities, and their net impact on cash held.
This statement requires cash flows to be categorised into:
operating activities comprising activities linked to collecting taxes, distributing grants, and providing goods and services
investing activities comprising activities linked to acquiring and disposing financial and non-financial assets
financing activities comprising activities linked to changing the size and composition of a government’s financial structure.
The sign convention within the cash flow statement is that all inflows carry a positive sign and all outflows carry a negative sign (regardless of whether they are gross or net cash flows).
The cash flow statement reports two fiscal measures:
net increase in cash held which is the sum of net cash flows from all operating, investing and financing activities
cash surplus/(deficit) which comprises net cash from operating activities, plus sales and less purchases of non-financial assets (less dividends paid for the PNFC and PFC sectors).
New South Wales uses the AASB 1049 cash result as its headline cash result.
Institutional sectors
Appendix A3 lists NSW-controlled entities. The NSW-controlled entities have been classified according to their government sector. These sectors are defined in the ABS GFS manual.
Emerging Issues
Market/non-market agency classification
The ABS applies a principles-based approach in classifying agencies as either market or non-market. The principle is that market operators make decisions about what to produce and how much to produce in response to expected levels of demand and expected costs of supply. A market producer should therefore earn a significant amount from sales, but other factors may need to be taken into account.
Applying the market/non-market definition may result in some public sector agencies moving between the public corporations and general government sectors.
Revised GFS Manual
The International Monetary Fund's (IMF) Government Finance Statistics Manual 2001 (GFSM 2001) was revised to reflect the 2008 System of National Accounts. The IMF released the final version of the international Government Finance Statistics Manual in December 2014. The ABS GFS manual has been updated to reflect the new international standards (where applicable).
The revised Australian GFS Manual was released in December 2015 and took effect from 1 July 2017. The publication of GFS data under the revised ABS GFS manual began from the September quarter 2017 and will be used in the Annual GFS publications from 2017-18.
Statement of Finances
Budget Statement 2018-19 A1 - 7
Revised Uniform Presentation Framework (UPF)
A revised framework has been circulated amongst the jurisdictions and discussion is currently included on the agenda for meetings of the Heads of Treasuries Accounting and Reporting Advisory Committee (HoTARAC). This review was prompted by the release of the revised Australian GFS Manual.
The requirements of the current UPF have been adopted in this chapter where this presentation remains consistent with AASB 1049 and the revised Australian GFS Manual. The following changes proposed in the revised UPF have been adopted in this publication:
The expenses by function tables are presented using the Classification of the Functions of Government – Australia (COFOG-A) hierarchy rather than the Government Purpose Classification (GPC).
The derivation of the GFS cash surplus/ (deficit) tables have been excluded as there is no longer a distinction between the AASB 1049 and GFS derived cash surplus/(deficit) under the revised GFS. This is due to the inclusion of finance leases and other similar financing arrangements in the calculation of the GFS cash surplus/ (deficit).
Uniform Presentation Tables
These tables are set out by institutional sectors showing the order of operating statement, balance sheet and cash flow statement.
In addition to the UPF minimum disclosure requirements, these tables also include a historical and forward year time series. The tables for general government sector also include:
tax revenues by type
a dissection of grant revenue and expense
dividend and income tax equivalent income by sector
total expenses by function
purchases of non-financial assets by function.
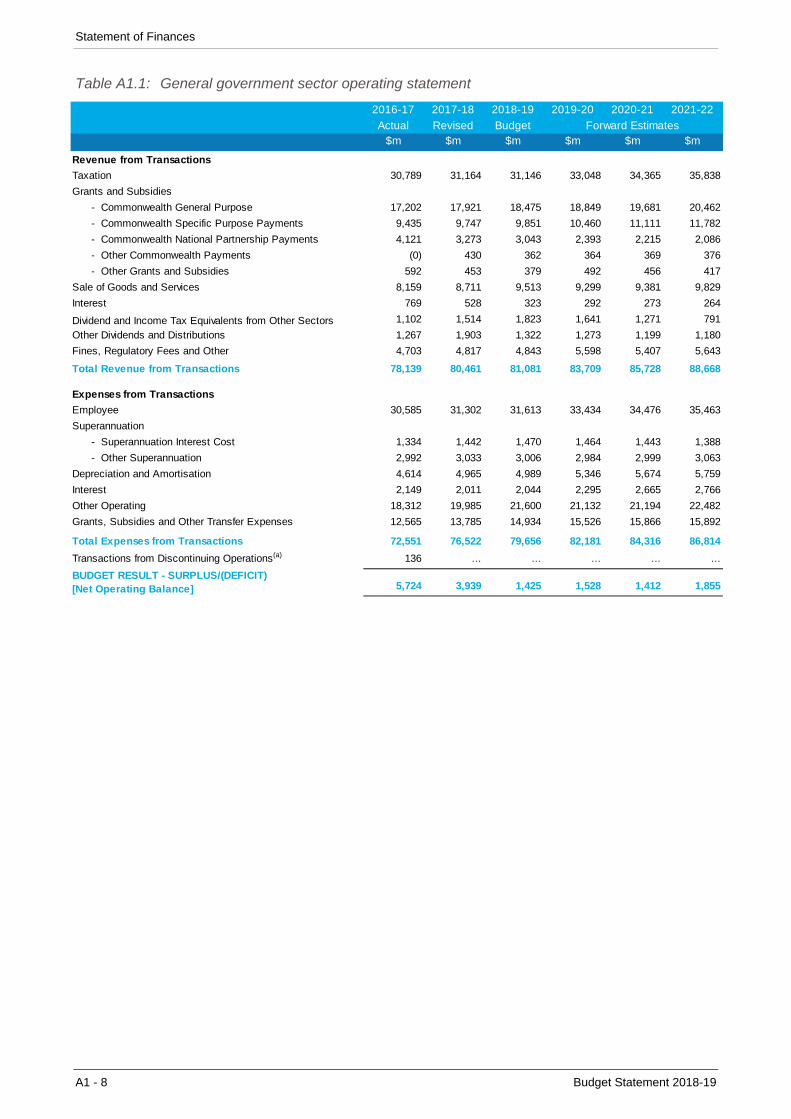
Statement of Finances
A1 - 8 Budget Statement 2018-19
Table A1.1: General government sector operating statement
2016-17 2017-18 2018-19 2019-20 2020-21 2021-22
Actual Revised Budget$m $m $m $m $m $m
Revenue from Transactions
Taxation 30,789 31,164 31,146 33,048 34,365 35,838
Grants and Subsidies
- Commonwealth General Purpose 17,202 17,921 18,475 18,849 19,681 20,462
- Commonwealth Specific Purpose Payments 9,435 9,747 9,851 10,460 11,111 11,782
- Commonwealth National Partnership Payments 4,121 3,273 3,043 2,393 2,215 2,086
- Other Commonwealth Payments (0) 430 362 364 369 376
- Other Grants and Subsidies 592 453 379 492 456 417
Sale of Goods and Services 8,159 8,711 9,513 9,299 9,381 9,829
Interest 769 528 323 292 273 264
Dividend and Income Tax Equivalents from Other Sectors 1,102 1,514 1,823 1,641 1,271 791
Other Dividends and Distributions 1,267 1,903 1,322 1,273 1,199 1,180
Fines, Regulatory Fees and Other 4,703 4,817 4,843 5,598 5,407 5,643
Total Revenue from Transactions 78,139 80,461 81,081 83,709 85,728 88,668
Expenses from Transactions
Employee 30,585 31,302 31,613 33,434 34,476 35,463
Superannuation
- Superannuation Interest Cost 1,334 1,442 1,470 1,464 1,443 1,388
- Other Superannuation 2,992 3,033 3,006 2,984 2,999 3,063
Depreciation and Amortisation 4,614 4,965 4,989 5,346 5,674 5,759
Interest 2,149 2,011 2,044 2,295 2,665 2,766
Other Operating 18,312 19,985 21,600 21,132 21,194 22,482
Grants, Subsidies and Other Transfer Expenses 12,565 13,785 14,934 15,526 15,866 15,892
Total Expenses from Transactions 72,551 76,522 79,656 82,181 84,316 86,814
Transactions from Discontinuing Operations(a) 136 ... ... ... ... ...
BUDGET RESULT - SURPLUS/(DEFICIT) [Net Operating Balance] 5,724 3,939 1,425 1,528 1,412 1,855
Forward Estimates
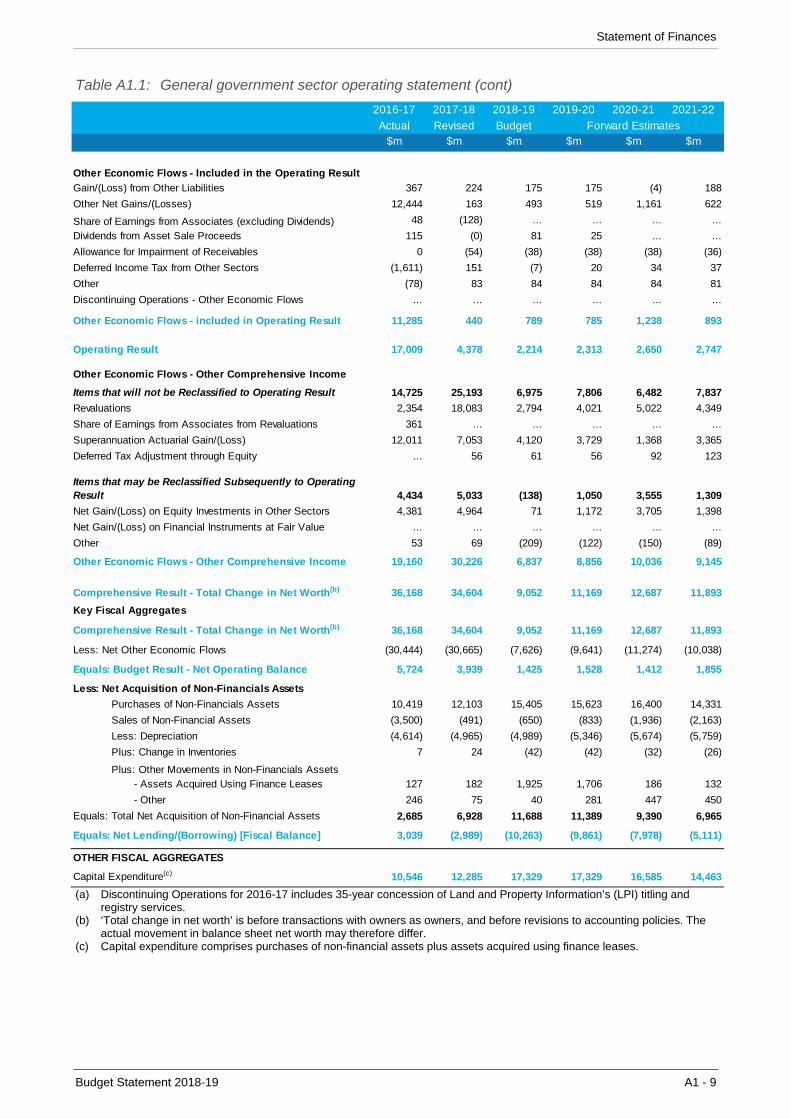
Statement of Finances
Budget Statement 2018-19 A1 - 9
Table A1.1: General government sector operating statement (cont)
2016-17 2017-18 2018-19 2019-20 2020-21 2021-22
Actual Revised Budget$m $m $m $m $m $m
Forward Estimates
Gain/(Loss) from Other Liabilities 367 224 175 175 (4) 188
Other Net Gains/(Losses) 12,444 163 493 519 1,161 622
Share of Earnings from Associates (excluding Dividends) 48 (128) ... ... ... ...
Dividends from Asset Sale Proceeds 115 (0) 81 25 ... ...
Allowance for Impairment of Receivables 0 (54) (38) (38) (38) (36)
Deferred Income Tax from Other Sectors (1,611) 151 (7) 20 34 37
Other (78) 83 84 84 84 81
Discontinuing Operations - Other Economic Flows ... ... ... ... ... ...
Other Economic Flows - included in Operating Result 11,285 440 789 785 1,238 893
Operating Result 17,009 4,378 2,214 2,313 2,650 2,747
Other Economic Flows - Other Comprehensive Income
Items that will not be Reclassified to Operating Result 14,725 25,193 6,975 7,806 6,482 7,837
Revaluations 2,354 18,083 2,794 4,021 5,022 4,349
Share of Earnings from Associates from Revaluations 361 ... ... ... ... ...
Superannuation Actuarial Gain/(Loss) 12,011 7,053 4,120 3,729 1,368 3,365
Deferred Tax Adjustment through Equity ... 56 61 56 92 123
Items that may be Reclassified Subsequently to Operating Result 4,434 5,033 (138) 1,050 3,555 1,309
Net Gain/(Loss) on Equity Investments in Other Sectors 4,381 4,964 71 1,172 3,705 1,398
Net Gain/(Loss) on Financial Instruments at Fair Value ... ... ... ... ... ...
Other 53 69 (209) (122) (150) (89)
Other Economic Flows - Other Comprehensive Income 19,160 30,226 6,837 8,856 10,036 9,145
Comprehensive Result - Total Change in Net Worth(b) 36,168 34,604 9,052 11,169 12,687 11,893
Key Fiscal Aggregates
Comprehensive Result - Total Change in Net Worth(b) 36,168 34,604 9,052 11,169 12,687 11,893
Less: Net Other Economic Flows (30,444) (30,665) (7,626) (9,641) (11,274) (10,038)
Equals: Budget Result - Net Operating Balance 5,724 3,939 1,425 1,528 1,412 1,855
Less: Net Acquisition of Non-Financials Assets
Purchases of Non-Financials Assets 10,419 12,103 15,405 15,623 16,400 14,331
Sales of Non-Financial Assets (3,500) (491) (650) (833) (1,936) (2,163)
Less: Depreciation (4,614) (4,965) (4,989) (5,346) (5,674) (5,759)
Plus: Change in Inventories 7 24 (42) (42) (32) (26)
Plus: Other Movements in Non-Financials Assets - Assets Acquired Using Finance Leases 127 182 1,925 1,706 186 132
- Other 246 75 40 281 447 450
Equals: Total Net Acquisition of Non-Financial Assets 2,685 6,928 11,688 11,389 9,390 6,965
Equals: Net Lending/(Borrowing) [Fiscal Balance] 3,039 (2,989) (10,263) (9,861) (7,978) (5,111)
OTHER FISCAL AGGREGATES
Capital Expenditure(c) 10,546 12,285 17,329 17,329 16,585 14,463
Other Economic Flows - Included in the Operating Result
(a) Discontinuing Operations for 2016-17 includes 35-year concession of Land and Property Information’s (LPI) titling and registry services.
(b) ‘Total change in net worth’ is before transactions with owners as owners, and before revisions to accounting policies. The actual movement in balance sheet net worth may therefore differ.
(c) Capital expenditure comprises purchases of non-financial assets plus assets acquired using finance leases.
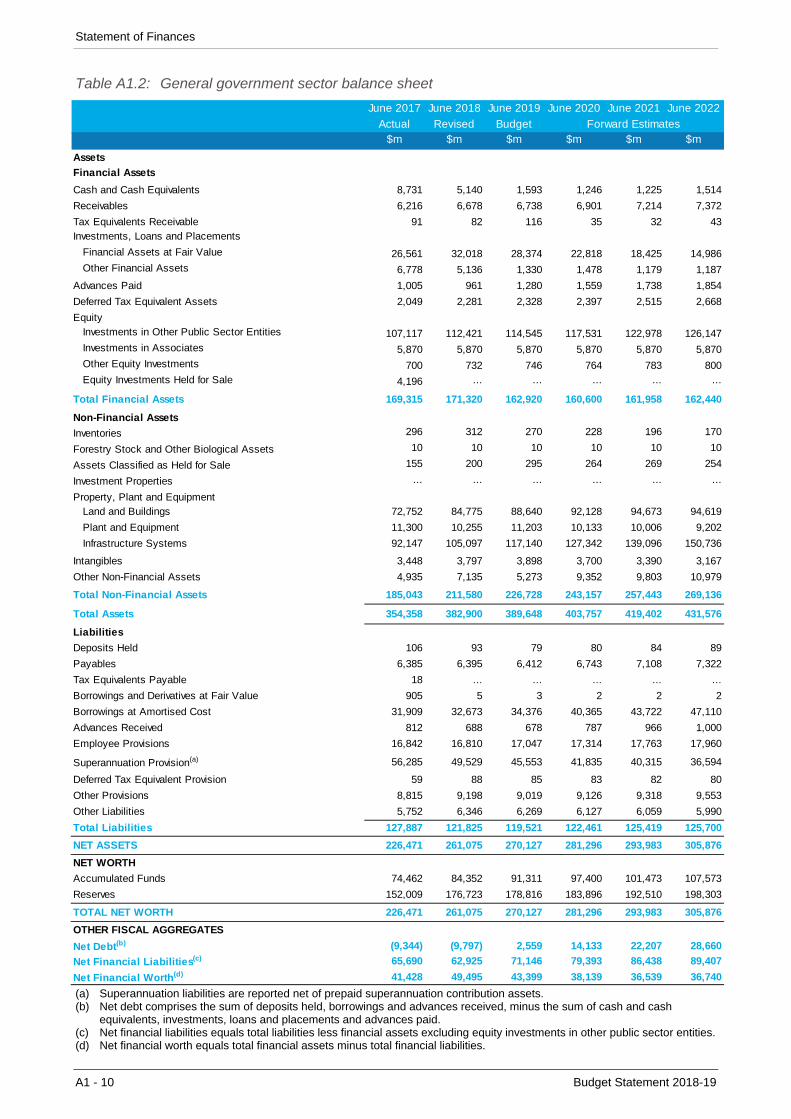
Statement of Finances
A1 - 10 Budget Statement 2018-19
Table A1.2: General government sector balance sheet
June 2017 June 2018 June 2019 June 2020 June 2021 June 2022
Actual Revised Budget$m $m $m $m $m $m
Assets
Financial Assets
Cash and Cash Equivalents 8,731 5,140 1,593 1,246 1,225 1,514
Receivables 6,216 6,678 6,738 6,901 7,214 7,372
Tax Equivalents Receivable 91 82 116 35 32 43 Investments, Loans and Placements
Financial Assets at Fair Value 26,561 32,018 28,374 22,818 18,425 14,986 Other Financial Assets 6,778 5,136 1,330 1,478 1,179 1,187
Advances Paid 1,005 961 1,280 1,559 1,738 1,854
Deferred Tax Equivalent Assets 2,049 2,281 2,328 2,397 2,515 2,668
EquityInvestments in Other Public Sector Entities 107,117 112,421 114,545 117,531 122,978 126,147 Investments in Associates 5,870 5,870 5,870 5,870 5,870 5,870 Other Equity Investments 700 732 746 764 783 800 Equity Investments Held for Sale 4,196 ... ... ... ... ...
Total Financial Assets 169,315 171,320 162,920 160,600 161,958 162,440
Non-Financial Assets
Inventories 296 312 270 228 196 170
Forestry Stock and Other Biological Assets 10 10 10 10 10 10
Assets Classified as Held for Sale 155 200 295 264 269 254
Investment Properties ... ... ... ... ... ...
Property, Plant and EquipmentLand and Buildings 72,752 84,775 88,640 92,128 94,673 94,619
Plant and Equipment 11,300 10,255 11,203 10,133 10,006 9,202
Infrastructure Systems 92,147 105,097 117,140 127,342 139,096 150,736
Intangibles 3,448 3,797 3,898 3,700 3,390 3,167
Other Non-Financial Assets 4,935 7,135 5,273 9,352 9,803 10,979
Total Non-Financial Assets 185,043 211,580 226,728 243,157 257,443 269,136
Total Assets 354,358 382,900 389,648 403,757 419,402 431,576
Liabilities
Deposits Held 106 93 79 80 84 89
Payables 6,385 6,395 6,412 6,743 7,108 7,322
Tax Equivalents Payable 18 ... ... ... ... ...
Borrowings and Derivatives at Fair Value 905 5 3 2 2 2
Borrowings at Amortised Cost 31,909 32,673 34,376 40,365 43,722 47,110
Advances Received 812 688 678 787 966 1,000
Employee Provisions 16,842 16,810 17,047 17,314 17,763 17,960
Superannuation Provision(a) 56,285 49,529 45,553 41,835 40,315 36,594
Deferred Tax Equivalent Provision 59 88 85 83 82 80
Other Provisions 8,815 9,198 9,019 9,126 9,318 9,553
Other Liabilities 5,752 6,346 6,269 6,127 6,059 5,990
Total Liabilities 127,887 121,825 119,521 122,461 125,419 125,700
NET ASSETS 226,471 261,075 270,127 281,296 293,983 305,876
NET WORTH
Accumulated Funds 74,462 84,352 91,311 97,400 101,473 107,573
Reserves 152,009 176,723 178,816 183,896 192,510 198,303
TOTAL NET WORTH 226,471 261,075 270,127 281,296 293,983 305,876
OTHER FISCAL AGGREGATES
Net Debt(b) (9,344) (9,797) 2,559 14,133 22,207 28,660
Net Financial Liabilities(c) 65,690 62,925 71,146 79,393 86,438 89,407
Net Financial Worth(d) 41,428 49,495 43,399 38,139 36,539 36,740
Forward Estimates
(a) Superannuation liabilities are reported net of prepaid superannuation contribution assets. (b) Net debt comprises the sum of deposits held, borrowings and advances received, minus the sum of cash and cash
equivalents, investments, loans and placements and advances paid. (c) Net financial liabilities equals total liabilities less financial assets excluding equity investments in other public sector entities. (d) Net financial worth equals total financial assets minus total financial liabilities.
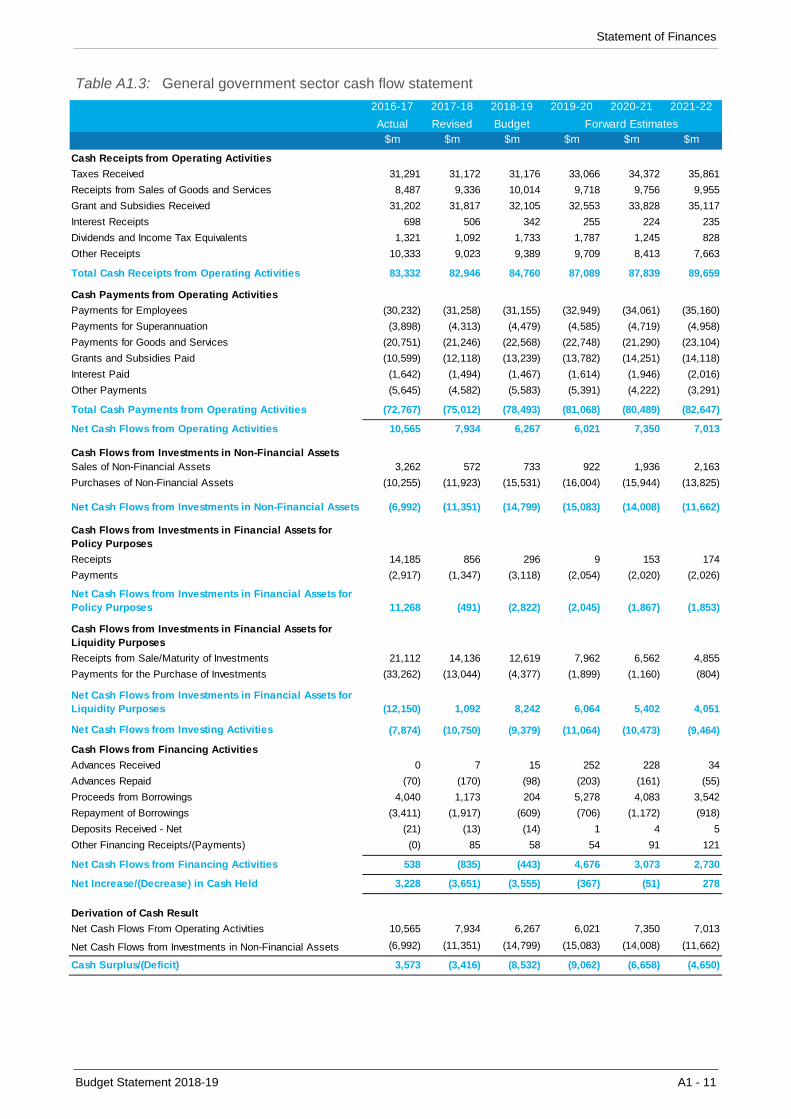
Statement of Finances
Budget Statement 2018-19 A1 - 11
Table A1.3: General government sector cash flow statement
2016-17 2017-18 2018-19 2019-20 2020-21 2021-22
Actual Revised Budget$m $m $m $m $m $m
Cash Receipts from Operating Activities
Taxes Received 31,291 31,172 31,176 33,066 34,372 35,861
Receipts from Sales of Goods and Services 8,487 9,336 10,014 9,718 9,756 9,955
Grant and Subsidies Received 31,202 31,817 32,105 32,553 33,828 35,117
Interest Receipts 698 506 342 255 224 235
Dividends and Income Tax Equivalents 1,321 1,092 1,733 1,787 1,245 828
Other Receipts 10,333 9,023 9,389 9,709 8,413 7,663
Total Cash Receipts from Operating Activities 83,332 82,946 84,760 87,089 87,839 89,659
Cash Payments from Operating Activities
Payments for Employees (30,232) (31,258) (31,155) (32,949) (34,061) (35,160)
Payments for Superannuation (3,898) (4,313) (4,479) (4,585) (4,719) (4,958)
Payments for Goods and Services (20,751) (21,246) (22,568) (22,748) (21,290) (23,104)
Grants and Subsidies Paid (10,599) (12,118) (13,239) (13,782) (14,251) (14,118)
Interest Paid (1,642) (1,494) (1,467) (1,614) (1,946) (2,016)
Other Payments (5,645) (4,582) (5,583) (5,391) (4,222) (3,291)
Total Cash Payments from Operating Activities (72,767) (75,012) (78,493) (81,068) (80,489) (82,647)
Net Cash Flows from Operating Activities 10,565 7,934 6,267 6,021 7,350 7,013
Cash Flows from Investments in Non-Financial AssetsSales of Non-Financial Assets 3,262 572 733 922 1,936 2,163
Purchases of Non-Financial Assets (10,255) (11,923) (15,531) (16,004) (15,944) (13,825)
Net Cash Flows from Investments in Non-Financial Assets (6,992) (11,351) (14,799) (15,083) (14,008) (11,662)
Cash Flows from Investments in Financial Assets for Policy Purposes
Receipts 14,185 856 296 9 153 174
Payments (2,917) (1,347) (3,118) (2,054) (2,020) (2,026)
Net Cash Flows from Investments in Financial Assets for Policy Purposes 11,268 (491) (2,822) (2,045) (1,867) (1,853)
Cash Flows from Investments in Financial Assets for Liquidity Purposes
Receipts from Sale/Maturity of Investments 21,112 14,136 12,619 7,962 6,562 4,855
Payments for the Purchase of Investments (33,262) (13,044) (4,377) (1,899) (1,160) (804)
Net Cash Flows from Investments in Financial Assets for Liquidity Purposes (12,150) 1,092 8,242 6,064 5,402 4,051
Net Cash Flows from Investing Activities (7,874) (10,750) (9,379) (11,064) (10,473) (9,464)
Cash Flows from Financing Activities
Advances Received 0 7 15 252 228 34
Advances Repaid (70) (170) (98) (203) (161) (55)
Proceeds from Borrowings 4,040 1,173 204 5,278 4,083 3,542
Repayment of Borrowings (3,411) (1,917) (609) (706) (1,172) (918)
Deposits Received - Net (21) (13) (14) 1 4 5
Other Financing Receipts/(Payments) (0) 85 58 54 91 121
Net Cash Flows from Financing Activities 538 (835) (443) 4,676 3,073 2,730
Net Increase/(Decrease) in Cash Held 3,228 (3,651) (3,555) (367) (51) 278
Derivation of Cash Result
Net Cash Flows From Operating Activities 10,565 7,934 6,267 6,021 7,350 7,013
Net Cash Flows from Investments in Non-Financial Assets (6,992) (11,351) (14,799) (15,083) (14,008) (11,662)
Cash Surplus/(Deficit) 3,573 (3,416) (8,532) (9,062) (6,658) (4,650)
Forward Estimates

Statement of Finances
A1 - 12 Budget Statement 2018-19
Table A1.4: General government sector taxes
2016-17 2017-18 2018-19
Actual Revised Budget$m $m $m
Taxes on Employers’ Payroll and Labour Force 8,282 8,976 9,307
Taxes on Property
Land Taxes 3,171 3,833 4,293Other 298 289 307
Total Taxes on Property 3,469 4,122 4,600
Taxes on the Provision of Goods and Services
Excises and Levies ... ... ...
Taxes on Gambling 2,271 2,342 2,447Taxes on Insurance 2,358 2,468 2,489
Taxes on Financial & Capital Transactions 10,102 8,961 8,006
Total Taxes on the Provision of Goods and Services 14,731 13,770 12,942
Taxes on Use of Goods and Performance of Activities
Motor Vehicle Taxes 3,377 3,518 3,680
Franchise Taxes ... 15 18Other 930 763 598
Total Taxes on Use of Goods and Performance of Activities 4,307 4,296 4,296
Total Taxation Revenue 30,789 31,164 31,146

Statement of Finances
Budget Statement 2018-19 A1 - 13
Table A1.5: General government sector grant revenue and expense(a)
2016-17 2017-18 2018-19
Actual Revised Budget
$m $m $m
Current Grants and Subsidies Revenue
Current Grants from the Commonwealth (a)
General Purpose Grants 17,202 17,921 18,475
Specific Purpose Payments 9,435 9,747 9,851
National Partnership Payments 809 841 1,198
Other Commonwealth Payments 0 430 362
Total 27,446 28,939 29,886
Other Grants and Subsidies 545 383 371
Total Current Grants and Subsidies Revenue 27,991 29,322 30,257
Capital Grants and Subsidies Revenue
Capital Grants from the Commonwealth (a)
General Purpose Grants ... ... ...
Specific Purpose Payments 0 ... ...
National Partnership Payments 3,312 2,432 1,845
Other Commonwealth Payments 0 0 ...
Total 3,312 2,432 1,845
Other Grants and Subsidies 47 70 8
Total Capital Grants and Subsidies Revenue 3,359 2,502 1,853
Total Grant Revenue 31,350 31,824 32,110
Current Grant, Subsidies, and Transfer Payments Expense to:
State/Territory Government 0 0 ...
Local Government (a) 624 876 1,386
Private and Not-for-Profit Sector (a) 7,461 7,351 7,027
Other Sectors of Government 3,643 4,546 5,440
Total Current Grants, Subsidies, and Transfer Payments Expense
Capital Grant, Subsidies, and Transfer Payments Expense to:State/Territory Government ... ... ...Local Government (a) 179 319 369Private and Not-for-Profit Sector (a) 342 239 349
Other Sectors of Government 315 469 364
Total Capital Grants, Subsidies, and Transfer Payments Expense
Total Grant Expense 12,565 13,785 14,934
Note:(a)
Transfer Receipts
Current Transfer Receipts for Specific Purposes 4,663 4,170 4,059
Capital Transfer Receipts for Specific Purposes ... ... ...
Total Receipts 4,663 4,170 4,059
Current Transfer Payments to
Local Government 1,080 368 382
Private and Not-for Profit Sector 3,583 3,802 3,678Capital Transfer Payments to
Local Government ... ... ...
Private and Not-for Profit Sector ... ... ...
Total Payments 4,663 4,170 4,059
Grant revenue and expenses above exclude the following transfer payments from the Commonwealth that New South Wales passes on to third parties. They are not recorded as NSW revenue and expense elsewhere in Budget Papers as the State has no control over the amounts that it passes on. Details are as follows:
837 1,027 1,082
11,729 12,758 13,852
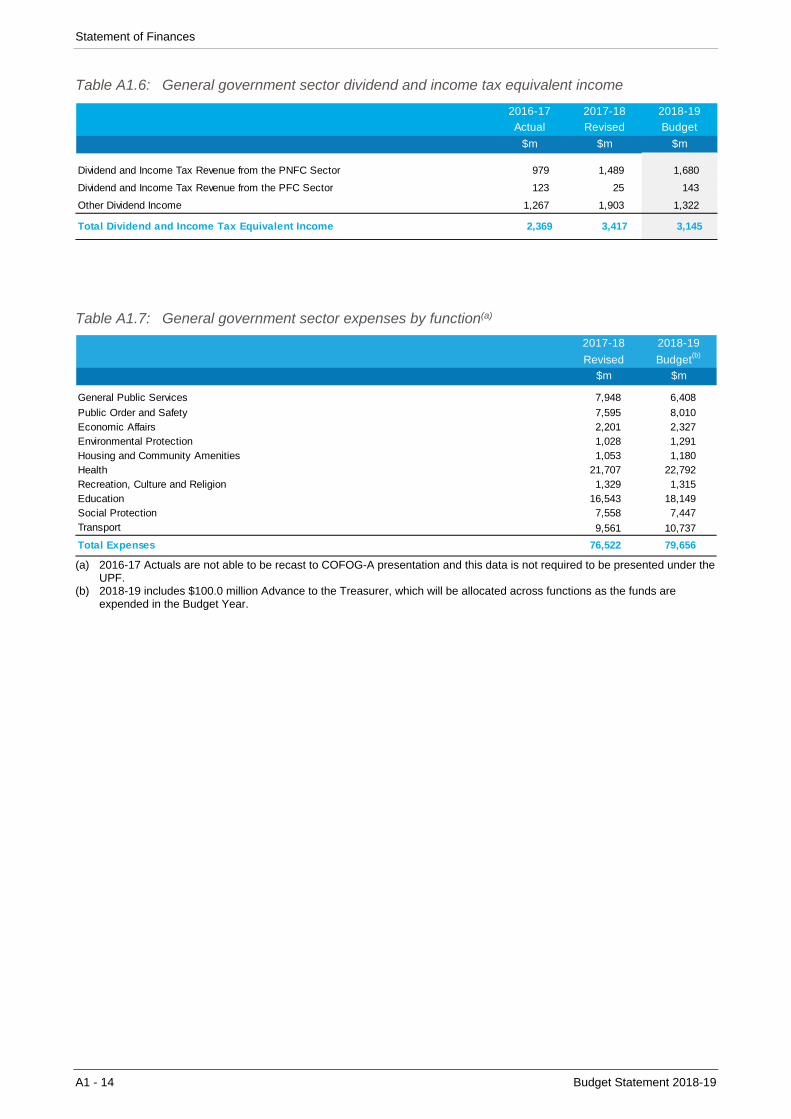
Statement of Finances
A1 - 14 Budget Statement 2018-19
Table A1.6: General government sector dividend and income tax equivalent income
2016-17 2017-18 2018-19
Actual Revised Budget
$m $m $m
Dividend and Income Tax Revenue from the PNFC Sector 979 1,489 1,680
Dividend and Income Tax Revenue from the PFC Sector 123 25 143
Other Dividend Income 1,267 1,903 1,322
Total Dividend and Income Tax Equivalent Income 2,369 3,417 3,145
Table A1.7: General government sector expenses by function(a)
2017-18 2018-19
Revised Budget(b)
$m $m
General Public Services 7,948 6,408
Public Order and Safety 7,595 8,010 Economic Affairs 2,201 2,327 Environmental Protection 1,028 1,291 Housing and Community Amenities 1,053 1,180 Health 21,707 22,792 Recreation, Culture and Religion 1,329 1,315 Education 16,543 18,149 Social Protection 7,558 7,447 Transport 9,561 10,737
Total Expenses 76,522 79,656
(a) 2016-17 Actuals are not able to be recast to COFOG-A presentation and this data is not required to be presented under the UPF.
(b) 2018-19 includes $100.0 million Advance to the Treasurer, which will be allocated across functions as the funds are expended in the Budget Year.

Statement of Finances
Budget Statement 2018-19 A1 - 15
Table A1.8: General government sector purchases of non-financial assets by function(a)
2017-18 2018-19
Revised Budget
$m $m
General Public Services 256 928
Public Order and Safety 980 1,384
Economic Affairs 128 316 Environmental Protection 5 18 Housing and Community Amenities 86 456 Health 1,549 2,164 Recreation, Culture and Religion 212 294 Education 945 1,793 Social Protection 232 184 Transport 7,709 7,868
Total Purchases of Non-Financial Assets 12,103 15,405
Assets Acquired under Finance Leases
Transport 182 1,925
Total Assets Acquired under Finance Leases 182 1,925
Total Capital Expenditure 12,285 17,329
(a) 2016-17 Actuals are not able to be recast to COFOG-A presentation and this data is not required to be presented under the UPF.
(b) 2018-19 includes $20.0 million Advance to the Treasurer, which will be allocated across functions as the funds are expended on capital in the Budget Year.

Statement of Finances
A1 - 16 Budget Statement 2018-19
Table A1.9: Public non-financial corporations sector operating statement
2016-17 2017-18 2018-19 2019-20 2020-21 2021-22
Actual Revised Budget
$m $m $m $m $m $m
Revenue from Transactions
Grants and Subsidies
- Other Commonwealth Payments 4 4 4 4 4 4
- Other Grants and Subsidies 3,071 2,804 2,990 2,827 3,146 3,507
Sale of Goods and Services 8,105 8,226 8,049 8,381 8,487 8,781
Interest 115 99 61 49 39 43
Fines, Regulatory Fees and Other 629 767 790 768 742 739
Total Revenue from Transactions 11,925 11,901 11,894 12,029 12,417 13,073
Expenses from Transactions
Employee 2,644 2,805 2,958 2,941 2,921 2,961
Superannuation
- Superannuation Interest Cost 56 57 54 52 49 47
- Other Superannuation 214 181 198 193 186 189
Depreciation and Amortisation 2,544 2,750 2,899 3,257 3,487 3,600
Interest 1,060 1,173 1,255 1,359 1,392 1,514
Income Tax Expense 343 376 339 287 236 230
Other Operating 5,656 5,991 5,795 5,765 6,013 6,651
Grants, Subsidies and Other Transfer Expenses 110 142 323 63 63 63
Total Expenses from Transactions 12,627 13,475 13,822 13,918 14,347 15,255
Transactions from Discontinuing Operations(a) 537 ... ... ... ... ...
NET OPERATING BALANCE - SURPLUS AFTER TAX (165) (1,574) (1,927) (1,889) (1,930) (2,181)
Forward Estimates

Statement of Finances
Budget Statement 2018-19 A1 - 17
Table A1.9: Public non-financial corporations sector operating statement (cont)
2016-17 2017-18 2018-19 2019-20 2020-21 2021-22
Actual Revised Budget
$m $m $m $m $m $m
Forward Estimates
Gain/(Loss) from Other Liabilities 4 ... ... ... ... ...
Other Net Gains/(Losses) 6,801 653 327 366 51 351
Allowance for Impairment of Receivables ... (0) (2) (4) (4) (4)
Deferred Income Tax ... (12) 8 (19) (34) (36)
Other (33) ... ... ... ... ...
Discontinuing Operations - Other Economic Flows (853) ... ... ... ... ...
Other Economic Flows - included in Operating Result 5,920 641 333 342 12 311
Operating Result 5,754 (933) (1,594) (1,547) (1,918) (1,870)
Items that will not be Reclassified to Operating Result 7,437 5,214 2,241 2,844 4,927 2,465
Revaluations 5,104 4,945 1,997 2,631 4,899 2,353
Superannuation Actuarial Gain/(Loss) 841 326 305 268 120 236
Deferred Tax Adjustment through Equity 1,492 (56) (61) (56) (92) (123)
Items that may be Reclassified Subsequently to Operating Result 6,851 (394) 652 502 619 1,108
Net Gain/(Loss) on Financial Instruments at Fair Value 36 40 0 ... ... ...
Other 6,815 (434) 652 502 619 1,108
Other Economic Flows - Other Comprehensive Income 14,288 4,820 2,893 3,346 5,546 3,573
Comprehensive Result - Total Change in Net Worth(b) 20,042 3,887 1,299 1,799 3,629 1,703
Key Fiscal Aggregates
Comprehensive Result - Total Change in Net Worth(b) 20,042 3,887 1,299 1,799 3,629 1,703
Less: Net Other Economic Flows (20,207) (5,461) (3,226) (3,688) (5,559) (3,885)
Equals: Budget Result - Net Operating Balance (165) (1,574) (1,927) (1,889) (1,930) (2,181)
Less: Net Acquisition of Non-Financials Assets
Purchases of Non-Financials Assets 6,312 6,129 7,142 5,200 4,457 4,684
Sales of Non-Financial Assets (486) (704) (485) (1,006) (523) (647)
Less: Depreciation (2,544) (2,750) (2,899) (3,257) (3,487) (3,600)
Plus: Change in Inventories (65) (47) 120 93 208 (27)
Plus: Other Movements in Non-Financials Assets - Assets Acquired Using Finance Leases 1,339 ... ... 19 ... ...
- Other 560 248 87 318 323 324
Equals: Total Net Acquisition of Non-Financial Assets 5,116 2,875 3,965 1,367 976 734
Equals: Net Lending/(Borrowing) [Fiscal Balance] (5,281) (4,449) (5,892) (3,256) (2,907) (2,915)
OTHER FISCAL AGGREGATES
Capital Expenditure(c) 7,651 6,129 7,142 5,219 4,457 4,684
Dividends Accrued(d) 434 863 747 689 629 463
Other Economic Flows - Included in the Operating Result
Other Economic Flows - Other Comprehensive Income
(a) Discontinuing operations for 2016-17 includes long term lease of Ausgrid and Endeavour Energy. (b) ‘Total change in net worth’ is before transactions with owners as owners, and before revisions to accounting policies. The
actual movement in balance sheet net worth may therefore differ. (c) Capital expenditure comprises purchases of non-financial assets plus assets acquired using finance leases. (d) Net borrowing for the PNFC sector excludes the impact of dividends accrued, and so may not fully reflect the sector’s call
on the financial markets.
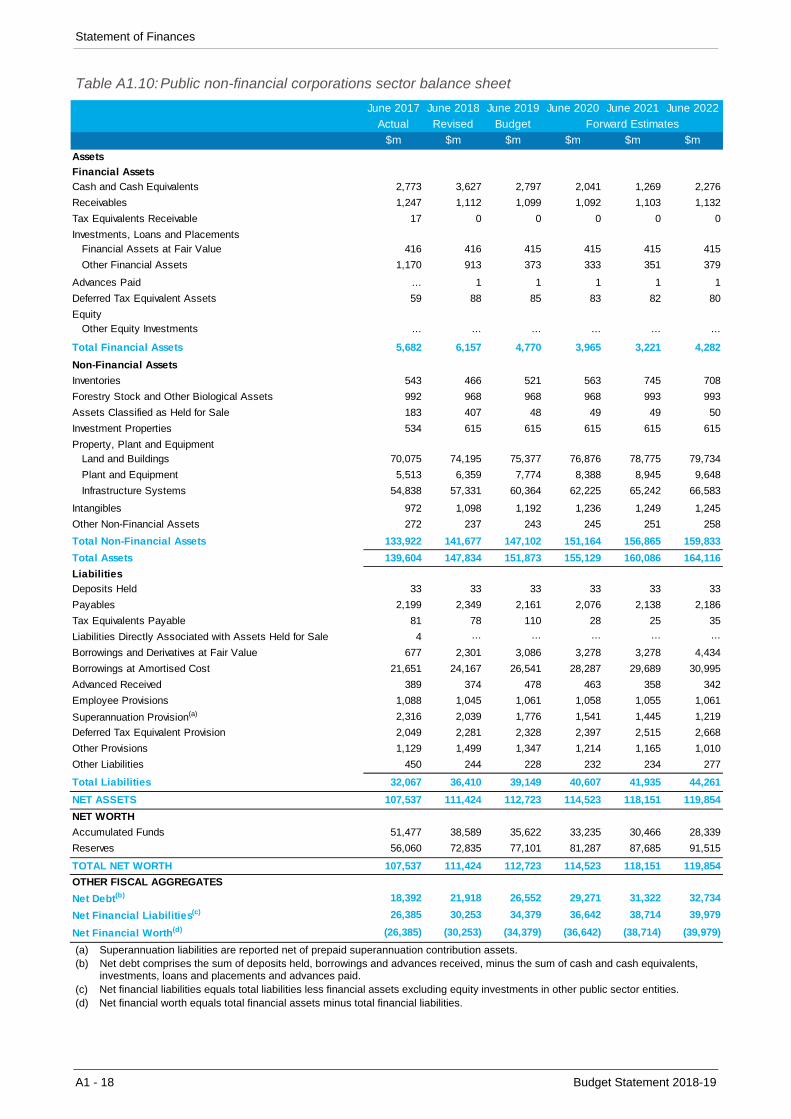
Statement of Finances
A1 - 18 Budget Statement 2018-19
Table A1.10: Public non-financial corporations sector balance sheet
June 2017 June 2018 June 2019 June 2020 June 2021 June 2022
Actual Revised Budget
$m $m $m $m $m $m
Assets
Financial Assets
Cash and Cash Equivalents 2,773 3,627 2,797 2,041 1,269 2,276
Receivables 1,247 1,112 1,099 1,092 1,103 1,132
Tax Equivalents Receivable 17 0 0 0 0 0
Investments, Loans and PlacementsFinancial Assets at Fair Value 416 416 415 415 415 415
Other Financial Assets 1,170 913 373 333 351 379
Advances Paid ... 1 1 1 1 1
Deferred Tax Equivalent Assets 59 88 85 83 82 80
EquityOther Equity Investments ... ... ... ... ... ...
Total Financial Assets 5,682 6,157 4,770 3,965 3,221 4,282
Non-Financial Assets
Inventories 543 466 521 563 745 708
Forestry Stock and Other Biological Assets 992 968 968 968 993 993
Assets Classified as Held for Sale 183 407 48 49 49 50
Investment Properties 534 615 615 615 615 615
Property, Plant and EquipmentLand and Buildings 70,075 74,195 75,377 76,876 78,775 79,734
Plant and Equipment 5,513 6,359 7,774 8,388 8,945 9,648
Infrastructure Systems 54,838 57,331 60,364 62,225 65,242 66,583
Intangibles 972 1,098 1,192 1,236 1,249 1,245
Other Non-Financial Assets 272 237 243 245 251 258
Total Non-Financial Assets 133,922 141,677 147,102 151,164 156,865 159,833
Total Assets 139,604 147,834 151,873 155,129 160,086 164,116
Liabilities
Deposits Held 33 33 33 33 33 33
Payables 2,199 2,349 2,161 2,076 2,138 2,186
Tax Equivalents Payable 81 78 110 28 25 35
Liabilities Directly Associated with Assets Held for Sale 4 ... ... ... ... ...
Borrowings and Derivatives at Fair Value 677 2,301 3,086 3,278 3,278 4,434
Borrowings at Amortised Cost 21,651 24,167 26,541 28,287 29,689 30,995
Advanced Received 389 374 478 463 358 342
Employee Provisions 1,088 1,045 1,061 1,058 1,055 1,061
Superannuation Provision(a) 2,316 2,039 1,776 1,541 1,445 1,219
Deferred Tax Equivalent Provision 2,049 2,281 2,328 2,397 2,515 2,668
Other Provisions 1,129 1,499 1,347 1,214 1,165 1,010
Other Liabilities 450 244 228 232 234 277
Total Liabilities 32,067 36,410 39,149 40,607 41,935 44,261
NET ASSETS 107,537 111,424 112,723 114,523 118,151 119,854
NET WORTH
Accumulated Funds 51,477 38,589 35,622 33,235 30,466 28,339
Reserves 56,060 72,835 77,101 81,287 87,685 91,515
TOTAL NET WORTH 107,537 111,424 112,723 114,523 118,151 119,854
OTHER FISCAL AGGREGATES
Net Debt(b) 18,392 21,918 26,552 29,271 31,322 32,734
Net Financial Liabilities(c) 26,385 30,253 34,379 36,642 38,714 39,979
Net Financial Worth(d) (26,385) (30,253) (34,379) (36,642) (38,714) (39,979)
Forward Estimates
(a) Superannuation liabilities are reported net of prepaid superannuation contribution assets. (b) Net debt comprises the sum of deposits held, borrowings and advances received, minus the sum of cash and cash equivalents,
investments, loans and placements and advances paid. (c) Net financial liabilities equals total liabilities less financial assets excluding equity investments in other public sector entities. (d) Net financial worth equals total financial assets minus total financial liabilities.
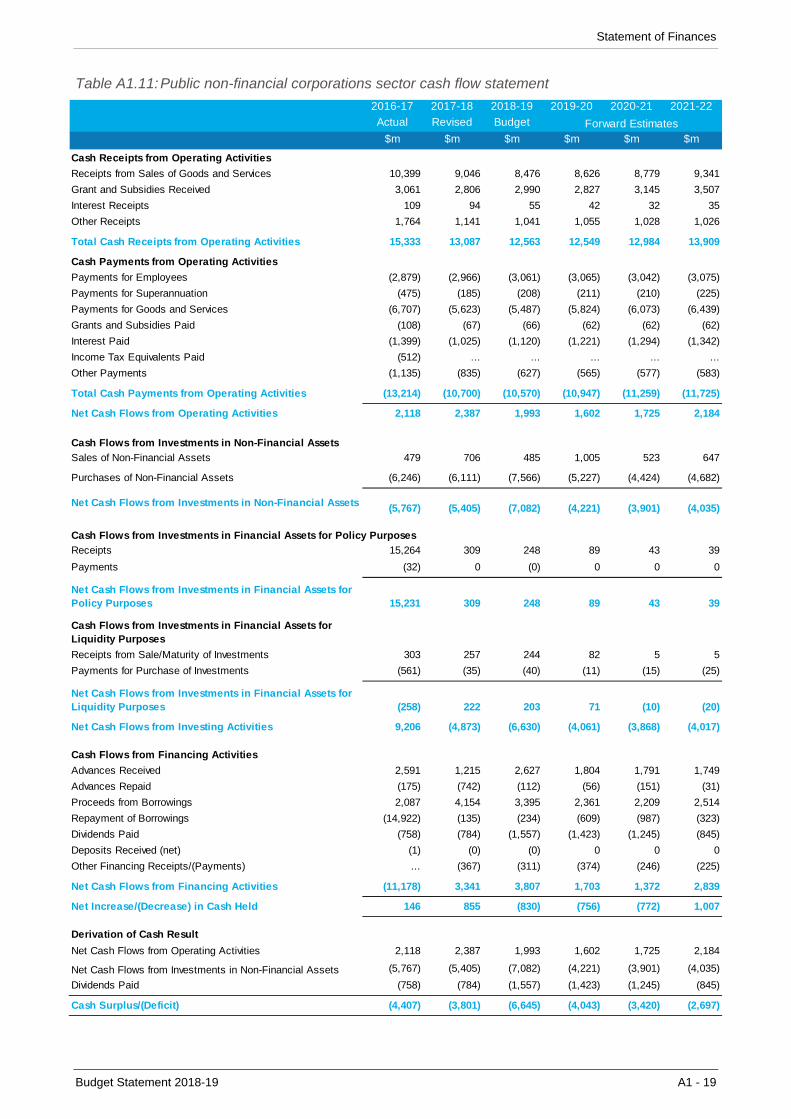
Statement of Finances
Budget Statement 2018-19 A1 - 19
Table A1.11: Public non-financial corporations sector cash flow statement
2016-17 2017-18 2018-19 2019-20 2020-21 2021-22
Actual Revised Budget
$m $m $m $m $m $m
Cash Receipts from Operating Activities
Receipts from Sales of Goods and Services 10,399 9,046 8,476 8,626 8,779 9,341
Grant and Subsidies Received 3,061 2,806 2,990 2,827 3,145 3,507
Interest Receipts 109 94 55 42 32 35
Other Receipts 1,764 1,141 1,041 1,055 1,028 1,026
Total Cash Receipts from Operating Activities 15,333 13,087 12,563 12,549 12,984 13,909
Cash Payments from Operating Activities
Payments for Employees (2,879) (2,966) (3,061) (3,065) (3,042) (3,075)
Payments for Superannuation (475) (185) (208) (211) (210) (225)
Payments for Goods and Services (6,707) (5,623) (5,487) (5,824) (6,073) (6,439)
Grants and Subsidies Paid (108) (67) (66) (62) (62) (62)
Interest Paid (1,399) (1,025) (1,120) (1,221) (1,294) (1,342)
Income Tax Equivalents Paid (512) ... ... ... ... ...
Other Payments (1,135) (835) (627) (565) (577) (583)
Total Cash Payments from Operating Activities (13,214) (10,700) (10,570) (10,947) (11,259) (11,725)
Net Cash Flows from Operating Activities 2,118 2,387 1,993 1,602 1,725 2,184
Sales of Non-Financial Assets 479 706 485 1,005 523 647
Purchases of Non-Financial Assets (6,246) (6,111) (7,566) (5,227) (4,424) (4,682)
Net Cash Flows from Investments in Non-Financial Assets (5,767) (5,405) (7,082) (4,221) (3,901) (4,035)
Receipts 15,264 309 248 89 43 39
Payments (32) 0 (0) 0 0 0
Net Cash Flows from Investments in Financial Assets for Policy Purposes 15,231 309 248 89 43 39
Cash Flows from Investments in Financial Assets for Liquidity Purposes
Receipts from Sale/Maturity of Investments 303 257 244 82 5 5
Payments for Purchase of Investments (561) (35) (40) (11) (15) (25)
Net Cash Flows from Investments in Financial Assets for Liquidity Purposes (258) 222 203 71 (10) (20)
Net Cash Flows from Investing Activities 9,206 (4,873) (6,630) (4,061) (3,868) (4,017)
Cash Flows from Financing Activities
Advances Received 2,591 1,215 2,627 1,804 1,791 1,749
Advances Repaid (175) (742) (112) (56) (151) (31)
Proceeds from Borrowings 2,087 4,154 3,395 2,361 2,209 2,514
Repayment of Borrowings (14,922) (135) (234) (609) (987) (323)
Dividends Paid (758) (784) (1,557) (1,423) (1,245) (845)
Deposits Received (net) (1) (0) (0) 0 0 0
Other Financing Receipts/(Payments) ... (367) (311) (374) (246) (225)
Net Cash Flows from Financing Activities (11,178) 3,341 3,807 1,703 1,372 2,839
Net Increase/(Decrease) in Cash Held 146 855 (830) (756) (772) 1,007
Derivation of Cash Result
Net Cash Flows from Operating Activities 2,118 2,387 1,993 1,602 1,725 2,184
Net Cash Flows from Investments in Non-Financial Assets (5,767) (5,405) (7,082) (4,221) (3,901) (4,035)
Dividends Paid (758) (784) (1,557) (1,423) (1,245) (845)
Cash Surplus/(Deficit) (4,407) (3,801) (6,645) (4,043) (3,420) (2,697)
Cash Flows from Investments in Non-Financial Assets
Cash Flows from Investments in Financial Assets for Policy Purposes
Forward Estimates
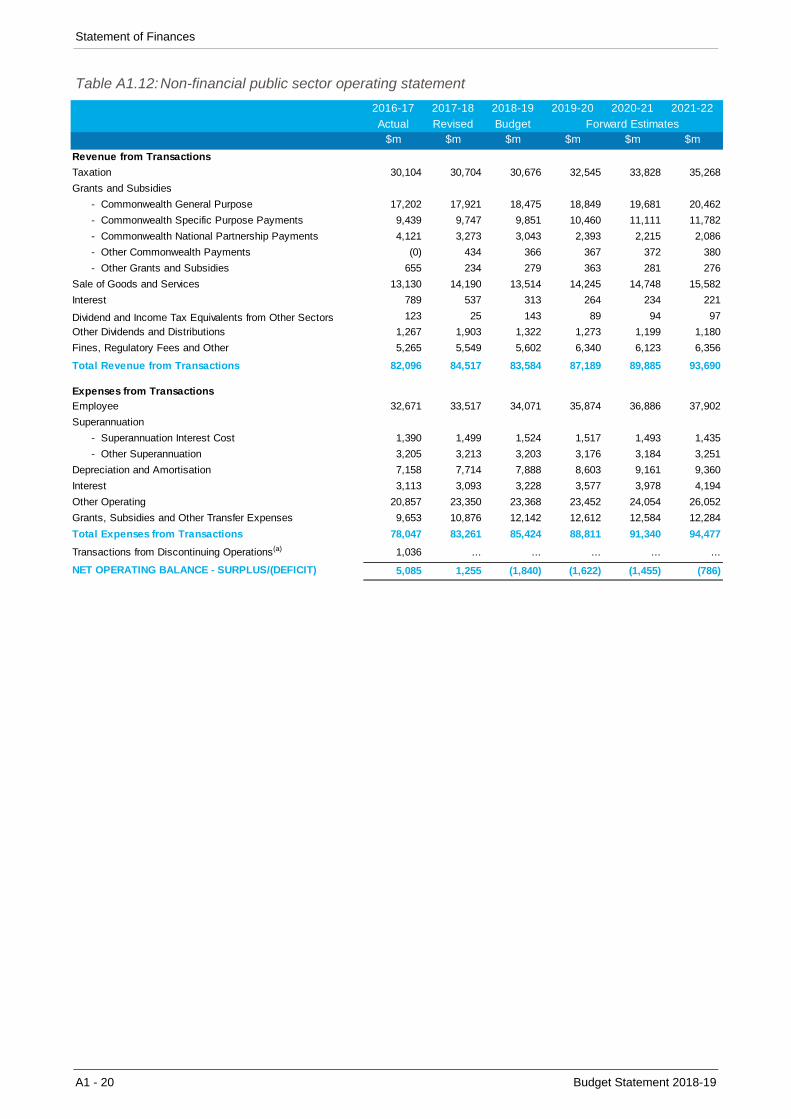
Statement of Finances
A1 - 20 Budget Statement 2018-19
Table A1.12: Non-financial public sector operating statement
2016-17 2017-18 2018-19 2019-20 2020-21 2021-22
Actual Revised Budget$m $m $m $m $m $m
Revenue from Transactions
Taxation 30,104 30,704 30,676 32,545 33,828 35,268
Grants and Subsidies
- Commonwealth General Purpose 17,202 17,921 18,475 18,849 19,681 20,462
- Commonwealth Specific Purpose Payments 9,439 9,747 9,851 10,460 11,111 11,782
- Commonwealth National Partnership Payments 4,121 3,273 3,043 2,393 2,215 2,086
- Other Commonwealth Payments (0) 434 366 367 372 380
- Other Grants and Subsidies 655 234 279 363 281 276
Sale of Goods and Services 13,130 14,190 13,514 14,245 14,748 15,582
Interest 789 537 313 264 234 221
Dividend and Income Tax Equivalents from Other Sectors 123 25 143 89 94 97
Other Dividends and Distributions 1,267 1,903 1,322 1,273 1,199 1,180
Fines, Regulatory Fees and Other 5,265 5,549 5,602 6,340 6,123 6,356
Total Revenue from Transactions 82,096 84,517 83,584 87,189 89,885 93,690
Expenses from Transactions
Employee 32,671 33,517 34,071 35,874 36,886 37,902
Superannuation
- Superannuation Interest Cost 1,390 1,499 1,524 1,517 1,493 1,435
- Other Superannuation 3,205 3,213 3,203 3,176 3,184 3,251
Depreciation and Amortisation 7,158 7,714 7,888 8,603 9,161 9,360
Interest 3,113 3,093 3,228 3,577 3,978 4,194
Other Operating 20,857 23,350 23,368 23,452 24,054 26,052
Grants, Subsidies and Other Transfer Expenses 9,653 10,876 12,142 12,612 12,584 12,284
Total Expenses from Transactions 78,047 83,261 85,424 88,811 91,340 94,477
Transactions from Discontinuing Operations(a) 1,036 ... ... ... ... ...
NET OPERATING BALANCE - SURPLUS/(DEFICIT) 5,085 1,255 (1,840) (1,622) (1,455) (786)
Forward Estimates
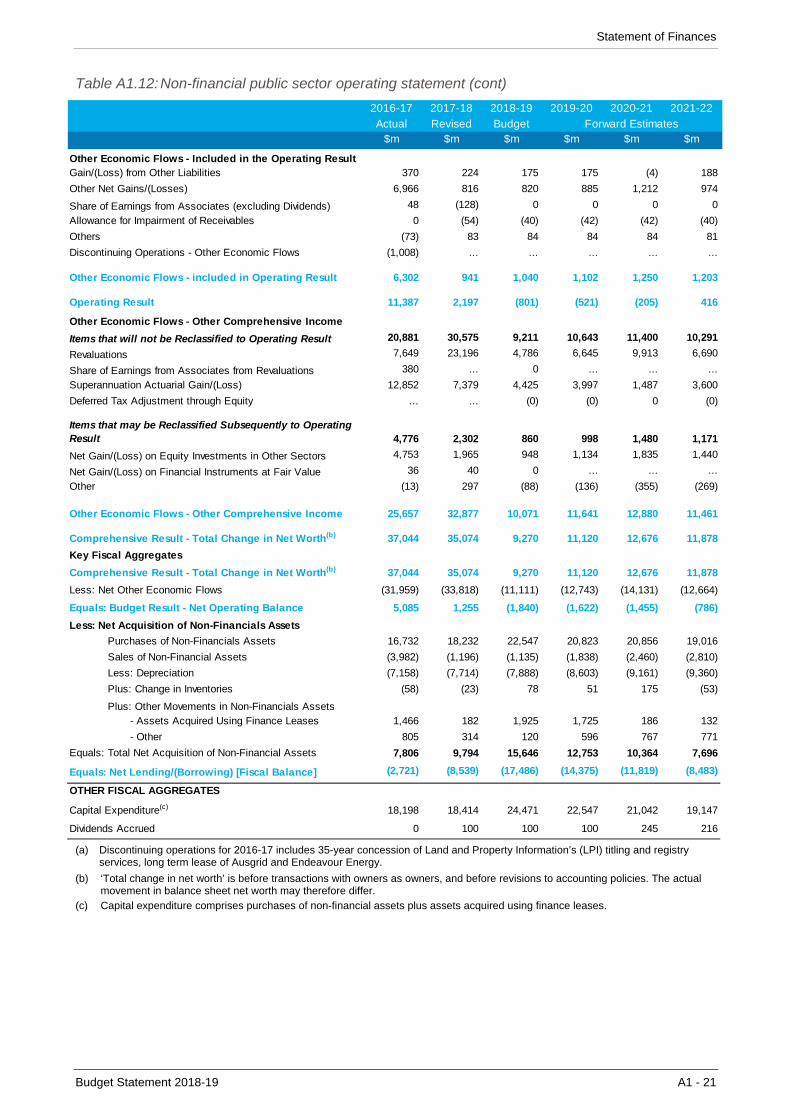
Statement of Finances
Budget Statement 2018-19 A1 - 21
Table A1.12: Non-financial public sector operating statement (cont)
2016-17 2017-18 2018-19 2019-20 2020-21 2021-22
Actual Revised Budget$m $m $m $m $m $m
Forward Estimates
Other Economic Flows - Included in the Operating ResultGain/(Loss) from Other Liabilities 370 224 175 175 (4) 188
Other Net Gains/(Losses) 6,966 816 820 885 1,212 974
Share of Earnings from Associates (excluding Dividends) 48 (128) 0 0 0 0
Allowance for Impairment of Receivables 0 (54) (40) (42) (42) (40)
Others (73) 83 84 84 84 81
Discontinuing Operations - Other Economic Flows (1,008) ... ... ... ... ...
Other Economic Flows - included in Operating Result 6,302 941 1,040 1,102 1,250 1,203
Operating Result 11,387 2,197 (801) (521) (205) 416
Other Economic Flows - Other Comprehensive Income
Items that will not be Reclassified to Operating Result 20,881 30,575 9,211 10,643 11,400 10,291
Revaluations 7,649 23,196 4,786 6,645 9,913 6,690
Share of Earnings from Associates from Revaluations 380 ... 0 ... ... ...
Superannuation Actuarial Gain/(Loss) 12,852 7,379 4,425 3,997 1,487 3,600
Deferred Tax Adjustment through Equity ... ... (0) (0) 0 (0)
Items that may be Reclassified Subsequently to Operating Result 4,776 2,302 860 998 1,480 1,171
Net Gain/(Loss) on Equity Investments in Other Sectors 4,753 1,965 948 1,134 1,835 1,440
Net Gain/(Loss) on Financial Instruments at Fair Value 36 40 0 ... ... ...
Other (13) 297 (88) (136) (355) (269)
Other Economic Flows - Other Comprehensive Income 25,657 32,877 10,071 11,641 12,880 11,461
Comprehensive Result - Total Change in Net Worth(b) 37,044 35,074 9,270 11,120 12,676 11,878
Key Fiscal Aggregates
Comprehensive Result - Total Change in Net Worth(b) 37,044 35,074 9,270 11,120 12,676 11,878
Less: Net Other Economic Flows (31,959) (33,818) (11,111) (12,743) (14,131) (12,664)
Equals: Budget Result - Net Operating Balance 5,085 1,255 (1,840) (1,622) (1,455) (786)
Less: Net Acquisition of Non-Financials Assets
Purchases of Non-Financials Assets 16,732 18,232 22,547 20,823 20,856 19,016
Sales of Non-Financial Assets (3,982) (1,196) (1,135) (1,838) (2,460) (2,810)
Less: Depreciation (7,158) (7,714) (7,888) (8,603) (9,161) (9,360)
Plus: Change in Inventories (58) (23) 78 51 175 (53)
Plus: Other Movements in Non-Financials Assets - Assets Acquired Using Finance Leases 1,466 182 1,925 1,725 186 132
- Other 805 314 120 596 767 771
Equals: Total Net Acquisition of Non-Financial Assets 7,806 9,794 15,646 12,753 10,364 7,696
Equals: Net Lending/(Borrowing) [Fiscal Balance] (2,721) (8,539) (17,486) (14,375) (11,819) (8,483)
OTHER FISCAL AGGREGATES
Capital Expenditure(c) 18,198 18,414 24,471 22,547 21,042 19,147
Dividends Accrued 0 100 100 100 245 216
(a) Discontinuing operations for 2016-17 includes 35-year concession of Land and Property Information’s (LPI) titling and registry services, long term lease of Ausgrid and Endeavour Energy.
(b) ‘Total change in net worth’ is before transactions with owners as owners, and before revisions to accounting policies. The actual movement in balance sheet net worth may therefore differ.
(c) Capital expenditure comprises purchases of non-financial assets plus assets acquired using finance leases.
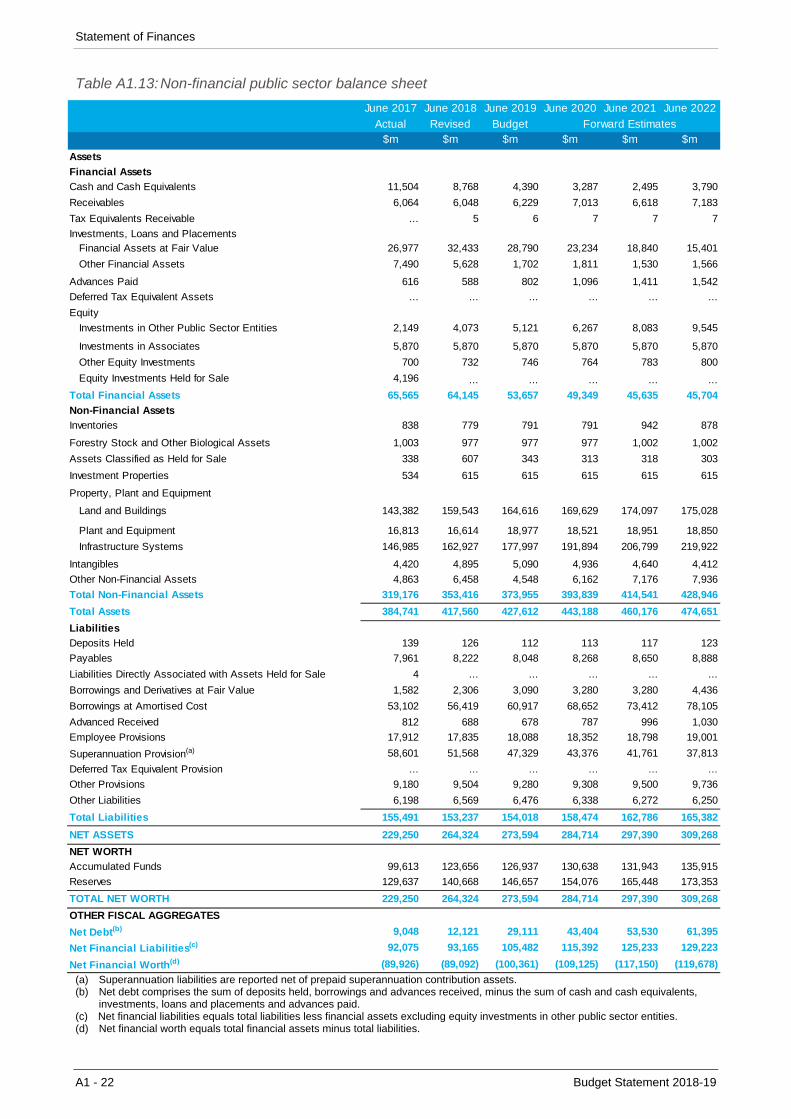
Statement of Finances
A1 - 22 Budget Statement 2018-19
Table A1.13: Non-financial public sector balance sheet
June 2017 June 2018 June 2019 June 2020 June 2021 June 2022
Actual Revised Budget$m $m $m $m $m $m
Assets
Financial Assets
Cash and Cash Equivalents 11,504 8,768 4,390 3,287 2,495 3,790
Receivables 6,064 6,048 6,229 7,013 6,618 7,183
Tax Equivalents Receivable ... 5 6 7 7 7
Investments, Loans and PlacementsFinancial Assets at Fair Value 26,977 32,433 28,790 23,234 18,840 15,401
Other Financial Assets 7,490 5,628 1,702 1,811 1,530 1,566
Advances Paid 616 588 802 1,096 1,411 1,542
Deferred Tax Equivalent Assets ... ... ... ... ... ...
Equity
Investments in Other Public Sector Entities 2,149 4,073 5,121 6,267 8,083 9,545
Investments in Associates 5,870 5,870 5,870 5,870 5,870 5,870
Other Equity Investments 700 732 746 764 783 800
Equity Investments Held for Sale 4,196 ... ... ... ... ...
Total Financial Assets 65,565 64,145 53,657 49,349 45,635 45,704
Non-Financial Assets
Inventories 838 779 791 791 942 878
Forestry Stock and Other Biological Assets 1,003 977 977 977 1,002 1,002
Assets Classified as Held for Sale 338 607 343 313 318 303
Investment Properties 534 615 615 615 615 615
Property, Plant and Equipment
Land and Buildings 143,382 159,543 164,616 169,629 174,097 175,028
Plant and Equipment 16,813 16,614 18,977 18,521 18,951 18,850
Infrastructure Systems 146,985 162,927 177,997 191,894 206,799 219,922
Intangibles 4,420 4,895 5,090 4,936 4,640 4,412
Other Non-Financial Assets 4,863 6,458 4,548 6,162 7,176 7,936
Total Non-Financial Assets 319,176 353,416 373,955 393,839 414,541 428,946
Total Assets 384,741 417,560 427,612 443,188 460,176 474,651
Liabilities
Deposits Held 139 126 112 113 117 123
Payables 7,961 8,222 8,048 8,268 8,650 8,888
Liabilities Directly Associated with Assets Held for Sale 4 ... ... ... ... ...
Borrowings and Derivatives at Fair Value 1,582 2,306 3,090 3,280 3,280 4,436
Borrowings at Amortised Cost 53,102 56,419 60,917 68,652 73,412 78,105
Advanced Received 812 688 678 787 996 1,030
Employee Provisions 17,912 17,835 18,088 18,352 18,798 19,001
Superannuation Provision(a) 58,601 51,568 47,329 43,376 41,761 37,813
Deferred Tax Equivalent Provision ... ... ... ... ... ...
Other Provisions 9,180 9,504 9,280 9,308 9,500 9,736
Other Liabilities 6,198 6,569 6,476 6,338 6,272 6,250
Total Liabilities 155,491 153,237 154,018 158,474 162,786 165,382
NET ASSETS 229,250 264,324 273,594 284,714 297,390 309,268
NET WORTH
Accumulated Funds 99,613 123,656 126,937 130,638 131,943 135,915
Reserves 129,637 140,668 146,657 154,076 165,448 173,353
TOTAL NET WORTH 229,250 264,324 273,594 284,714 297,390 309,268
OTHER FISCAL AGGREGATES
Net Debt(b) 9,048 12,121 29,111 43,404 53,530 61,395
Net Financial Liabilities(c) 92,075 93,165 105,482 115,392 125,233 129,223
Net Financial Worth(d) (89,926) (89,092) (100,361) (109,125) (117,150) (119,678)
Forward Estimates
(a) Superannuation liabilities are reported net of prepaid superannuation contribution assets. (b) Net debt comprises the sum of deposits held, borrowings and advances received, minus the sum of cash and cash equivalents,
investments, loans and placements and advances paid. (c) Net financial liabilities equals total liabilities less financial assets excluding equity investments in other public sector entities. (d) Net financial worth equals total financial assets minus total liabilities.

Statement of Finances
Budget Statement 2018-19 A1 - 23
Table A1.14: Non-financial public sector cash flow statement
2016-17 2017-18 2018-19 2019-20 2020-21 2021-22
Actual Revised Budget
$m $m $m $m $m $m
Cash Receipts from Operating Activities
Taxes Received 30,402 30,721 30,715 32,582 33,870 35,309
Receipts from Sales of Goods and Services 15,753 15,077 14,402 14,287 16,156 15,950
Grant and Subsidies Received 31,054 31,593 32,002 32,425 33,653 34,977
Interest Receipts 724 526 343 238 197 204
Dividends and Income Tax Equivalents 66 110 24 144 90 95
Other Receipts 12,236 10,069 10,412 10,755 9,432 8,680
Total Cash Receipts from Operating Activities 90,235 88,096 87,898 90,432 93,399 95,215
Cash Payments from Operating Activities
Payments for Employees (32,410) (33,503) (33,597) (35,392) (36,474) (37,592)
Payments for Superannuation (4,348) (4,498) (4,687) (4,796) (4,929) (5,183)
Payments for Goods and Services (24,011) (23,721) (24,115) (24,652) (25,113) (26,296)
Grants and Subsidies Paid (7,838) (9,136) (10,191) (10,867) (10,969) (10,509)
Interest Paid (2,958) (2,444) (2,533) (2,776) (3,181) (3,292)
Other Payments (6,764) (4,326) (4,883) (4,704) (3,871) (3,417)
Total Cash Payments from Operating Activities (78,329) (77,628) (80,006) (83,187) (84,538) (86,288)
Net Cash Flows from Operating Activities 11,906 10,468 7,892 7,244 8,860 8,927
Sales of Non-Financial Assets 3,737 1,279 1,217 1,927 2,459 2,810
Purchases of Non-Financial Assets (16,502) (18,073) (23,097) (21,231) (20,369) (18,507)
Net Cash Flows from Investments in Non-Financial Assets (12,765) (16,794) (21,880) (19,304) (17,909) (15,698)
Receipts 29,274 424 463 48 76 182
Payments (1,271) (132) (492) (225) (259) (277)
Net Cash Flows from Investments in Financial Assets for Policy Purposes 28,002 291 (29) (177) (183) (95)
Cash Flows from Investments in Financial Assets for Liquidity Purposes
Receipts from Sale/Maturity of Investments 21,194 14,292 12,863 8,045 6,566 4,860
Payments for Purchase of Investments (33,644) (13,044) (4,418) (1,910) (1,175) (829)
Net Cash Flows from Investments in Financial Assets for Liquidity Purposes (12,450) 1,248 8,445 6,135 5,391 4,031
Net Cash Flows from Investing Activities 2,788 (15,255) (13,464) (13,346) (12,701) (11,762)
Cash Flows from Financing Activities
Advances Received 913 7 84 221 227 34
Advances Repaid (70) (170) (198) (203) (161) (55)
Proceeds from Borrowings 6,127 4,214 2,258 6,375 5,352 5,593
Repayment of Borrowings (18,292) (1,947) (842) (1,315) (2,159) (1,241)
Dividends Paid 0 (100) (100) (100) (245) (216)
Deposits Received (net) (22) (13) (14) 1 4 6
Other Financing Receipts/ (Payments) (1) 0 0 0 0 0
Net Cash Flows from Financing Activities (11,344) 1,991 1,187 4,979 3,018 4,121
Net Increase/(Decrease) in Cash Held 3,350 (2,796) (4,385) (1,123) (823) 1,286
Derivation of Cash Result
Net Cash Flows from Operating Activities 11,906 10,468 7,892 7,244 8,860 8,927
Net Cash Flows from Investments in Non-Financial Assets (12,765) (16,794) (21,880) (19,304) (17,909) (15,698)
Dividends Paid 0 (100) (100) (100) (245) (216)
Cash Surplus/(Deficit) (859) (6,426) (14,088) (12,160) (9,294) (6,987)
Cash Flows from Investments in Non-Financial Assets
Cash Flows from Investments in Financial Assets for Policy Purposes
Forward Estimates
Budget Statement 2018-19 A2 - 1
A2. STATEMENT OF SIGNIFICANT ACCOUNTING POLICIES AND FORECAST ASSUMPTIONS
Scope of the Estimated Financial Statements
The budget papers present the Estimated Financial Statements of the general government sector (GGS), including revised estimates for the current year ending 30 June 2018, and estimates for the budget year ending 30 June 2019 and the three forward years ending 30 June 2020, 2021 and 2022.
These comprise the GGS operating statement, GGS balance sheet and GGS cash flow statement. These are prepared in accordance with this Statement of Significant Accounting Policies and Forecast Assumptions.
Collectively, the statements and the Statement of Significant Accounting Policies and Forecast Assumptions are referred to as the ‘Estimated Financial Statements’.
The Estimated Financial Statements are prepared for the NSW GGS, which is determined in accordance with the principles and rules contained in the Australian Bureau of Statistics, Australian System of Government Finance Statistics: Concepts, Sources and Methods 2015 (cat. No. 5514) (ABS-GFS Manual) as amended from time to time.
The GGS comprises government agencies controlled by the State that:
undertake regulatory functions
redistribute income and wealth
provide or distribute goods and services on a non-market basis to individuals and the community and/or
provide other services to general government agencies.
The scope of the GGS is outlined in Appendix A3 of this Budget Statement.
Basis of preparation
The Estimated Financial Statements are prepared using the accrual basis of accounting, which recognises the effect of transactions and events when they are forecast to occur.
They have been prepared in these budget papers to reflect existing operations and the impact of new policy decisions taken by the NSW Government (where their financial effect can be reliably measured). The 2017-18 revised estimates are based on actual results for the 10 months period ending 30 April 2018, and updated year end projections provided by agencies. They have also been prepared to take into account other economic and financial data available to Treasury up to 13 June 2018, including Commonwealth Government funding decisions announced in the 2018-19 Commonwealth Government Budget.
In keeping with these principles, where the impact of a policy decision or planned event cannot be reliably estimated, the impact is not reflected within the Estimated Financial Statements (e.g. due to uncertainties regarding the timing and amount of future cash flows).

Statement of Significant Accounting Policies and Forecast Assumptions
A2 - 2 Budget Statement 2019-19
Any estimates or assumptions made in measuring revenue, expenses, other economic flows, assets or liabilities are based on the latest information available at the time, professional judgements derived from experience and other factors considered to be reasonable under the circumstances. Actual results may differ from such estimates. Key assumptions are detailed below, under the headings Material economic and other assumptions and Summary of other key assumptions.
Accounting policies
Australian Accounting Standards (AAS) do not include requirements or provide guidance on the preparation or presentation of prospective financial statements. However, recognition and measurement principles within AAS have been applied in the presentation of the Estimated Financial Statements to the maximum extent possible.
The Estimated Financial Statements do not include the impact of major asset transactions until they are finalised. The financial impact of these future planned discontinuing operations or restructuring transactions are not recognised due to the commercial-in-confidence nature of these transactions.
The Estimated Financial Statements adopt the accounting policies expected to be used in preparing general purpose financial statements for 2017-18. Except for the change in the revenue recognition policy for government-assessed tax revenue as discussed below, the policies are not materially different from those applied in the Total State Sector Accounts 2016-17. Note 1 of the audited 2016-17 Total State Sector Accounts sets out the significant accounting policies, including the principles of consolidation, significant accounting judgements and estimates, and the recognition and measurement policies for revenue, expenses, other economic flows, assets and liabilities.
Change in accounting policies
The existing accounting policy for government-assessed tax revenue is to recognise revenue at the time assessments are made. This has now been changed to recognising government-assessed revenue when the underlying event that results in a right to receive revenue has occurred and assessments have been issued, or when the amount can be reliably measured. The change has been made to better reflect the underlying events that give rise to control of the associated economic benefits, in accordance with AASB 1004 Contributions (AASB 1004).
The main impact of this change in accounting policy relates to the Emergency Services Levy received from insurers. Following the introduction of the Emergency Services Levy Act 2017, initial assessments are now issued in the financial year preceding the year in which the relevant insurers’ premiums are earned. A final assessment is issued in the year following the year in which the relevant insurers’ premiums are earned.
Application of the previous accounting policy would have led to the recognition of an additional $0.8bn of revenue relating to 2018-19 insurers’ premiums being recorded in 2017-18 when the initial assessment is made.
The change in accounting policy has reduced revenue from transactions – taxation by $0.8 billion for 2017-18. In subsequent years, insurers’ premiums would have been recorded one year earlier under the previous accounting policy, meaning the impact of the change is not as significant (increases/(decreases) of 2018-19: -$40 million, 2019-20: $40 million, 2020-21: -$60 million, 2021-22: $40 million). The (decreases)/increases in revenue also (decrease)/increase other line items in the operating statement, including total revenue from transactions; budget result - surplus/(deficit); operating result; comprehensive result - total change in net worth; and net lending/(borrowing).
Statement of Significant Accounting Policies and Forecast Assumptions
Budget Statement 2018-19 A2 - 3
The (decreases)/increases in revenue have a corresponding impact on receivables, as well as total financial assets and total assets.
Revenue reported in prior periods is not impacted by the change in accounting policy because under the previous legislation, Emergency Services Levy assessments were raised in the relevant tax year.
Except for the above change in revenue recognition policy, there are no other significant changes to AAS or accounting policies adopted in 2018-19 that would significantly impact on the Estimated Financial Statements.
New Accounting Standards issued but not effective
AASB 9 Financial Instruments and AASB 2014-7 Amendments to Australian Accounting Standards arising from AASB 9 (December 2014)
– AASB 9 Financial Instruments (AASB 9) is effective from reporting periods commencing on or after 1 January 2018. AASB 9 addresses the classification, measurement and derecognition of financial assets and financial liabilities, introduces new rules for hedge accounting and a new impairment model for financial assets.
– The impact on the State’s statement of financial position overall is not expected to be significant.
AASB 15 Revenue from Contracts with Customers and AASB 2014-5 Amendments to Australian Accounting Standards arising from AASB 15
– AASB 15 Revenue from Contracts with Customers (AASB 15) is effective from reporting periods commencing on or after 1 January 2018 for for-profit entities and on or after 1 January 2019 for not-for-profit entities. AASB 15 establishes a five-step model to account for revenue arising from contracts with customers. Under AASB 15, revenue is recognised at an amount that reflects the consideration to which an entity expects to be entitled in exchange for transferring goods or services to a customer.
– Some revenue streams may be impacted by AASB 15 to varying degrees. In particular, the application of AASB 15 may result in the identification of separate performance obligations that could change the timing of the recognition of revenue. The estimated impact of AASB 15 on future estimated financial statements has not been sufficiently quantified at this stage.
AASB 1058 Income of Not-for-Profits
– AASB 1058 Income of Not-for-Profits (AASB 1058) is effective for reporting periods commencing on or after 1 January 2019 and will replace most of the existing requirements in AASB 1004. The scope of AASB 1004 is now limited mainly to parliamentary appropriations, administrative arrangements and contributions by owners.
– Under AASB 15, not-for profit entities will need to determine whether a transaction is a donation (accounted for under AASB 1058) or a contract with a customer (accounted for under AASB 15). The estimated impact of AASB 1058 on future estimated financial statements has not been sufficiently quantified at this stage.
AASB 16 Leases
– AASB 16 Leases (AASB 16) is effective from reporting periods commencing on or after 1 January 2019. For lessees, AASB 16 will result in most leases being recognised on the statement of financial position, as the distinction between operating and finance leases is largely removed. Under the new standard, an asset (the right to use the leased item) and a financial liability to pay rentals are recognised at the commencement of the lease. The only exceptions are short-term and low-value leases. The accounting for lessors will not significantly change.
Statement of Significant Accounting Policies and Forecast Assumptions
A2 - 4 Budget Statement 2018-19
– AASB 16 will therefore increase assets and liabilities reported on the balance sheet. It will also increase depreciation and amortisation and interest expenses, and reduce operating lease rental expenses. The estimated impact of AASB 16 on future estimated financial statements has not been sufficiently quantified at this stage.
AASB 1059 Service Concession Arrangements: Grantors
– AASB 1059 Service Concession Arrangements: Grantors (AASB 1059) is effective from reporting periods commencing on or after 1 January 2019. Service concession arrangements (SCA) involve a private sector entity operating a service concession asset to deliver public services on behalf of a public sector grantor.
– Currently, under TPP 06-8 Privately Financed Projects (TPP 06-8), most SCA in New South Wales are generally treated as leases or as assets gradually recognised over the concession period.
– AASB 1059 will require service concession assets to be recognised immediately at the start of the arrangement, with a corresponding liability to reflect any payments due, and/or the grant of a right, to the operator. Further, AASB 1059 has a broader scope than TPP 06-8, possibly resulting in more arrangements being recognised in the State’s statement of financial position.
– These changes are expected to significantly increase assets and liabilities in the State’s statement of financial position and impact in the operating statement depreciation and amortisation expenses and income from the amortisation of grant of right liability. The estimated impact of AASB 1059 on future estimated financial statements has not been sufficiently identified and quantified at this stage.
There are no other standards that are not yet effective and that would be expected to have a material impact on the estimated financial statements.
Presentation of the Estimated Financial Statements
The Estimated Financial Statements follow the presentation requirements for GGS reporting contained in AASB1049 Whole of Government and General Government Sector Financial Reporting (AASB 1049).
AASB 1049 harmonises generally accepted accounting principles (GAAP, ie. AAS) with Government Financial Statistics (GFS) principles in accordance with the GFS framework adopted by the Australian Bureau of Statistics . This occurs by requiring that the statement of comprehensive income (referred to as the operating statement) classifies income and expenses as either transactions or other economic flows to be consistent with GFS principles, applied from a GAAP perspective.
The net operating balance (i.e. the budget result) is the net result of harmonised GFS-GAAP transactions for the GGS.
In the operating statement:
the net operating balance is the net result of revenue and expenses from transactions. It excludes other economic flows, which represent changes in the volume or value of assets or liabilities that do not arise from transactions with other entities and which are often outside the control of government
the operating result is the same under both the harmonised GFS-GAAP and pure GAAP presentations.

Statement of Significant Accounting Policies and Forecast Assumptions
Budget Statement 2018-19 A2 - 5
Further, AASB 1049 requires:
the GGS financial statements adopt the recognition, measurement and disclosure requirements of GAAP
where options exist in GAAP, the GGS financial statements adopt the option that is aligned with GFS, to minimise differences between GAAP and GFS and/or
where options do not exist in GAAP and there is conflict between GAAP and GFS, GAAP prevails.
Due to the prospective nature of the statements, detailed notes to the Estimated Financial Statements are not required to be presented within the meaning of AAS as outlined in Section 27A (5) of the Public Finance and Audit Act 1983.
Each year ends on 30 June, all monetary amounts are presented in Australian dollars and rounded to the nearest million dollars ($m).
Use of a zero (“0”) represents amounts rounded to zero. Use of three dots (“…”) represents nil amounts.
Tables may not add in all instances due to rounding to the nearest million dollars.
Presentation changes
There have been no presentation changes since the release of the 2017-18 Budget Papers. The presentation of information in the financial estimates remains consistent with GAAP and GFS presentation requirements.
Definitions
Key technical terms, including fiscal aggregates, are defined in the Glossary to this Budget Statement.
Material economic and other assumptions
The Estimated Financial Statements have been prepared using the material economic and other assumptions as set out in Table A2.1.
Table A2.1: Key economic performance assumptions(a)
2016-17 2017-18 2018-19 2019-20 2020-21 2021-22
Outcomes Forecasts Forecasts Forecasts Projections Projections
New South Wales population (persons)(b) 7,861,000 7,988,000 8,112,000 8,233,000 8,352,000 8,467,000
Nominal gross state product ($million) 576,700 606,000 630,400 658,000 690,000 724,400
Real gross state product (per cent) 2.9 3 2¾ 2¾ 2½ 2½
Real state final demand (per cent) 3.9 3¾ 3 3 - -
Employment (per cent) 1.0 3 1¾ 1½ 1¼ 1¼
Unemployment rate (per cent)(c) 5.0 4¾ 4¾ 4¾ 4¾ 4¾
Sydney consumer price index (per cent)(d) 1.8 1¾ 2 2 2¼ 2½
Wage price index (per cent)(e) 2.0 2 2½ 2¾ 3 3¼
Nominal gross state product (per cent) 6.4 5 4 4½ 5 5
(a) Per cent change, year average, unless otherwise indicated. (b) As at 30 June each year. (c) Year average, per cent. (d) 2017-18 to 2021-22 excludes ¼ percentage point from tobacco excise increases. (e) Weighted private and public sector wages.
Source: ABS 3101.0, 5206.0, 5220.0, 6202.0, 6401.0, 6345.0 and Treasury

Statement of Significant Accounting Policies and Forecast Assumptions
A2 - 6 Budget Statement 2018-19
Summary of other key assumptions
The following section outlines the other key assumptions used in the preparation of the Estimated Financial Statements. The summary takes into account materiality in relation to the GGS’s overall financial position and sensitivity to changes in key economic assumptions.
Notwithstanding these key assumptions, agency finance officers apply appropriate professional judgement in determining estimated financial information.
Revenue from transactions
Taxation
Taxation revenue is forecast by assessing economic and other factors that influence the various taxation bases. Payroll tax, for example, involves an assessment of the outlook for employment and wages. Forecasts of government debt guarantee fees take into account an assessment of the level of debt of PNFCs and their credit rating differential compared with the State as a whole. The forecasts of taxation revenue also involve the analysis of historical information and relationships (using econometric and other statistical methods) and consultation with relevant government agencies.
Grants and subsidies revenue
Forecast grants from the Commonwealth Government are based on the latest available information from the Commonwealth Government and projections of timing of payments at the time of preparation of the Budget. This takes into account the conditions, payment timetable and escalation factors relevant to each type of grant.
The Goods and Services Tax (GST) grants are forecast based on estimates of the national GST pool by the Commonwealth Government. For 2018-19, the GST forecast is based on the assessed relativity for New South Wales in 2018-19 and the Commonwealth Government’s population projections. The assessed relativity is based on the three-year average of actual data (2014-15, 2015-16 and 2016-17) as published by the Commonwealth Grants Commission.
Beyond 2018-19, the State’s share of GST is based on New South Wales’ forecast relativities and the Commonwealth’s GST pool and population projections. The forecast per capita annual relativities are based on the projected fiscal capacity of New South Wales compared to other States and Territories.
Sale of goods and services
Revenue from the sale of goods and services is forecast by taking into account all known factors, including estimates of changes in demand for services provided or expected unit price variations based on proposed fee increases imposed by general government agencies and/or indexation.
Dividend and income tax equivalents from other sectors
Dividend and income tax equivalent revenue from other sectors are estimated by PNFC and PFC sectors based on expected profitability and the agreed dividend policy at the time of the Budget.

Statement of Significant Accounting Policies and Forecast Assumptions
Budget Statement 2018-19 A2 - 7
Other dividends and distributions
Other dividends include estimates of dividends to be received from investments in entities other than the PNFC and PFC sectors, with the revenue recognised when the right to receive payment is expected to be established. Estimates are based on advice from external parties.
Distributions are mainly from managed fund investments administered by TCorp, with the revenue recognised when the right to receive payment is expected to be established based on advice from TCorp. It excludes estimated fair value movements in the unit price of the investments, which are recognised as ‘other economic flows – included in the operating result’.
Fines, regulatory fees and other revenues
Fines, regulatory fees and other revenues include estimates of fines issued by the Courts, estimated traffic infringement fines, estimated revenue from enforcement orders, and regulatory fees and contributions. It also includes estimated royalty revenue based on assessments of coal volumes and prices, and the Australian dollar exchange rate. Other revenue forecasts are adjusted for indexation where appropriate.
Expenses from transactions
To improve the accuracy of budget estimates, consistent with longstanding practice and reflecting historic trends, the Budget includes adjustments:
to account for parameter and technical adjustments expected to be required to maintain service provision on a no policy change basis reflecting the historic conservative bias in aggregate spending estimates
to account for expenses expected to be carried forward into future years reflecting changes in timing of delivery of government activity, consistent with the policy set out in Treasury Circular NSW TC 15-08 and
to reflect government decisions that are not yet included in agency estimates, for example due to timing or because they are commercial in confidence or subject to further requirements.
Employee expenses
Employee expenses are forecast based on expected staffing profiles, current salaries, conditions and on-costs. Employee expenses are adjusted over the forecast period for approved wage agreements. Beyond the period of the agreements, allowance is made for further adjustments consistent with the State’s wages policy at a net cost of 2.5 per cent per annum, inclusive of scheduled increases in the superannuation guarantee levy. The forecasts for employee expenses also reflect the impact of newly approved initiatives and required efficiency savings.
Superannuation expense (and liabilities)
Superannuation expense comprises:
for the defined contribution plan, the forecast accrued contribution for the period
for defined benefit plans, the forecast service cost and the net interest expense. This excludes the re-measurements, (i.e. actuarial gains and losses, and return on plan assets in excess of the long-term Commonwealth Government Securities (CGS) rate) which are classified as ‘other economic flows – other comprehensive income’.

Statement of Significant Accounting Policies and Forecast Assumptions
A2 - 8 Budget Statement 2018-19
Superannuation expenses for defined contribution plans are based on assumptions regarding future salaries and contribution rates.
Superannuation expenses for defined benefit plans are estimated based on actuarial advice, applying the long-term CGS yield as at 30 June in the prior year to the opening value of net liabilities (gross superannuation liabilities less assets), less benefit payments at the mid-point of the contribution year, plus any accruing liability for the year.
Forecasts of defined benefit superannuation liabilities are based on actuarial estimates of cash flows for the various defined benefit superannuation schemes, discounted using a nominal long-term CGS yield as at 30 June. Gross liability estimates are based on a number of demographic and financial assumptions.
The table below sets out the major financial assumptions used to estimate the superannuation expense and liability in respect of defined benefit superannuation for the Budget and forward estimates period.
Table A2.2: Superannuation assumptions – pooled fund / state super schemes
2017-18 2018-19 2019-20 2020-21 2021-22 % % % % %
Liability discount rate 3.02 3.28 3.53 3.53 3.79
Expected return on investments 7.36 7.40 7.40 7.40 7.40
Expected salary increases 2.70 2.70 3.20 3.20 3.20
Expected rate of CPI 2.25 2.25 2.25 2.50 2.50
Depreciation and amortisation
Property, plant and equipment are depreciated (net of residual value) over their respective useful lives. Depreciation is generally allocated on a straight-line basis.
Depreciation is forecast on the basis of known asset carrying valuations, the expected economic life of assets, assumed new asset investment and asset sale programs. The depreciation expense is based on the assumption that there will be no change in depreciation rates over the forecast period, but includes the estimated impact of the current and future revaluation of assets over the forecast period. The depreciation expense may also be impacted by future changes in useful lives, carrying value, residual value or valuation methodology.
Certain heritage assets, including original artworks and collections and heritage buildings, may not have limited useful lives because appropriate custodial and preservation policies are adopted. Such assets are not subject to depreciation. Land is not a depreciable asset.
Intangible assets with finite lives are amortised under the straight-line method. Intangible assets with indefinite lives are not amortised, but tested for impairment annually.
Interest expense
The forecasts for interest expense are based on:
payments required on outstanding borrowings
expected payments on any new borrowings (including any refinancing of existing borrowings) required to finance general government activities based on forward contracts for TCorp bonds and
the unwinding of discounts on non-employee provisions.
Statement of Significant Accounting Policies and Forecast Assumptions
Budget Statement 2018-19 A2 - 9
Other operating expenses
Other operating expenses mainly represent the day-to-day running costs incurred in the normal operations of agencies and include the cost of supplies and services. They are forecast by applying appropriate economic parameters and known activity changes, including planned changes in the method of service delivery and the application of government policies. Other operating expenses also reflect the impact of government efficiency strategies, such as efficiency dividends.
Grants and subsidies expense
Grants and subsidies expenses generally comprise cash contributions to local government authorities and non-government organisations. For the GGS, they include grants and subsidies paid to the PNFC and PFC sectors. The forecast grant payments are determined by taking into account current and past policy decisions, the forecast payment schedules and escalation factors relevant to each type of grant.
Other economic flows
Revaluations
The estimates are based on an examination and extrapolation of historical trends in the valuation of property, plant and equipment. The forward estimates include the estimated impact of revaluations of property, plant and equipment.
Superannuation actuarial gains / losses
The forecast actuarial gains or losses on defined benefit superannuation are based on the revised estimates of the margin of forecast fund earnings in excess of the expected discount rate.
Net gain / (loss) on equity investments in other sectors
The net gain / (loss) on equity investments in other sectors is based on estimates of the PNFC and PFC sectors’ forward comprehensive results adjusted for transactions with owners. The underlying management estimates of future comprehensive results are based on current Statements of Corporate Intent. Future distributions to owners are based on Treasury’s Commercial Policy Framework.
Net acquisition of non-financial assets
Sale of non-financial assets
Sale of non-financial assets includes the proceeds from the sale of an intangible asset recognised upfront in GFS, but amortised over the term of the arrangement for GAAP. This is presented consistently in the cash flow statement.
Statement of Significant Accounting Policies and Forecast Assumptions
A2 - 10 Budget Statement 2018-19
Assets
Property, plant and equipment
The estimates of property, plant and equipment over the forecast period are at fair value and take into account planned acquisitions, disposals, and the impact of depreciation, impairment and revaluations. New investments in assets are valued at the forecast purchase price and, where appropriate, recognised progressively over the estimated construction period. The forward estimates include the estimated impact of revaluations of property, plant and equipment. These estimates are based on an examination of expected cost trends.
The Estimated Financial Statements also include adjustments for future capital expenditure. These include agency estimates of approved projects and future new works held within agencies, as well as a central estimate for future new works still to be approved at the agency level. The central estimate for future new works is based upon historical trends.
Liabilities
Borrowings
Estimates for borrowings are based on current debt levels, amortisation of any premiums or discounts, and the cash flows expected to be required to fund future government activities.
Employee provisions
Employee provisions are forecast based on expected staffing profiles and current salaries, conditions and on-costs. For the forecast period, employee benefits are adjusted for approved wage agreements. Beyond the period of the agreements, allowance is made for further adjustments consistent with the State’s wages policy at a net cost of 2.5 per cent per annum, inclusive of scheduled increases in the superannuation guarantee levy. The forecasts for employee expenses also reflect the impact of new initiatives and required efficiency savings.
Superannuation provisions
Refer to Superannuation expense (and liabilities) (above) for information on assumptions that also impact the measurement of the superannuation provisions.
Other provisions
Other provisions include the State’s obligations for several insurance schemes. To estimate future claim liabilities, actuarial assumptions have been applied for future claims to be incurred, claim payments, inflation and liability discount rates. Actual liabilities may differ from estimates.
Budget Statement 2018-19 A3 - 1
A3. CLASSIFICATION OF AGENCIES
The financial activities of all governments are measured using the government finance statistics (GFS) framework.1 All entities controlled by governments are classified into sectors according to the nature of their activities and funding arrangements.
For financial reporting and policy framework purposes, NSW Treasury classifies each NSW Government entity under one of three sectors:
general government sector
public non-financial corporations
public financial corporations.
Together, these sectors make up the total state sector. This is not a GFS term, but it is used to describe the scope of all government activities representing the total state.
The nature of each sector as it relates to NSW Government entities is as follows:
General
government sector
The general government sector represents the scope of the Budget. Agencies in this sector
generally operate under the Financial Management Framework and carry out policy,
regulatory and service delivery functions. This sector includes agencies such as the Ministry
of Health, Department of Education, NSW Police Force, Rental Bond Board and Independent
Pricing and Regulatory Tribunal.
‘General government sector’ is defined under GFS as the institutional sector comprising all
government units and non-profit institutions controlled by the Government.
Public non-financial
corporations sector
Agencies in this sector are either commercial or non-commercial.
Commercial enterprises generally operate under the Commercial Policy Framework, which
aims to replicate disciplines and incentives that drive the efficient commercial practices of
private sector businesses. They deliver services to a customer base from which they receive
their income. They generally pay dividends and tax-equivalent payments to the general
government sector. These agencies include State-owned Corporations such as energy
distribution corporations and the Sydney Water and Hunter Water Corporations.
Non-commercial enterprises address important social objectives and levy charges for
services to client groups on a subsidised basis. This includes the New South Wales Land and
Housing Corporation, which receives substantial grants from the general government sector
to provide these services.
‘Public non-financial corporations sector’ is defined under GFS as resident government
controlled corporations and quasi-corporations mainly engaged in the production of market
goods and/or non-financial services.
Public financial
corporations sector
These agencies are involved in financial services and generally operate under the
Commercial Policy Framework. They include the New South Wales Treasury Corporation and
Insurance and Care NSW.
‘Public financial corporations sector’ is defined under GFS as resident government controlled
operations and quasi-corporations mainly engaged in financial intermediation or provision of
auxiliary financial services.
1 Australian Bureau of Statistics, Australian System of Government Finance Statistics: Concepts, Sources and Methods,
2015 Cat No. 5514.0, ABS, Canberra.

Classification of Agencies
A3 - 2 Budget Statement 2018-19
The following table lists all entities considered material for the whole-of-government purposes which are controlled by the NSW Government and the GFS sectors under which they are classified2. In addition, balance sheet estimates shown in Budget Paper No. 1 include an estimate of the impact of small entities controlled by the NSW Government and not considered material for the whole-of-government purposes.
Table A3.1: Classification of agencies by sector
Material Agencies General
government sector
Public non-financial
corporations sector
Public financial
corporations sector
Aboriginal Housing Office
Alpha Distribution Ministerial Holding Corporation
Art Gallery of New South Wales Trust
Audit Office of New South Wales
Australian Museum
Barangaroo Delivery Authority
Building Insurers’ Guarantee Corporation
Centennial Park and Moore Park Trust
Cobbora Holding Company Pty Ltd
Crown Finance Entity
Crown Solicitor's Office
Department of Education
Department of Family and Community Services
Department of Finance, Services and Innovation
Department of Industry
Department of Justice
Department of Planning and Environment
Department of Premier and Cabinet
Destination NSW
Electricity Assets Ministerial Holding Corporation
Electricity Retained Interest Corporation - Ausgrid
Electricity Retained Interest Corporation – Endeavour Energy
Electricity Transmission Ministerial Holding Corporation
Epsilon Distribution Ministerial Holding Corporation
Environment Protection Authority
Environmental Trust
Essential Energy
Fair Trading Administration Corporation Fire and Rescue NSW
First Australian Mortgage Acceptance Corporation (FANMAC) Trusts Forestry Corporation of New South Wales
Greater Sydney Commission
Health Care Complaints Commission
Historic Houses Trust of New South Wales
Home Purchase Assistance Fund
Hunter Development Corporation
Hunter Water Corporation
Independent Commission Against Corruption
Independent Liquor and Gaming Authority
Independent Pricing and Regulatory Tribunal
2 This reflects the structure of the NSW Public Sector to take effect from 1 July 2018 consistent with recent
Administrative Arrangements orders. For more information on any machinery of government changes see ‘About this Budget Paper’ in Budget Paper No.3 Budget Estimates.

Classification of Agencies
Budget Statement 2018-19 A3 - 3
Table A3.1: Classification of agencies by sector (cont)
Material Agencies General
government sector
Public non-financial
corporations sector
Public financial
corporations sector
Information and Privacy Commission
Infrastructure NSW
Insurance and Care NSW Judicial Commission of New South Wales
Landcom (trading as UrbanGrowth NSW)
Law Enforcement Conduct Commission (Replaced the Police Integrity Commission from 1 July 2017)
Legal Aid Commission of New South Wales
Liability Management Ministerial Corporation
Lifetime Care and Support Authority of New South Wales Local Land Services
Long Service Corporation
Luna Park Reserve Trust
Mental Health Commission of New South Wales
Ministry of Health
Multicultural NSW
Museum of Applied Arts and Sciences
Natural Resources Commission
New South Wales Crime Commission
New South Wales Electoral Commission
New South Wales Government Telecommunications Authority
New South Wales Land and Housing Corporation
New South Wales Rural Assistance Authority
New South Wales Treasury Corporation Newcastle Port Corporation
NSW Education Standards
NSW Food Authority
NSW Police Force
NSW Self Insurance Corporation
NSW Trains
NSW Trustee and Guardian
Office of Environment and Heritage
Office of Local Government
Office of Sport
Office of the Children's Guardian
Office of the Director of Public Prosecutions
Office of the NSW Rural Fire Service
Office of the NSW State Emergency Service
Office of Transport Safety Investigations
Ombudsman’s Office
Parliamentary Counsel’s Office
Place Management NSW
Planning Ministerial Corporation
Ports Assets Ministerial Holding Corporation
Property NSW
Public Service Commission
Rail Corporation New South Wales
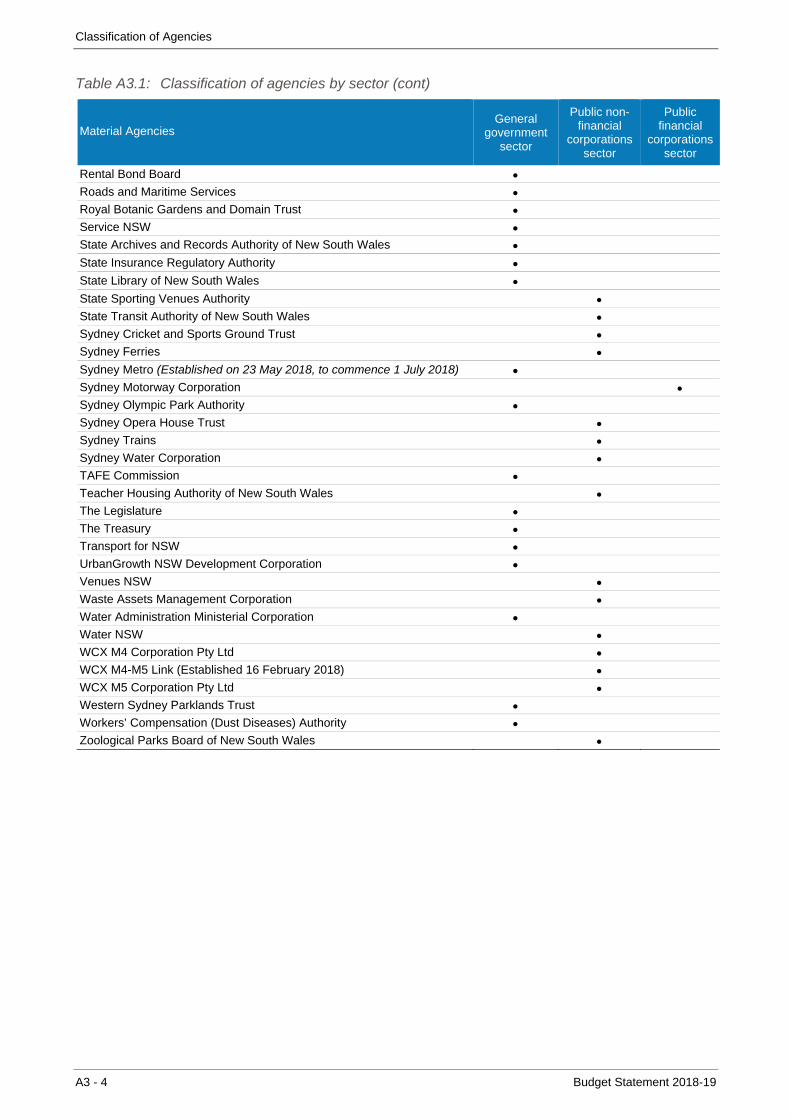
Classification of Agencies
A3 - 4 Budget Statement 2018-19
Table A3.1: Classification of agencies by sector (cont)
Material Agencies General
government sector
Public non-financial
corporations sector
Public financial
corporations sector
Rental Bond Board
Roads and Maritime Services
Royal Botanic Gardens and Domain Trust
Service NSW
State Archives and Records Authority of New South Wales
State Insurance Regulatory Authority
State Library of New South Wales
State Sporting Venues Authority
State Transit Authority of New South Wales
Sydney Cricket and Sports Ground Trust
Sydney Ferries
Sydney Metro (Established on 23 May 2018, to commence 1 July 2018)
Sydney Motorway Corporation Sydney Olympic Park Authority
Sydney Opera House Trust
Sydney Trains
Sydney Water Corporation
TAFE Commission
Teacher Housing Authority of New South Wales
The Legislature
The Treasury
Transport for NSW
UrbanGrowth NSW Development Corporation
Venues NSW
Waste Assets Management Corporation
Water Administration Ministerial Corporation
Water NSW
WCX M4 Corporation Pty Ltd
WCX M4-M5 Link (Established 16 February 2018)
WCX M5 Corporation Pty Ltd
Western Sydney Parklands Trust
Workers’ Compensation (Dust Diseases) Authority
Zoological Parks Board of New South Wales
Budget Statement 2018-19 A4 - 1
A4. 2017-18 BUDGET – OUTCOME AND SUMMARY OF VARIATIONS
Budget outcome for 2017-18
The Budget result for 2017-18 is estimated to be a surplus of $3.9 billion compared with an original budget surplus of $2.7 billion.
Total revenue is estimated to be $80.5 billion which is $0.6 billion or 0.8 per cent higher than the original budget estimate of $79.9 billion.
Total expenses are estimated to be $76.5 billion which is $0.7 billion or 0.9 per cent lower than the original budget estimate of $77.2 billion.
A detailed explanation of revenue and expense variances by line item is set out in the attached table.

2017-18 Budget – Outcome and Summary of Variations
A4 - 2 Budget Statement 2018-19
Table A4.1: Summary of variations
Category/Agency Budget Revised Variation Comment on Major Variations
$m $m $m
REVENUE FROM TRANSACTIONS
Taxation Stamp Duty 11,460 10,499 (961) Lower than expected growth in property
market transaction volumes and prices, and a significant shift in the composition of transactions away from investors and toward first home buyers.
Land Tax 3,685 3,833 148 Growth in land values supported by the three year averages utilised for land valuation assessments.
Payroll Tax 8,635 8,786 151 Stronger than expected employment growth, particularly in full-time employment.
Motor Vehicle Taxes 2,616 2,657 41 Small variances in motor vehicle registrations and weight tax.
Waste and Environment Levy 565 727 162 Higher than expected revenue from the Waste and Environment Levy due to strong construction sector activity.
Other Duties and Taxes 4,599 4,662 63 Aggregated net minor variances.
Total Taxation 31,560 31,164 (396)
Commonwealth Grants
General Purpose Grants
GST Revenue Grants 17,554 17,895 341 The increase in GST revenue has been driven by growth in the GST pool.
Other General Purpose Grants 38 26 (12) Variance to the Snowy Hydro Limited tax compensation.
Total General Purpose Grants 17,592 17,921 329
National Agreements
Other National Agreements 9,824 9,747 (77) Aggregated net minor variances.
Total National Agreements 9,824 9,747 (77)
National Partnership Payments
Transport for NSW 2,009 1,603 (406) Commonwealth Government transport contributions deferred to the forward estimates primarily to 2019-20 in relation to Western Sydney Roads.
Crown Finance Entity 848 951 103 Natural Disasters Relief financial support from the Commonwealth.
Other National Partnership Payments 614 719 106 Aggregated net minor variances.
Total National Partnership Payments 3,470 3,273 (197)
Other Commonwealth Payments 251 430 179
Other Grants and Subsidies
Department of Education 389 6 (382) Reclassification from Other Grants and Subsidies to Sale of Goods and Services and Other Revenue.
Other Grants and Subsidies 334 447 113 Aggregated net minor variances.
Total Other Grants and Subsidies 723 453 (270)
Total Grants and Subsidies 31,860 31,824 (36)

2017-18 Budget – Outcome and Summary of Variations
Budget Statement 2018-19 A4 - 3
Table A4.1: Summary of variations (cont)
Category/Agency Budget Revised Variation Comment on Major Variations
$m $m $m Sales of Goods and Services
Transport for NSW 2,895 2,194 (701) Reprofiling in spending on rail capital projects.
Department of Education 166 489 323 Reclassification from Other Grants and Subsidies to Sale of Goods and Services.
Roads & Maritime Services 552 640 88 Higher settlement claims, fee for service recovery and tolling compliance revenue.
Other 5,363 5,388 26 Aggregated net minor variances.
Total Sales of Goods and Services 8,976 8,711 (265)
Interest Revenue
Crown Finance Entity 159 264 105 Higher cash balances due to major asset sales, lower than budgeted capital expenditure and an associated increase interest income.
Other 254 264 10 Aggregated net minor variances.
Total Interest Revenue 413 528 115
Dividend and Income Tax Equivalent Income from Other Sectors
Dividends from the PNFC Sector 1,204 1,113 (91) Reduced dividends as outlined in chapter 8.
Dividends from the PFC Sector 54 0 (54) Reduced dividends as outlined in chapter 8.
Income Tax Equivalents from the PNFC Sector
339 376 37 Higher income tax equivalents due to higher than expected profits.
Income Tax Equivalents from the PFC Sector
23 25 2 Higher income tax equivalents due to higher than expected profits.
Total Dividend and Income Tax Equivalent Income from Other Sectors
1,620 1,514 (106)
Other Dividends and Distributions
Crown Finance Entity 468 1,032 564 Higher than expected financial returns from funds managed by TCorp, including the NSW Infrastructure Future Fund.
NSW Self Insurance Corporation 275 516 241 Higher than expected investment distributions due to improved financial market performance to date, but remains subject to impacts of future market fluctuations.
Other 273 355 82 Aggregated net minor variances.
Total Other Dividends and Distributions
1,016 1,903 887
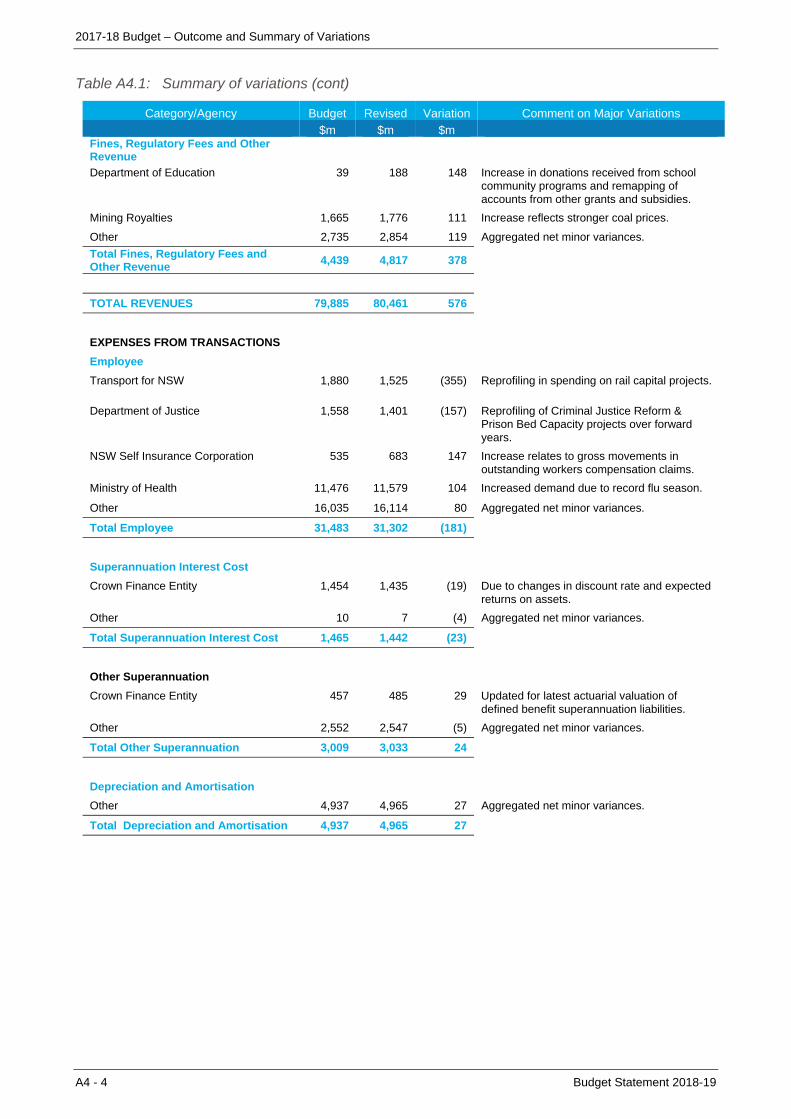
2017-18 Budget – Outcome and Summary of Variations
A4 - 4 Budget Statement 2018-19
Table A4.1: Summary of variations (cont)
Category/Agency Budget Revised Variation Comment on Major Variations
$m $m $m Fines, Regulatory Fees and Other Revenue
Department of Education 39 188 148 Increase in donations received from school community programs and remapping of accounts from other grants and subsidies.
Mining Royalties 1,665 1,776 111 Increase reflects stronger coal prices.
Other 2,735 2,854 119 Aggregated net minor variances.
Total Fines, Regulatory Fees and Other Revenue
4,439 4,817 378
TOTAL REVENUES 79,885 80,461 576
EXPENSES FROM TRANSACTIONS
Employee
Transport for NSW 1,880 1,525 (355) Reprofiling in spending on rail capital projects.
Department of Justice 1,558 1,401 (157) Reprofiling of Criminal Justice Reform & Prison Bed Capacity projects over forward years.
NSW Self Insurance Corporation 535 683 147 Increase relates to gross movements in outstanding workers compensation claims.
Ministry of Health 11,476 11,579 104 Increased demand due to record flu season.
Other 16,035 16,114 80 Aggregated net minor variances.
Total Employee 31,483 31,302 (181)
Superannuation Interest Cost
Crown Finance Entity 1,454 1,435 (19) Due to changes in discount rate and expected returns on assets.
Other 10 7 (4) Aggregated net minor variances.
Total Superannuation Interest Cost 1,465 1,442 (23)
Other Superannuation
Crown Finance Entity 457 485 29 Updated for latest actuarial valuation of defined benefit superannuation liabilities.
Other 2,552 2,547 (5) Aggregated net minor variances.
Total Other Superannuation 3,009 3,033 24
Depreciation and Amortisation
Other 4,937 4,965 27 Aggregated net minor variances.
Total Depreciation and Amortisation 4,937 4,965 27
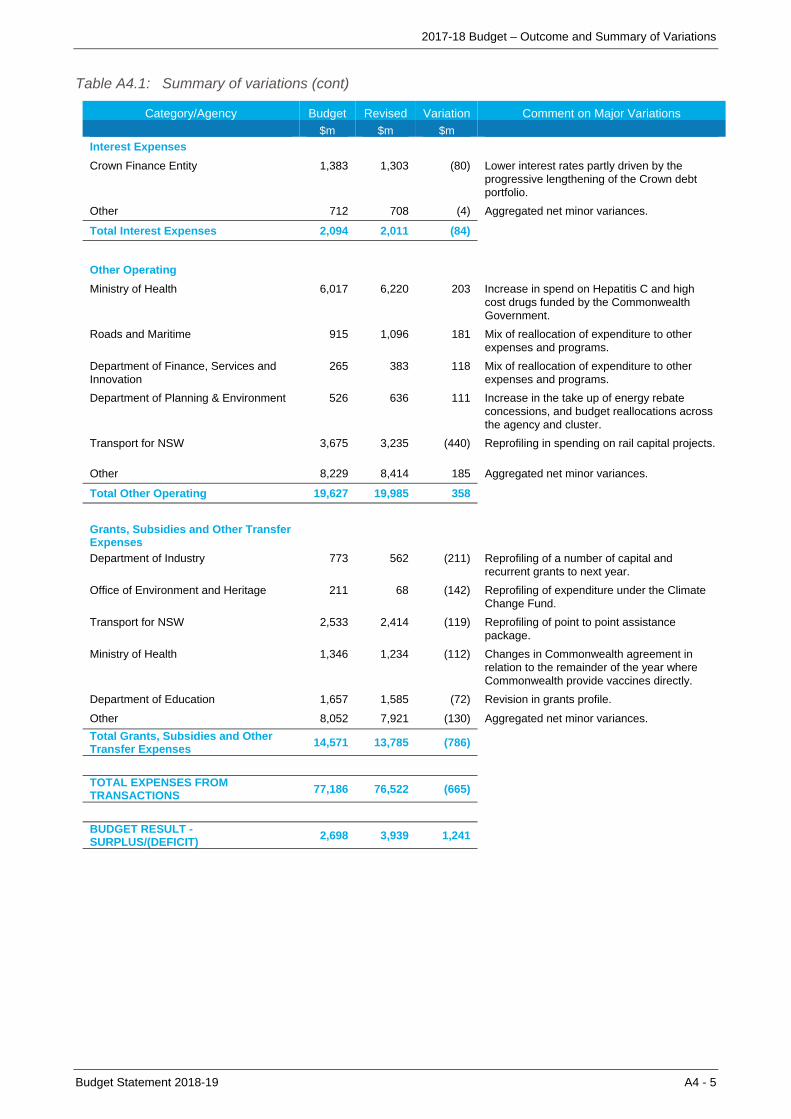
2017-18 Budget – Outcome and Summary of Variations
Budget Statement 2018-19 A4 - 5
Table A4.1: Summary of variations (cont)
Category/Agency Budget Revised Variation Comment on Major Variations
$m $m $m
Interest Expenses
Crown Finance Entity 1,383 1,303 (80) Lower interest rates partly driven by the progressive lengthening of the Crown debt portfolio.
Other 712 708 (4) Aggregated net minor variances.
Total Interest Expenses 2,094 2,011 (84)
Other Operating
Ministry of Health 6,017 6,220 203 Increase in spend on Hepatitis C and high cost drugs funded by the Commonwealth Government.
Roads and Maritime 915 1,096 181 Mix of reallocation of expenditure to other expenses and programs.
Department of Finance, Services and Innovation
265 383 118 Mix of reallocation of expenditure to other expenses and programs.
Department of Planning & Environment 526 636 111 Increase in the take up of energy rebate concessions, and budget reallocations across the agency and cluster.
Transport for NSW 3,675 3,235 (440) Reprofiling in spending on rail capital projects.
Other 8,229 8,414 185 Aggregated net minor variances.
Total Other Operating 19,627 19,985 358
Grants, Subsidies and Other Transfer Expenses
Department of Industry 773 562 (211) Reprofiling of a number of capital and recurrent grants to next year.
Office of Environment and Heritage 211 68 (142) Reprofiling of expenditure under the Climate Change Fund.
Transport for NSW 2,533 2,414 (119) Reprofiling of point to point assistance package.
Ministry of Health 1,346 1,234 (112) Changes in Commonwealth agreement in relation to the remainder of the year where Commonwealth provide vaccines directly.
Department of Education 1,657 1,585 (72) Revision in grants profile.
Other 8,052 7,921 (130) Aggregated net minor variances.
Total Grants, Subsidies and Other Transfer Expenses
14,571 13,785 (786)
TOTAL EXPENSES FROM TRANSACTIONS
77,186 76,522 (665)
BUDGET RESULT - SURPLUS/(DEFICIT)
2,698 3,939 1,241

2017-18 Budget – Outcome and Summary of Variations
A4 - 6 Budget Statement 2018-19
Table A4.1: Summary of variations (cont)
Category/Agency Budget Revised Variation Comment on Major Variations
$m $m $m Capital Expenditure
Roads & Maritime Services 5,982 4,865 (1,117) Reprofiling of programs primarily for the Pacific Highway, WestConnex and Western Sydney Infrastructure Plan.
Department of Justice 1,580 672 (908) Largely relates to prison bed capacity project and a classification from capital expenditure to finance lease on Grafton prison (PPP Contract).
Property NSW 106 35 (71) Reprofiling largely related to a joint project conducted with the Ministry of Health.
Department of Planning and Environment
139 69 (70) Reprofiling largely related to Walsh Bay Arts Precinct.
New South Wales Government Telecommunications Authority
118 54 (64) Reprofiling largely relating to Critical Communication Enhancement Program (CCEP).
Transport for NSW 2,826 3,026 201 Reallocation of Sydney Metro Northwest expenditure from Railcorp to Transport NSW for commencement of early works expenditure on Parramatta Light Rail Stage 1.
Other 3,764 3,564 (200) Aggregated net minor variances.
Total Capital Expenditure 14,515 12,285 (2,230)
OTHER KEY FISCAL AGGREGATES
Sales of Non-Financial Assets
Other 526 491 (35) Aggregated net minor variances.
Total Sales of Non-Financial Assets 526 491 (35)
Depreciation and Amortisation
Other 4,937 4,965 27 Aggregated net minor variances.
Total Depreciation and Amortisation 4,937 4,965 27
Changes in Inventories
Ministry of Health 25 (12) (36) Revision projecting lower inventory to be held in stock.
Other (2) (12) (10) Aggregated net minor variances.
Total Change in Inventories 22 (24) (46)
Assets Acquired Using Finance Leases
Other 190 182 (7) Aggregated net minor variances.
Total Assets Acquired Using Finance Leases
190 182 (7)
Other Movements in Non-Financial Assets Other Movements in Non-Financial Assets
116 75 (41) Aggregated net minor variances.
NET LENDING (6,447) (2,989) 3,458

Budget Statement 2018-19 A5 - 1
A5. TAX EXPENDITURE AND CONCESSIONAL CHARGES STATEMENT
Favourable tax treatment or lower fees or service charges may be granted to certain individuals, groups or organisations to support policy objectives. This tax expenditure and concessional charges statement recognises that such special treatment is economically equivalent to increasing expenses, and has the same effect on the budget outcome.
Tax expenditure estimates measure the additional tax that would have been payable if ‘benchmark’ (or standard) tax structures had been applied to all taxpayers and economic behaviour had remained unchanged. Tax expenditures arise from deviations from the benchmarks, and include specific tax exemptions, allowances and deductions, reduced tax rates, deferral of tax liabilities and tax credits.
Concessional charges are included for government agencies that provide goods and services to certain users at a lower fee or charge than to the wider community, in pursuit of economic or social policy goals, such as reducing the cost of living. The provision of these concessions may be supported directly from the Budget, or indirectly through a reduction in agency obligations to make dividend or other payments, or a reduction in agency retained earnings. These concessions have a budget cost, regardless of whether they are the subject of a specific intra-government transfer.
Judgement is required in delineating the ‘concessional’ and ‘structural’ features of a particular tax or service delivery scheme. The approach adopted is to treat the general application of a tiered tax schedule or charging regime as a structural element of the benchmark, rather than a concession to those paying less than the highest marginal rate of tax. Similarly, providing lower public transport fares for all children is included in the benchmark rather than as a concession. However, subsidised travel for eligible school children and senior citizens is treated as a concession. Provisions to prevent double taxation or to otherwise support the conceptual structure of a tax, rather than provide a benefit to a particular group of taxpayers, are generally excluded.
Caution should be exercised when using these estimates. They may not be comparable to estimates in other jurisdictions, which may use different definitions of the ‘structural’ and ‘concessional’ elements of taxes and charges. Similarly, changes to the benchmark definition and the classification of concessions may limit the comparability of some estimates to those in earlier budgets. Importantly, the estimates do not measure the amount of revenue that could be expected if the relevant concessional treatment were abolished, nor do they provide a reliable indication of the economic costs and benefits. This is because the concessions themselves influence behaviour patterns and levels of activity, which could be quite different in their absence.
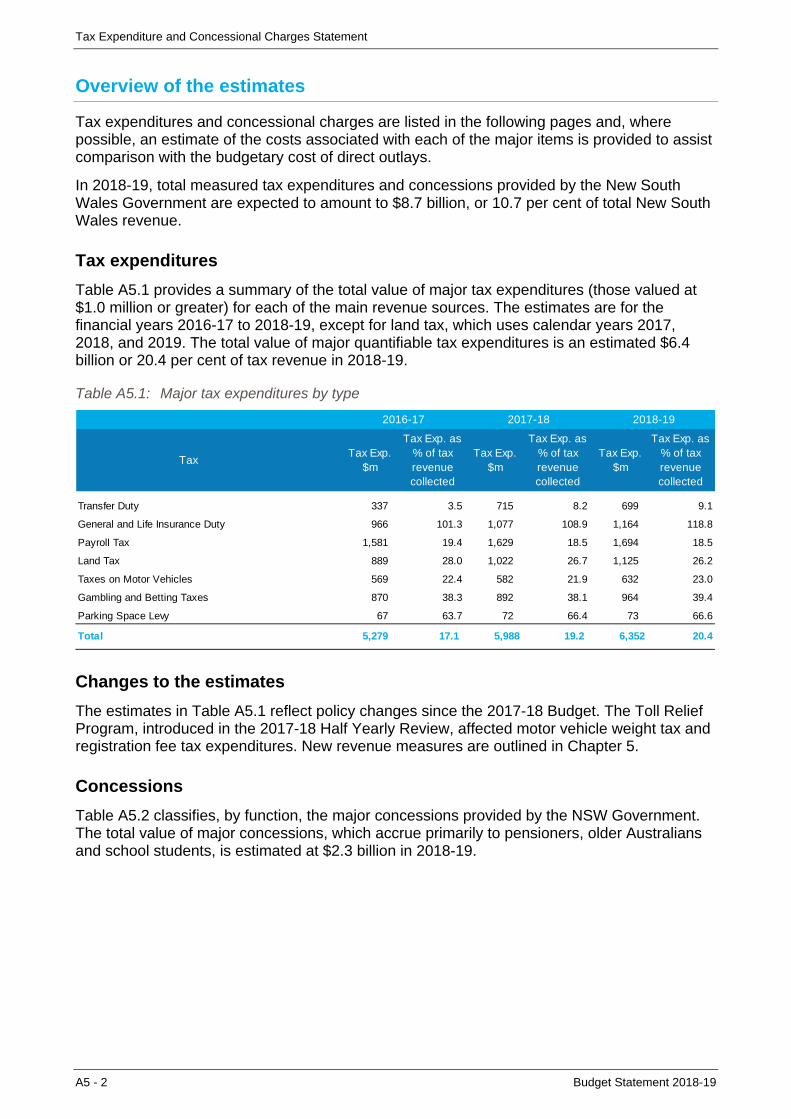
Tax Expenditure and Concessional Charges Statement
A5 - 2 Budget Statement 2018-19
Overview of the estimates
Tax expenditures and concessional charges are listed in the following pages and, where possible, an estimate of the costs associated with each of the major items is provided to assist comparison with the budgetary cost of direct outlays.
In 2018-19, total measured tax expenditures and concessions provided by the New South Wales Government are expected to amount to $8.7 billion, or 10.7 per cent of total New South Wales revenue.
Tax expenditures
Table A5.1 provides a summary of the total value of major tax expenditures (those valued at $1.0 million or greater) for each of the main revenue sources. The estimates are for the financial years 2016-17 to 2018-19, except for land tax, which uses calendar years 2017, 2018, and 2019. The total value of major quantifiable tax expenditures is an estimated $6.4 billion or 20.4 per cent of tax revenue in 2018-19.
Table A5.1: Major tax expenditures by type
TaxTax Exp.
$m Tax Exp.
$m Tax Exp.
$m
Tax Exp. as% of taxrevenuecollected
Transfer Duty 337 3.5 715 8.2 699 9.1
General and Life Insurance Duty 966 101.3 1,077 108.9 1,164 118.8
Payroll Tax 1,581 19.4 1,629 18.5 1,694 18.5
Land Tax 889 28.0 1,022 26.7 1,125 26.2
Taxes on Motor Vehicles 569 22.4 582 21.9 632 23.0
Gambling and Betting Taxes 870 38.3 892 38.1 964 39.4
Parking Space Levy 67 63.7 72 66.4 73 66.6
Total 5,279 17.1 5,988 19.2 6,352 20.4
2016-17 2017-18 2018-19
Tax Exp. as% of taxrevenuecollected
Tax Exp. as% of taxrevenuecollected
Changes to the estimates
The estimates in Table A5.1 reflect policy changes since the 2017-18 Budget. The Toll Relief Program, introduced in the 2017-18 Half Yearly Review, affected motor vehicle weight tax and registration fee tax expenditures. New revenue measures are outlined in Chapter 5.
Concessions
Table A5.2 classifies, by function, the major concessions provided by the NSW Government. The total value of major concessions, which accrue primarily to pensioners, older Australians and school students, is estimated at $2.3 billion in 2018-19.
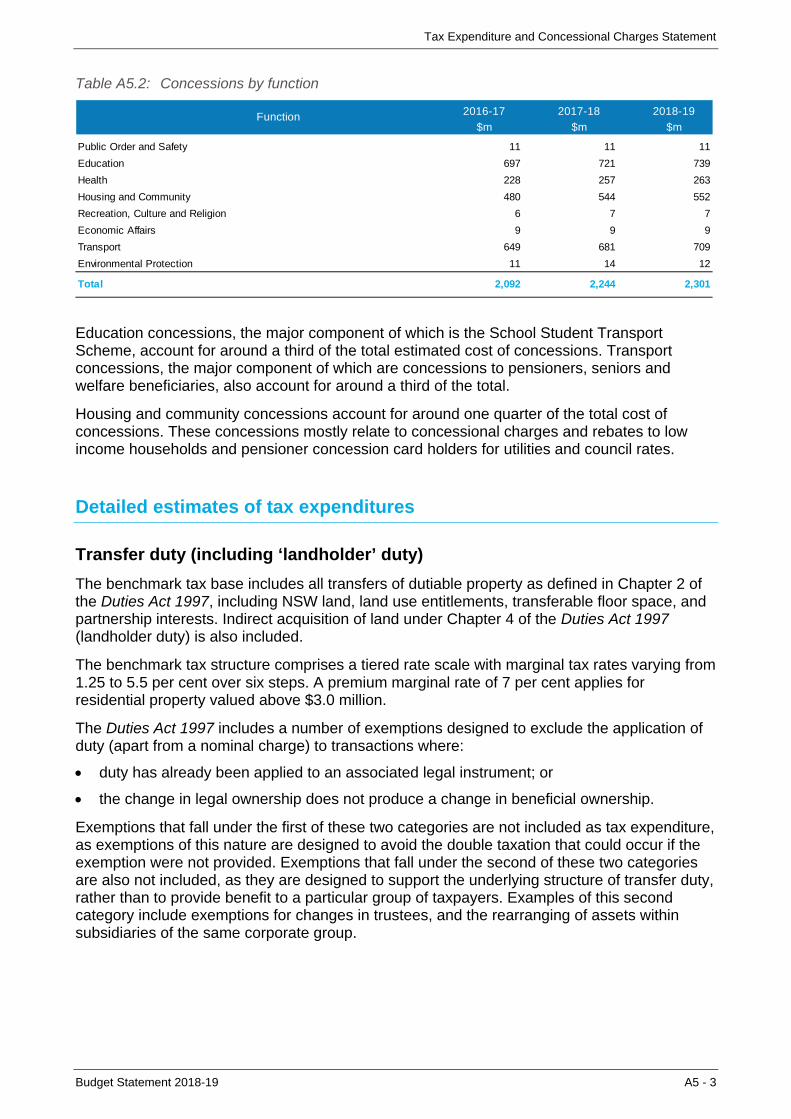
Tax Expenditure and Concessional Charges Statement
Budget Statement 2018-19 A5 - 3
Table A5.2: Concessions by function
2016-17 2017-18 2018-19
$m $m $m
Public Order and Safety 11 11 11
Education 697 721 739
Health 228 257 263
Housing and Community 480 544 552
Recreation, Culture and Religion 6 7 7
Economic Affairs 9 9 9
Transport 649 681 709
Environmental Protection 11 14 12
Total 2,092 2,244 2,301
Function
Education concessions, the major component of which is the School Student Transport Scheme, account for around a third of the total estimated cost of concessions. Transport concessions, the major component of which are concessions to pensioners, seniors and welfare beneficiaries, also account for around a third of the total.
Housing and community concessions account for around one quarter of the total cost of concessions. These concessions mostly relate to concessional charges and rebates to low income households and pensioner concession card holders for utilities and council rates.
Detailed estimates of tax expenditures
Transfer duty (including ‘landholder’ duty)
The benchmark tax base includes all transfers of dutiable property as defined in Chapter 2 of the Duties Act 1997, including NSW land, land use entitlements, transferable floor space, and partnership interests. Indirect acquisition of land under Chapter 4 of the Duties Act 1997 (landholder duty) is also included.
The benchmark tax structure comprises a tiered rate scale with marginal tax rates varying from 1.25 to 5.5 per cent over six steps. A premium marginal rate of 7 per cent applies for residential property valued above $3.0 million.
The Duties Act 1997 includes a number of exemptions designed to exclude the application of duty (apart from a nominal charge) to transactions where:
duty has already been applied to an associated legal instrument; or
the change in legal ownership does not produce a change in beneficial ownership.
Exemptions that fall under the first of these two categories are not included as tax expenditure, as exemptions of this nature are designed to avoid the double taxation that could occur if the exemption were not provided. Exemptions that fall under the second of these two categories are also not included, as they are designed to support the underlying structure of transfer duty, rather than to provide benefit to a particular group of taxpayers. Examples of this second category include exemptions for changes in trustees, and the rearranging of assets within subsidiaries of the same corporate group.

Tax Expenditure and Concessional Charges Statement
A5 - 4 Budget Statement 2018-19
Table A5.3: Transfer duty – major tax expenditures
2016-17
$m 2017-18
$m 2018-19
$m
Charitable/non-profit organisations/clubs
An exemption is granted for transactions of charitable or benevolent organisations, as set out in Section 275 of the Duties Act 1997. 27 33 30
Government
Councils and county councils The transfer of property to a council or county council is exempt under the Local Government Act 1993. 13 11 12
Individuals/families
First Home Buyer concessions and exemptions From 1 July 2017, exemptions or concessions are available to first homebuyers for the purchase of a new or existing home up to a value of $800,000, or vacant la nd for homebuilding up to $450,000. Under the previous arrangements, first homebuyer concessions were not available for the purchase of established homes or for homes valued above $650,000. 90 471 463
Transfer of residences between spouses or de facto partners An exemption is granted, subject to the property being their principal place of residence and jointly held after transfer. 32 35 35
Transfers of matrimonial property consequent upon divorce An exemption is provided for transfers of property in the break-up of marriage, de facto or domestic relationships under the Family Law Act 1975 (Cwlth). 109 117 115
Purchases by tenants of Housing NSW and Aboriginal Housing Office An exemption is provided for purchases of a principal place of residence. 1 1 1
Rural
Intergenerational rural transfers An exemption is granted for transfers of rural land used for primary production between generations, or between siblings, to facilitate younger family members taking over family farms. 64 44 42
Other
Other Legislation An exemption is granted in other legislation for certain transfers of dutiable property. 2 2 2
Transfer duty – other major tax expenditures (> $1 million)1
Only nominal duty is charged on transfers of property to a beneficiary entitled to it under the will of a deceased person.
For ‘off the plan’ purchases by owner occupiers, duty may be deferred until completion of the sale or 12 months after the contract, whichever occurs first.
1 Items listed under the ‘other major tax expenditures’ headings are those where the value of the tax expenditure is
estimated to be more than $1 million in at least one year, but there is insufficient data available on which to base a reliable estimate.
Tax Expenditure and Concessional Charges Statement
Budget Statement 2018-19 A5 - 5
Transfer duty – minor tax expenditures (< $1 million)
The following are exempt from transfer duty:
approved equity release schemes for aged home owners
certain purchases of manufactured relocatable homes (caravans)
call option assignments, subject to certain conditions
transfer of a liquor licence in certain circumstances under the Liquor Act 2007
transfer of property related to a joint government enterprise that has the function of allocating funds for water savings projects
purchase of a principal place of residence by tenants of Housing NSW, the Community Housing Program administered by Housing NSW and the Aboriginal Housing Office
transfers where public hospitals are the liable party
transfer of properties gifted to a special disability trust
instruments executed by or on behalf of a council or county council under the Local Government Act 1993, not connected with a trading undertaking
transfers for the purpose of amalgamation or de-amalgamation of clubs under the Registered Clubs Act 1976
instruments executed by or on behalf of agencies within the meaning of the Convention on the Privileges and Immunities of the Specialised Agencies approved by the General Assembly of the United Nations in 1947
transfers between associations of employees or employers registered under the Workplace Relations Act 1996 (Cwlth) for the purpose of amalgamation
transfer of property to the NSW Aboriginal Land Council or Local Aboriginal Land Councils
transfers of property between licensed insurers, and between the WorkCover Authority and licensed insurers, under the Workers Compensation Act 1987
acquisition of an interest in a primary producer that is not ‘land rich’.
Concessional duty is charged in relation to:
acquisitions in unit trust schemes, private companies or listed companies with land holdings in New South Wales of $2.0 million or more, where the acquisition is for the purpose of securing financial accommodation
buy-back arrangements of widely held unit trust schemes for the purpose of re-issuing or re-offering the units for sale, subject to certain criteria
amalgamations of certain Western Lands leases under the Western Lands Act 1901 where transfer duty has been paid on the transfer of other such leases in the previous 3 years.
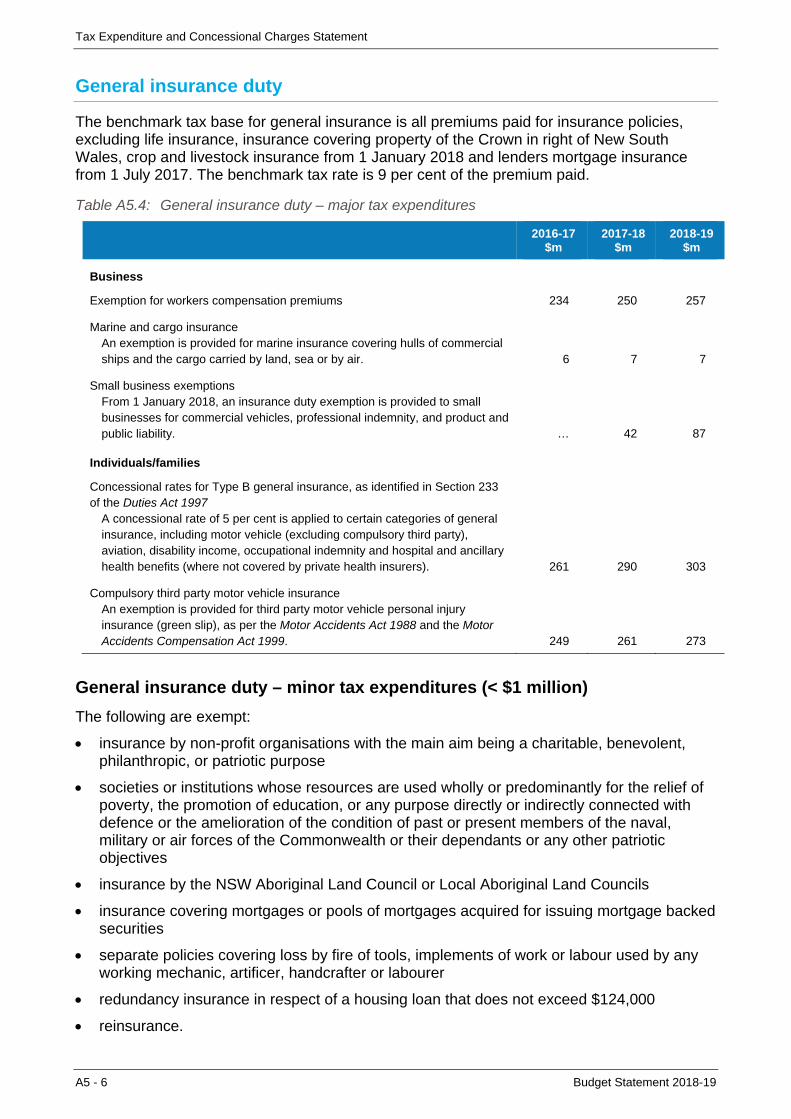
Tax Expenditure and Concessional Charges Statement
A5 - 6 Budget Statement 2018-19
General insurance duty
The benchmark tax base for general insurance is all premiums paid for insurance policies, excluding life insurance, insurance covering property of the Crown in right of New South Wales, crop and livestock insurance from 1 January 2018 and lenders mortgage insurance from 1 July 2017. The benchmark tax rate is 9 per cent of the premium paid.
Table A5.4: General insurance duty – major tax expenditures
2016-17
$m 2017-18
$m 2018-19
$m
Business
Exemption for workers compensation premiums 234 250 257
Marine and cargo insurance An exemption is provided for marine insurance covering hulls of commercial ships and the cargo carried by land, sea or by air. 6 7 7
Small business exemptions From 1 January 2018, an insurance duty exemption is provided to small businesses for commercial vehicles, professional indemnity, and product and public liability. … 42 87
Individuals/families
Concessional rates for Type B general insurance, as identified in Section 233 of the Duties Act 1997
A concessional rate of 5 per cent is applied to certain categories of general insurance, including motor vehicle (excluding compulsory third party), aviation, disability income, occupational indemnity and hospital and ancillary health benefits (where not covered by private health insurers). 261 290 303
Compulsory third party motor vehicle insurance An exemption is provided for third party motor vehicle personal injury insurance (green slip), as per the Motor Accidents Act 1988 and the Motor Accidents Compensation Act 1999. 249 261 273
General insurance duty – minor tax expenditures (< $1 million)
The following are exempt:
insurance by non-profit organisations with the main aim being a charitable, benevolent, philanthropic, or patriotic purpose
societies or institutions whose resources are used wholly or predominantly for the relief of poverty, the promotion of education, or any purpose directly or indirectly connected with defence or the amelioration of the condition of past or present members of the naval, military or air forces of the Commonwealth or their dependants or any other patriotic objectives
insurance by the NSW Aboriginal Land Council or Local Aboriginal Land Councils
insurance covering mortgages or pools of mortgages acquired for issuing mortgage backed securities
separate policies covering loss by fire of tools, implements of work or labour used by any working mechanic, artificer, handcrafter or labourer
redundancy insurance in respect of a housing loan that does not exceed $124,000
reinsurance.

Tax Expenditure and Concessional Charges Statement
Budget Statement 2018-19 A5 - 7
Life insurance duty
For temporary or term life insurance policies, life insurance riders, and trauma or disability insurance policies, the benchmark tax base is the first year’s premium on the policies and the benchmark rate is 5 per cent. For group term insurance policies, duty of 5 per cent of the premium payable in any succeeding year in respect of any additional life covered by the policy is also charged.
The benchmark tax base for all other life insurance policies is the total sum insured. The benchmark tax rate is $1 on the first $2,000 and 20 cents for every additional $200 or part thereof.
Table A5.5: Life insurance duty – major tax expenditures
2016-17
$m 2017-18
$m 2018-19
$m
Individuals/families
Superannuation An exemption is granted to all group superannuation investment policies that are for the benefit of more than one member. 191 201 209
Annuities An exemption is granted to annuities. 25 26 28
Motor vehicle stamp duty
The benchmark tax base is the value of all purchases and transfers of motor vehicles. The benchmark tax rate for passenger vehicles is $3 per $100, or part thereof, for vehicles valued up to $45,000, and $1,350 plus $5 per $100 above $45,000, for higher valued vehicles.
Table A5.6: Motor vehicle stamp duty – major tax expenditures
2016-17 $m
2017-18 $m
2018-19 $m
Business
New demonstrator motor vehicle An exemption is granted to licensed motor dealers and wholesalers under the Motor Dealers Act 1974. 100 100 102
Individuals/families
Caravans and camper trailers An exemption is provided for transfers of registration of caravans and camper trailers.
29 33 33
Transfers on divorce or breakdown of a de facto relationship An exemption is granted for the transfer of registration to one of the parties to a divorce or separation in a de facto relationship. 3 3 3
Transfer of ownership of a deceased registered owner An exemption is granted for the transfer of registration to a nominated legal personal representative or to the person beneficially entitled to the vehicle in the estate. 11 11 11
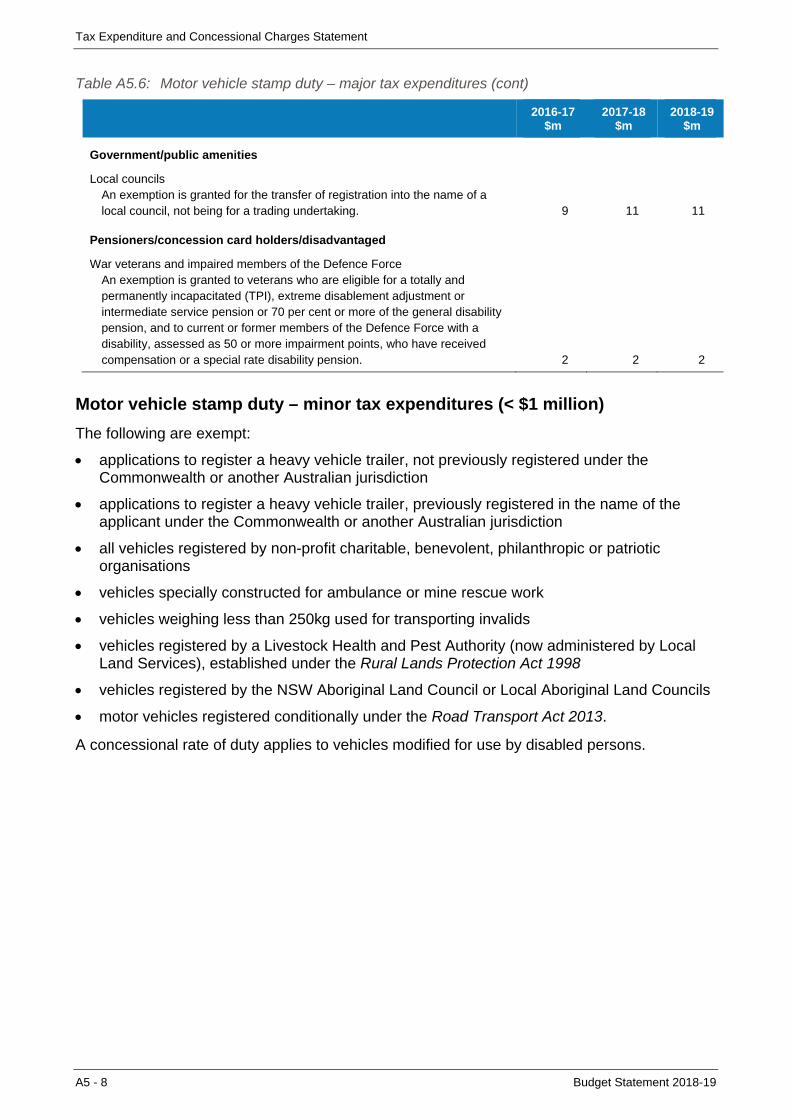
Tax Expenditure and Concessional Charges Statement
A5 - 8 Budget Statement 2018-19
Table A5.6: Motor vehicle stamp duty – major tax expenditures (cont)
2016-17
$m 2017-18
$m 2018-19
$m
Government/public amenities
Local councils An exemption is granted for the transfer of registration into the name of a local council, not being for a trading undertaking. 9 11 11
Pensioners/concession card holders/disadvantaged
War veterans and impaired members of the Defence Force An exemption is granted to veterans who are eligible for a totally and permanently incapacitated (TPI), extreme disablement adjustment or intermediate service pension or 70 per cent or more of the general disability pension, and to current or former members of the Defence Force with a disability, assessed as 50 or more impairment points, who have received compensation or a special rate disability pension. 2 2 2
Motor vehicle stamp duty – minor tax expenditures (< $1 million)
The following are exempt:
applications to register a heavy vehicle trailer, not previously registered under the Commonwealth or another Australian jurisdiction
applications to register a heavy vehicle trailer, previously registered in the name of the applicant under the Commonwealth or another Australian jurisdiction
all vehicles registered by non-profit charitable, benevolent, philanthropic or patriotic organisations
vehicles specially constructed for ambulance or mine rescue work
vehicles weighing less than 250kg used for transporting invalids
vehicles registered by a Livestock Health and Pest Authority (now administered by Local Land Services), established under the Rural Lands Protection Act 1998
vehicles registered by the NSW Aboriginal Land Council or Local Aboriginal Land Councils
motor vehicles registered conditionally under the Road Transport Act 2013.
A concessional rate of duty applies to vehicles modified for use by disabled persons.
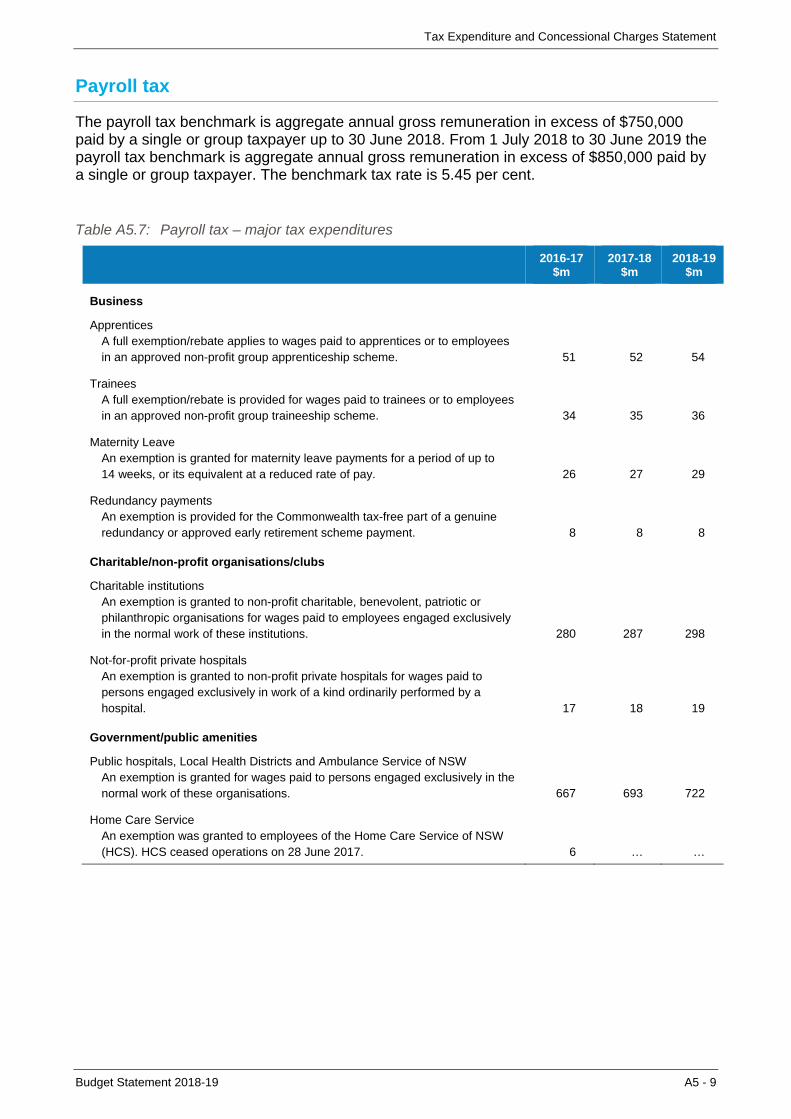
Tax Expenditure and Concessional Charges Statement
Budget Statement 2018-19 A5 - 9
Payroll tax
The payroll tax benchmark is aggregate annual gross remuneration in excess of $750,000 paid by a single or group taxpayer up to 30 June 2018. From 1 July 2018 to 30 June 2019 the payroll tax benchmark is aggregate annual gross remuneration in excess of $850,000 paid by a single or group taxpayer. The benchmark tax rate is 5.45 per cent.
Table A5.7: Payroll tax – major tax expenditures
2016-17
$m 2017-18
$m 2018-19
$m
Business
Apprentices A full exemption/rebate applies to wages paid to apprentices or to employees in an approved non-profit group apprenticeship scheme. 51 52 54
Trainees A full exemption/rebate is provided for wages paid to trainees or to employees in an approved non-profit group traineeship scheme. 34 35 36
Maternity Leave An exemption is granted for maternity leave payments for a period of up to 14 weeks, or its equivalent at a reduced rate of pay. 26 27 29
Redundancy payments An exemption is provided for the Commonwealth tax-free part of a genuine redundancy or approved early retirement scheme payment. 8 8 8
Charitable/non-profit organisations/clubs
Charitable institutions An exemption is granted to non-profit charitable, benevolent, patriotic or philanthropic organisations for wages paid to employees engaged exclusively in the normal work of these institutions. 280 287 298
Not-for-profit private hospitals An exemption is granted to non-profit private hospitals for wages paid to persons engaged exclusively in work of a kind ordinarily performed by a hospital. 17 18 19
Government/public amenities
Public hospitals, Local Health Districts and Ambulance Service of NSW An exemption is granted for wages paid to persons engaged exclusively in the normal work of these organisations. 667 693 722
Home Care Service An exemption was granted to employees of the Home Care Service of NSW (HCS). HCS ceased operations on 28 June 2017. 6 … …
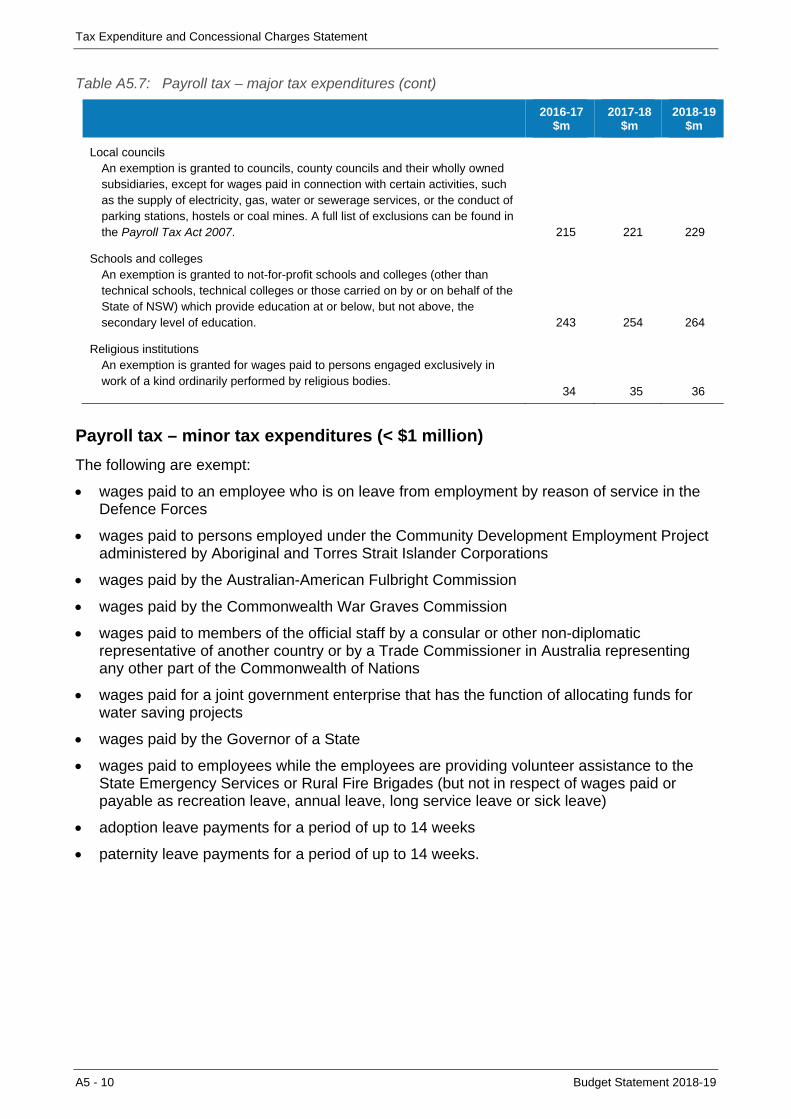
Tax Expenditure and Concessional Charges Statement
A5 - 10 Budget Statement 2018-19
Table A5.7: Payroll tax – major tax expenditures (cont)
2016-17
$m 2017-18
$m 2018-19
$m
Local councils An exemption is granted to councils, county councils and their wholly owned subsidiaries, except for wages paid in connection with certain activities, such as the supply of electricity, gas, water or sewerage services, or the conduct of parking stations, hostels or coal mines. A full list of exclusions can be found in the Payroll Tax Act 2007. 215 221 229
Schools and colleges An exemption is granted to not-for-profit schools and colleges (other than technical schools, technical colleges or those carried on by or on behalf of the State of NSW) which provide education at or below, but not above, the secondary level of education. 243 254 264
Religious institutions An exemption is granted for wages paid to persons engaged exclusively in work of a kind ordinarily performed by religious bodies.
34 35 36
Payroll tax – minor tax expenditures (< $1 million)
The following are exempt:
wages paid to an employee who is on leave from employment by reason of service in the Defence Forces
wages paid to persons employed under the Community Development Employment Project administered by Aboriginal and Torres Strait Islander Corporations
wages paid by the Australian-American Fulbright Commission
wages paid by the Commonwealth War Graves Commission
wages paid to members of the official staff by a consular or other non-diplomatic representative of another country or by a Trade Commissioner in Australia representing any other part of the Commonwealth of Nations
wages paid for a joint government enterprise that has the function of allocating funds for water saving projects
wages paid by the Governor of a State
wages paid to employees while the employees are providing volunteer assistance to the State Emergency Services or Rural Fire Brigades (but not in respect of wages paid or payable as recreation leave, annual leave, long service leave or sick leave)
adoption leave payments for a period of up to 14 weeks
paternity leave payments for a period of up to 14 weeks.
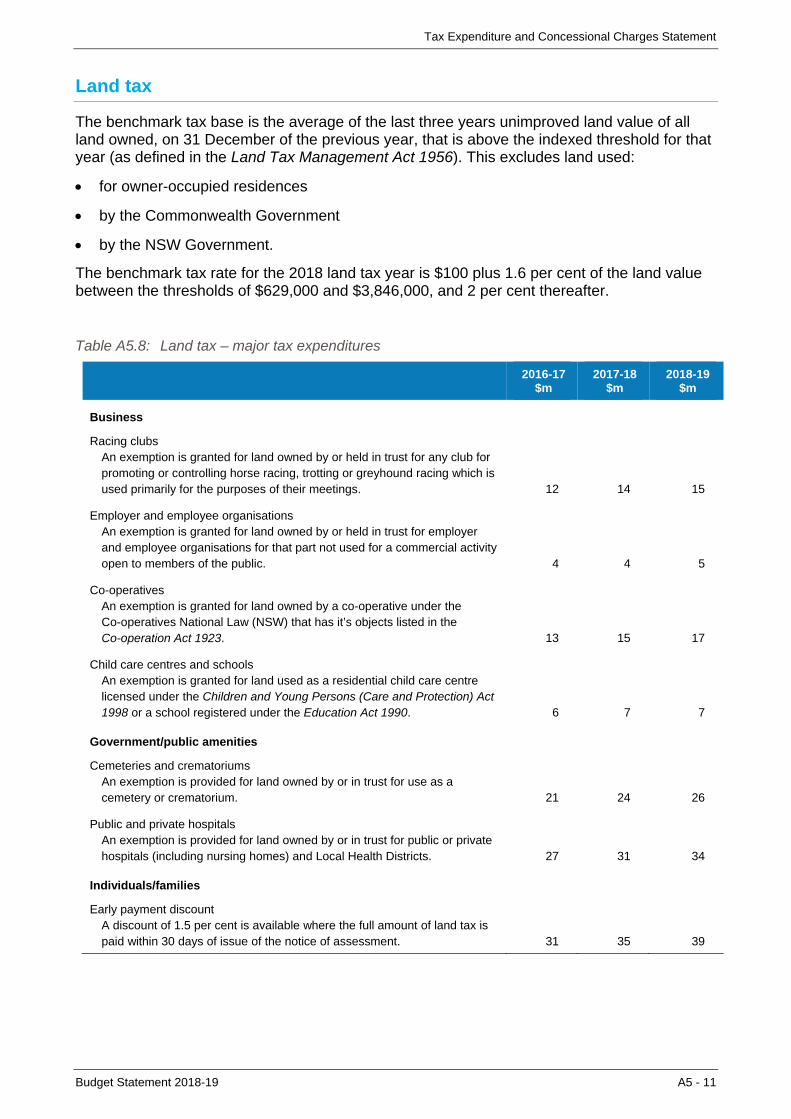
Tax Expenditure and Concessional Charges Statement
Budget Statement 2018-19 A5 - 11
Land tax
The benchmark tax base is the average of the last three years unimproved land value of all land owned, on 31 December of the previous year, that is above the indexed threshold for that year (as defined in the Land Tax Management Act 1956). This excludes land used:
for owner-occupied residences
by the Commonwealth Government
by the NSW Government.
The benchmark tax rate for the 2018 land tax year is $100 plus 1.6 per cent of the land value between the thresholds of $629,000 and $3,846,000, and 2 per cent thereafter.
Table A5.8: Land tax – major tax expenditures
2016-17
$m 2017-18
$m 2018-19
$m
Business
Racing clubs An exemption is granted for land owned by or held in trust for any club for promoting or controlling horse racing, trotting or greyhound racing which is used primarily for the purposes of their meetings. 12 14 15
Employer and employee organisations An exemption is granted for land owned by or held in trust for employer and employee organisations for that part not used for a commercial activity open to members of the public. 4 4 5
Co-operatives An exemption is granted for land owned by a co-operative under the Co-operatives National Law (NSW) that has it’s objects listed in the Co-operation Act 1923. 13 15 17
Child care centres and schools An exemption is granted for land used as a residential child care centre licensed under the Children and Young Persons (Care and Protection) Act 1998 or a school registered under the Education Act 1990. 6 7 7
Government/public amenities
Cemeteries and crematoriums An exemption is provided for land owned by or in trust for use as a cemetery or crematorium. 21 24 26
Public and private hospitals An exemption is provided for land owned by or in trust for public or private hospitals (including nursing homes) and Local Health Districts. 27 31 34
Individuals/families
Early payment discount A discount of 1.5 per cent is available where the full amount of land tax is paid within 30 days of issue of the notice of assessment. 31 35 39
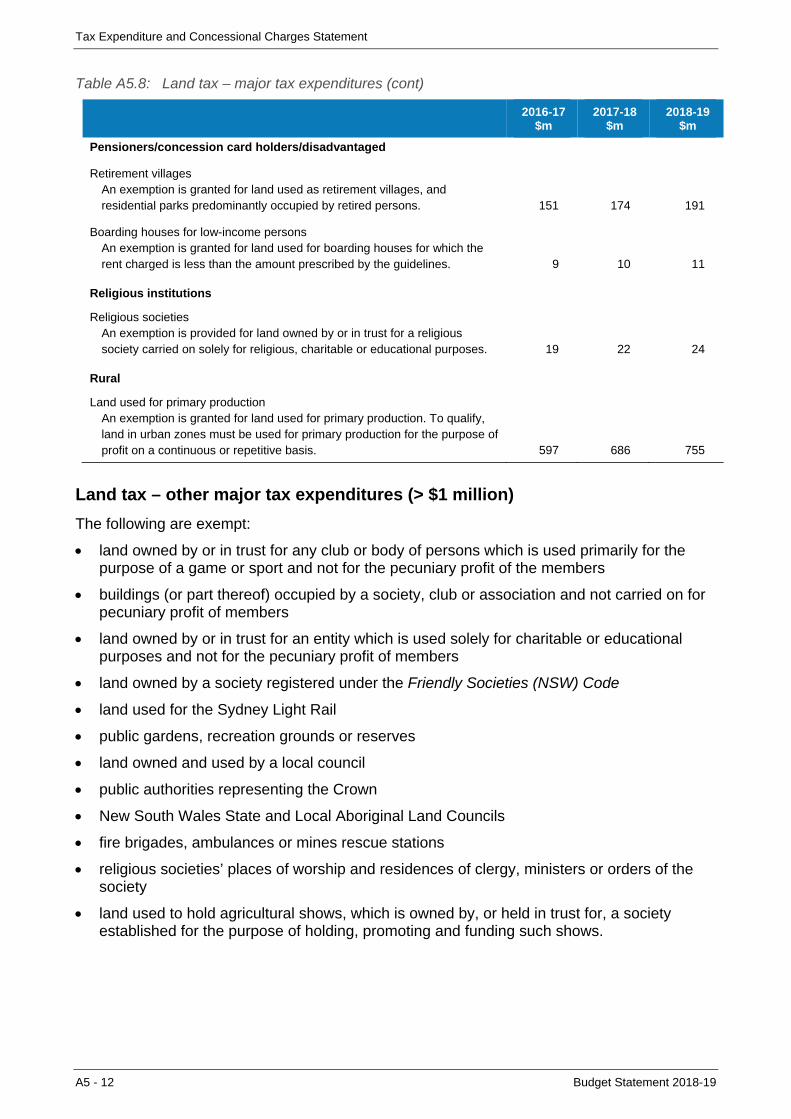
Tax Expenditure and Concessional Charges Statement
A5 - 12 Budget Statement 2018-19
Table A5.8: Land tax – major tax expenditures (cont)
2016-17
$m 2017-18
$m 2018-19
$m
Pensioners/concession card holders/disadvantaged
Retirement villages An exemption is granted for land used as retirement villages, and residential parks predominantly occupied by retired persons. 151 174 191
Boarding houses for low-income persons An exemption is granted for land used for boarding houses for which the rent charged is less than the amount prescribed by the guidelines. 9 10 11
Religious institutions
Religious societies An exemption is provided for land owned by or in trust for a religious society carried on solely for religious, charitable or educational purposes. 19 22 24
Rural
Land used for primary production An exemption is granted for land used for primary production. To qualify, land in urban zones must be used for primary production for the purpose of profit on a continuous or repetitive basis. 597 686 755
Land tax – other major tax expenditures (> $1 million)
The following are exempt:
land owned by or in trust for any club or body of persons which is used primarily for the purpose of a game or sport and not for the pecuniary profit of the members
buildings (or part thereof) occupied by a society, club or association and not carried on for pecuniary profit of members
land owned by or in trust for an entity which is used solely for charitable or educational purposes and not for the pecuniary profit of members
land owned by a society registered under the Friendly Societies (NSW) Code
land used for the Sydney Light Rail
public gardens, recreation grounds or reserves
land owned and used by a local council
public authorities representing the Crown
New South Wales State and Local Aboriginal Land Councils
fire brigades, ambulances or mines rescue stations
religious societies’ places of worship and residences of clergy, ministers or orders of the society
land used to hold agricultural shows, which is owned by, or held in trust for, a society established for the purpose of holding, promoting and funding such shows.
Tax Expenditure and Concessional Charges Statement
Budget Statement 2018-19 A5 - 13
Land tax – minor tax expenditures (< $1 million)
The following are exempt:
low cost accommodation within 5 km of Sydney GPO
Primary Products Marketing Boards, Local Land Services and Agricultural Industry Service committees
community land development
land subject to a conservation agreement in perpetuity under the National Parks and Wildlife Act 1974 or a trust registered under the Nature Conservation Trust Act 2001
land owned, held in trust or leased by the Nature Conservation Trust of NSW, or land subject to a permanent conservation or trust agreement
land that is the subject of a biobanking agreement
land owned by a joint government enterprise that has the function of allocating funds for water saving projects
land used solely as a police station
land owned by RSL (NSW Branch), being Anzac House
principal place of residence of a person with a disability, in a Special Disability Trust.
A concession is provided for unoccupied flood liable land.
Vehicle weight tax
The benchmark tax base is all vehicles (except Commonwealth vehicles) intended for on-road use. The benchmark tax rates, which vary by vehicle type, weight, usage and other factors, are updated annually by Roads and Maritime Services.
From 1 January 2018, charges for cars, station wagons and trucks up to 4.5 tonnes Gross Vehicle Mass are based on a 12 step graduated weight scale, ranging from:
$211 (0 - 975kg) to $1,177 (4,325 - 4,500kgs) for private use vehicles
$343 (0 - 975kg) to $2,227 (4,325 - 4,500kgs) for business use vehicles.
From 1 January 2018, charges for trailers and caravans up to 4.5 tonnes Gross Vehicle Mass are based on a 12 step graduated weight scale, ranging from:
$0 (0 - 254kg) to $1,177 (4,325 - 4,500kgs) for private use vehicles
$102 (0 - 254kg) to $1,962 (4,325 - 4,500kgs) for business use vehicles.

Tax Expenditure and Concessional Charges Statement
A5 - 14 Budget Statement 2018-19
Table A5.9: Vehicle weight tax – major tax expenditures
2016-17
$m 2017-18
$m 2018-19
$m
Business
General purpose plant Concessions are provided for machines that cannot carry any load other than tools and accessories necessary for the operation of the vehicle. 31 32 34
Private Vehicles
Toll Relief From 1 July 2018, eligible NSW motorists who spend $25 a week or more on tolls, on average, over a 12 month period will receive free registration. … … 28
Government/public amenities
Roadwork equipment An exemption is granted for any motor vehicle, plough, bulldozer, mechanical scoop or shovel, road grader, road roller or similar machinery owned by a local council that is used for the purposes of road repair, maintenance or construction, removal of garbage or night soil, bushfire fighting or civil defence work, or for any roller, lawn mower or similar machinery used solely or principally for the rolling or maintenance of tennis courts, cricket pitches, lawns or pathways. 6 6 7
Commonwealth Government vehicles Any vehicle leased to a Commonwealth Authority is exempt from tax under Section 16 (2) (d) of Commonwealth Vehicles (Registration and Exemption from Taxation) Act 1997 (Cwlth). 1 1 1
Concessions provided under Sections 16 and 17 of the Motor Vehicles Taxation Act 1988 including vehicles specially constructed for the work of conveying sick or injured persons or to carry out mine rescue, and agricultural vehicles that do not travel on a road. 2 2 2
Pensioners/concession card holders/disadvantaged
Selected social security recipients An exemption is granted for any motor vehicle used substantially for non-business purposes owned by holders of Pensioner Concession Cards, Department of Veterans’ Affairs (DVA) Totally and Permanently Incapacitated Cards or DVA Gold War Widows Cards. 291 298 306
Rural
Primary producers Primary producer concessions include, for motor vehicles not greater than 4.5 tonnes of gross vehicle mass, private rates rather than business rates for cars and station wagons and 55 per cent of business rates for trucks, tractors and trailers. 29 28 30

Tax Expenditure and Concessional Charges Statement
Budget Statement 2018-19 A5 - 15
Vehicle weight tax – minor tax expenditures (< $1 million)
The following are exempt:
motor vehicles (not government owned) used principally as an ambulance
motor vehicles (not government owned) used by the State Emergency Service
motor vehicles on which a trader’s plate is being used in accordance with the Road Transport (Vehicle Registration) Act 1997 or the regulations under that Act
motor vehicles owned by Aboriginal Land Councils
motor vehicles of consular employees and trade missions.
Concessions are provided as follows:
a concessional rate of 55 per cent of business rates (or 30 per cent if outside the Sydney metropolitan area, Newcastle or Wollongong districts) is applied to any motor vehicle that is used solely or principally as a tow truck with a crane and hook
a concessional rate of 88 per cent is provided for mobile cranes used for private use
a concessional rate of tax is applied to any motor vehicle that is owned by a Livestock Health and Pest Authority (now administered by Local Land Services) and is used solely for carrying out the functions of the board
a concessional rebate of $100 from vehicle registration is given to first and second year apprentices registered with the NSW Department of Education.
Motor vehicle registration fees
The benchmark tax base is all vehicles intended for private on-road use. From 1 July 2018, the standard registration fee for light vehicles (up to 4.5 tonnes Gross Vehicle Mass) is $66 per annum but a range of other charges are levied for temporary or conditional registration, for registration transfer or cancellation, for special permits and on heavy vehicles.
Table A5.10: Motor vehicle registration fees – major tax expenditures
2016-17
$m 2017-18
$m 2018-19
$m
Pensioners/concession card holders/disadvantaged
Selected social security recipients An exemption is granted to holders of Pensioner Concession Cards, DVA Totally and Permanently Incapacitated Cards and DVA Gold War Widows Cards (subject to income and disability pension rate thresholds) for a single vehicle used substantially for social or domestic purposes. 55 56 57
Private Vehicles
Toll Relief From 1 July 2018, eligible NSW motorists who spend $25 a week or more on tolls, on average, over a 12 month period will receive free registration. … … 6
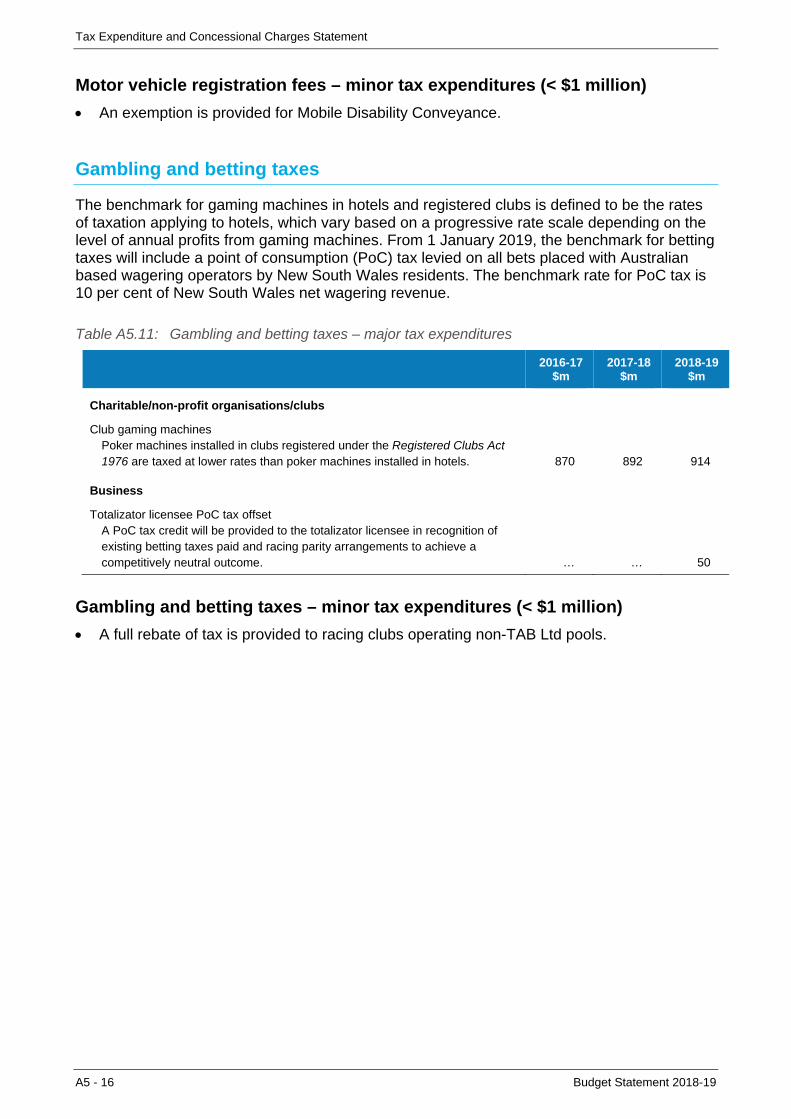
Tax Expenditure and Concessional Charges Statement
A5 - 16 Budget Statement 2018-19
Motor vehicle registration fees – minor tax expenditures (< $1 million)
An exemption is provided for Mobile Disability Conveyance.
Gambling and betting taxes
The benchmark for gaming machines in hotels and registered clubs is defined to be the rates of taxation applying to hotels, which vary based on a progressive rate scale depending on the level of annual profits from gaming machines. From 1 January 2019, the benchmark for betting taxes will include a point of consumption (PoC) tax levied on all bets placed with Australian based wagering operators by New South Wales residents. The benchmark rate for PoC tax is 10 per cent of New South Wales net wagering revenue.
Table A5.11: Gambling and betting taxes – major tax expenditures
2016-17
$m 2017-18
$m 2018-19
$m
Charitable/non-profit organisations/clubs
Club gaming machines Poker machines installed in clubs registered under the Registered Clubs Act 1976 are taxed at lower rates than poker machines installed in hotels. 870 892 914
Business
Totalizator licensee PoC tax offset A PoC tax credit will be provided to the totalizator licensee in recognition of existing betting taxes paid and racing parity arrangements to achieve a competitively neutral outcome. … … 50
Gambling and betting taxes – minor tax expenditures (< $1 million)
A full rebate of tax is provided to racing clubs operating non-TAB Ltd pools.
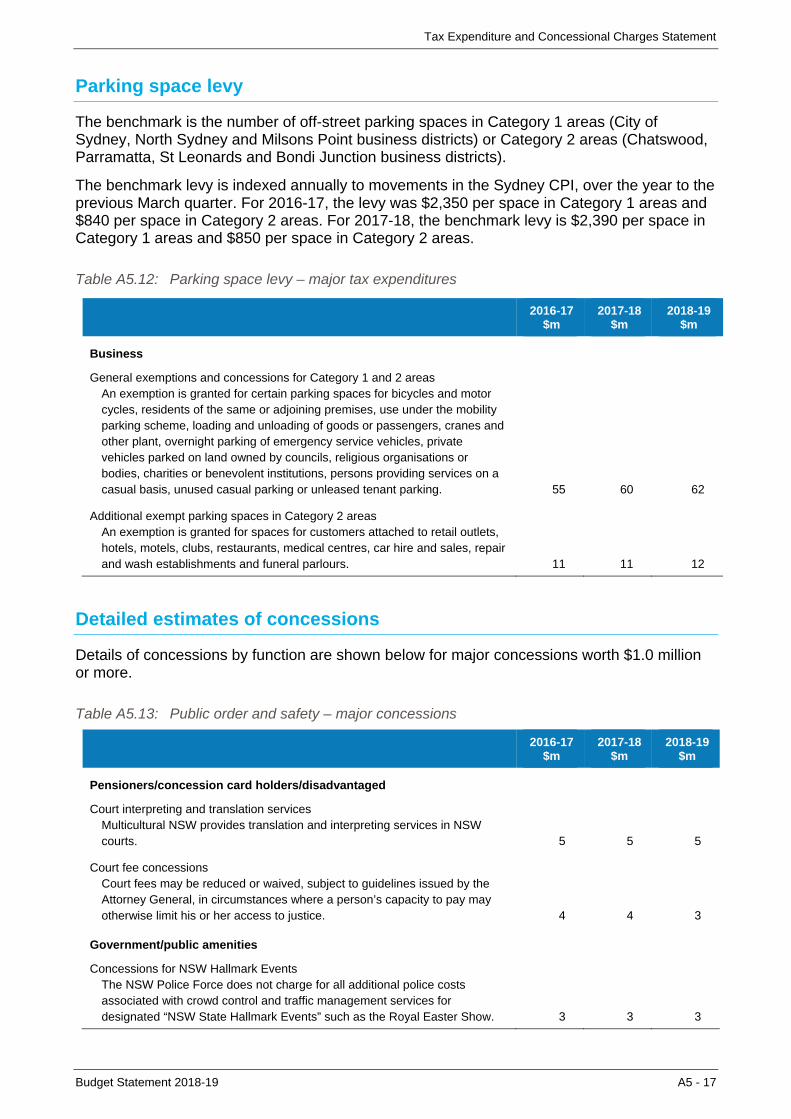
Tax Expenditure and Concessional Charges Statement
Budget Statement 2018-19 A5 - 17
Parking space levy
The benchmark is the number of off-street parking spaces in Category 1 areas (City of Sydney, North Sydney and Milsons Point business districts) or Category 2 areas (Chatswood, Parramatta, St Leonards and Bondi Junction business districts).
The benchmark levy is indexed annually to movements in the Sydney CPI, over the year to the previous March quarter. For 2016-17, the levy was $2,350 per space in Category 1 areas and $840 per space in Category 2 areas. For 2017-18, the benchmark levy is $2,390 per space in Category 1 areas and $850 per space in Category 2 areas.
Table A5.12: Parking space levy – major tax expenditures
2016-17
$m 2017-18
$m 2018-19
$m
Business
General exemptions and concessions for Category 1 and 2 areas An exemption is granted for certain parking spaces for bicycles and motor cycles, residents of the same or adjoining premises, use under the mobility parking scheme, loading and unloading of goods or passengers, cranes and other plant, overnight parking of emergency service vehicles, private vehicles parked on land owned by councils, religious organisations or bodies, charities or benevolent institutions, persons providing services on a casual basis, unused casual parking or unleased tenant parking. 55 60 62
Additional exempt parking spaces in Category 2 areas An exemption is granted for spaces for customers attached to retail outlets, hotels, motels, clubs, restaurants, medical centres, car hire and sales, repair and wash establishments and funeral parlours. 11 11 12
Detailed estimates of concessions
Details of concessions by function are shown below for major concessions worth $1.0 million or more.
Table A5.13: Public order and safety – major concessions
2016-17
$m 2017-18
$m 2018-19
$m
Pensioners/concession card holders/disadvantaged
Court interpreting and translation services Multicultural NSW provides translation and interpreting services in NSW courts. 5 5 5
Court fee concessions Court fees may be reduced or waived, subject to guidelines issued by the Attorney General, in circumstances where a person’s capacity to pay may otherwise limit his or her access to justice. 4 4 3
Government/public amenities
Concessions for NSW Hallmark Events The NSW Police Force does not charge for all additional police costs associated with crowd control and traffic management services for designated “NSW State Hallmark Events” such as the Royal Easter Show. 3 3 3
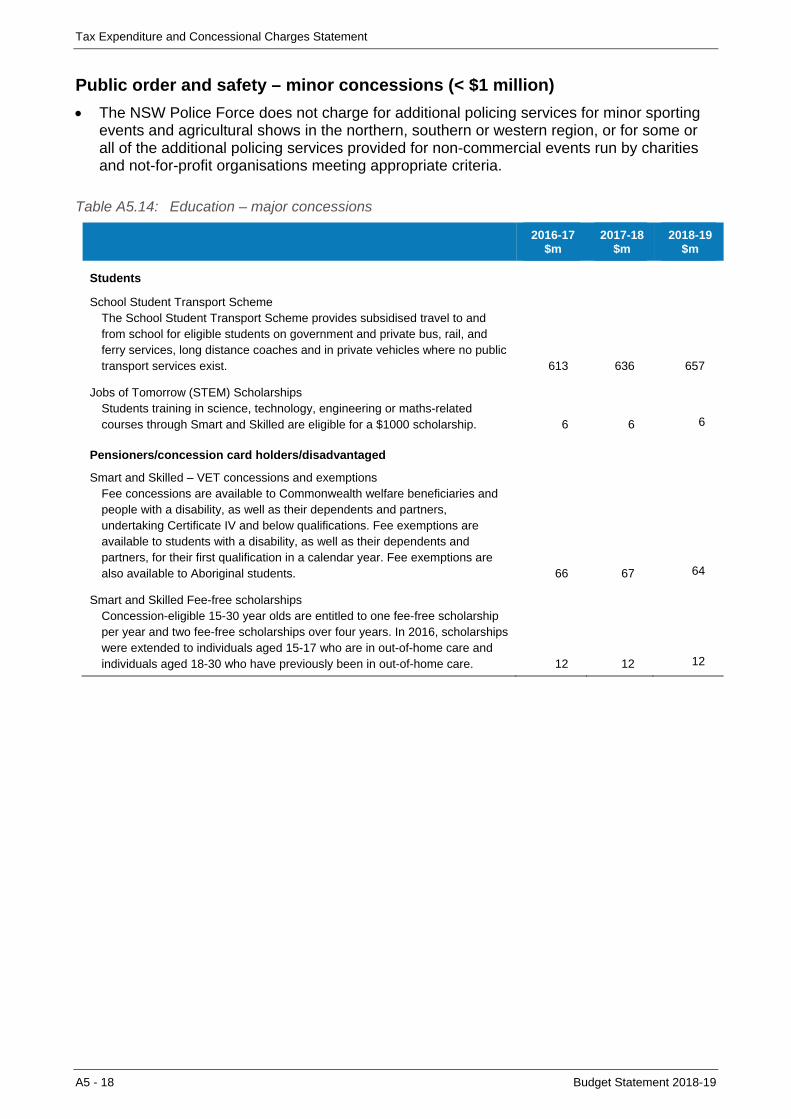
Tax Expenditure and Concessional Charges Statement
A5 - 18 Budget Statement 2018-19
Public order and safety – minor concessions (< $1 million)
The NSW Police Force does not charge for additional policing services for minor sporting events and agricultural shows in the northern, southern or western region, or for some or all of the additional policing services provided for non-commercial events run by charities and not-for-profit organisations meeting appropriate criteria.
Table A5.14: Education – major concessions
2016-17
$m 2017-18
$m 2018-19
$m
Students
School Student Transport Scheme The School Student Transport Scheme provides subsidised travel to and from school for eligible students on government and private bus, rail, and ferry services, long distance coaches and in private vehicles where no public transport services exist. 613 636 657
Jobs of Tomorrow (STEM) Scholarships Students training in science, technology, engineering or maths-related courses through Smart and Skilled are eligible for a $1000 scholarship. 6 6 6
Pensioners/concession card holders/disadvantaged
Smart and Skilled – VET concessions and exemptions Fee concessions are available to Commonwealth welfare beneficiaries and people with a disability, as well as their dependents and partners, undertaking Certificate IV and below qualifications. Fee exemptions are available to students with a disability, as well as their dependents and partners, for their first qualification in a calendar year. Fee exemptions are also available to Aboriginal students. 66 67 64
Smart and Skilled Fee-free scholarships Concession-eligible 15-30 year olds are entitled to one fee-free scholarship per year and two fee-free scholarships over four years. In 2016, scholarships were extended to individuals aged 15-17 who are in out-of-home care and individuals aged 18-30 who have previously been in out-of-home care. 12 12 12
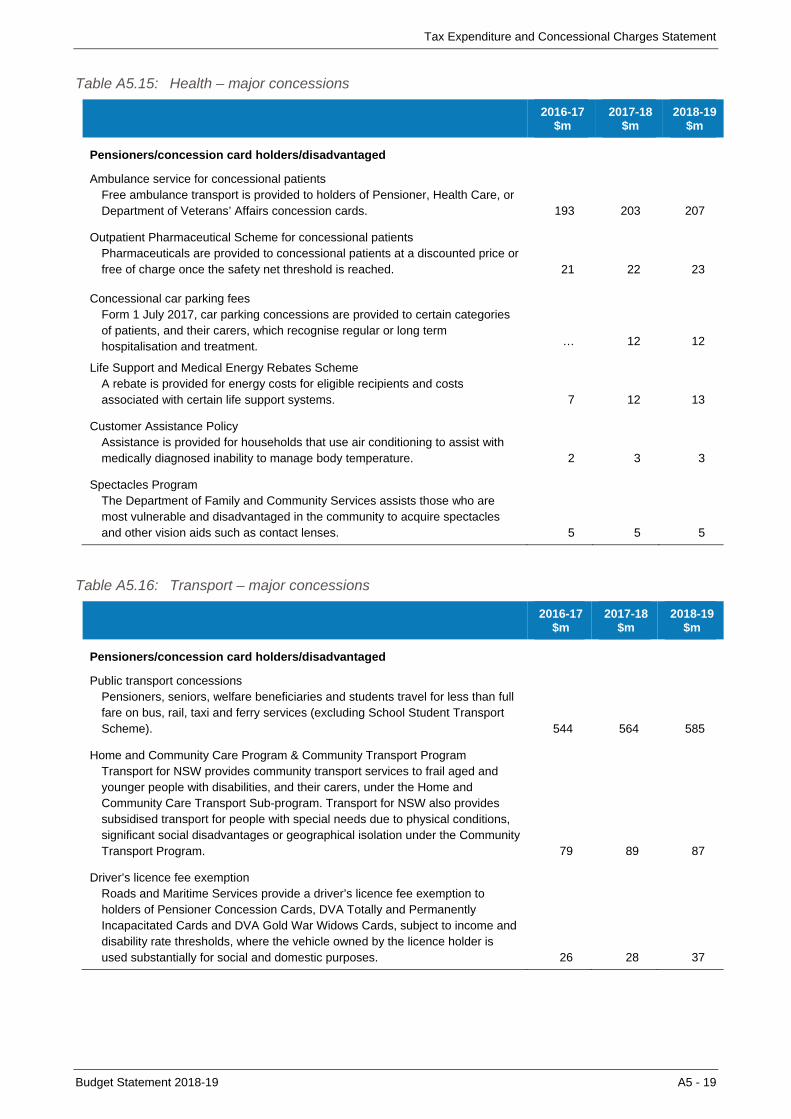
Tax Expenditure and Concessional Charges Statement
Budget Statement 2018-19 A5 - 19
Table A5.15: Health – major concessions
2016-17
$m 2017-18
$m 2018-19
$m
Pensioners/concession card holders/disadvantaged
Ambulance service for concessional patients Free ambulance transport is provided to holders of Pensioner, Health Care, or Department of Veterans’ Affairs concession cards. 193 203 207
Outpatient Pharmaceutical Scheme for concessional patients Pharmaceuticals are provided to concessional patients at a discounted price or free of charge once the safety net threshold is reached. 21 22 23
Concessional car parking fees Form 1 July 2017, car parking concessions are provided to certain categories of patients, and their carers, which recognise regular or long term hospitalisation and treatment. … 12 12
Life Support and Medical Energy Rebates Scheme A rebate is provided for energy costs for eligible recipients and costs associated with certain life support systems. 7 12 13
Customer Assistance Policy Assistance is provided for households that use air conditioning to assist with medically diagnosed inability to manage body temperature. 2 3 3
Spectacles Program The Department of Family and Community Services assists those who are most vulnerable and disadvantaged in the community to acquire spectacles and other vision aids such as contact lenses. 5 5 5
Table A5.16: Transport – major concessions
2016-17
$m 2017-18
$m 2018-19
$m
Pensioners/concession card holders/disadvantaged
Public transport concessions Pensioners, seniors, welfare beneficiaries and students travel for less than full fare on bus, rail, taxi and ferry services (excluding School Student Transport Scheme). 544 564 585
Home and Community Care Program & Community Transport Program Transport for NSW provides community transport services to frail aged and younger people with disabilities, and their carers, under the Home and Community Care Transport Sub-program. Transport for NSW also provides subsidised transport for people with special needs due to physical conditions, significant social disadvantages or geographical isolation under the Community Transport Program. 79 89 87
Driver’s licence fee exemption Roads and Maritime Services provide a driver’s licence fee exemption to holders of Pensioner Concession Cards, DVA Totally and Permanently Incapacitated Cards and DVA Gold War Widows Cards, subject to income and disability rate thresholds, where the vehicle owned by the licence holder is used substantially for social and domestic purposes. 26 28 37
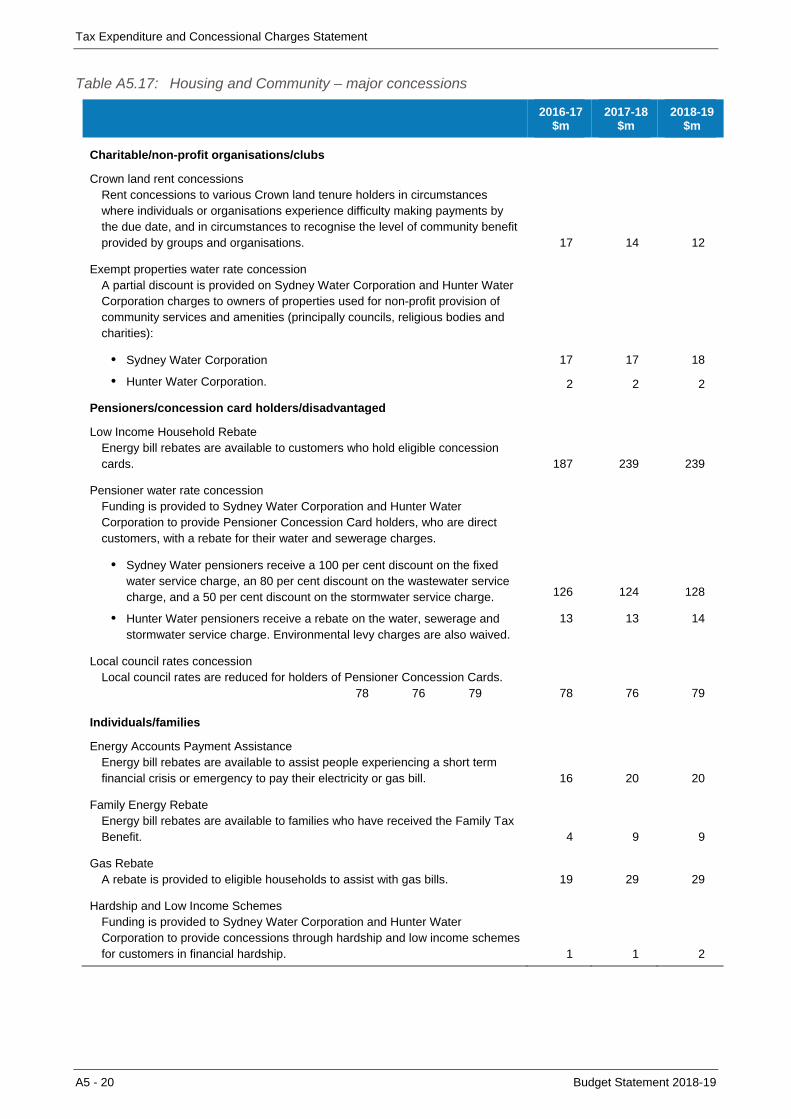
Tax Expenditure and Concessional Charges Statement
A5 - 20 Budget Statement 2018-19
Table A5.17: Housing and Community – major concessions
2016-17
$m 2017-18
$m 2018-19
$m
Charitable/non-profit organisations/clubs
Crown land rent concessions Rent concessions to various Crown land tenure holders in circumstances where individuals or organisations experience difficulty making payments by the due date, and in circumstances to recognise the level of community benefit provided by groups and organisations. 17 14 12
Exempt properties water rate concession A partial discount is provided on Sydney Water Corporation and Hunter Water Corporation charges to owners of properties used for non-profit provision of community services and amenities (principally councils, religious bodies and charities):
• Sydney Water Corporation 17 17 18
• Hunter Water Corporation. 2 2 2
Pensioners/concession card holders/disadvantaged
Low Income Household Rebate Energy bill rebates are available to customers who hold eligible concession cards. 187 239 239
Pensioner water rate concession Funding is provided to Sydney Water Corporation and Hunter Water Corporation to provide Pensioner Concession Card holders, who are direct customers, with a rebate for their water and sewerage charges.
• Sydney Water pensioners receive a 100 per cent discount on the fixed water service charge, an 80 per cent discount on the wastewater service charge, and a 50 per cent discount on the stormwater service charge. 126 124 128
• Hunter Water pensioners receive a rebate on the water, sewerage and stormwater service charge. Environmental levy charges are also waived.
13 13 14
Local council rates concession Local council rates are reduced for holders of Pensioner Concession Cards. 78 76 79 78 76 79
Individuals/families
Energy Accounts Payment Assistance Energy bill rebates are available to assist people experiencing a short term financial crisis or emergency to pay their electricity or gas bill. 16 20 20
Family Energy Rebate Energy bill rebates are available to families who have received the Family Tax Benefit. 4 9 9
Gas Rebate A rebate is provided to eligible households to assist with gas bills. 19 29 29
Hardship and Low Income Schemes Funding is provided to Sydney Water Corporation and Hunter Water Corporation to provide concessions through hardship and low income schemes for customers in financial hardship. 1 1 2
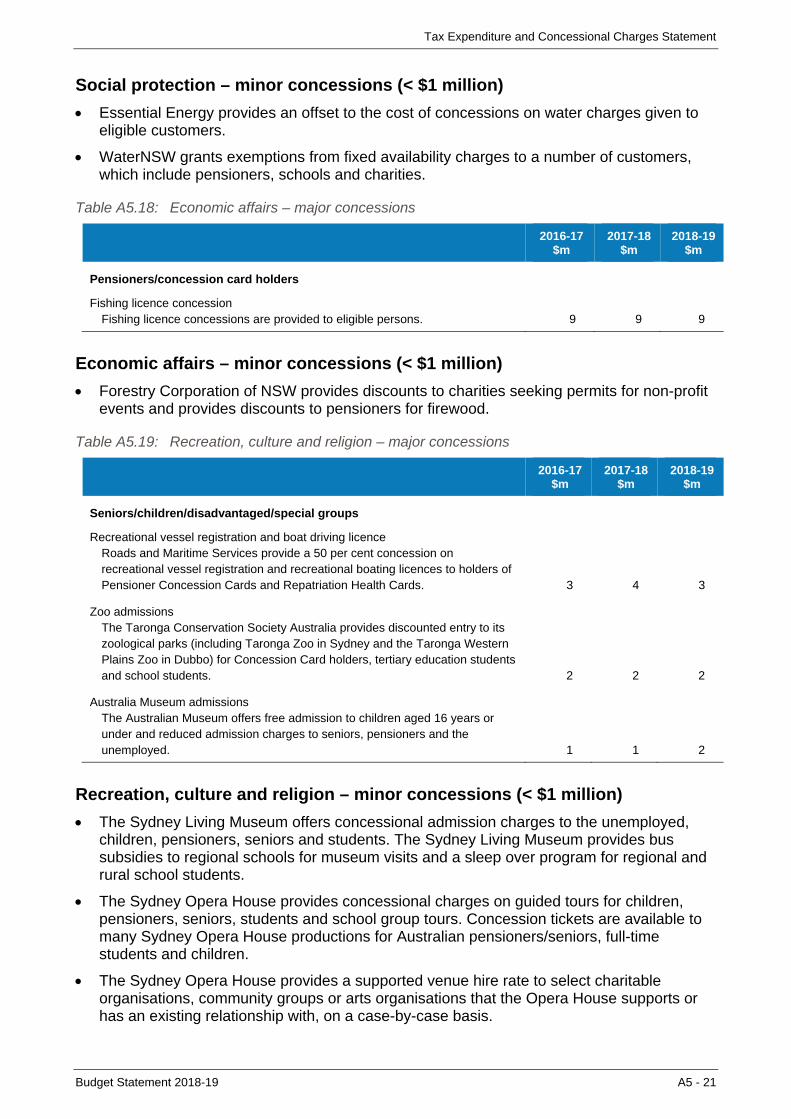
Tax Expenditure and Concessional Charges Statement
Budget Statement 2018-19 A5 - 21
Social protection – minor concessions (< $1 million)
Essential Energy provides an offset to the cost of concessions on water charges given to eligible customers.
WaterNSW grants exemptions from fixed availability charges to a number of customers, which include pensioners, schools and charities.
Table A5.18: Economic affairs – major concessions
2016-17
$m 2017-18
$m 2018-19
$m
Pensioners/concession card holders
Fishing licence concession Fishing licence concessions are provided to eligible persons. 9 9 9
Economic affairs – minor concessions (< $1 million)
Forestry Corporation of NSW provides discounts to charities seeking permits for non-profit events and provides discounts to pensioners for firewood.
Table A5.19: Recreation, culture and religion – major concessions
2016-17
$m 2017-18
$m 2018-19
$m
Seniors/children/disadvantaged/special groups
Recreational vessel registration and boat driving licence Roads and Maritime Services provide a 50 per cent concession on recreational vessel registration and recreational boating licences to holders of Pensioner Concession Cards and Repatriation Health Cards. 3 4 3
Zoo admissions The Taronga Conservation Society Australia provides discounted entry to its zoological parks (including Taronga Zoo in Sydney and the Taronga Western Plains Zoo in Dubbo) for Concession Card holders, tertiary education students and school students. 2 2 2
Australia Museum admissions The Australian Museum offers free admission to children aged 16 years or under and reduced admission charges to seniors, pensioners and the unemployed. 1 1 2
Recreation, culture and religion – minor concessions (< $1 million)
The Sydney Living Museum offers concessional admission charges to the unemployed, children, pensioners, seniors and students. The Sydney Living Museum provides bus subsidies to regional schools for museum visits and a sleep over program for regional and rural school students.
The Sydney Opera House provides concessional charges on guided tours for children, pensioners, seniors, students and school group tours. Concession tickets are available to many Sydney Opera House productions for Australian pensioners/seniors, full-time students and children.
The Sydney Opera House provides a supported venue hire rate to select charitable organisations, community groups or arts organisations that the Opera House supports or has an existing relationship with, on a case-by-case basis.

Tax Expenditure and Concessional Charges Statement
A5 - 22 Budget Statement 2018-19
The Sydney Opera House, through the Access Program, provides accessible performances and programs for people with disabilities, including free tailored excursions and tours, performing arts workshops and supported music programs.
The Museum of Applied Arts and Sciences provides concessional admission charges for children, students, seniors and the unemployed. Country residents are entitled to a concession on the Museum’s household membership. Concessional rates for venue hire apply to community or charitable groups.
Roads and Maritime Services offers a concession on private mooring licences to holders of Pensioner Concession Cards and Repatriation Health Cards.
Table A5.20: Environmental protection – major concessions
2016-17
$m 2017-18
$m 2018-19
$m
Seniors/children/disadvantaged/special groups
Entry to national parks Holders of Pensioner Concession Cards, seniors, volunteers and community groups receive free or discounted entry to National Parks. 11 14 12
Housing and community amenities – minor concessions (< $1 million)
Sydney Water Corporation provides discounted septic pump-out fees to residences in the Blue Mountains that are residential-zoned but not connected to the sewerage network.

Budget Statement 2018-19 B - 1
B. FISCAL RISKS AND BUDGET SENSITIVITIES
The 2018-19 Budget is prepared, in part, on forecasts and assumptions that are subject to variation. This appendix identifies the risks inherent in the budget and presents the budget result impact and/or balance sheet impacts of various sensitivities as a result of changes in select variables. Each sensitivity estimate adopts the same forecasts and assumptions used in preparing this Budget, for all variables other than that being tested.
The summary of key sensitivities should be used as a ‘rule of thumb’ estimated impact from a change in the variable presented. The sensitivities assume either a 1 per cent change or 1 percentage point change to the relevant factor each year as specified. A positive impact from the factor change improves the State’s budget result or net worth, whereas a negative impact from the factor change weakens the State’s budget result or net worth.
This appendix also contains a list of specific fiscal risks to the State. The development of these risks have the potential to affect the State’s budget and forward estimates. The potential impacts have not been included in the budget aggregates due to uncertainty in magnitude or timing. For further information on the State’s contingent assets and liabilities see Appendix C of this Budget Paper.
Operating Statement risks and sensitivities
State taxation revenue
The NSW Government collects taxation revenue from a range of sources, including transfer duty on property transactions, motor vehicle tax, payroll tax, land tax, gambling taxes and other duties and levies. The amount of revenue that these taxes generate each year is dependent on underlying economic drivers such as property transaction volumes and prices, employment growth, compensation of employees, and consumption growth. Changes in these underlying drivers can have a significant impact on the actual revenue collected.
Table B.1: Revenue sensitivities – state taxation revenues
2018-19 2019-20 2020-21 2021-22
Budget
$m $m $m $m
State tax revenues
Factors affecting state tax revenues
Dwelling sales growth 62 69 73 77
Change in employment growth 103 108 113 118
Change in growth of compensation of employees 100 106 111 116
2018-19 Sensitivities
Forward estimates
+ 1% movement
in factor(a)
Revenue source and assumptions
(a) 1 per cent movement in factor is a 1 percentage point increase.
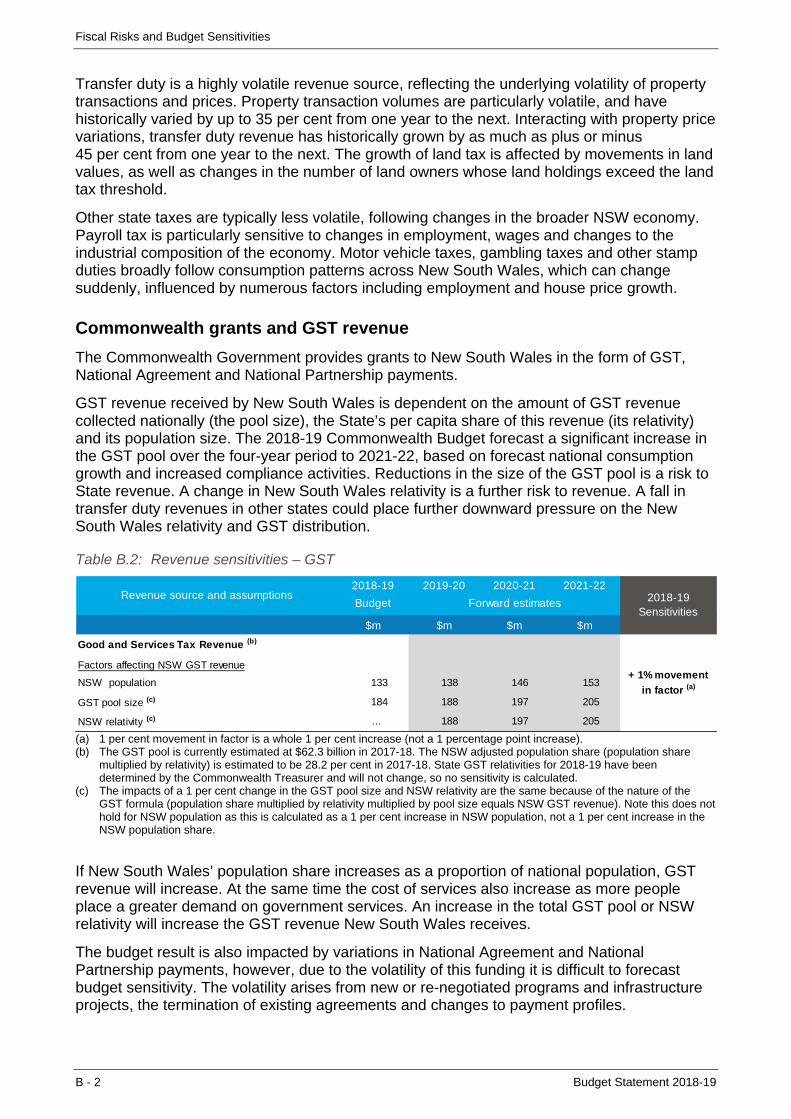
Fiscal Risks and Budget Sensitivities
B - 2 Budget Statement 2018-19
Transfer duty is a highly volatile revenue source, reflecting the underlying volatility of property transactions and prices. Property transaction volumes are particularly volatile, and have historically varied by up to 35 per cent from one year to the next. Interacting with property price variations, transfer duty revenue has historically grown by as much as plus or minus 45 per cent from one year to the next. The growth of land tax is affected by movements in land values, as well as changes in the number of land owners whose land holdings exceed the land tax threshold.
Other state taxes are typically less volatile, following changes in the broader NSW economy. Payroll tax is particularly sensitive to changes in employment, wages and changes to the industrial composition of the economy. Motor vehicle taxes, gambling taxes and other stamp duties broadly follow consumption patterns across New South Wales, which can change suddenly, influenced by numerous factors including employment and house price growth.
Commonwealth grants and GST revenue
The Commonwealth Government provides grants to New South Wales in the form of GST, National Agreement and National Partnership payments.
GST revenue received by New South Wales is dependent on the amount of GST revenue collected nationally (the pool size), the State’s per capita share of this revenue (its relativity) and its population size. The 2018-19 Commonwealth Budget forecast a significant increase in the GST pool over the four-year period to 2021-22, based on forecast national consumption growth and increased compliance activities. Reductions in the size of the GST pool is a risk to State revenue. A change in New South Wales relativity is a further risk to revenue. A fall in transfer duty revenues in other states could place further downward pressure on the New South Wales relativity and GST distribution.
Table B.2: Revenue sensitivities – GST
2018-19 2019-20 2020-21 2021-22
Budget
$m $m $m $m
Good and Services Tax Revenue (b)
Factors affecting NSW GST revenue
NSW population 133 138 146 153
GST pool size (c) 184 188 197 205
NSW relativity (c) ... 188 197 205
Revenue source and assumptions 2018-19 Sensitivities
Forward estimates
+ 1% movement
in factor (a)
(a) 1 per cent movement in factor is a whole 1 per cent increase (not a 1 percentage point increase). (b) The GST pool is currently estimated at $62.3 billion in 2017-18. The NSW adjusted population share (population share
multiplied by relativity) is estimated to be 28.2 per cent in 2017-18. State GST relativities for 2018-19 have been determined by the Commonwealth Treasurer and will not change, so no sensitivity is calculated.
(c) The impacts of a 1 per cent change in the GST pool size and NSW relativity are the same because of the nature of the GST formula (population share multiplied by relativity multiplied by pool size equals NSW GST revenue). Note this does not hold for NSW population as this is calculated as a 1 per cent increase in NSW population, not a 1 per cent increase in the NSW population share.
If New South Wales’ population share increases as a proportion of national population, GST revenue will increase. At the same time the cost of services also increase as more people place a greater demand on government services. An increase in the total GST pool or NSW relativity will increase the GST revenue New South Wales receives.
The budget result is also impacted by variations in National Agreement and National Partnership payments, however, due to the volatility of this funding it is difficult to forecast budget sensitivity. The volatility arises from new or re-negotiated programs and infrastructure projects, the termination of existing agreements and changes to payment profiles.

Fiscal Risks and Budget Sensitivities
Budget Statement 2018-19 B - 3
Royalties
Mineral royalties in New South Wales are primarily derived from coal, most of which is exported to East Asia, with a small quantity of gold and other minerals making a small contribution each year. Mining royalties are most sensitive to changes in foreign exchange rates, global coal prices and domestic production, but are exposed to numerous domestic and global risks that contribute to their historical volatility as a revenue source.
Mineral royalties are exposed to changes in foreign exchange rates due to coal exports being transacted in US dollars. An appreciation in the Australian dollar reduces the revenue received by the NSW Government, and can have secondary impacts on production and investment decisions in the sector.
Coal export price fluctuations are another major source of risk to mineral royalties and have historically been subject to rapid short-term volatility. Supply shocks, changes to export restrictions or alterations to investment in major coal-producing countries can rapidly inflate or reduce prices. Coal demand is equally susceptible to shocks, with the energy mix of coal-importing countries, weather conditions in the northern hemisphere and the relative costs of alternative fuel sources potentially impacting prices and royalty collections.
Coal export volumes are a less severe, but still significant, risk to royalty revenues. Capacity constraints and weather conditions can adversely affect rail and port operations, which can in turn slow coal exports unexpectedly.
Table B.3: Revenue sensitivities – royalties
2018-19 2019-20 2020-21 2021-22
Budget
$m $m $m $m
Royalties (b)
Factors affecting NSW Royalties
Coal export volumes (Mt) 17 16 16 15
Coal export prices ($US) 18 18 18 17
Australian-US dollar exchange rate (18) (17) (17) (16)
+ 1% movement
in factor (a)
Revenue source and assumptions 2018-19 Sensitivities
Forward estimates
(a) 1 per cent movement in factor is a whole 1 per cent increase (not a 1 percentage point increase). (b) Royalty sensitivities do not include changes to non-coal revenue or to the composition of coal types.
General expense risks
Employee-related expenses represent the budget’s largest operating expense. This consists of wages, salaries, superannuation expenses and employment on-costs. The size of the workforce, new enterprise bargaining agreements and discount rates are important drivers of employee-related expenses. Any changes in these parameters could have a significant impact on the budget result. Since 2011, this risk has been managed through the NSW public sector wages policy.
To enable the provision of government services to citizens, the government purchases goods and delivers services. Employee costs are a key driver of the cost of these services. Actual growth in demand for government services may exceed projections, which presents a further risk to employee-related expenses.
The State also incurs other operating expenses, relating to the non-labour costs of delivering services to customers across New South Wales. These include repair, maintenance and the depreciation of assets, and general operating costs such as electricity, insurance, ICT, fuel, communications and water, which are subject to market fluctuations.
Changes to inflation such as consumer price indexation, wage price index, or other market fluctuations can impact the budget. Higher inflation increases the cost of goods and services

Fiscal Risks and Budget Sensitivities
B - 4 Budget Statement 2018-19
expenditure, which outweighs the positive budget impact of increases in taxes and own-source revenue. The aggregate impact is predicted to worsen the budget result.
The cost of maintaining the State’s assets would also change if there were substantial changes in the size and growth of the State’s asset base. Expenses could also be impacted if the assets’ useful lives or level of depreciation were to materially change.
Table B.4: Expense sensitivities
2018-19 2019-20 2020-21 2021-22
Budget
$m $m $m $m
Expenses
Factors affecting expenses
Employee expenses (excl super) (316) (334) (345) (355)
Cost of goods and services (216) (211) (212) (225)
Government services demand growth
Factors affecting expenses
Health and Education expenses (387) (401) (418) (434)
+ 1% movement
in factor (a)
2018-19 Sensitivities
Forward estimates
+ 1% movement
in factor (a)
Expense source and assumptions
(a) 1 per cent movement in factor is a whole 1 per cent increase (not a 1 percentage point increase).
Health and education make up a large proportion of public sector expenditure. An increase in demand for these services will worsen the budget result. Likewise, a decrease in Commonwealth Government contributions to health and education services will worsen the budget result, if the level of service is maintained.
Increasing demand for public transport services also has implications for the budget result. The current 12 month rolling average for transport patronage growth is over 5 per cent, exceeding population growth. The NSW Government is providing more rail services through the More Trains, More Services program and further investments in this Budget for more regional and metropolitan bus services.
Investment revenue and borrowing costs
The budget is susceptible to the performance of global financial markets and changes in interest rates. Investment returns above/below those estimated will have a positive/negative impact on revenues. Higher interest rates may result in higher borrowing costs for new borrowings, but also provide higher interest revenue and higher investment distributions.
Table B.5: Financial markets and interest rates sensitivities
2018-19 2019-20 2020-21 2021-22
Budget
$m $m $m $m
Financial markets and interest rates
Investment Revenue (a) 199 201 165 134
Interest Revenue (b) 12 11 10 11
Interest Expenses (b) (3) (25) (65) (163)
Expense / Revenue source and assumptions 2018-19 Sensitivities
Forward estimates
+ 1% movement in factor
(a) 1 per cent movement in factor is a 1 percentage point increase in investment returns. (b) 1 per cent movement in factor is a 1 percentage point increase in interest rates.
Fiscal Risks and Budget Sensitivities
Budget Statement 2018-19 B - 5
Treasury continues to develop financial risk management strategies that optimise and protect the State’s balance sheet. For example, this year Treasury and TCorp have worked closely to assist agencies with the management of foreign exchange risk for business as usual and significant projects in these volatile markets. This approach results in greater cost certainty and cost-efficient arrangements for managing foreign exchange risk. This approach will continue to be applied in the future to provide cost effective and consistent management of foreign exchange, interest rate and commodity price risks.
Balance Sheet risks and sensitivities
Investments
The NSW Infrastructure Future Fund (NIFF)
The NIFF continues to deliver steady returns for the State. TCorp manages the NIFF to achieve long-term investment returns that are superior to fixed term deposits or cash.
Since its inception in December 2016, the NIFF has achieved investment gains of over $1 billion, representing a net return of 6.43 per cent per annum as at 30 April 2018. This investment return is well above the rate available from holding funds in the Treasury Banking System. The balance of the NIFF stands at $19.2 billion as at 30 April 2018, which comprises proceeds from asset recycling transactions, Commonwealth Government Asset Recycling Initiative payments, proceeds from Waratah Bonds, windfall tax revenue, and investment earnings.
The NIFF is invested strategically in a mix of defensive and growth assets. This asset allocation is designed to provide liquidity to fund the future requirements of the Restart NSW and Rebuilding NSW expenditure programs, stable income as well as exposure to higher yielding assets.
Social and Affordable Housing Fund (SAHF)
The SAHF was seeded with $1.1 billion of asset recycling proceeds in August 2017. In the eight months since its inception, the SAHF has returned 7.02 per cent, outperforming the strategic asset allocation benchmark and increasing funding for new and affordable housing stock.
TCorp manages the SAHF to provide a stable income stream for up to 25 years, facilitating the delivery and on-going servicing of 2,200 social and affordable homes from a mix of private and non-profit consortia.
Superannuation and long service leave liabilities
Liabilities for superannuation and long service leave are forecast based on a wide range of parameters. These include assumptions around salary growth, inflation, investment returns and discount rates. A change in any of these parameters may affect the actual liabilities of superannuation and long service leave. The long service leave liability is also subject to variations in the rate of employee retention.

Fiscal Risks and Budget Sensitivities
B - 6 Budget Statement 2018-19
Table B.6: Superannuation liabilities
2018-19 2019-20 2020-21 2021-22
Budget
$m $m $m $m
Superannuation liabilities (b)
Factors affecting superannuation liabilities
Change in public sector wages and salaries (140) (260) (360) (450)
Change in Sydney CPI (640) (1,250) (1,850) (2,600)
Change in investment return (c) 355 730 1,120 1,540
Change in discount rate (d) 8,300 ... ... ...
Factors affecting superannuation liabilities
Change in public sector wages and salaries 140 260 350 430
Change in Sydney CPI 640 1,340 1,930 2,740
Change in investment return (c) (355) (720) (1,100) (1,490)
Change in discount rate (d) (9,400) ... ... ...
+ 1% movement
in factor (a)
2018-19 Sensitivities
Forward estimatesNet financial liabilities (NFL) source and
assumptions
- 1% movement in
factor (a)
(a) 1 per cent movement in factor is a 1 percentage point increase. (b) For producing superannuation liabilities sensitivities, AASB 119 Employee Benefits is used. (c) A positive effect (e.g. improved investment returns) reduces NFL (improves the financial position), while a negative effect
(e.g. higher public sector wages) increases NFL (weakens the financial position). (d) Effect of a 1 percentage point increase/decrease in the indicated factor (discount rate, interest rate or rate of return).
An increase in public sector wages and salaries will increase superannuation entitlements of those employees on a defined benefits scheme still in the workforce, while an increase in CPI will increase the benefit payments to retired beneficiaries as their pension is indexed by the Sydney CPI. An increase in the investment return on superannuation assets will increase the proportion of the defined benefit that can be funded and will hence improve the budget result. For an explanation of the unfunded superannuation liability, refer to Chapter 7 of this Budget Statement.
Specific fiscal risks
Commonwealth related risks
Federal financial relations
The Commonwealth Government is making increasing use of legislative mechanisms as a way to establish National Agreements and National Partnership Agreements that impose stringent conditions upon New South Wales. Legislation is being used to secure long-standing federal funding (formerly delivered as Specific Purpose Payments) and used to support the ongoing delivery of public services. This trend presents real risks to the budgetary autonomy of the New South Wales Government whilst limiting the flexibility needed to deliver high quality services where they are most needed. Funding certainty is also exposed to increased risk. The Government continues to work closely with the Commonwealth and other states and territories to secure sustainable federal financial arrangements.

Fiscal Risks and Budget Sensitivities
Budget Statement 2018-19 B - 7
National schools funding
On 23 June 2017, the Australian Parliament passed amendments to the Australian Education Act 2013 (Cth). These amendments change national school funding arrangements for Australian schools. The NSW Government has entered into an interim agreement to support Commonwealth Government funding flowing to New South Wales schools in 2018. Multilateral and bilateral negotiations around national school funding arrangements beyond 2018 are ongoing and may impact State expenditure on schools in the medium term.
National Disability Insurance Scheme
New South Wales will transition to the full scheme NDIS from 1 July 2018, and its contribution exceeds $3.0 billion in 2018-19 indexed at 4 per cent each year. Under the full scheme NDIS Agreement, the Commonwealth Government will pay the balance of all NDIS costs above the New South Wales contribution.
National Redress Scheme for survivors of institutional child sexual abuse
On 9 March 2018, the NSW Government announced it would opt-in to the National Redress Scheme for survivors of institutional child sexual abuse. Liabilities for the National Redress Scheme are forecast based on a wide range of parameters. These include assumptions about the exposure and latency of reporting abuse in New South Wales, and the number of applicants. A change in any of these parameters may affect the actual liabilities and expenses of redress over the ten-year life of the Scheme.
Infrastructure related risks
Infrastructure projects
This year’s Budget includes a total estimated infrastructure program of $87.2 billion including $65.7 billion for general government agencies over the budget and forward estimates period. These estimates may vary as projects progress through the development, planning, procurement and delivery stages. The four-year capital program will also be impacted by the sale of a 51 per cent stake in Sydney Motorway Corporation to help fund the WestConnex M4-M5 Link. The transaction is progressing as planned and is expected to be completed by mid-2018. As a result, the WestConnex project may be de-consolidated from the State’s accounts, once the sale occurs.
Restart NSW
This Budget includes the estimated impact of future Restart NSW reservations and commitments to government agencies (which impact capital expenditure) and non-government proponents, principally local councils (which impact on expenses). These estimates include assumptions about the spending profile of approved projects and of potential future projects that have not yet been approved (with an assumption made as to when formal approvals will be made). This has been informed by the previous experience with Restart NSW projects.
Changes to timing of these approvals and project delivery may affect the estimates. Unreserved balances in Restart NSW are not reflected in the budget until a reservation or commitment is made. See Chapter 2 of the Infrastructure Statement for more information.

Fiscal Risks and Budget Sensitivities
B - 8 Budget Statement 2018-19
Snowy Hydro Legacy Fund
In March 2018, the NSW Government sold its 58 per cent shareholding in Snowy Hydro Limited to the Commonwealth Government, enabling $4.2 billion to be spent on infrastructure in regional and rural New South Wales. To facilitate this, the NSW Government will implement the Snowy Hydro Legacy Fund. Spending on projects attributed to the Fund will affect the budget estimates as projects are approved by Government. The 2018-19 Budget includes $40.0 million for investigative studies.
Maintenance and depreciation from NSW’s infrastructure program
The Government’s infrastructure investment program has supported growth in the State’s asset base. The larger asset base, which also reflect asset revaluations, will have flow-on effects to depreciation and maintenance expenses when assets are completed, many beyond the forward estimates. Between 2011-12 and 2017-18, the compound annual growth rate of depreciation was 8.9 per cent, compared to 4.3 per cent for total expenses. Over the four years to 2021-22, depreciation is projected to grow at an average rate of 3.8 per cent, compared to 3.2 per cent for total expenses. This risk associated with maintenance costs is partially contained by the Government’s use of Public Private Partnerships in its infrastructure program, which allow for risks relating to maintenance costs to be passed on to private sector contractors.
Government will continue to develop and implement appropriate policies and reforms to sustainably manage its maintenance and depreciation expenses, and their impact on the budget result.
Financial reporting and accounting related risks
Changes to Accounting Standards
The Australian Accounting Standards Board has issued several new Australian Accounting Standards (AAS) that apply from 2019-20, and are likely to have significant impacts on the State’s financial statements. The major new AAS are AASB 15 Revenue from Contracts with Customers, AASB 1058 Income of Not-for-Profits, AASB 16 Leases and AASB 1059 Service Concession Arrangements: Grantors.
The new AAS introduce changes including requiring most leases to be reported on the balance sheet, potential changes to the timing in the recognition of some revenue, and recognition of service concession assets and related liabilities at the commencement of service concession arrangements. The new AAS are expected to significantly increase assets and liabilities in the State’s balance sheet, and are also likely to impact the budget result. The NSW Government is currently assessing the effects of applying these new accounting standards on the forward estimates and is not yet able to reliably quantify the impact.
Transactions
In accordance with standard NSW budgeting practice, the State does not reflect the impact of major asset transactions until they are finalised. This enables the government to better manage the various risks and uncertainties associated with such transactions and minimise its interference with competitive tender processes.
Budget Statement 2018-19 C - 1
C. CONTINGENT ASSETS AND LIABILITIES
To support improved balance sheet management, government is reporting on its contingent assets and liabilities in the Budget for the first time. Unlike more well-known assets and liabilities, contingent assets and liabilities are uncertain and depend on a particular event occurring before being realised (see Box C.1 for technical definitions of contingent assets and liabilities).
The realisation of a contingent asset or liability can significantly impact the State’s budget. By identifying and, where possible, quantifying these contingent assets and liabilities, government is able to better manage risks and opportunities.
Box C.1: Accounting definition of contingent assets and liabilities
Accounting standard AASB 137 Provisions, Contingent Liabilities and Contingent Assets defines:
A contingent asset as:
a possible asset that arises from past events and whose existence will be confirmed only by the occurrence or non-occurrence of one or more uncertain future events not wholly within the control of the entity.
A contingent liability as:
a possible obligation that arises from past events and whose existence will be confirmed only by the occurrence or non-occurrence of one or more uncertain future events not wholly within the control of the entity; or
a present obligation that arises from past events but is not recognised because:
it is not probable that an outflow of resources embodying economic benefits will be required to settle the obligation; or
the amount of the obligation cannot be measured with sufficient reliability.
Contingent assets
Contingent assets are classified as either quantifiable, where their financial value is known or can be reasonably estimated, or non-quantifiable, where their financial value cannot be reasonably determined.
The State has no material, quantifiable contingent assets reported at 31 March 2018.

Contingent Assets and Liabilities
C - 2 Budget Statement 2018-19
Non-quantifiable contingent assets
Table C.1 notes the State’s non-quantifiable contingent assets.
Table C.1: General government non-quantifiable contingent assets
Contingent Asset Nature of the contingent asset
HIH Insurance Potential proceeds relating to the liquidation of HIH Insurance.
Data Centre Reform Project In the event the Government is obliged to make a payment to the financier, it is entitled to be reimbursed by the lessor, or holds recourse to security over the data centre and related assets.
Eastern Creek Alternative Waste Treatment Plant The Crown Entity holds a guarantee, a contingent asset, which fully offsets the same contingent liability.
Asbestos Injury Compensation Fund A contingent asset exists due to potential future loans the State may be required to make to the Fund through the existing lending facility.
Contingent liabilities
Contingent liabilities are also classified as either quantifiable or non-quantifiable. Table C.2 lists the State’s quantifiable contingent liabilities at 31 March 2018.
Table C.2: General government quantifiable contingent liabilities
General Government Sector
2017-18(c) 2016-17
$m $m
Department of Justice(a)
(Claims in Respect of Compensation and Litigation)
492
463
Roads and Maritime Services
(Land Acquisitions and Other)
974
701
Department of Education(b)
(Contractual Claims, Litigation and Other)
327
0
Other Agencies 58 9
1,851 1,173
(a) The Victims’ Support Scheme (VSS) was created on 3 June 2013 through the Victims’ Rights and Support Act 2013. (b) The Public Service Association (PSA) has filed an award hearing with the Industrial Relations Commission (IRC) seeking
an increase in pay of 35 per cent for all Support Administration Staff (SAS). If awarded in full this is estimated to be $327 million for fiscal 2017-18, or $1.1 billion over a three year period.
(c) As of reporting date at 31 March 2018.
Non-quantifiable contingent liabilities
The State faces a range of potential obligations that are non-quantifiable, which have been broadly grouped into the following categories:
commercial transactions
other contingent liabilities.

Contingent Assets and Liabilities
Budget Statement 2018-19 C - 3
As set out in Table C.3, the State is party to non-quantifiable contingent liabilities relating to commercial transactions. As an example, under several energy transactions government provided limited general warranties to purchasers and lessees. Government has also retained responsibility for the costs associated with remediating pre-existing contamination at several power station sites.
Table C.3: Commercial transaction-related non-quantifiable contingent liabilities
Transactions Nature of the contingent liabilities
Transactions related to:
Delta Electricity’s Western Assets, Eraring Energy, Vales Point Power Station, Colongra Power Station and Macquarie Generation
Various contingent liabilities, including:
Pre-completion contamination and land remediation liability
General Warranties
Coal haul road liability
Ash dam liability
Where an option is exercised under the handback deed, remediation of Vales Point and Site Land
Barnard River Scheme native title indemnity
Deed of indemnity for Directors and senior management
Transactions related to facilities at Port Kembla, Port Botany and Enfield and the Port of Newcastle
The State has indemnified the lessees in respect of pre-existing environmental contamination.
Sale of Pacific Power International The State must compensate the trustee of the Energy Industry Superannuation Scheme funds for a shortfall of assets in the reserves of the fund related to the transfer of defined benefit scheme membership to Aurecon.
Transactions related to Sydney Ferries, Eraring and Delta West Power Stations
The State bears the risk of the employer’s superannuation guarantee contributions being insufficient to fund the defined employee benefits for certain ex-public-sector employees. Indemnities have also been provided to the private sector employer in respect of certain losses suffered.
Transactions related to the lease of TransGrid, Ausgrid and Endeavour Energy
General Warranties
Deed of Indemnity
The State also holds non-quantifiable contingent liabilities relating to various other matters, as set out below in Table C.4.
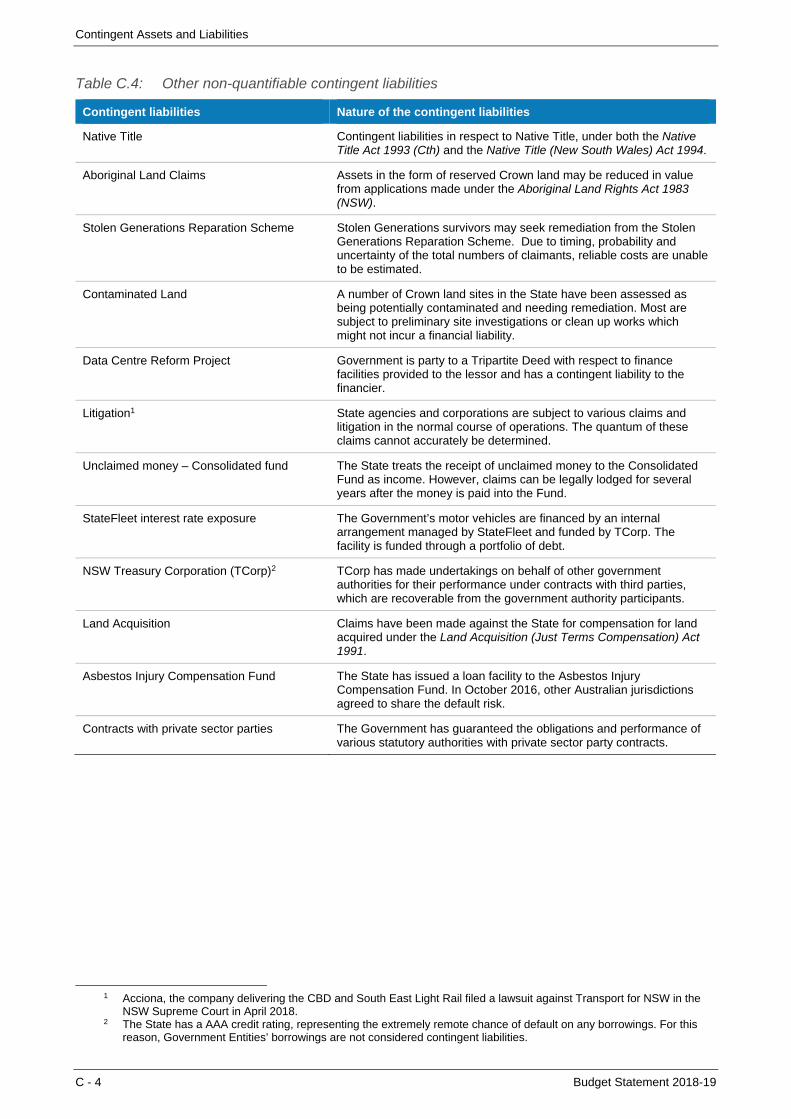
Contingent Assets and Liabilities
C - 4 Budget Statement 2018-19
Table C.4: Other non-quantifiable contingent liabilities
Contingent liabilities Nature of the contingent liabilities
Native Title Contingent liabilities in respect to Native Title, under both the Native Title Act 1993 (Cth) and the Native Title (New South Wales) Act 1994.
Aboriginal Land Claims Assets in the form of reserved Crown land may be reduced in value from applications made under the Aboriginal Land Rights Act 1983 (NSW).
Stolen Generations Reparation Scheme Stolen Generations survivors may seek remediation from the Stolen Generations Reparation Scheme. Due to timing, probability and uncertainty of the total numbers of claimants, reliable costs are unable to be estimated.
Contaminated Land A number of Crown land sites in the State have been assessed as being potentially contaminated and needing remediation. Most are subject to preliminary site investigations or clean up works which might not incur a financial liability.
Data Centre Reform Project Government is party to a Tripartite Deed with respect to finance facilities provided to the lessor and has a contingent liability to the financier.
Litigation1 State agencies and corporations are subject to various claims and litigation in the normal course of operations. The quantum of these claims cannot accurately be determined.
Unclaimed money – Consolidated fund The State treats the receipt of unclaimed money to the Consolidated Fund as income. However, claims can be legally lodged for several years after the money is paid into the Fund.
StateFleet interest rate exposure The Government’s motor vehicles are financed by an internal arrangement managed by StateFleet and funded by TCorp. The facility is funded through a portfolio of debt.
NSW Treasury Corporation (TCorp)2 TCorp has made undertakings on behalf of other government authorities for their performance under contracts with third parties, which are recoverable from the government authority participants.
Land Acquisition Claims have been made against the State for compensation for land acquired under the Land Acquisition (Just Terms Compensation) Act 1991.
Asbestos Injury Compensation Fund The State has issued a loan facility to the Asbestos Injury Compensation Fund. In October 2016, other Australian jurisdictions agreed to share the default risk.
Contracts with private sector parties The Government has guaranteed the obligations and performance of various statutory authorities with private sector party contracts.
1 Acciona, the company delivering the CBD and South East Light Rail filed a lawsuit against Transport for NSW in the
NSW Supreme Court in April 2018. 2 The State has a AAA credit rating, representing the extremely remote chance of default on any borrowings. For this
reason, Government Entities’ borrowings are not considered contingent liabilities.
Budget Statement 2018-19 D - 1
D. HISTORICAL FISCAL INDICATORS This Appendix reports the key fiscal indicators for the general government and total state sectors from 1996-97. Data are presented in accordance with Australian Accounting Standard AASB 1049 Whole of Government and General Government Sector Financial Reporting, consistent with the financial statements presented in Appendix A1 Statement of Finances.
The below tables are contained in this Appendix.
Table D.1 General Government Sector Operating Statement Aggregates
Table D.2 General Government Sector Balance Sheet and Financing Indicators
Table D.3 Total State Sector Operating Statement Aggregates
Table D.4 Total State Sector Balance Sheet and Financing Indicators
Table D.5 New South Wales Credit Metrics
Historical data from 2008-09 are consistent with data published in annual Outcomes Reports and Total State Sector Accounts. As Outcomes Reports and Total State Sector Accounts prior to 2008-09 were prepared in accordance with Government Finance Statistics, historical data prior to 2008-09 reflect data that have been backcast to be consistent with AASB 1049. The historical series have also been adjusted from 2005-06 to incorporate the retrospective application of amended AASB 119 Employee Benefits and the recognition of a share of assets and liabilities of Law Courts Limited and Murray-Darling Basin Authority in accordance with AASB 11 Joint Arrangements.

D - 2
Budg
et Statem
ent 2018-1
9
Historical F
iscal Indicators
Table D.1: General government sector operating statement aggregates
GSP(d)
(current prices)
$mPer cent of
GSP
Per cent growth - nominal
$mPer cent of
GSP
Per cent growth - nominal
$mPer cent of GSP
Per cent growth - nominal
$mPer cent of GSP
$mPer cent of GSP
$mPer cent of
GSP$m
1996-97 11,724 5.8 n.a. 26,089 12.8 n.a. 25,278 12.4 n.a. 811 0.4 2,607 1.3 (581) (0.3) 203,428
1997-98 12,897 6.0 10.0 27,335 12.7 4.8 26,017 12.1 2.9 1,317 0.6 2,736 1.3 (420) (0.2) 214,695
1998-99 14,115 6.2 9.4 28,950 12.8 5.9 27,900 12.3 7.2 1,050 0.5 3,002 1.3 (123) (0.1) 226,441
1999-00 15,185 6.3 7.6 30,556 12.6 5.5 28,530 11.8 2.3 2,026 0.8 2,733 1.1 1,345 0.6 241,679
2000-01 13,337 5.2 (12.2) 32,091 12.6 5.0 30,584 12.0 7.2 1,507 0.6 2,859 1.1 545 0.2 255,166
2001-02 13,210 5.0 (1.0) 33,843 12.8 5.5 32,263 12.2 5.5 1,580 0.6 3,102 1.2 588 0.2 264,592
2002-03 14,146 5.1 7.1 36,070 12.9 6.6 34,315 12.3 6.4 1,755 0.6 3,349 1.2 464 0.2 279,119
2003-04 15,018 5.0 6.2 37,657 12.5 4.4 36,502 12.2 6.4 1,155 0.4 3,332 1.1 44 0.0 300,102
2004-05 15,300 4.8 1.9 39,085 12.4 3.8 38,844 12.3 6.4 241 0.1 3,343 1.1 (660) (0.2) 315,881
2005-06 15,902 4.8 3.9 42,652 12.8 9.1 41,472 12.5 6.8 1,180 0.4 3,949 1.2 (317) (0.1) 332,374
2006-07 17,697 5.0 11.3 44,720 12.7 4.8 44,651 12.6 7.7 69 0.0 4,295 1.2 (1,775) (0.5) 352,995
2007-08 18,554 4.9 4.8 47,449 12.6 6.1 47,298 12.6 5.9 151 0.0 4,689 1.2 (1,798) (0.5) 376,630
2008-09 17,885 4.5 (3.6) 49,684 12.6 4.7 51,258 13.0 8.4 (1,574) (0.4) 5,264 1.3 (3,940) (1.0) 394,513
2009-10 19,129 4.6 7.0 56,344 13.6 13.4 56,453 13.7 10.1 (109) (0.0) 7,286 1.8 (3,736) (0.9) 413,303
2010-11 20,395 4.6 6.6 57,168 12.9 1.5 57,015 12.8 1.0 153 0.0 7,046 1.6 (4,097) (0.9) 444,477
2011-12 20,660 4.4 1.3 59,003 12.7 3.2 59,604 12.8 4.5 (551) (0.1) 5,881 1.3 (3,255) (0.7) 464,772
2012-13 21,980 4.6 6.4 60,130 12.5 1.9 61,891 12.9 3.8 (1,731) (0.4) 7,872 1.6 (4,138) (0.9) 479,854
2013-14 24,295 4.9 10.5 66,005 13.3 9.8 64,757 13.1 4.6 1,247 0.3 8,546 1.7 (1,236) (0.2) 495,303
2014-15 26,067 5.1 7.3 69,617 13.6 5.5 66,736 13.0 3.1 2,881 0.6 9,484 1.8 (126) (0.0) 513,529
2015-16 29,088 5.4 11.6 74,532 13.8 7.1 69,867 13.0 4.7 4,664 0.9 9,351 1.7 392 0.1 538,513
2016-17(a) 30,789 5.3 5.8 78,139 13.5 4.8 72,551 12.6 3.8 5,724 1.0 10,546 1.8 3,039 0.5 576,716
2017-18(b) 31,164 5.1 1.2 80,461 13.3 3.0 76,522 12.6 5.5 3,939 0.6 12,285 2.0 (2,989) (0.5) 606,000
2018-19(c) 31,146 4.9 (0.1) 81,081 12.9 0.8 79,656 12.6 4.1 1,425 0.2 17,329 2.7 (10,263) (1.6) 630,400
2019-20(c) 33,048 5.0 6.1 83,709 12.7 3.2 82,181 12.5 3.2 1,528 0.2 17,329 2.6 (9,861) (1.5) 658,000
2020-21(c) 34,365 5.0 4.0 85,728 12.4 2.4 84,316 12.2 2.6 1,412 0.2 16,585 2.4 (7,978) (1.2) 690,000
2021-22(c) 35,838 4.9 4.3 88,668 12.2 3.4 86,814 12.0 3.0 1,855 0.3 14,463 2.0 (5,111) (0.7) 724,400
Net Lending/ (Borrowing)
Taxation Revenue Total Revenue ExpensesNet Operating
BalanceGross Capital Expenditure
(a) Restated. (b) Revised. (c) Estimate. (d) Gross State Product.

Historical Fiscal Indicators
Budget Statement 2018-19 D - 3
Table D.2: General government sector balance sheet and financing indicators
$mPer cent of
GSP$m
Per cent of revenue
$mPer cent of
GSP$m
Per cent of GSP
1996-97 13,604 6.7 1,551 5.9 11,478 5.6 29,860 14.7
1997-98 14,795 6.9 1,490 5.5 10,823 5.0 29,441 13.7
1998-99 17,680 7.8 1,362 4.7 10,392 4.6 28,377 12.5
1999-00 15,857 6.6 1,348 4.4 9,771 4.0 24,590 10.2
2000-01 12,432 4.9 1,021 3.2 6,893 2.7 23,651 9.3
2001-02 11,211 4.2 868 2.6 5,422 2.0 24,502 9.3
2002-03 10,570 3.8 803 2.2 3,638 1.3 25,418 9.1
2003-04 11,189 3.7 789 2.1 2,970 1.0 25,072 8.4
2004-05 11,872 3.8 1,190 3.0 2,826 0.9 31,363 9.9
2005-06 12,404 3.7 1,209 2.8 1,483 0.4 32,066 9.6
2006-07 13,060 3.7 1,289 2.9 3,645 1.0 28,820 8.2
2007-08 13,874 3.7 1,320 2.8 5,663 1.5 34,079 9.0
2008-09 16,662 4.2 1,488 3.0 8,170 2.1 53,212 13.5
2009-10 19,075 4.6 1,674 3.0 9,161 2.2 57,716 14.0
2010-11 22,530 5.1 1,877 3.3 7,960 1.8 55,932 12.6
2011-12 26,885 5.8 2,082 3.5 14,127 3.0 80,497 17.3
2012-13 29,060 6.1 2,220 3.7 11,907 2.5 70,437 14.7
2013-14 31,040 6.3 2,249 3.4 6,869 1.4 70,715 14.3
2014-15 31,511 6.1 2,243 3.2 5,461 1.1 74,371 14.5
2015-16 31,847 5.9 2,209 3.0 (57) (0.0) 87,611 16.3
2016-17(a) 32,814 5.7 2,149 2.8 (9,344) (1.6) 65,690 11.4
2017-18(b) 32,678 5.4 2,011 2.5 (9,797) (1.6) 62,925 10.4
2018-19(c) 34,379 5.5 2,044 2.5 2,559 0.4 71,146 11.3
2019-20(c) 40,367 6.1 2,295 2.7 14,133 2.1 79,393 12.1
2020-21(c) 43,724 6.3 2,665 3.1 22,207 3.2 86,438 12.5
2021-22(c) 47,112 6.5 2,766 3.1 28,660 4.0 89,407 12.3
Borrowings(d) Interest Expense Net Debt(e) Net Financial Liabilities(f)
(a) Restated. (b) Revised. (c) Estimate. (d) Includes borrowings and derivatives at fair value including finance leases and borrowings at amortised cost. (e) Net debt consists of the sum of deposits held, advances received, loans and other borrowings less the sum of cash and
deposits, advances paid and investments, loans and placements. (f) Net financial liabilities equal total liabilities less financial assets, excluding equity in other public sector entities.
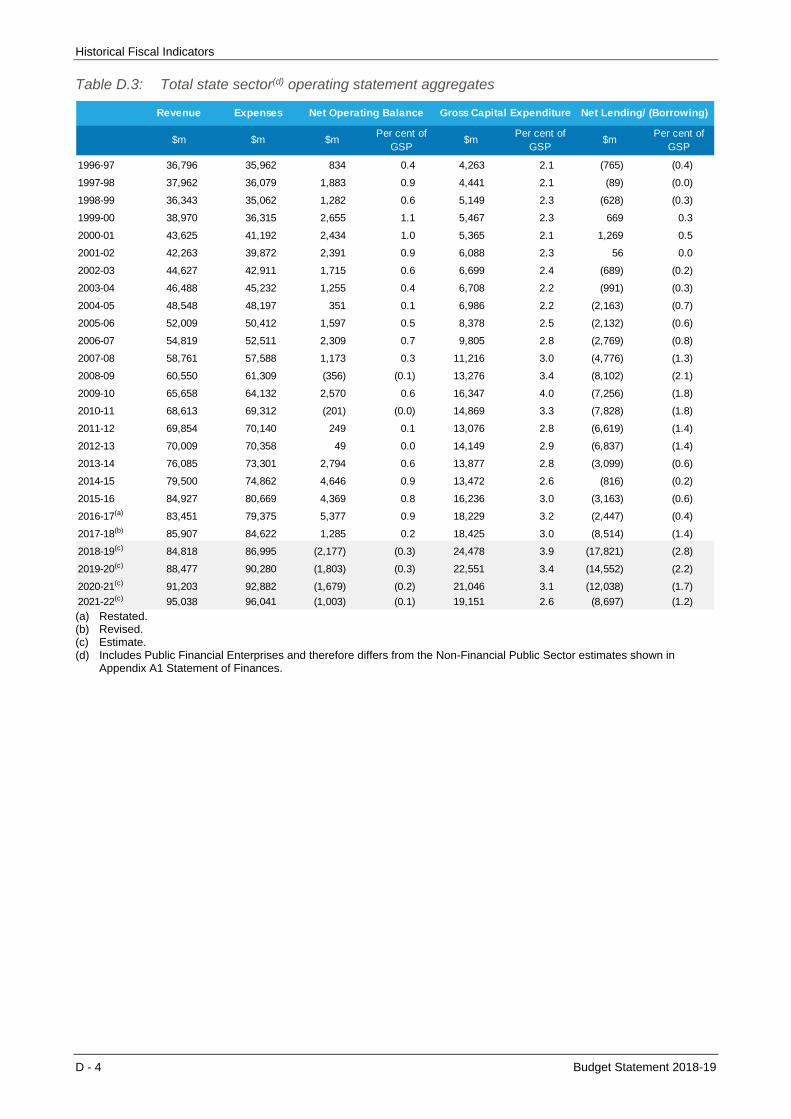
Historical Fiscal Indicators
D - 4 Budget Statement 2018-19
Table D.3: Total state sector(d) operating statement aggregates
Revenue Expenses
$m $m $mPer cent of
GSP$m
Per cent of GSP
$mPer cent of
GSP
1996-97 36,796 35,962 834 0.4 4,263 2.1 (765) (0.4)
1997-98 37,962 36,079 1,883 0.9 4,441 2.1 (89) (0.0)
1998-99 36,343 35,062 1,282 0.6 5,149 2.3 (628) (0.3)
1999-00 38,970 36,315 2,655 1.1 5,467 2.3 669 0.3
2000-01 43,625 41,192 2,434 1.0 5,365 2.1 1,269 0.5
2001-02 42,263 39,872 2,391 0.9 6,088 2.3 56 0.0
2002-03 44,627 42,911 1,715 0.6 6,699 2.4 (689) (0.2)
2003-04 46,488 45,232 1,255 0.4 6,708 2.2 (991) (0.3)
2004-05 48,548 48,197 351 0.1 6,986 2.2 (2,163) (0.7)
2005-06 52,009 50,412 1,597 0.5 8,378 2.5 (2,132) (0.6)
2006-07 54,819 52,511 2,309 0.7 9,805 2.8 (2,769) (0.8)
2007-08 58,761 57,588 1,173 0.3 11,216 3.0 (4,776) (1.3)
2008-09 60,550 61,309 (356) (0.1) 13,276 3.4 (8,102) (2.1)
2009-10 65,658 64,132 2,570 0.6 16,347 4.0 (7,256) (1.8)
2010-11 68,613 69,312 (201) (0.0) 14,869 3.3 (7,828) (1.8)
2011-12 69,854 70,140 249 0.1 13,076 2.8 (6,619) (1.4)
2012-13 70,009 70,358 49 0.0 14,149 2.9 (6,837) (1.4)
2013-14 76,085 73,301 2,794 0.6 13,877 2.8 (3,099) (0.6)
2014-15 79,500 74,862 4,646 0.9 13,472 2.6 (816) (0.2)
2015-16 84,927 80,669 4,369 0.8 16,236 3.0 (3,163) (0.6)
2016-17(a) 83,451 79,375 5,377 0.9 18,229 3.2 (2,447) (0.4)
2017-18(b) 85,907 84,622 1,285 0.2 18,425 3.0 (8,514) (1.4)
2018-19(c) 84,818 86,995 (2,177) (0.3) 24,478 3.9 (17,821) (2.8)
2019-20(c) 88,477 90,280 (1,803) (0.3) 22,551 3.4 (14,552) (2.2)
2020-21(c) 91,203 92,882 (1,679) (0.2) 21,046 3.1 (12,038) (1.7)
2021-22(c) 95,038 96,041 (1,003) (0.1) 19,151 2.6 (8,697) (1.2)
Net Operating Balance Gross Capital Expenditure Net Lending/ (Borrowing)
(a) Restated. (b) Revised. (c) Estimate. (d) Includes Public Financial Enterprises and therefore differs from the Non-Financial Public Sector estimates shown in
Appendix A1 Statement of Finances.
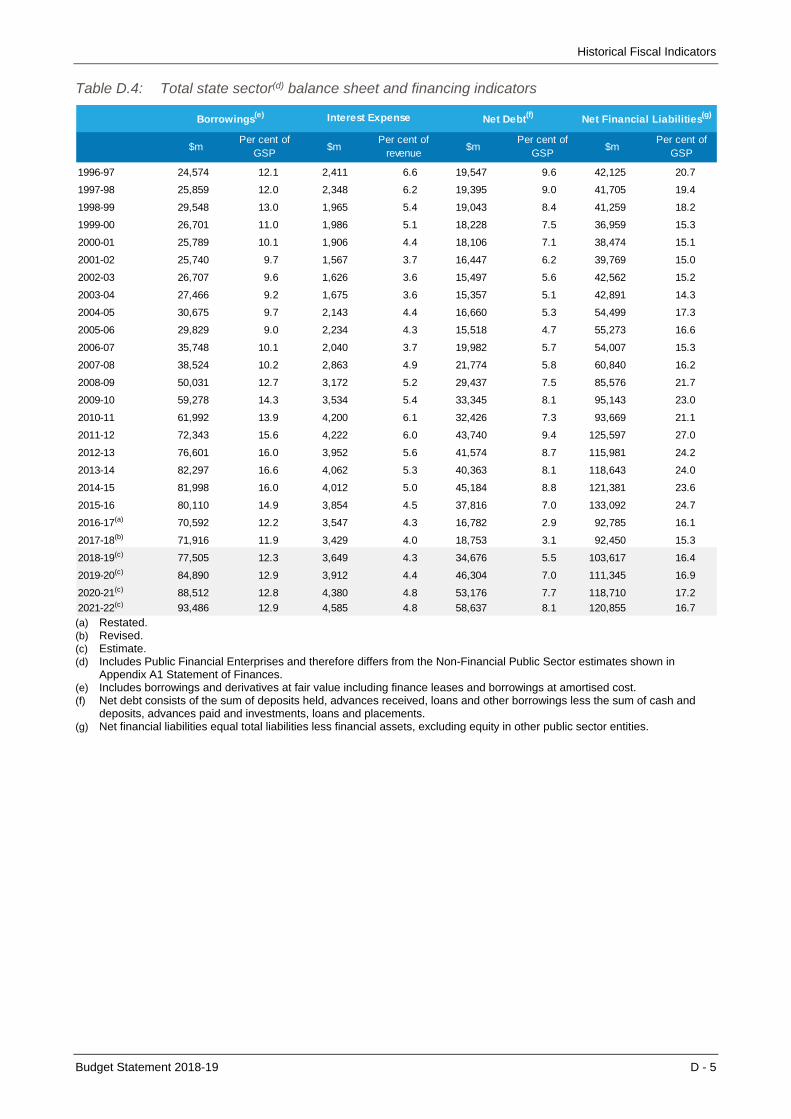
Historical Fiscal Indicators
Budget Statement 2018-19 D - 5
Table D.4: Total state sector(d) balance sheet and financing indicators
$mPer cent of
GSP$m
Per cent of revenue
$mPer cent of
GSP$m
Per cent of GSP
1996-97 24,574 12.1 2,411 6.6 19,547 9.6 42,125 20.7
1997-98 25,859 12.0 2,348 6.2 19,395 9.0 41,705 19.4
1998-99 29,548 13.0 1,965 5.4 19,043 8.4 41,259 18.2
1999-00 26,701 11.0 1,986 5.1 18,228 7.5 36,959 15.3
2000-01 25,789 10.1 1,906 4.4 18,106 7.1 38,474 15.1
2001-02 25,740 9.7 1,567 3.7 16,447 6.2 39,769 15.0
2002-03 26,707 9.6 1,626 3.6 15,497 5.6 42,562 15.2
2003-04 27,466 9.2 1,675 3.6 15,357 5.1 42,891 14.3
2004-05 30,675 9.7 2,143 4.4 16,660 5.3 54,499 17.3
2005-06 29,829 9.0 2,234 4.3 15,518 4.7 55,273 16.6
2006-07 35,748 10.1 2,040 3.7 19,982 5.7 54,007 15.3
2007-08 38,524 10.2 2,863 4.9 21,774 5.8 60,840 16.2
2008-09 50,031 12.7 3,172 5.2 29,437 7.5 85,576 21.7
2009-10 59,278 14.3 3,534 5.4 33,345 8.1 95,143 23.0
2010-11 61,992 13.9 4,200 6.1 32,426 7.3 93,669 21.1
2011-12 72,343 15.6 4,222 6.0 43,740 9.4 125,597 27.0
2012-13 76,601 16.0 3,952 5.6 41,574 8.7 115,981 24.2
2013-14 82,297 16.6 4,062 5.3 40,363 8.1 118,643 24.0
2014-15 81,998 16.0 4,012 5.0 45,184 8.8 121,381 23.6
2015-16 80,110 14.9 3,854 4.5 37,816 7.0 133,092 24.7
2016-17(a) 70,592 12.2 3,547 4.3 16,782 2.9 92,785 16.1
2017-18(b) 71,916 11.9 3,429 4.0 18,753 3.1 92,450 15.3
2018-19(c) 77,505 12.3 3,649 4.3 34,676 5.5 103,617 16.4
2019-20(c) 84,890 12.9 3,912 4.4 46,304 7.0 111,345 16.9
2020-21(c) 88,512 12.8 4,380 4.8 53,176 7.7 118,710 17.2
2021-22(c) 93,486 12.9 4,585 4.8 58,637 8.1 120,855 16.7
Borrowings(e) Interest Expense Net Debt(f) Net Financial Liabilities(g)
(a) Restated. (b) Revised. (c) Estimate. (d) Includes Public Financial Enterprises and therefore differs from the Non-Financial Public Sector estimates shown in
Appendix A1 Statement of Finances. (e) Includes borrowings and derivatives at fair value including finance leases and borrowings at amortised cost. (f) Net debt consists of the sum of deposits held, advances received, loans and other borrowings less the sum of cash and
deposits, advances paid and investments, loans and placements. (g) Net financial liabilities equal total liabilities less financial assets, excluding equity in other public sector entities.
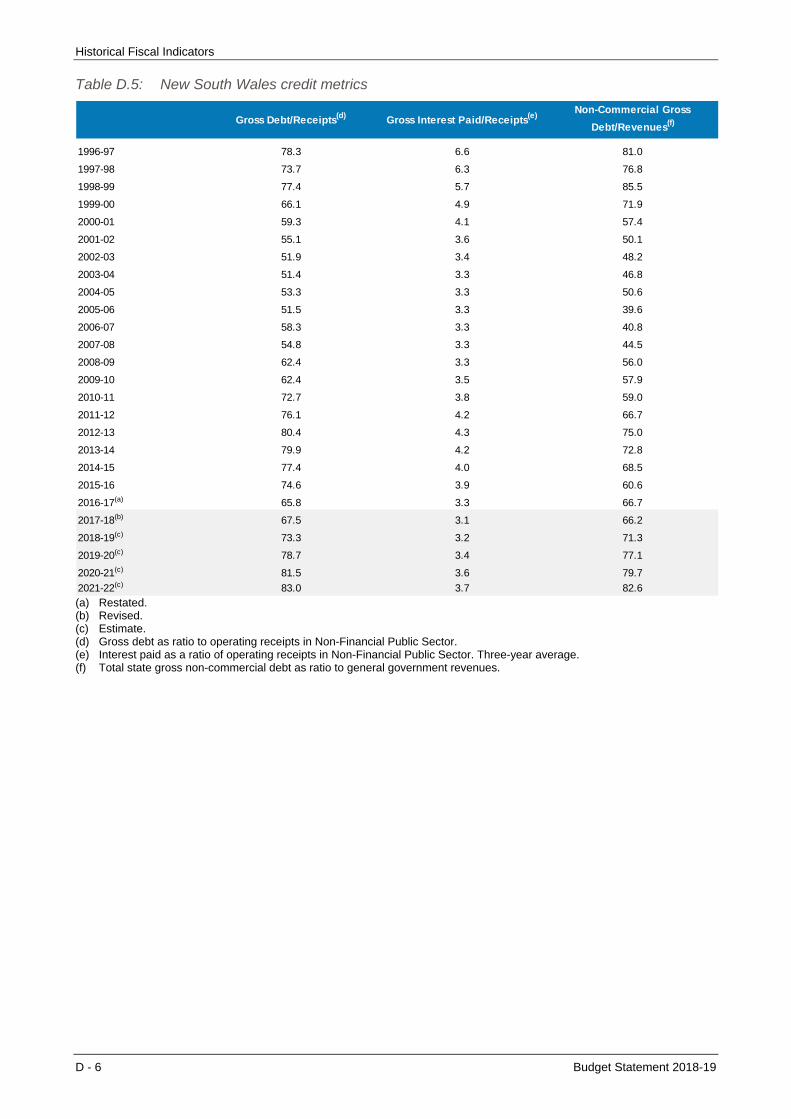
Historical Fiscal Indicators
D - 6 Budget Statement 2018-19
Table D.5: New South Wales credit metrics
1996-97 78.3 6.6 81.0
1997-98 73.7 6.3 76.8
1998-99 77.4 5.7 85.5
1999-00 66.1 4.9 71.9
2000-01 59.3 4.1 57.4
2001-02 55.1 3.6 50.1
2002-03 51.9 3.4 48.2
2003-04 51.4 3.3 46.8
2004-05 53.3 3.3 50.6
2005-06 51.5 3.3 39.6
2006-07 58.3 3.3 40.8
2007-08 54.8 3.3 44.5
2008-09 62.4 3.3 56.0
2009-10 62.4 3.5 57.9
2010-11 72.7 3.8 59.0
2011-12 76.1 4.2 66.7
2012-13 80.4 4.3 75.0
2013-14 79.9 4.2 72.8
2014-15 77.4 4.0 68.5
2015-16 74.6 3.9 60.6
2016-17(a) 65.8 3.3 66.7
2017-18(b) 67.5 3.1 66.2
2018-19(c) 73.3 3.2 71.3
2019-20(c) 78.7 3.4 77.1
2020-21(c) 81.5 3.6 79.7
2021-22(c) 83.0 3.7 82.6
Gross Debt/Receipts(d) Gross Interest Paid/Receipts(e)Non-Commercial Gross
Debt/Revenues(f)
(a) Restated. (b) Revised. (c) Estimate. (d) Gross debt as ratio to operating receipts in Non-Financial Public Sector. (e) Interest paid as a ratio of operating receipts in Non-Financial Public Sector. Three-year average. (f) Total state gross non-commercial debt as ratio to general government revenues.

Budget Statement 2018-19 E - 1
E. PERFORMANCE AND REPORTING UNDER THE FISCAL RESPONSIBILITY ACT
The Fiscal Responsibility Act 2012 (FRA) requires the Government to report on performance against the FRA’s object, targets and principles as part of the budget papers.
The FRA sets the policy objective of maintaining the State’s triple-A credit rating. To this end, it commits the Government to meet two fiscal targets and follow three principles of sound financial management (see Table E.1).
Table E.1: Fiscal Responsibility Act – object, targets and principles
Object Fiscal targets Fiscal principles
Maintain the triple-A credit rating
Expense growth kept below long-term average revenue growth
Responsible and sustainable spending, taxation and infrastructure investment aligning general government revenue and
expense growth stable and predictable taxation policies investment in infrastructure that has the
highest benefit for the community Effective financial and asset policies: performance management and reporting asset maintenance and enhancement funding decisions risk management practices
Eliminate unfunded superannuation liabilities by 2030
Achieving intergenerational equity
policy to have regard for its effects on future generations
the current generation to fund the cost of its services
Performance
Performance against the object
New South Wales has maintained the State’s triple-A credit rating, meeting the object of the FRA.
The triple-A rating was reaffirmed by S&P (Standard & Poor’s – S&P Global Ratings) in September 2017 and by Moody’s (Moody’s Investors Service) in October 2017.
As a sub-sovereign, the ratings for states and territories are capped by the rating on the sovereign. Accordingly, following S&P’s decision to place Australia on negative outlook in July 2016, S&P have kept New South Wales, Victoria and the Australian Capital Territory on negative outlook. Should the Australian Government be downgraded, the New South Wales Government will continue to manage the State’s fiscal position in line with a triple-A credit rating.
New South Wales is one of only five states or provinces outside the United States holding a triple-A credit rating from both Moody’s and S&P (refer Table E.2).

Performance and Reporting Under the Fiscal Responsibility Act
E - 2 Budget Statement 2018-19
Table E.2: New South Wales is one of five states rated triple-A by Moody’s and S&P
Moody’s Standard & Poor’s
New South Wales New South Wales
Victoria Victoria
Baden-Wuerttemberg (DE) Australian Capital Territory
Bavaria (DE) British Columbia (CA)
Brandenburg (DE) Baden-Wuerttemberg (DE)
Saskatchewan (CA) Bavaria (DE)
British Columbia (CA) Saxony (DE)
Aargau (CH)
Vaud (CH)
Zurich (CH)
Note: shows states and provinces Abbreviations: CA (Canada), CH (Switzerland) and DE (Germany)
Chart E1: New South Wales has the highest ratings possible in Australia
NSW VIC QLD SA WA TAS NT ACT
AAA(Aaa)
AA+(Aa1)
AA(Aa2)
AA-(Aa3)
(nr)
S&P Moody's
Performance against FRA targets and principles
The Fiscal Responsibility Act 2012 sets out two fiscal targets and three principles of sound financial management to help support the object of the Act, as described in Table E.1.
Target 1 – Expense growth to not exceed long-run revenue growth
The specific limit on annual expense growth (set by Fiscal Responsibility Regulation 2013) is 5.6 per cent.
This limit has been enforced through tight control over new expense proposals, a legislated wage policy limiting employee cost growth to 2.5 per cent, and annual savings targets.
Tight spending controls have succeeded in holding expense growth below the target limit across the first five years of the FRA and will continue to do so over the four years of this Budget (as shown in Chart E2).

Performance and Reporting Under the Fiscal Responsibility Act
Budget Statement 2018-19 E - 3
Chart E2: Expense growth and target
2
3
4
5
6
7
2012-13 2013-14 2014-15 2015-16 2016-17 2017-18 2018-19 2019-20 2020-21 2021-22
Pe
rce
nt
Growth in expenses FRA Target
Target 2 – Eliminating unfunded super liabilities by 2030
The Government is required to fully fund all the State’s superannuation liabilities by 2030. To achieve this, the funding plan needs to respond to fluctuations in the discount rate used to determine the liability, and the market performance of the offsetting financial assets. The Government, assisted by actuarial advisors, closely monitors the funding program to ensure the progressive elimination of this liability before the 2030 deadline. The next triennial review commences later in 2018.
Total state unfunded super liabilities have been reduced from $71.2 billion at June 2016 to an estimated $51.6 billion at June 2018. They are projected to decline to $37.8 billion at June 2022 – and zero at June 2030 (see Chapter 7 of this Budget Statement for a detailed analysis).
Principle 1 – Responsible and sustainable spending, taxation and infrastructure investment
This calls for a strong and sustainable fiscal position, shown by an operating position appropriate for current conditions, and debt that can be sustainably managed while providing recurrent services and infrastructure investment.
Responsible and sustainable spending will be reflected in the alignment of revenue and expense growth. This is supported by FRA Target 1 that requires keeping expense growth below the long-term revenue growth rate of 5.6 per cent.
State taxation has remained stable and low, with the ratio of tax receipts to GSP declining from 5.4 per cent in 2015-16 to a projected 4.9 per cent in 2018-19, and remaining around that ratio across the forward years of this Budget (as shown in Chart E3).

Performance and Reporting Under the Fiscal Responsibility Act
E - 4 Budget Statement 2018-19
Chart E3: Taxation revenue, ratio to GSP
4.0
4.5
5.0
5.5
6.0
2012-13 2013-14 2014-15 2015-16 2016-17 2017-18 2018-19 2019-20 2020-21 2021-22
Pe
rce
nt
The Government has maintained a record program of public infrastructure investment. Total investment by the non-financial public sector (NFPS) as a share of GSP increased to 3.2 per cent in 2016-17 and is projected to rise to 3.9 per cent in 2018-19, with a moderation in the forward years of the budget.
The sustainability of this investment has been maintained by financing it through current budget surpluses and proceeds from the asset recycling program to the extent possible, which have moderated the need for additional debt.
Principle 2 – Effective financial and asset management policies
The policies targeted under this principle include performance management and reporting, asset maintenance and enhancement, funding decisions and risk management practices.
The State’s balance sheet management, funding decisions and risk management continued to be strengthened by the Government’s Assets and Liabilities Committee (ALCO).
This included important work to improve cash management and the management of the State’s asset and liability portfolios (see Chapter 7 of this Budget Statement).
Financial management improvement took further steps forward in 2017-18 with:
the passage of the Government Sector Finance Act 2018 which modernises financial structures, principles, guidelines and controls across the entire public sector
establishment of the NSW Generations Fund (refer Chapter 7)
strengthened reporting and management of contingent assets and liabilities.
Principle 3 – Progress in achieving intergenerational equity
The FRA commits the Government to ensure that policy decisions are made having regard to their financial effects on future generations; and the current generation funds the cost of its services.
Performance and Reporting Under the Fiscal Responsibility Act
Budget Statement 2018-19 E - 5
Each budget reports the impact of its measures on the long-term fiscal gap, which is a summary indicator of the budget’s financial effect on future generations.1 The 2016 Intergenerational Report highlighted the impact on ageing on the demand for government services and infrastructure. If current trends continue, a widening fiscal gap will emerge between state government revenues and service and infrastructure requirements. At the time of the 2016-17 Budget, the gap was projected to be 3.4 per cent of GSP by 2055-56.
There is no change to the fiscal gap as a result of measures in this Budget. Revenue measures, such as raising the payroll tax threshold and the introduction of the point of consumption tax, are offset by expense measures, primarily efficiency dividends. Changes in the profile of capital expenditure have no material impact on the fiscal gap to 2055-56. Projects funded from asset recycling are excluded, as these represent a reallocation of capital rather than additional spending.
The impact of budget measures on the long-term fiscal gap was estimated to be 0.1 per cent in 2015-16, nil in 2016-17, 0.1 per cent in 2017-18 and no change for 2018-19. This shows that prudent budget management continues to be effective in limiting the financial burden shifted to future taxpayers.
1 The fiscal gap is the difference between the base period primary balance as a share of gross state product (GSP) and
the primary balance as a share of GSP at the end of the projection period, on a no policy change basis. The primary balance is the gap between spending and revenue excluding interest transactions but including net capital expenditure. A positive gap implies that fiscal pressures will be building over the projection period.
Budget Statement 2018-19 F - 1
GLOSSARY
ABS Government Finance
Statistics GFS Manual
(ABS GFS)
The ABS publication Australian System of Government Finance Statistics: Concepts, Sources
and Methods as updated from time to time.
Appropriation The funds appropriated by Parliament from the consolidated fund to Ministers for the purposes of
funding agency activities.
Allocation 2018-19 The amount of project expenditure approved in the 2018-19 Budget.
Budget result (net
operating balance)
The budget result represents the difference between expenses and revenues from transactions
for the general government sector. This measure is equivalent to the net operating balance
adopted in accounting standard AASB 1049 Whole-of-Government and General Government
Sector Financial Reporting.
Capital expenditure This is expenditure relating to the acquisition or enhancement of property, plant and equipment
(including land and buildings, plant and equipment and infrastructure systems) and intangibles
(including computer software and easements). Capital expenditure also includes assets acquired
using finance leases.
Capital grants Amounts paid or received for capital purposes for which no economic benefits of equal value are
receivable or payable in return.
Cash surplus/(deficit) Net cash flows from operating activities plus net cash flows from acquisition and disposal of non-
financial assets (less distributions paid for the public non-financial corporation (PNFC) and public
financial corporation (PFC) sectors).
Classification of the
functions of government –
Australia (COFOG-A)
A system of classification for revenue, expenses, and transactions in non-financial assets,
according to the primary purpose for the outlay (e.g. health, education, transport). This replaces
the former government purpose classification (GPC) breakdown.
Contingent assets and
liabilities
Possible future assets or obligations that arise from past events and whose existence will be
confirmed only be the occurrence or non-occurrence of one or more uncertain future events not
wholly in control of the State.
Cluster NSW Government entities have been consolidated into clusters reflecting broad policy areas of
Government. These clusters are not legal entities. They are administrative arrangements that
bring together a group of different legal and administrative entities.
Cluster grants This represents the amount appropriated out of the Consolidated Fund to the principal agency of
the cluster and then passed on by the principal agencies to the other government agencies within
the cluster to fund their services.
Commitments*
(Restart NSW)
Inflows that are committed to be spent on an individual project. A Restart NSW commitment can
only be recognised once the Treasurer has accepted a specific funding recommendation from
Infrastructure NSW for an individual project, as required by the Restart NSW Fund Act 2011
(Restart Act).
Comprehensive Result
(Change in net worth)
Change in net worth (comprehensive result) is revenue from transactions less expenses from
transactions plus other economic flows and measures the variation in a government’s
accumulated assets and liabilities.
Consolidated Fund The fund is established under s39 of the Constitution Act 1902 to collect public monies collected
on behalf of the State.
Crown Entity Includes the Crown Finance Entity and the Consolidated Fund.
Glossary
F - 2 Budget Statement 2018-19
Crown Finance Entity The Crown Finance Entity acts as the residual entity for NSW whole-of-government transactions
that are not the responsibility of any other state public sector agency. Major assets reported by
the Crown Finance Entity include investments for the NSW Infrastructure Future Fund and Social
Affordable Housing Fund.
Current grants Amounts paid or received for current purposes for which no economic benefits of equal value are
receivable or payable in return.
Estimated total cost
(ETC)
Represents the current cost estimate of planning, procuring and delivering the
infrastructure/project/asset. The ETC may change as more detailed planning is undertaken and
further information on market conditions becomes available. Due to commercial sensitivities, the
ETC for some major works is not included.
Elimination Removes the impact of transactions between government entities when preparing consolidated
financial statements.
Fiscal aggregates These are analytical balances that are useful for macroeconomic purposes, including assessing
the impact of a government and its sectors on the economy. AASB 1049 Whole-of-Government
and General Government Sector Financial Reporting prescribes the net operating balance
(budget result), net lending/borrowing (fiscal balance), change in net worth (comprehensive
result), net debt, net worth, and cash surplus/(deficit).
Fiscal gap The fiscal gap is the difference between the base period primary balance as a share of gross
state product (GSP) and the primary balance as a share of GSP at the end of the projection
period, on a no policy change basis. The primary balance is the gap between spending and
revenue excluding interest transactions but including net capital expenditure. A positive gap
implies that fiscal pressures will be building over the projection period.
Fiscal Responsibility Act
2012 (FRA)
The Act sets out both medium-term and long-term fiscal targets and principles providing a
framework for budgeting in New South Wales.
Forward estimates Refers to the period from 2019-20 to 2021-22.
General government
sector (GGS)
This is an ABS classification of agencies that provide public services (such as health, education
and police), or perform a regulatory function. General government agencies are funded in the
main by taxation (directly or indirectly).
government / Government ‘government’ refers to the institution of government and is used as a pronoun in these budget
papers (e.g. government department).
The ‘Government’ refers to the present Government constituted by the Executive.
Government finance
statistics (GFS)
A system of financial reporting developed by the International Monetary Fund and used by the
Australian Bureau of Statistics to classify the financial transactions of governments and measure
their impact on the rest of the economy.
Grants for on-passing All grants paid to one institutional sector (for example, a state government) to be passed on to
another institutional sector (for example, local government or a non-profit institution). For New
South Wales, these primarily comprise grants from the Commonwealth Government to be
on-passed to specified private schools, and to specified local government authorities.
Gross state product
(GSP)
The total market value of final goods and services produced within a state.
Inflows*
(Restart NSW)
Funds deposited into Restart NSW, including proceeds from asset recycling transactions,
Commonwealth Government Asset Recycling Initiative payments, proceeds from Waratah Bonds,
windfall tax revenue, and investment earnings, which are then invested into Rebuilding NSW and
other Restart NSW projects.
Interest expense Costs incurred in connection with the borrowing of funds. It includes interest on advances, loans,
overdrafts, bonds and bills, deposits, interest components of finance lease repayments, and
amortisation of discounts or premiums in relation to borrowings. Where discounting is used, the
carrying amount of a liability increases in each period to reflect the passage of time. This increase
is also recognised as an interest expense.

Glossary
Budget Statement 2018-19 F - 3
Machinery of government
(MoG)
MoG changes vary in scope and can involve: the abolition or creation of new government entities;
the merger or absorption of entities; and small or large transfers of policy, program or service
delivery responsibilities to other entities.
Major works Refers to projects with an estimated total cost of $250,000 or above, subdivided into new projects
(approved to begin in 2018-19) and works in progress (commenced before 2018-19 but not yet
completed).
Minor works Refers to projects with an estimated total cost below $250,000, such as minor plant and
equipment or annual provisions for replacements.
National Agreement
(please also see National
Specific Purpose
Payments)
National Agreements define the objectives, outcomes, outputs and performance indicators, and
clarify the roles and responsibilities that guide the Commonwealth and the States in the delivery
of services across a particular sector. The sectors include; Health, Education, Skills and
Workforce, Disability and Indigenous.
National Partnership
Payment (NPP)
A Commonwealth Government grant to States and Territories to support the delivery of specified
outputs or projects, to facilitate reforms or to reward the delivery of nationally significant
reforms. Each NPP is supported by a National Partnership Agreement which defines mutually
agreed objectives, outputs and performance benchmarks.
National Specific Purpose
Payments (SPP)
A Commonwealth Government grant made to the States and Territories under the associated
National Agreement. These grants must be spent in the key service delivery sector (Health,
Education, Skills and Workforce, Disability and Indigenous) for which it is provided. States are
free to allocate the funds within that sector to achieve the mutually agreed objectives specified in
the associated National Agreement.
Net acquisition of
non-financial assets
This is purchases (or acquisitions) of non-financial assets less sales (or disposals) of
non-financial assets less depreciation plus changes in inventories and other movements in
non-financial assets. Purchases and sales (or net acquisitions) of non-financial assets generally
include accrued expenses and payables for capital items. Other movement in non-financial assets
include non-cash capital grant revenue/expenses such as developer contribution assets.
Net financial assets See net financial worth.
Net debt Net debt equals the sum of financial liabilities (deposits held, advances received, loans and other
borrowings) less the sum of financial assets (cash and deposits, advances paid and investments,
loans and placements).
Net financial liabilities
(NFL)
This is the total liabilities less financial assets, other than equity in PNFCs and PFCs. It is a more
accurate indicator than net debt of a jurisdiction’s fiscal position. This is because it is a broader
measure than net debt in that it includes significant liabilities other than borrowings (for example,
accrued employee liabilities such as superannuation and long service leave entitlements). For the
PNFC and PFC sectors, it is equal to negative net financial worth. For the general government
sector NFL, excluding the net worth of other sectors results in a purer measure than net financial
worth as, in general, the net worth of other sectors of government is backed up by physical
assets.
Net financial worth Net financial worth measures a government’s net holdings of financial assets.
It is calculated from the balance sheet as financial assets less liabilities. It is a broader measure
than net debt, in that it incorporates provisions made (such as superannuation) as well as
holdings of equity. It includes all classes of financial assets and liabilities, only some of which are
included in net debt.
Net interest on the
net defined benefit
liability/asset
This is the change during the period to the net defined benefit liability/asset that arises from the
passage of time.
Net lending/(borrowing) This is the financing requirement of government, calculated as the net operating balance less the
net acquisition of non-financial assets. It also equals transactions in financial assets less
transactions in liabilities. A positive result reflects a net lending position and a negative result
reflects a net borrowing position.
Net operating balance
(budget result)
This is calculated as revenue from transactions less expenses from transactions.
Glossary
F - 4 Budget Statement 2018-19
Net worth This is an economic measure of wealth and is equal to total assets less liabilities.
Nominal dollars/prices This shows the dollars of the relevant period. No adjustment is made each time period for
inflation.
Non-financial public
sector (NFPS)
This is a sub-sector formed by the consolidation of the general government sector and public non-
financial corporations (PNFC) sector.
Operating Result This is a measure of financial performance of the operations for the period. It is the net result of
items of revenue, gains and expenses (including losses) recognised for the period, excluding
those that are classified as ‘other non-owner movements in equity’.
Other economic flows These are the changes in the volume or value of an asset or liability that do not result from
transactions (that is, revaluations and other changes in the volume of assets).
Payables A liability that includes short and long-term trade creditors, and accounts payable.
Program group A group of aligned activities aimed at delivering an agreed outcome. These activities may be
performed by more than one agency.
Public Finance and Audit
Act 1983
An Act to make provision with respect to the administration and audit of public finances and for
other purposes.
Public Private
Partnerships (PPP)
The creation of an infrastructure asset through private sector financing and private ownership for
a concession period (usually long term). The Government may contribute to the project by
providing land or capital works, through risk sharing, revenue diversion or purchase of the agreed
services.
Public financial
corporations (PFC)
An ABS classification of agencies that have one, or more, of the following functions:
that of a central bank
the acceptance of demand, time or savings deposits or
the authority to incur liabilities and acquire financial assets in the market on their own
account.
Public non-financial
corporations (PNFC)
Government controlled agencies where user charges represent a significant proportion of revenue
and the agencies operate within a broadly commercial orientation.
Receivables An asset that includes short and long-term trade debtors, accounts receivable and interest
accrued.
Recurrent expenditure * see Total expenses
Reservations*
(Restart NSW)
Inflows that are reserved with a view to a future commitment. A Restart NSW reservation can only
become a commitment once the Treasurer has accepted a specific Infrastructure NSW
recommendation for each individual project.
Restart NSW A fund established by the NSW Government in 2011. Funds deposited into Restart NSW come
from asset recycling transactions, Commonwealth Government asset recycling initiative
payments, proceeds from Waratah Bonds, windfall tax revenue and investment earnings.
Rebuilding NSW The NSW Government’s 10-year plan to invest $20 billion in new infrastructure funded by
electricity network transactions, Commonwealth Government asset recycling initiative payments,
and investment earnings. Proceeds are first deposited into Restart NSW before being invested
into Rebuilding NSW projects.
Services These are the ‘end products’ or direct services that are delivered to clients or recipients, the
broader community or another government agency. They are expected to contribute to
Government priorities.
Social Impact
Investments (SII)
Social impact investments aim to achieve social returns as well as financial returns, with
measurement of both. For government, partnering in such transactions is a way of harnessing
capital and expertise from across public, private and not-for-profit sectors in order to tackle
social challenges.
Glossary
Budget Statement 2018-19 F - 5
Special deposit account A Special Deposits Account is to consists of:
(a) all accounts of money that the Treasurer is, under statutory authority, required to hold
otherwise than for or on account of the Consolidated Fund, and
(b) all accounts of money that are directed or authorised to be paid to the Special Deposits
Account by or under legislation.
State-owned corporation
(SOC)
Government entities (mostly PNFCs) which have been established with a governance structure
mirroring as far as possible that of a publicly listed company. NSW state owned corporations are
scheduled under the State Owned Corporations Act 1989 (Schedule 5).
State Outcomes Priority outcomes which the government is seeking to achieve for the people of New South
Wales. Outcomes indicators measure the government’s progress towards achieving State
Outcomes.
Superannuation interest
cost
This is the net interest on the net defined benefit liability/asset determined by multiplying the net
defined benefit liability/asset by the discount rate (government bond rate).
Other superannuation
expense
This includes all superannuation expenses from transactions except superannuation interest cost.
It generally includes all employer contributions to accumulation schemes and the current service
cost, which is the increase in defined benefit entitlements associated with the employment
services provided by employees in the current period. Superannuation actuarial gains/losses are
excluded as they are disclosed as an other economic flow.
Surplus/deficit
(net result)
In Budget Paper No.3 Budget Estimates this is the agency accounting result which corresponds to
profit or loss in private sector financial reports. It equals the net cost of services adjusted for
government contributions. This is not the same as the budget result or the GFS cash
surplus/(deficit).
Total Asset Management
(TAM)
An agency's TAM plan sets out its asset expenditure priorities and funding projections over a
rolling ten-year period, to ensure physical asset management plans are aligned with service
priorities and performance targets, and are financially sustainable. TAM covers the acquisition,
maintenance, operation and disposal of all physical assets, including land, buildings,
infrastructure, plant and equipment, and information technology.
Total expenses
The total amount of expenses incurred in the provision of goods and services, regardless of
whether a cash payment is made to meet the expense in the same year. It does not include
expenditure on the purchase of assets. It also excludes losses, which are classified as other
economic flows.
Total revenues This is the total amount of revenue due by way of taxation, Commonwealth Government grants
and from other sources (excluding asset sales) regardless of whether a cash payment is received.
It excludes gains, which are classified as other economic flows.
Total state sector This represents all agencies and corporations owned and controlled by the NSW Government. It
comprises the general government, public non-financial corporations and public financial
corporations.
Uniform Presentation
Framework (UPF)
The uniform presentation framework provides uniformity in presentation of financial information so
that users of the information can make valid comparisons between jurisdictions.
* terms used when referring to the Restart NSW and Rebuilding NSW programs
To gain a better understanding of the terminology and key aggregates used in these budget papers, a glossary of terms can be
found in Note 37 of the Report on State Finances 2016-17.