budgetoverview–legislativeperspective ... briefings/december 2015... ·...
TRANSCRIPT
Budget Overview –Legislative Perspective –Legislative Briefing 12/01/2015
Stephen Klein
Legislative Joint Fiscal Office
1
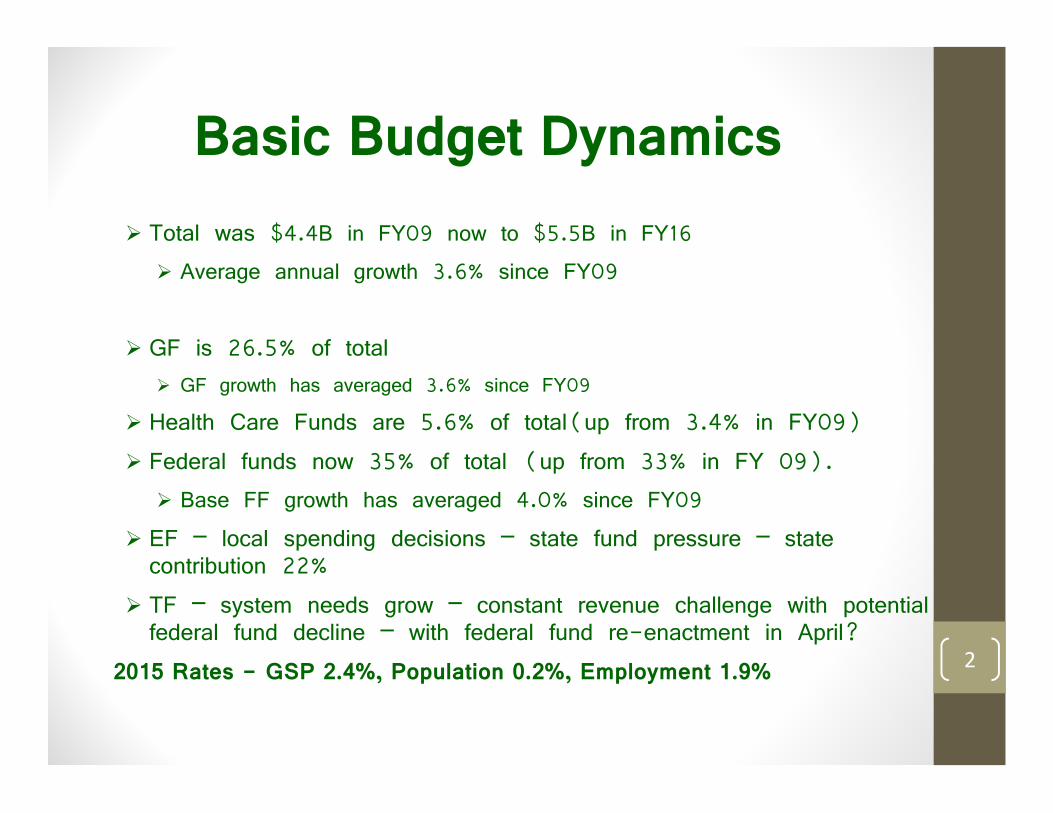
Basic Budget Dynamics
Total was $4.4B in FY09 now to $5.5B in FY16
Average annual growth 3.6% since FY09
GF is 26.5% of total
GF growth has averaged 3.6% since FY09
Health Care Funds are 5.6% of total(up from 3.4% in FY09)
Federal funds now 35% of total (up from 33% in FY 09).
Base FF growth has averaged 4.0% since FY09
EF – local spending decisions – state fund pressure – statecontribution 22%
TF – system needs grow – constant revenue challenge with potentialfederal fund decline – with federal fund re-enactment in April?
2015 Rates - GSP 2.4%, Population 0.2%, Employment 1.9% 2

Net EducationProperty Taxes
3
General Fund26.5%
Transportation Fund & TIB5.0%
Education Fund22.5%
Special funds5.4%
Healthcare funds5.6%
Federal Funds34.9%
FY16 Appropriations By Fund$5.5B
Net EdProperty
DedicatedEF Revenues
GF transfer is not in EF %it is reflected in the GF %
Focus is on Appropriations butRevenue forecast is important
4
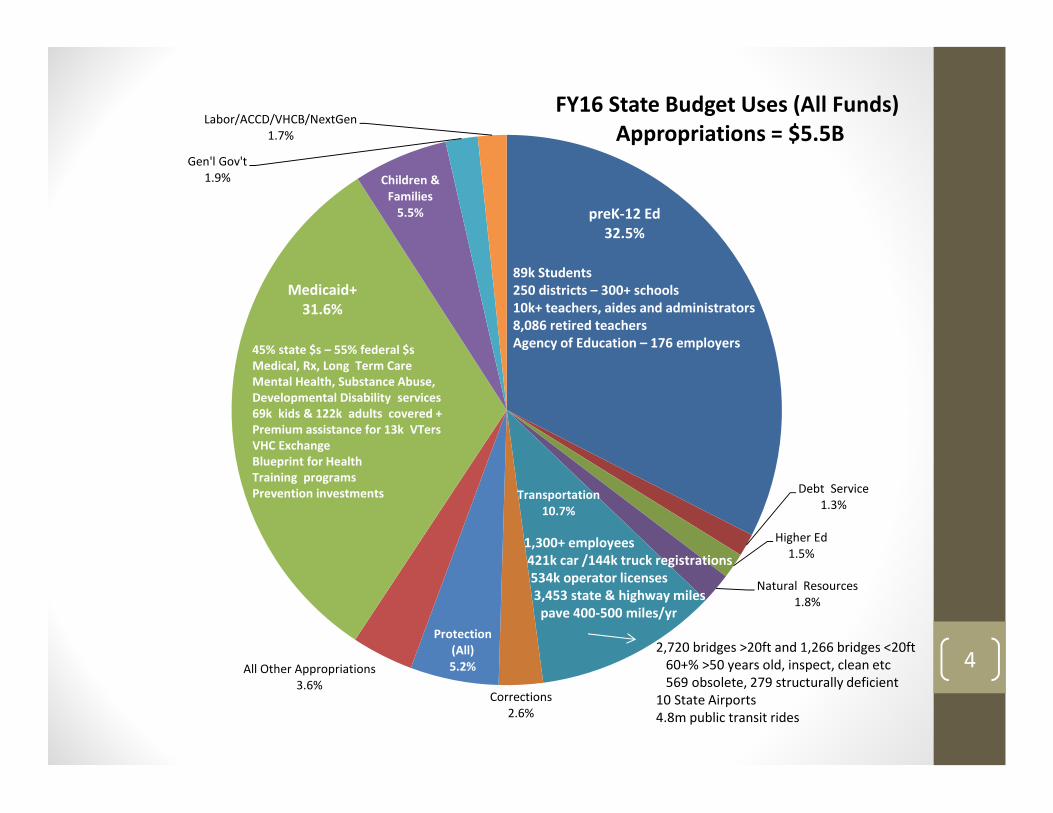
preK-12 Ed32.5%
Debt Service1.3%
Higher Ed1.5%
Natural Resources1.8%
Transportation10.7%
Corrections2.6%
Protection(All)5.2%All Other Appropriations
3.6%
Medicaid+31.6%
Children &Families
5.5%
Gen'l Gov't1.9%
Labor/ACCD/VHCB/NextGen1.7%
FY16 State Budget Uses (All Funds)Appropriations = $5.5B
45% state $s – 55% federal $sMedical, Rx, Long Term CareMental Health, Substance Abuse,Developmental Disability services69k kids & 122k adults covered +Premium assistance for 13k VTersVHC ExchangeBlueprint for HealthTraining programsPrevention investments
89k Students250 districts – 300+ schools10k+ teachers, aides and administrators8,086 retired teachersAgency of Education – 176 employers
1,300+ employees421k car /144k truck registrations534k operator licenses3,453 state & highway miles
pave 400-500 miles/yr
2,720 bridges >20ft and 1,266 bridges <20ft60+% >50 years old, inspect, clean etc569 obsolete, 279 structurally deficient
10 State Airports4.8m public transit rides

5
K-12 Ed24.4%
Debt Service2.8%
Higher Ed3.2%
Natural Resources2.9%
Transportation9.7%
Corrections5.6%
Protection (All)9.1%
All Other Appropriations4.3%
Medicaid+26.5%
Children &Families
5.9%
Gen'l Gov't3.6%
Labor/ACCD/VHCB/NextGen1.8%
FY16 Budget Uses (State Funds)Appropriations = $2.57B
Excl. FF & Ed Property Tax
6
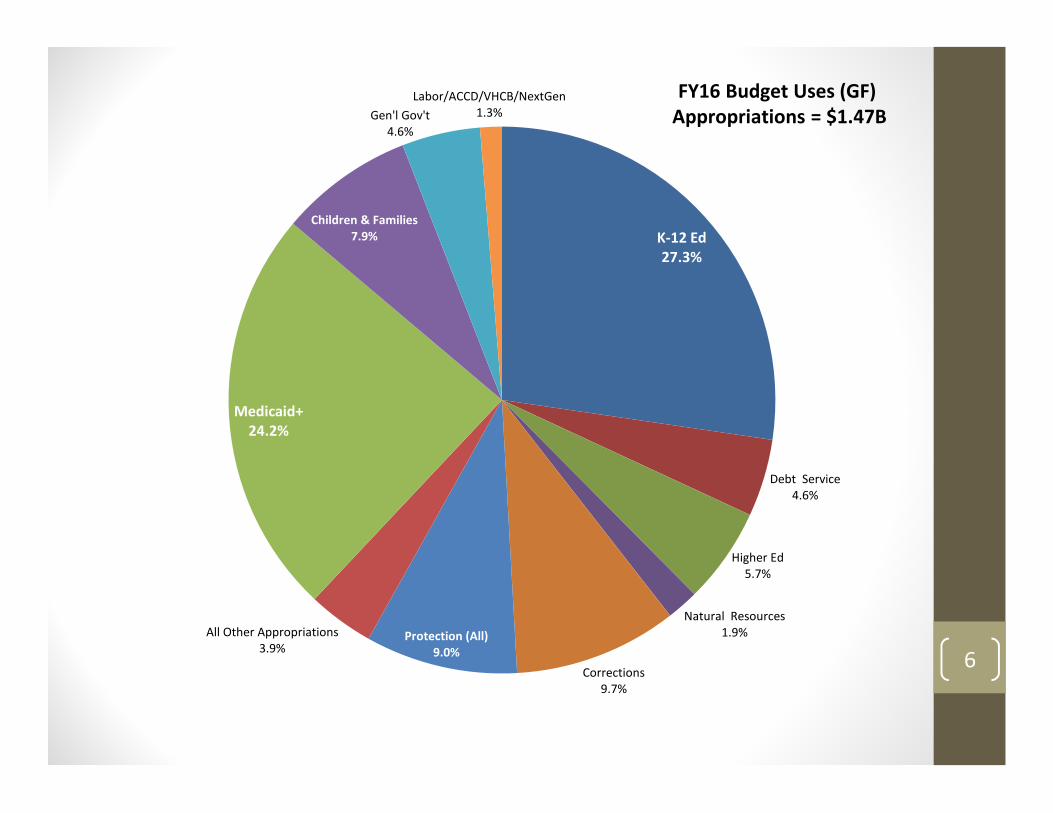
K-12 Ed27.3%
Debt Service4.6%
Higher Ed5.7%
Natural Resources1.9%
Transportation0.0%
Corrections9.7%
Protection (All)9.0%
All Other Appropriations3.9%
Medicaid+24.2%
Children & Families7.9%
Gen'l Gov't4.6%
Labor/ACCD/VHCB/NextGen1.3%
FY16 Budget Uses (GF)Appropriations = $1.47B
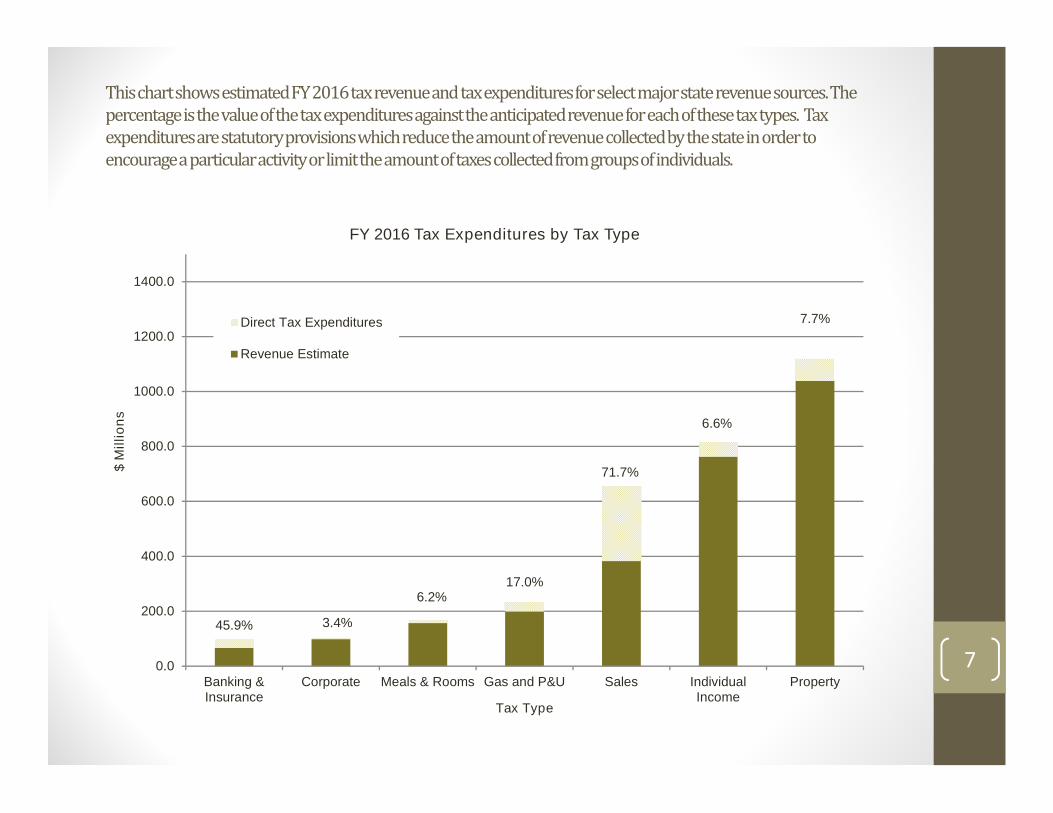
ThischartshowsestimatedFY2016taxrevenueandtaxexpendituresforselectmajorstaterevenuesources.Thepercentageisthevalueofthetaxexpendituresagainsttheanticipatedrevenueforeachofthesetaxtypes. Taxexpendituresarestatutoryprovisionswhichreducetheamountofrevenuecollectedbythestateinordertoencourageaparticularactivityorlimittheamountoftaxescollectedfromgroupsofindividuals.
7
45.9% 3.4%
6.2%17.0%
71.7%
6.6%
7.7%
0.0
200.0
400.0
600.0
800.0
1000.0
1200.0
1400.0
Banking &Insurance
Corporate Meals & Rooms Gas and P&U Sales IndividualIncome
Property
$M
illio
ns
Tax Type
FY 2016 Tax Expenditures by Tax Type
Direct Tax Expenditures
Revenue Estimate
1,350.0
1,400.0
1,450.0
1,500.0
1,550.0
1,600.0
1,650.0
1,700.0
1,750.0
1,800.0
FY13 FY14 FY15 FY16 FY17 FY18 FY19 FY20
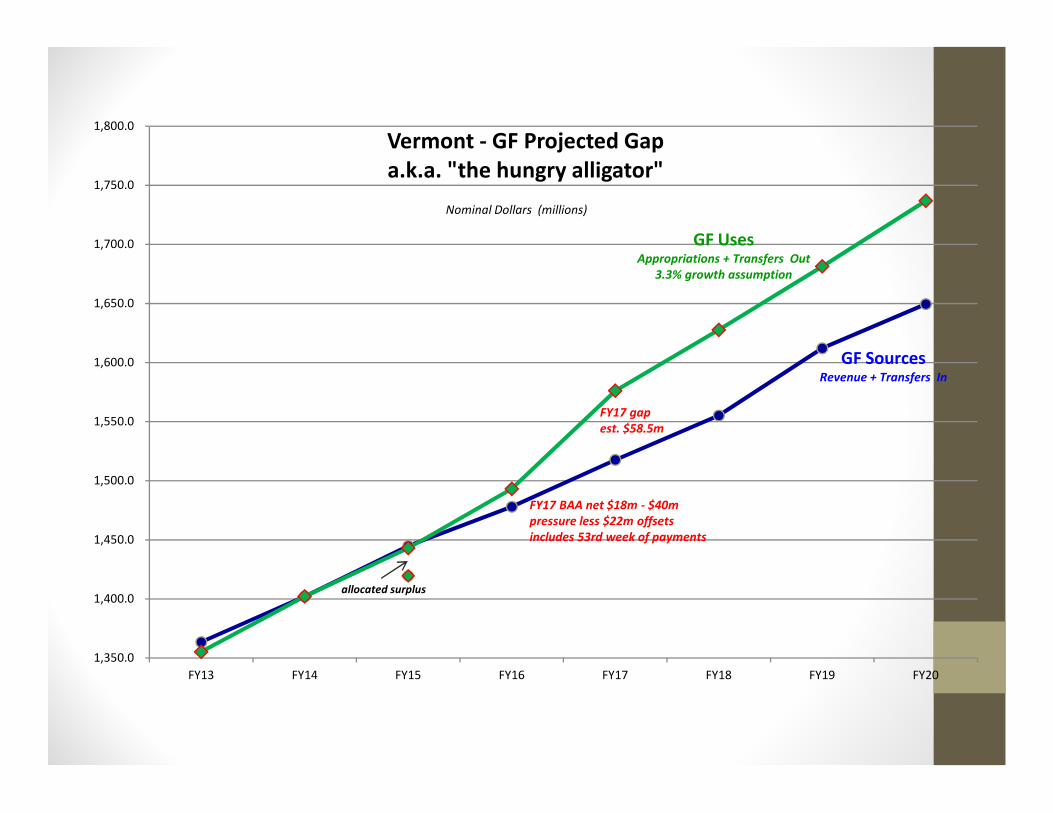
Vermont - GF Projected Gapa.k.a. "the hungry alligator"
FY17 gapest. $58.5m
GF SourcesRevenue + Transfers In
GF UsesAppropriations + Transfers Out
3.3% growth assumption
allocated surplus
Nominal Dollars (millions)
FY17 BAA net $18m - $40mpressure less $22m offsetsincludes 53rd week of payments
1,350.0
1,400.0
1,450.0
1,500.0
1,550.0
1,600.0
1,650.0
1,700.0
1,750.0
1,800.0
FY13 FY14 FY15 FY16 FY17 FY18 FY19 FY20
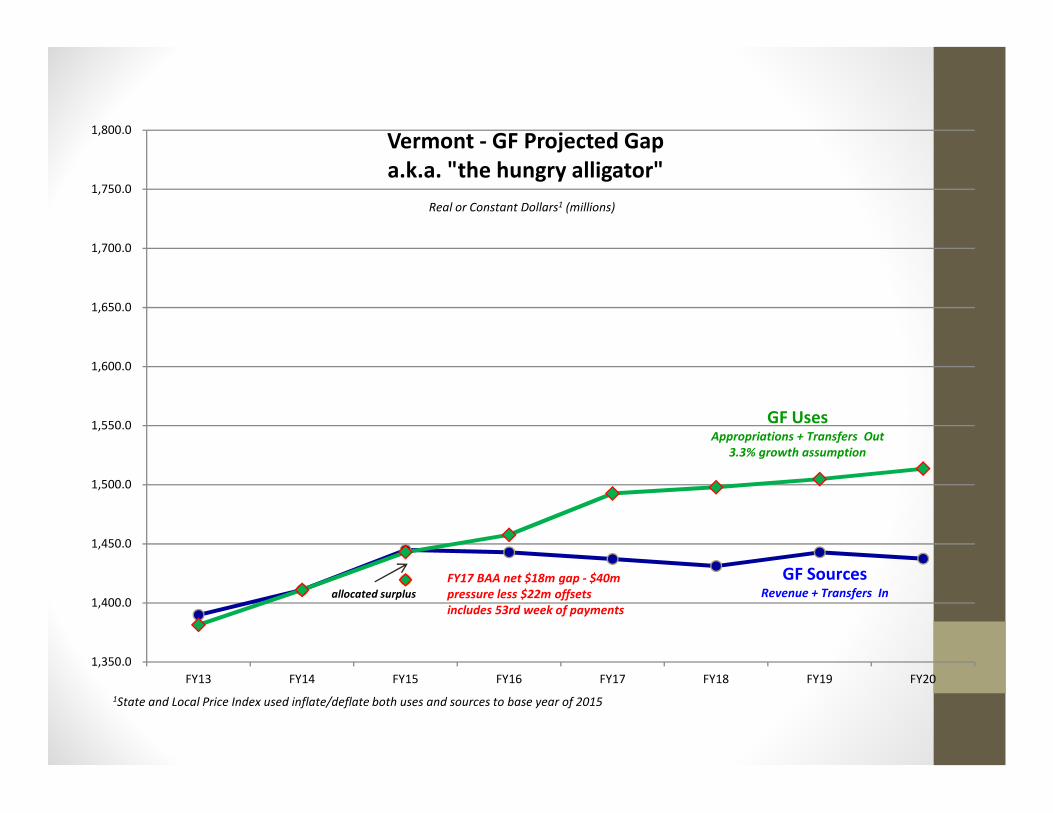
Vermont - GF Projected Gapa.k.a. "the hungry alligator"
GF SourcesRevenue + Transfers In
GF UsesAppropriations + Transfers Out
3.3% growth assumption
allocated surplus
1State and Local Price Index used inflate/deflate both uses and sources to base year of 2015
Real or Constant Dollars1 (millions)
FY17 BAA net $18m gap - $40mpressure less $22m offsetsincludes 53rd week of payments

(inmillions)
Jul Aug Sep Oct % change
• Personal income .4 -2.5 -.1 .3 .2%
• Sales .5 -.5 -.5 -.5 -.6%
• Meals and Rooms .4 -.1 .6 .8 1.4%
• Corporate .5 1.6 8.4 8.4 33%
• Other (estate +) -.9 -1.2 -3.6 -4.9 (12%)
• Total 1.1 -2.5 4.9 4.2 .9%
• Revenue Tracking for first four months of the year on Target.Minimal Revenue change likely.
10
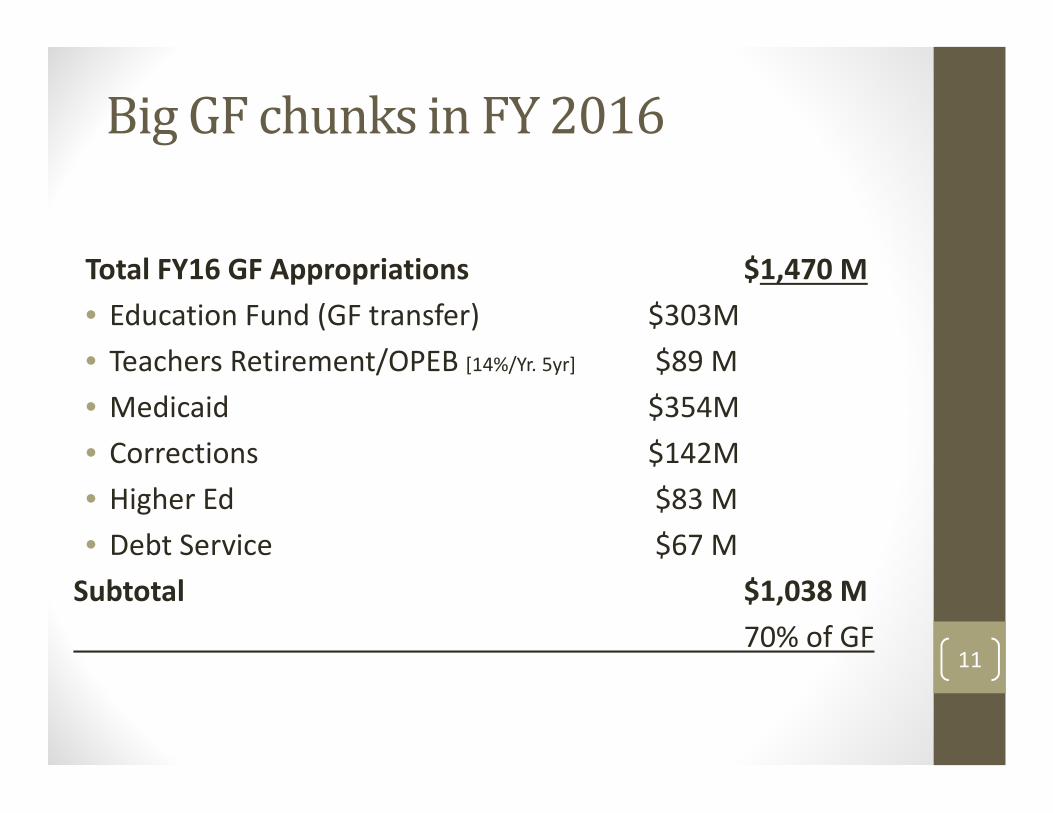
Big GF chunks in FY 2016
Total FY16 GF Appropriations $1,470 M
• Education Fund (GF transfer) $303M
• Teachers Retirement/OPEB [14%/Yr. 5yr] $89 M
• Medicaid $354M
• Corrections $142M
• Higher Ed $83 M
• Debt Service $67 M
Subtotal $1,038 M
70% of GF11

FY 2016-7 Budget and Finance Issues
• A difficult FY 2016 Budget Adjustment• $40 million in upwards pressure which includes $36 million of Medicaid
related adjustments
• A FY2017 projected difference between revenues & spendingpressures of $58.5 million.• Medicaid related pressures are $53 million
• The Education Fund has one time balances this year. Are they used fortax relief or a transition and changes for Act 46?
• Other health care/human service issues with budget impacts:• Health Care All payer model, Marijuana, DCF, Opioids…..
• Continued federal uncertainty: Transportation funding is unresolvedand there may be other pressures 12
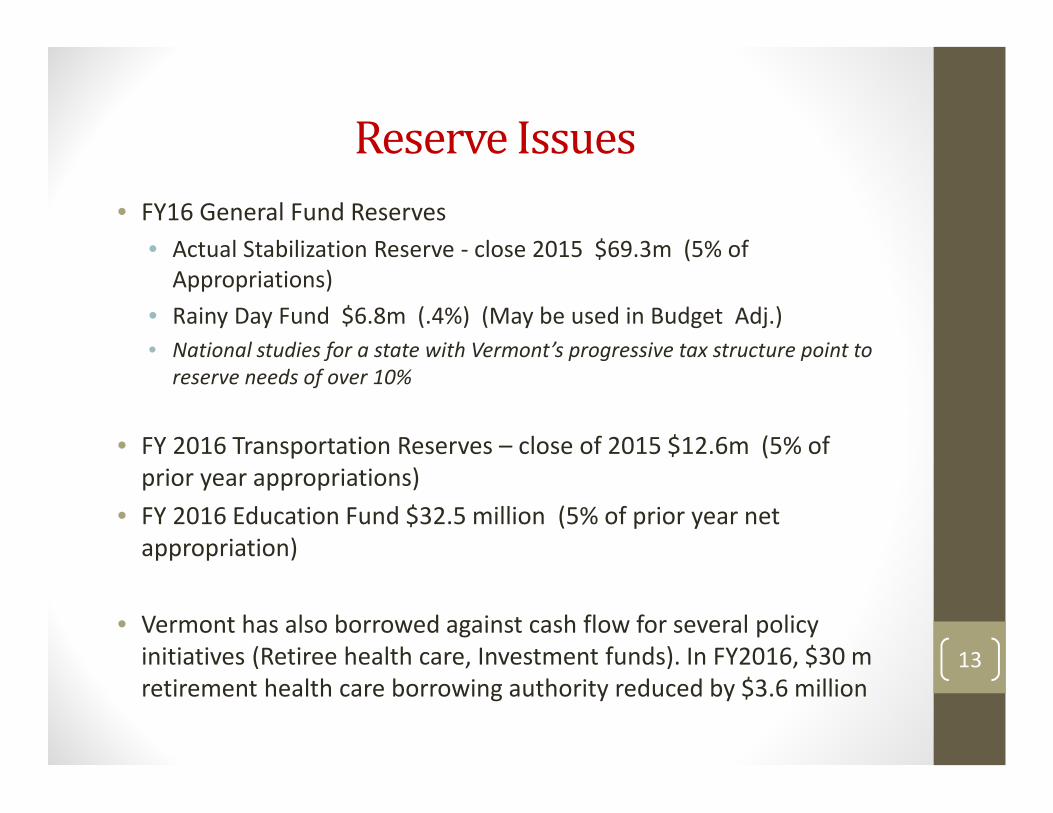
Reserve Issues
• FY16 General Fund Reserves
• Actual Stabilization Reserve - close 2015 $69.3m (5% ofAppropriations)
• Rainy Day Fund $6.8m (.4%) (May be used in Budget Adj.)
• National studies for a state with Vermont’s progressive tax structure point toreserve needs of over 10%
• FY 2016 Transportation Reserves – close of 2015 $12.6m (5% ofprior year appropriations)
• FY 2016 Education Fund $32.5 million (5% of prior year netappropriation)
• Vermont has also borrowed against cash flow for several policyinitiatives (Retiree health care, Investment funds). In FY2016, $30 mretirement health care borrowing authority reduced by $3.6 million
13
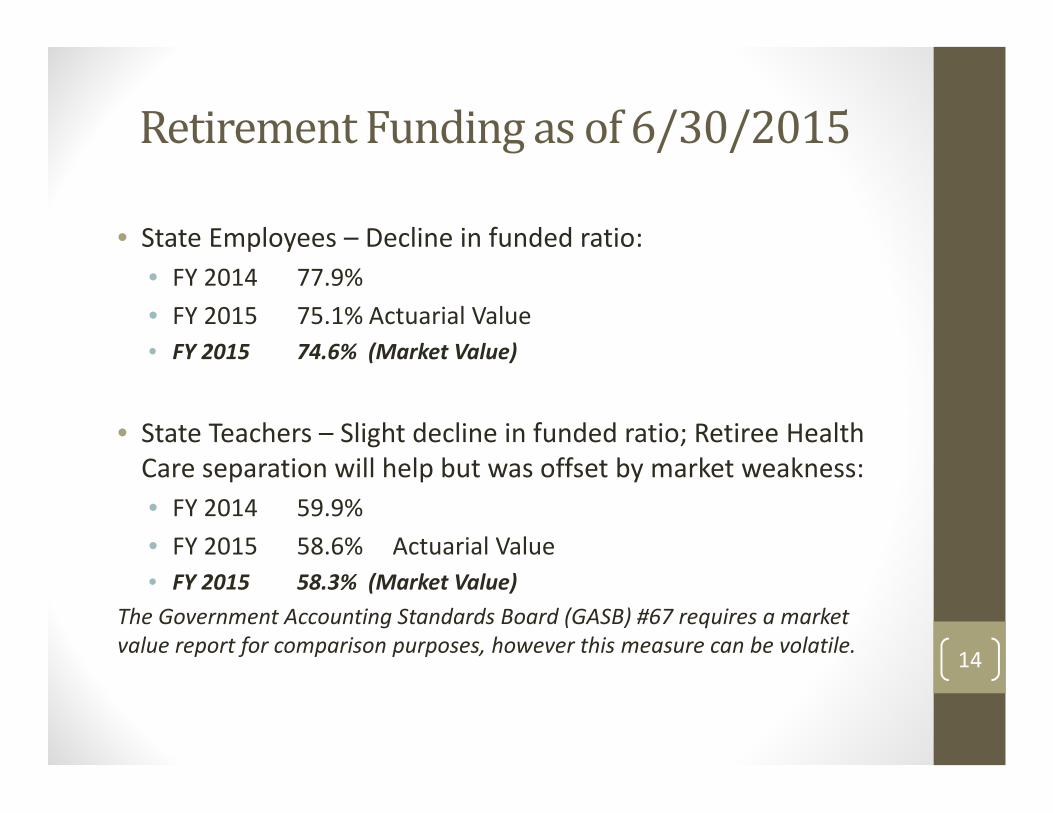
Retirement Funding as of 6/30/2015
• State Employees – Decline in funded ratio:
• FY 2014 77.9%
• FY 2015 75.1% Actuarial Value
• FY 2015 74.6% (Market Value)
• State Teachers – Slight decline in funded ratio; Retiree HealthCare separation will help but was offset by market weakness:
• FY 2014 59.9%
• FY 2015 58.6% Actuarial Value
• FY 2015 58.3% (Market Value)
The Government Accounting Standards Board (GASB) #67 requires a marketvalue report for comparison purposes, however this measure can be volatile.
14
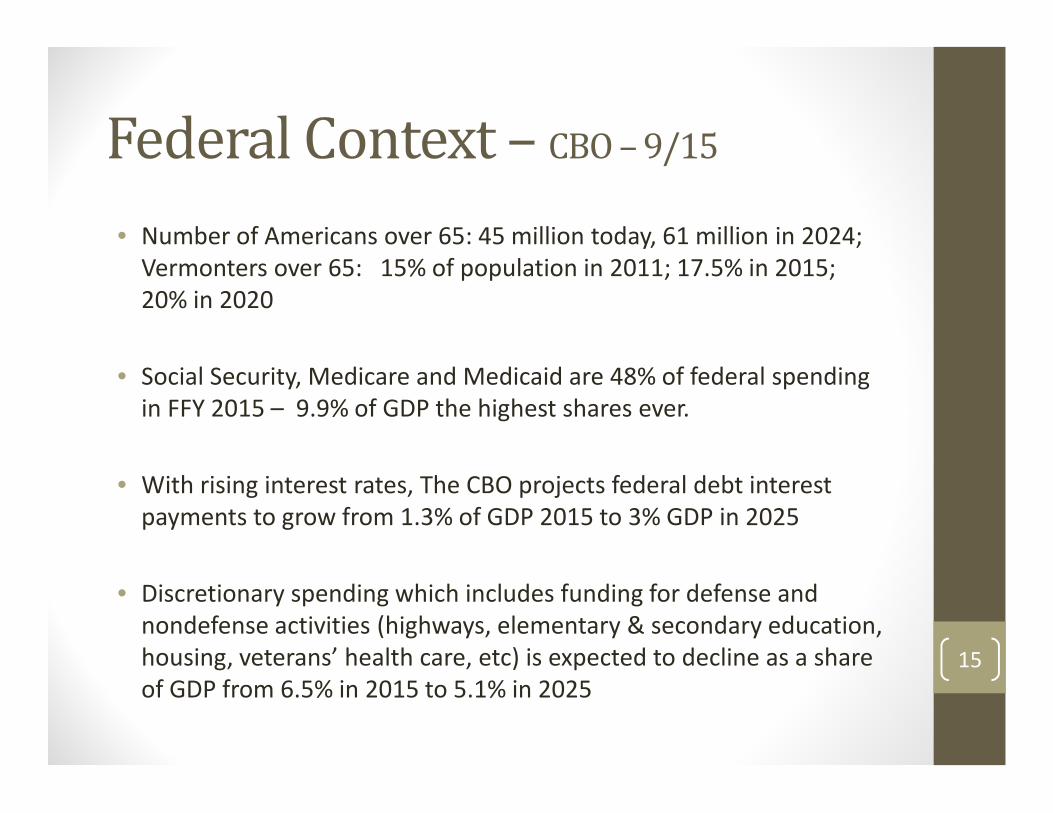
CBO – 9/15
• Number of Americans over 65: 45 million today, 61 million in 2024;Vermonters over 65: 15% of population in 2011; 17.5% in 2015;20% in 2020
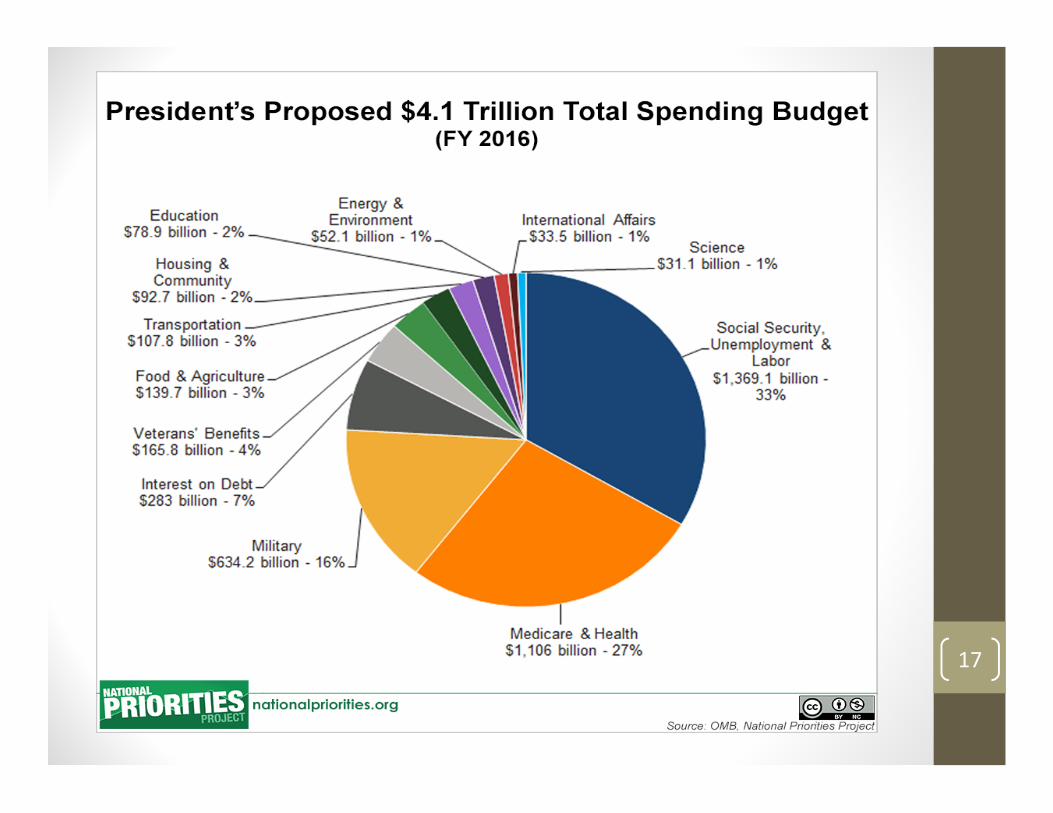
• Social Security, Medicare and Medicaid are 48% of federal spendingin FFY 2015 – 9.9% of GDP the highest shares ever.
• With rising interest rates, The CBO projects federal debt interestpayments to grow from 1.3% of GDP 2015 to 3% GDP in 2025
• Discretionary spending which includes funding for defense andnondefense activities (highways, elementary & secondary education,housing, veterans’ health care, etc) is expected to decline as a shareof GDP from 6.5% in 2015 to 5.1% in 2025
15
16
17