buffalo niagara advanced business services · south submarket east submarket operational advantages...
TRANSCRIPT

Life Science
Logistics/Distribution
Agribusiness
Advanced Manufacturing
Advanced Business ServicesBuffalo Niagara Advanced Business Services
“We are thrilled to be
expanding into Western New
York because of the availability
of strong qualified talent and
unrivaled work ethic.”
– Dave Masi Executive Vice President
ONE TOUCH DIRECT
REFUNDABLE TAX CREDITS
BASED ON JOB CREATION
60,000 28,000
21
EXISTING WORKERSGRADUATES ANNUALLY
COLLEGES & UNIVERSITIESIN 8 COUNTY REGION
BUFFALONIAGARA.ORG
INSURANCE • BACK OFFICE • DATA PROCESSING • TECHNOLOGY DESIGN & DEVELOPMENT
[FORMERLY YAHOO!]
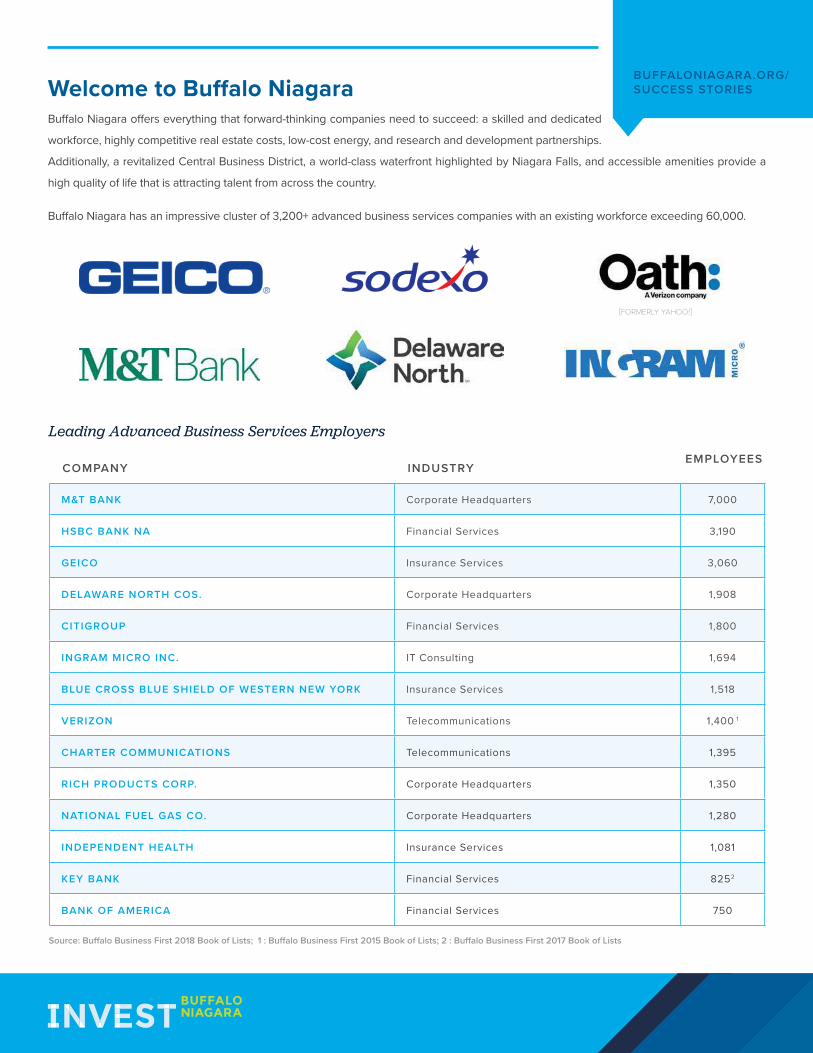
M&T BANK Corporate Headquarters 7,000
HSBC BANK NA Financial Services 3,190
GEICO Insurance Services 3,060
DELAWARE NORTH COS. Corporate Headquarters 1,908
CITIGROUP Financial Services 1,800
INGRAM MICRO INC. IT Consulting 1,694
BLUE CROSS BLUE SHIELD OF WESTERN NEW YORK Insurance Services 1,518
VERIZON Telecommunications 1,400 1
CHARTER COMMUNICATIONS Telecommunications 1,395
RICH PRODUCTS CORP. Corporate Headquarters 1,350
NATIONAL FUEL GAS CO. Corporate Headquarters 1,280
INDEPENDENT HEALTH Insurance Services 1,081
KEY BANK Financial Services 8252
BANK OF AMERICA Financial Services 750
COMPANY INDUSTRYEMPLOYEES
Leading Advanced Business Services Employers
Source: Buffalo Business First 2018 Book of Lists; 1 : Buffalo Business First 2015 Book of Lists; 2 : Buffalo Business First 2017 Book of Lists
Welcome to Buffalo NiagaraBuffalo Niagara offers everything that forward-thinking companies need to succeed: a skilled and dedicated
workforce, highly competitive real estate costs, low-cost energy, and research and development partnerships.
Additionally, a revitalized Central Business District, a world-class waterfront highlighted by Niagara Falls, and accessible amenities provide a
high quality of life that is attracting talent from across the country.
Buffalo Niagara has an impressive cluster of 3,200+ advanced business services companies with an existing workforce exceeding 60,000.
BUFFALONIAGARA.ORG/SUCCESS STORIES

Reasonable Wages
+ Existing advanced business services occupations have
competitive, but reasonable, wages. At $43,580, the
average wage across occupations the Buffalo-Niagara
Falls MSA is 7% lower than the nation.
Telecommunication Infrastructure
+ Buffalo has more then 80,000 miles of fiber optic lines
laid and managed by private companies, making it the
fifth best-equipped region in the world.
Easily Accessible
+ Buffalo Niagara is an easily accessible location with a
developed interstate highway system and reliable and
affordable air service to 22 cities including New York City,
Chicago, and Washington D.C.
+ Public Transportation in Buffalo, Niagara Falls, and the
surrounding suburbs include the Metro Bus Line and
the Metro Rail - an electric train service with stops along
Main Street in Buffalo between the University at Buffalo’s
South Campus, First Niagara Center, Canalside, and
HARBORCENTER.
OFFICE TYPE
CENTRAL BUSINESS DISTRICT
CITY OF BUFFALO (OUTSIDE OF CBD)
NORTH SUBMARKET
SOUTH SUBMARKET
EAST SUBMARKET
Operational AdvantagesBuffalo Niagara’s low cost of real estate and wages help a business’ bottom line while the low cost of living allows
employees the desired lifestyle outside of work.
Commercial Real Estate Overview
CLASS A
$22-26/SF $21-25/SF $19-24/SF $20-24/SF $19-24/SF
16.6% vacancy .9% vacancy 16.7% vacancy 7.6% vacancy 2.6% vacancy
CLASS B
$16-20/SF $15-19/SF $16-19/SF $15-19/SF $15-19/SF
12.8% vacancy 28.2% vacancy 11.1% vacancy 12.2% vacancy 10.0% vacancy
Source: CBRE | Buffalo Marketview Report 2017
© DOUGLAS LEVERE BUFFALO CITY HALL
BUFFALONIAGARA.ORG

COLLEGES & UNIVERSITIESWITHIN 100 MILES OF DOWNTOWN BUFFALO
47
BUSINESS, MANAGEMENT, AND MARKETING 1,484 4,559 1,993 8,036
COMPUTER AND INFORMATION SERVICES 282 892 793 1,967
PROGRAMASSOCIATE
DEGREEBACHELOR’S
DEGREEADVANCED
DEGREES TOTAL
Source: Economic Modeling Specialists Intl. (EMSI), 2017
Annual Graduates by Degree (8 County Region)
UNIVERSITY AT BUFFALO CANALSIDE © DOUGLAS LEVERE
College and University Recruitment
+ The eight-county Buffalo Niagara region boasts 21 colleges
and universities with a total enrollment of 106,000 students
producing over 28,000 graduates annually.
+ Over 200,000 students and nearly 50,000 graduates can
be found at the 47 2-and-4-year colleges and universities
within 100 miles of downtown Buffalo.
Educated and Skilled Workforce
+ The region is supported by both private and public
colleges and universities that produce a substantial
number of graduates in relevant programs as summarized
in the chart below.
Access to TalentWe boast a well educated workforce with a
number of educational institutions poised for
expansion.
© DOUGLAS LEVERE
1 2 3 4 5 6 7
8
9
1
0
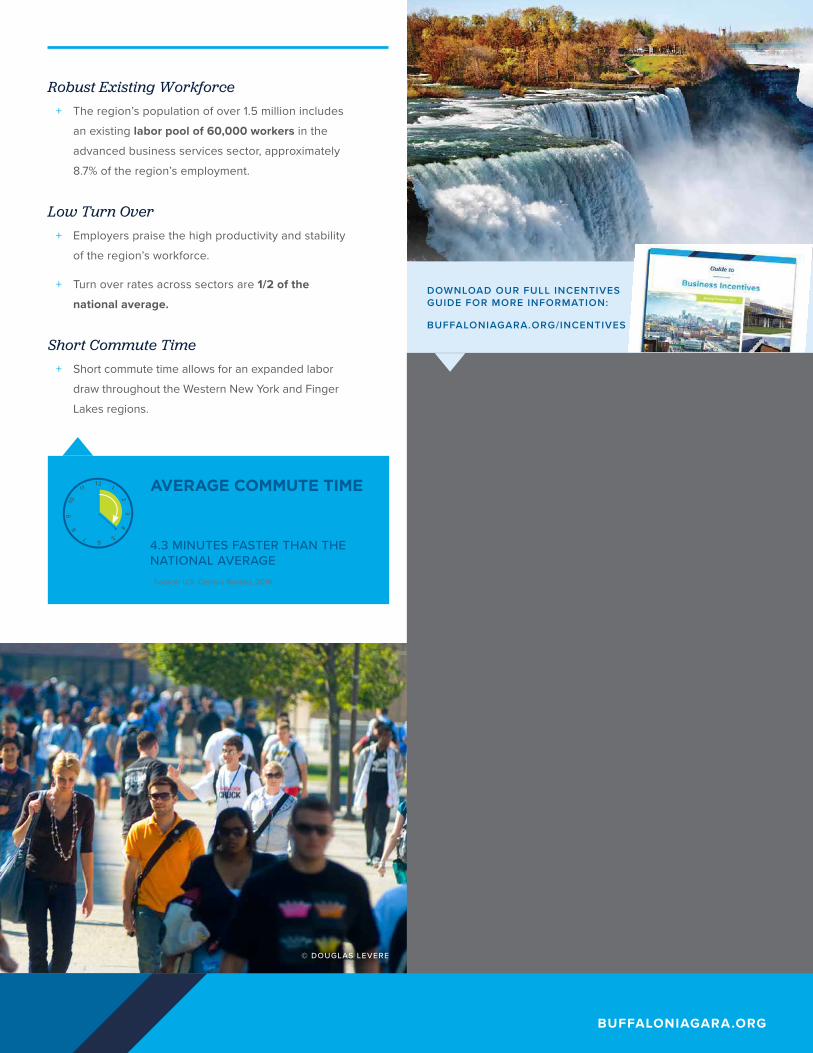
11 12 AVERAGE COMMUTE TIME
21.7 MINUTES
4.3 MINUTES FASTER THAN THE NATIONAL AVERAGESource: U.S. Census Bureau, 2016
Valuable IncentivesNew York State and the Buffalo Niagara region offer a variety
of valuable incentives to companies expanding or relocating
in the region. Invest Buffalo Niagara can facilitate the process
of identifying and applying for applicable incentive programs.
Excelsior Jobs Tax Credit Program
Refundable tax credits available to new and existing companies
in New York State based on job creation, capital investment,
and investment in research and development.
START-UP NY
Helps new and expanding businesses through tax incentives
and academic partnerships. Companies operate 10 years tax
free on or near eligible academic campuses.
Training Incentives
A credit of 50% of eligible training costs, up to $10,000 per
employee receiving eligible training.
Industrial Development Agencies (IDA)
Local IDAs can offer tax incentive programs that provide major
savings by abating property, sales, and mortgage recording taxes.
UNIVERSITY AT BUFFALO © DOUGLAS LEVERE
Robust Existing Workforce
+ The region’s population of over 1.5 million includes
an existing labor pool of 60,000 workers in the
advanced business services sector, approximately
8.7% of the region’s employment.
Low Turn Over
+ Employers praise the high productivity and stability
of the region’s workforce.
+ Turn over rates across sectors are 1/2 of the
national average.
Short Commute Time
+ Short commute time allows for an expanded labor
draw throughout the Western New York and Finger
Lakes regions.
DOWNLOAD OUR FULL INCENTIVES GUIDE FOR MORE INFORMATION:
BUFFALONIAGARA.ORG/INCENTIVES
BUFFALONIAGARA.ORG

Buffalo Niagara’s Strengths in Advanced Business Services
InsuranceNew York State plays an important role in the global economy as a worldwide
finance and insurance capital. Nearly 10,000 insurance companies call NY home,
including GEICO which employs over 3,000 at its Northeast Regional Office in
Buffalo Niagara.
Buffalo Niagara has over 50 companies with more than 16,000 employees in customer
contact centers and back office operations. Based on the success of our employers and
their continual expansion in the area, Buffalo Niagara has the right resources and business
environment to make your operation a success.
Buffalo Niagara features several advantages for data center operators including low
natural disaster risk, low cost electricity through the New York Power Authority hydropower
allocations, and a temperate climate that allows for free cooling using ambient air.
Both long-established and startup companies are thriving in the technology, development,
and design space in Buffalo Niagara. From software development to hardware systems
design, local tech companies are leveraging talent and technology not only from local
colleges and universities but also from unique partnerships such as IBM’s Buffalo
Innovation Center.
Back Office
Data Processing
Technology, Development & Design
“We’re ever mindful that GEICO’s success is due to the talent and total commitment of our associates.” - Tony Nicely, GEICO
“We picked Buffalo because we thought it was the right place for us to grow our business. We felt the energy that was happening in a place where people enjoy working. They take real pride in their work.” - Ryan Sasson, Strategic Financial Solutions
“It’s going to be, by far, Yahoo’s (now Oath) most efficient and arguable the most innovative data center, at least from a cooling perspective.” - Scott Noteboom, Oath
“The region’s fantastic educational system and the state of New York’s focus on encouraging the growth of local business were the deciding factors for TROVE’s decision to expand locally.” - Dr. Adam Stotz, TROVE

Lower Higher Hurricane Risk
Sources: Sperling’s Best Places; National Oceanic and Atmospheric Administration (tornado map); University of Miami (hurricane map); U.S. Geological Survey (earthquake map)
Lower HigherTornado Risk Earthquake Risk Lower Higher
Weather disasters and quakes: who’s most at risk? The analysis below, by Sperling’s Best Places, a publisher of city rankings, is an attempt to assess a combination of those risks in 379 American metro areas.
Risks for twisters and hurricanes (including storms from hurricane remnants) are based on historical data showing where storms occurred. Earthquake risks are based on United States Geological Survey assessments and take into account the relative infrequency of quakes, compared with weather events and floods.
Additional hazards included in this analysis: flooding, drought, hail and other extreme weather.
Lowest risk: Corvallis, Ore.Small quake and drought risk; little extreme weather.
Highest risk: DallasLots of almost everything but quakes: twisters, hurricane remnants, hail, wind, drought, floods.
Some Places Are Riskier Than Others
MATTHEW ERICSON, JOE BURGESS AND BILL MARSH/THE NEW YORK TIMES
Highest risk:1. Dallas-Plano-Irving, Tex.2. Jonesboro, Ark.3. Corpus Christi, Tex.4. Houston5. Beaumont-Port Arthur, Tex.6. Shreveport, La.7. Austin, Tex.8. Birmingham, Ala.
Metro areas with lowest risk:1. Corvallis, Ore.2. Mt. Vernon-Anacortes, Wash.3. Bellingham, Wash.4. Wenatchee, Wash.5. Grand Junction, Colo.6. Spokane, Wash.7. Salem, Ore.8. Seattle
Metro area population
Less than 175,000
175,000 to 500,000
More than 500,000Lower Higher
Scale of hazards
Safe from Natural DisastersTrulia ranked Buffalo Niagara as the fourth safest city from natural disasters in 2017. Minimized risk should be considered in business location
decisions. This New York Times map below shows the region’s safety from the sprawling effects of tornadoes, hurricanes, and earthquakes.
Lower Higher Hurricane Risk
Sources: Sperling’s Best Places; National Oceanic and Atmospheric Administration (tornado map); University of Miami (hurricane map); U.S. Geological Survey (earthquake map)
Lower HigherTornado Risk Earthquake Risk Lower Higher
Weather disasters and quakes: who’s most at risk? The analysis below, by Sperling’s Best Places, a publisher of city rankings, is an attempt to assess a combination of those risks in 379 American metro areas.
Risks for twisters and hurricanes (including storms from hurricane remnants) are based on historical data showing where storms occurred. Earthquake risks are based on United States Geological Survey assessments and take into account the relative infrequency of quakes, compared with weather events and floods.
Additional hazards included in this analysis: flooding, drought, hail and other extreme weather.
Lowest risk: Corvallis, Ore.Small quake and drought risk; little extreme weather.
Highest risk: DallasLots of almost everything but quakes: twisters, hurricane remnants, hail, wind, drought, floods.
Some Places Are Riskier Than Others
MATTHEW ERICSON, JOE BURGESS AND BILL MARSH/THE NEW YORK TIMES
Highest risk:1. Dallas-Plano-Irving, Tex.2. Jonesboro, Ark.3. Corpus Christi, Tex.4. Houston5. Beaumont-Port Arthur, Tex.6. Shreveport, La.7. Austin, Tex.8. Birmingham, Ala.
Metro areas with lowest risk:1. Corvallis, Ore.2. Mt. Vernon-Anacortes, Wash.3. Bellingham, Wash.4. Wenatchee, Wash.5. Grand Junction, Colo.6. Spokane, Wash.7. Salem, Ore.8. Seattle
Metro area population
Less than 175,000
175,000 to 500,000
More than 500,000Lower Higher
Scale of hazards
BUFFALONIAGARA.ORG
Buffalo Niagara
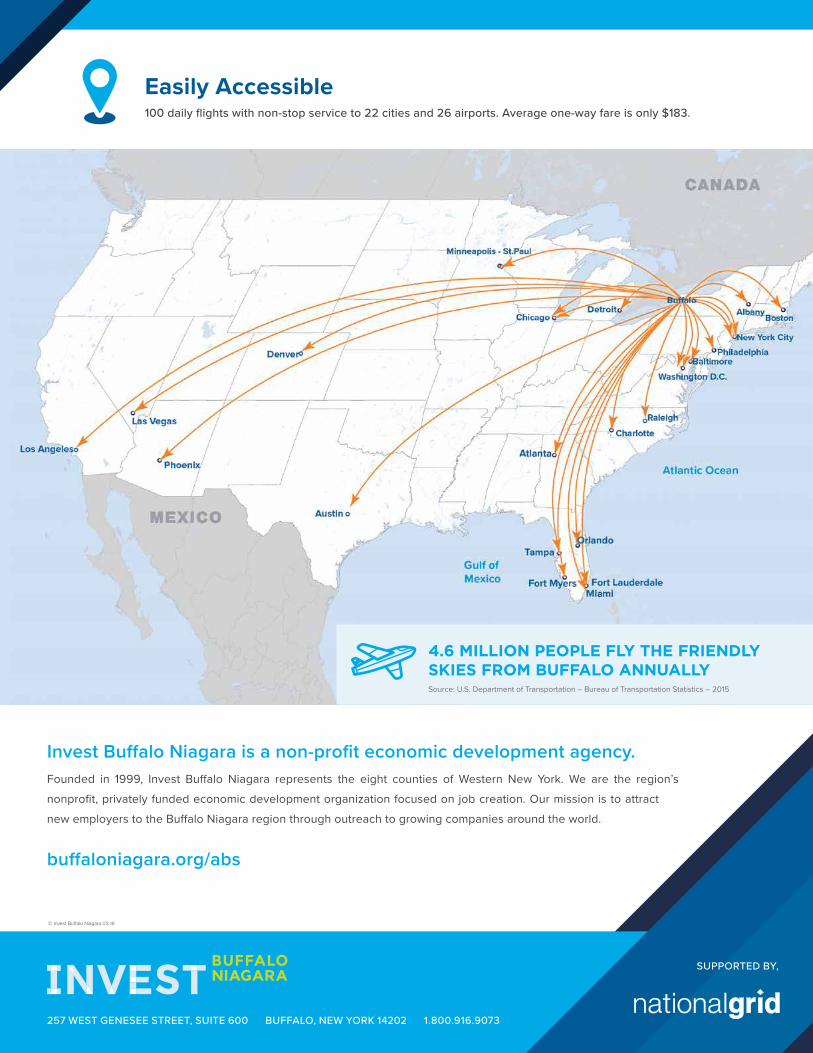
4.6 MILLION PEOPLE FLY THE FRIENDLY SKIES FROM BUFFALO ANNUALLYSource: U.S. Department of Transportation – Bureau of Transportation Statistics – 2015
Easily Accessible100 daily flights with non-stop service to 22 cities and 26 airports. Average one-way fare is only $183.
Invest Buffalo Niagara is a non-profit economic development agency.Founded in 1999, Invest Buffalo Niagara represents the eight counties of Western New York. We are the region’s
nonprofit, privately funded economic development organization focused on job creation. Our mission is to attract
new employers to the Buffalo Niagara region through outreach to growing companies around the world.
buffaloniagara.org/abs
© Invest Buffalo Niagara 03.18
257 WEST GENESEE STREET, SUITE 600 BUFFALO, NEW YORK 14202 1.800.916.9073
SUPPORTED BY,