buffett inflation file
DESCRIPTION
Warren Buffett's comments on inflationTRANSCRIPT
1
Warren Buffett’s Comments on Inflation
This is a compilation of Warren Buffett’s comments on inflation and some of the types of businesses he thinks do well in inflationary times. These comments were compiled from his 1977 Fortune article “How Inflation Swindles the Equity Investor”, his annual letters, and also include other commentary that is not inflation specific, but that I thought was useful to review in this context. Any misspellings or misstatements throughout this document are probably from errors I made in the transfer process, and not those of Mr. Buffett. –JK
2
How Inflation Swindles the Equity Investor The central problem in the stock market is that the return on capital hasn’t risen with inflation. It seems to be stuck at 12 percent. by Warren E. Buffett, FORTUNE May 1977 It is no longer a secret that stocks, like bonds, do poorly in an inflationary environment. We have been in such an environment for most of the past decade, and it has indeed been a time of troubles for stocks. But the reasons for the stock market's problems in this period are still imperfectly understood. There is no mystery at all about the problems of bondholders in an era of inflation. When the value of the dollar deteriorates month after month, a security with income and principal payments denominated in those dollars isn't going to be a big winner. You hardly need a Ph.D. in economics to figure that one out. It was long assumed that stocks were something else. For many years, the conventional wisdom insisted that stocks were a hedge against inflation. The proposition was rooted in the fact that stocks are not claims against dollars, as bonds are, but represent ownership of companies with productive facilities. These, investors believed, would retain their value in real terms, let the politicians print money as they might. And why didn't it turn out that way? The main reason, I believe, is that stocks, in economic substance, are really very similar to bonds. I know that this belief will seem eccentric to many investors. They will immediately observe that the return on a bond (the coupon) is fixed, while the return on an equity investment (the company's earnings) can vary substantially from one year to another. True enough. But anyone who examines the aggregate returns that have been earned by companies during the postwar years will discover something extraordinary: the returns on equity have in fact not varied much at all. The coupon is sticky In the first ten years after the war - the decade ending in 1955 - the Dow Jones industrials had an average annual return on year-end equity of 12.8 percent. In the second decade, the figure was 10.1 percent. In the third decade it was 10.9 percent. Data for a larger universe, the FORTUNE 500 (whose history goes back only to the mid-1950's), indicate somewhat similar results: 11.2 percent in the decade ending in 1965, 11.8 percent in the decade through 1975. The figures for a few exceptional years have been substantially higher (the high for the 500 was 14.1 percent in 1974) or lower (9.5 percent in 1958 and 1970), but over the years, and in the aggregate, the return on book value tends to keep coming back to a level around 12 percent. It shows no signs of exceeding that level significantly in inflationary years (or in years of stable prices, for that matter).
3
For the moment, let's think of those companies, not as listed stocks, but as productive enterprises. Let's also assume that the owners of those enterprises had acquired them at book value. In that case, their own return would have been around 12 percent too. And because the return has been so consistent, it seems reasonable to think of it as an "equity coupon." In the real world, of course, investors in stocks don't just buy and hold. Instead, many try to outwit their fellow investors in order to maximize their own proportions of corporate earnings. This thrashing about, obviously fruitless in aggregate, has no impact on the equity coupon but reduces the investor's portion of it, because he incurs substantial frictional costs, such as advisory fees and brokerage charges. Throw in an active options market, which adds nothing to the productivity of American enterprise but requires a cast of thousands to man the casino, and frictional costs rise further. Stocks are perpetual It is also true that in the real world investors in stocks don't usually get to buy at book value. Sometimes they have been able to buy in below book; usually, however, they've had to pay more than book, and when that happens there is further pressure on that 12 percent. I'll talk more about these relationships later. Meanwhile, let's focus on the main point: as inflation has increased, the return on equity capital has not. Essentially, those who buy equities receive securities with an underlying fixed return - just like those who buy bonds. Of course, there are some important differences between the bond and stock forms. For openers, bonds eventually come due. It may require a long wait, but eventually the bond investor gets to renegotiate the terms of his contract. If current and prospective rates of inflation make his old coupon look inadequate, he can refuse to play further unless coupons currently being offered rekindle his interest. Something of this sort has been going on in recent years. Stocks, on the other hand, are perpetual. They have a maturity date of infinity. Investors in stocks are stuck with whatever return corporate America happens to earn. If corporate America is destined to earn 12 percent, then that is the level investors must learn to live with. As a group, stock investors can neither opt out nor renegotiate. In the aggregate, their commitment is actually increasing. Individual companies can be sold or liquidated and corporations can repurchase their own shares; on balance, however, new equity flotations and retained earnings guarantee that the equity capital locked up in the corporate system will increase. So, score one for the bond form. Bond coupons eventually will be renegotiated; equity "coupons" won't. It is true, of course, that for a long time a 12 percent coupon did not appear in need of a whole lot of correction. The bondholder gets it in cash
4
There is another major difference between the garden variety of bond and our new exotic 12 percent "equity bond" that comes to the Wall Street costume ball dressed in a stock certificate. In the usual case, a bond investor receives his entire coupon in cash and is left to reinvest it as best he can. Our stock investor's equity coupon, in contrast, is partially retained by the company and is reinvested at whatever rates the company happens to be earning. In other words, going back to our corporate universe, part of the 12 percent earned annually is paid out in dividends and the balance is put right back into the universe to earn 12 percent also. The good old days This characteristic of stocks - the reinvestment of part of the coupon - can be good or bad news, depending on the relative attractiveness of that 12 percent. The news was very good indeed in the 1950's and early 1960's. With bonds yielding only 3 or 4 percent, the right to reinvest automatically a portion of the equity coupon at 12 percent was of enormous value. Note that investors could not just invest their own money and get that 12 percent return. Stock prices in this period ranged far above book value, and investors were prevented by the premium prices they had to pay from directly extracting out of the underlying corporate universe whatever rate that universe was earning. You can't pay far above par for a 12 percent bond and earn 12 percent for yourself. But on their retained earnings, investors could earn 12 percent. In effect, earnings retention allowed investors to buy at book value part of an enterprise that, in the economic environment then existing, was worth a great deal more than book value. It was a situation that left very little to be said for cash dividends and a lot to be said for earnings retention. Indeed, the more money that investors thought likely to be reinvested at the 12 percent rate, the more valuable they considered their reinvestment privilege, and the more they were willing to pay for it. In the early 1960's, investors eagerly paid top-scale prices for electric utilities situated in growth areas, knowing that these companies had the ability to reinvest very large proportions of their earnings. Utilities whose operating environment dictated a larger cash payout rated lower prices. If, during this period, a high-grade, noncallable, long-term bond with a 12 percent coupon had existed, it would have sold far above par. And if it were a bond with a further unusual characteristic - which was that most of the coupon payments could be automatically reinvested at par in similar bonds - the issue would have commanded an even greater premium. In essence, growth stocks retaining most of their earnings represented just such a security. When their reinvestment rate on the added equity capital was 12 percent while interest rates generally were around 4 percent, investors became very happy - and, of course, they paid happy prices. Heading for the exits
5
Looking back, stock investors can think of themselves in the 1946-66 period as having been ladled a truly bountiful triple dip. First, they were the beneficiaries of an underlying corporate return on equity that was far above prevailing interest rates. Second, a significant portion of that return was reinvested for them at rates that were otherwise unattainable. And third, they were afforded an escalating appraisal of underlying equity capital as the first two benefits became widely recognized. This third dip meant that, on top of the basic 12 percent or so earned by corporations on their equity capital, investors were receiving a bonus as the Dow Jones industrials increased in price from 133 percent of book value in 1946 to 220 percent in 1966. Such a marking-up process temporarily allowed investors to achieve a return that exceeded the inherent earning power of the enterprises in which they had invested. This heaven-on-earth situation finally was "discovered" in the mid-1960's by many major investing institutions. But just as these financial elephants began trampling on one another in their rush to equities, we entered an era of accelerating inflation and higher interest rates. Quite logically, the marking-up process began to reverse itself. Rising interest rates ruthlessly reduced the value of all existing fixed-coupon investments. And as long-term corporate bond rates began moving up (eventually reaching the 10 percent area), both the equity return of 12 percent and the reinvestment "privilege" began to look different. Stocks are quite properly thought of as riskier than bonds. While that equity coupon is more or less fixed over periods of time, it does fluctuate somewhat from year to year. Investors' attitudes about the future can be affected substantially, although frequently erroneously, by those yearly changes. Stocks are also riskier because they come equipped with infinite maturities. (Even your friendly broker wouldn't have the nerve to peddle a 100-year bond, if he had any available, as "safe.") Because of the additional risk, the natural reaction of investors is to expect an equity return that is comfortably above the bond return - and 12 percent on equity versus, say, 10 percent on bonds issued by the same corporate universe does not seem to qualify as comfortable. As the spread narrows, equity investors start looking for the exits. But, of course, as a group they can't get out. All they can achieve is a lot of movement, substantial frictional costs, and a new, much lower level of valuation, reflecting the lessened attractiveness of the 12 percent equity coupon under inflationary conditions. Bond investors have had a succession of shocks over the past decade in the course of discovering that there is no magic attached to any given coupon level - at 6 percent, or 8 percent, or 10 percent, bonds can still collapse in price. Stock investors, who are in general not aware that they too have a "coupon," are still receiving their education on this point. Five ways to improve earnings Must we really view that 12 percent equity coupon as immutable? Is there any law that says the corporate return on equity capital cannot adjust itself upward in response to a permanently higher average rate of inflation?
6
There is no such law, of course. On the other hand, corporate America cannot increase earnings by desire or decree. To raise that return on equity, corporations would need at least one of the following: (1) an increase in turnover, i.e., in the ratio between sales and total assets employed in the business; (2) cheaper leverage; (3) more leverage; (4) lower income taxes; (5) wider operating margins on sales. And that's it. There simply are no other ways to increase returns on common equity. Let's see what can be done with these. We'll begin with turnover. The three major categories of assets we have to think about for this exercise are accounts receivable, inventories, and fixed assets such as plants and machinery. Accounts receivable go up proportionally as sales go up, whether the increase in dollar sales is produced by more physical volume or by inflation. No room for improvement here. With inventories, the situation is not quite as simple. Over the long term, the trend in unit inventories may be expected to follow the trend in unit sales. Over the short term, however, the physical turnover rate may bob around because of special influences - e.g., cost expectations, or bottlenecks. The use of last-in, first-out (LIFO) inventory-valuation methods serves to increase the reported turnover rate during inflationary times. When dollar sales are rising because of inflation, inventory valuations of a LIFO company either will remain level, (if unit sales are not rising) or will trail the rise in dollar sales (if unit sales are rising). In either case, dollar turnover will increase. During the early 1970's, there was a pronounced swing by corporations toward LIFO accounting (which has the effect of lowering a company's reported earnings and tax bills). The trend now seems to have slowed. Still, the existence of a lot of LIFO companies, plus the likelihood that some others will join the crowd, ensures some further increase it the reported turnover of inventory. The gains are apt to be modest In the case of fixed assets, any rise in the inflation rate, assuming it affects all products equally, will initially have the effect of increasing turnover. That is true because sales will immediately reflect the new price level, while the fixed-asset account will reflect the change only gradually, i.e., as existing assets are retired and replaced at the new prices. Obviously, the more slowly a company goes about this replacement process, the more the turnover ratio will rise. The action stops, however, when a replacement cycle is completed. Assuming a constant rate of inflation, sales and fixed assets will then begin to rise in concert at the rate of inflation.
7
To sum up, inflation will produce some gains in turnover ratios. Some improvement would be certain because of LIFO, and some would be possible (if inflation accelerates) because of sales rising more rapidly than fixed assets. But the gains are apt to be modest and not of a magnitude to produce substantial improvement in returns on equity capital. During the decade ending in 1975, despite generally accelerating inflation and the extensive use of LIFO accounting, the turnover ratio of the FORTUNE 500 went only from 1.18/1 to 1.29/1. Cheaper leverage? Not likely. High rates of inflation generally cause borrowing to become dearer, not cheaper. Galloping rates of inflation create galloping capital needs; and lenders, as they become increasingly distrustful of long-term contracts, become more demanding. But even if there is no further rise in interest rates, leverage will be getting more expensive because the average cost of the debt now on corporate books is less than would be the cost of replacing it. And replacement will be required as the existing debt matures. Overall, then, future changes in the cost of leverage seem likely to have a mildly depressing effect on the return on equity. More leverage? American business already has fired many, if not most, of the more-leverage bullets once available to it. Proof of that proposition can be seen in some other FORTUNE 500 statistics - in the twenty years ending in 1975, stockholders' equity as a percentage of total assets declined for the 500 from 63 percent to just under 50 percent. In other words, each dollar of equity capital now is leveraged much more heavily than it used to be. What the lenders learned An irony of inflation-induced financial requirements is that the highly profitable companies - generally the best credits - require relatively little debt capital. But the laggards in profitability never can get enough. Lenders understand this problem much better than they did a decade ago - and are correspondingly less willing to let capital-hungry, low-profitability enterprises leverage themselves to the sky. Nevertheless, given inflationary conditions, many corporations seem sure in the future to turn to still more leverage as a means of shoring up equity returns. Their managements will make that move because they will need enormous amounts of capital - often merely to do the same physical volume of business - and will wish to get it without cutting dividends or making equity offerings that, because of inflation, are not apt to shape up as attractive. Their natural response will be to heap on debt, almost regardless of cost. They will tend to behave like those utility companies that argued over an eighth of a point in the 1960's and were grateful to find 12 percent debt financing in 1974. Added debt at present interest rates, however, will do less for equity returns than did added debt at 4 percent rates it the early 1960's. There is also the problem that higher debt ratios cause credit ratings to be lowered, creating a further rise in interest costs.
8
So that is another way, to be added to those already discussed, in which the cost of leverage will be rising. In total, the higher costs of leverage are likely to offset the benefits of greater leverage. Besides, there is already far more debt in corporate America than is conveyed by conventional balance sheets. Many companies have massive pension obligations geared to whatever pay levels will be in effect when present workers retire. At the low inflation rates of 1955-65, the liabilities arising from such plans were reasonably predictable. Today, nobody can really know the company's ultimate obligation. But if the inflation rate averages 7 percent in the future, a twenty-five-year-old employee who is now earning $12,000, and whose raises do no more than match increases in living costs, will be making $180,000 when he retires at sixty-five. Of course, there is a marvelously precise figure in many annual reports each year, purporting to be the unfunded pension liability. If that figure were really believable, a corporation could simply ante up that sum, add to it the existing pension-fund assets, turn the total amount over to an insurance company, and have it assume all the corporation's present pension liabilities. In the real world, alas, it is impossible to find an insurance company willing even to listen to such a deal. Virtually every corporate treasurer in America would recoil at the idea of issuing a "cost-of-living" bond - a noncallable obligation with coupons tied to a price index. But through the private pension system, corporate America has in fact taken on a fantastic amount of debt that is the equivalent of such a bond. More leverage, whether through conventional debt or unbooked and indexed "pension debt," should be viewed with skepticism by shareholders. A 12 percent return from an enterprise that is debt-free is far superior to the same return achieved by a business hocked to its eyeballs. Which means that today's 12 percent equity returns may well be less valuable than the 12 percent returns of twenty years ago. More fun in New York Lower corporate income taxes seem unlikely. Investors in American corporations already own what might be thought of as a Class D stock. The class A, B and C stocks are represented by the income-tax claims of the federal, state, and municipal governments. It is true that these "investors" have no claim on the corporation's assets; however, they get a major share of the earnings, including earnings generated by the equity buildup resulting from retention of part of the earnings owned by the Class D shareholders. A further charming characteristic of these wonderful Class A, B and C stocks is that their share of the corporation's earnings can be increased immediately, abundantly, and without payment by the unilateral vote of any one of the "stockholder" classes, e.g., by congressional action in the case of the Class A. To add to the fun, one of the classes will sometimes vote to increase its ownership share in the business retroactively - as companies operating in New York discovered to their dismay in 1975. Whenever the
9
Class A, B or C "stockholders" vote themselves a larger share of the business, the portion remaining for Class D - that's the one held by the ordinary investor - declines. Looking ahead, it seems unwise to assume that those who control the A, B and C shares will vote to reduce their own take over the long run. The class D shares probably will have to struggle to hold their own. Bad news from the FTC The last of our five possible sources of increased returns on equity is wider operating margins on sales. Here is where some optimists would hope to achieve major gains. There is no proof that they are wrong. But there are only 100 cents in the sales dollar and a lot of demands on that dollar before we get down to the residual, pretax profits. The major claimants are labor, raw materials, energy, and various non-income taxes. The relative importance of these costs hardly seems likely to decline during an age of inflation. Recent statistical evidence, furthermore, does not inspire confidence in the proposition that margins will widen in a period of inflation. In the decade ending in 1965, a period of relatively low inflation, the universe of manufacturing companies reported on quarterly by the Federal Trade Commission had an average annual pretax margin on sales of 8.6 percent. In the decade ending in 1975, the average margin was 8 percent. Margins were down, in other words, despite a very considerable increase in the inflation rate. If business was able to base its prices on replacement costs, margins would widen in inflationary periods. But the simple fact is that most large businesses, despite a widespread belief in their market power, just don't manage to pull it off. Replacement cost accounting almost always shows that corporate earnings have declined significantly in the past decade. If such major industries as oil, steel, and aluminum really have the oligopolistic muscle imputed to them, one can only conclude that their pricing policies have been remarkably restrained. There you have the complete lineup: five factors that can improve returns on common equity, none of which, by my analysis, are likely to take us very far in that direction in periods of high inflation. You may have emerged from this exercise more optimistic than I am. But remember, returns in the 12 percent area have been with us a long time. The investor's equation Even if you agree that the 12 percent equity coupon is more or less immutable, you still may hope to do well with it in the years ahead. It's conceivable that you will. After all, a lot of investors did well with it for a long time. But your future results will be governed by three variables: the relationship between book value and market value, the tax rate, and the inflation rate.
10
Let's wade through a little arithmetic about book and market value. When stocks consistently sell at book value, it's all very simple. If a stock has a book value of $100 and also an average market value of $100, 12 percent earnings by business will produce a 12 percent return for the investor (less those frictional costs, which we'll ignore for the moment). If the payout ratio is 50 percent, our investor will get $6 via dividends and a further $6 from the increase in the book value of the business, which will, of course, be reflected in the market value of his holdings. If the stock sold at 150 percent of book value, the picture would change. The investor would receive the same $6 cash dividend, but it would now represent only a 4 percent return on his $150 cost. The book value of the business would still increase by 6 percent (to $106) and the market value of the investor's holdings, valued consistently at 150 percent of book value, would similarly increase by 6 percent (to $159). But the investor's total return, i.e., from appreciation plus dividends, would be only 10 percent versus the underlying 12 percent earned by the business. When the investor buys in below book value, the process is reversed. For example, if the stock sells at 80 percent of book value, the same earnings and payout assumptions would yield 7.5 percent from dividends ($6 on an $80 price) and 6 percent from appreciation - a total return of 13.5 percent. In other words, you do better by buying at a discount rather than a premium, just as common sense would suggest. During the postwar years, the market value of the Dow Jones industrials has been as low as 84 percent of book value (in 1974) and as high as 232 percent (in 1965); most of the time the ratio has been well over 100 percent. (Early this spring, it was around 110 percent.) Let's assume that in the future the ratio will be something close to 100 percent - meaning that investors in stocks could earn the full 12 percent. At least, they could earn that figure before taxes and before inflation. 7 percent after taxes How large a bite might taxes take out of the 12 percent? For individual investors, it seems reasonable to assume that federal, state, and local income taxes will average perhaps 50 percent on dividends and 30 percent on capital gains. A majority of investors may have marginal rates somewhat below these, but many with larger holdings will experience substantially higher rates. Under the new tax law, as FORTUNE observed last month, a high-income investor in a heavily taxed city could have a marginal rate on capital gains as high as 56 percent. (See "The Tax Practitioners Act of 1976.") So let's use 50 percent and 30 percent as representative for individual investors. Let's also assume, in line with recent experience, that corporations earning 12 percent on equity pay out 5 percent in cash dividends (2.5 percent after tax) and retain 7 percent, with those retained earnings producing a corresponding market-value growth (4.9 percent after the 30 percent tax). The after-tax return, then, would be 7.4 percent. Probably this should be rounded down to about 7 percent to allow for frictional costs. To push our stocks-as-
11
disguised-bonds thesis one notch further, then, stocks might be regarded as the equivalent, for individuals, of 7 percent tax-exempt perpetual bonds. The number nobody knows Which brings us to the crucial question - the inflation rate. No one knows the answer on this one - including the politicians, economists, and Establishment pundits, who felt, a few years back, that with slight nudges here and there unemployment and inflation rates would respond like trained seals. But many signs seem negative for stable prices: the fact that inflation is now worldwide; the propensity of major groups in our society to utilize their electoral muscle to shift, rather than solve, economic problems; the demonstrated unwillingness to tackle even the most vital problems (e.g., energy and nuclear proliferation) if they can be postponed; and a political system that rewards legislators with reelection if their actions appear to produce short-term benefits even though their ultimate imprint will be to compound long-term pain. Most of those in political office, quite understandably, are firmly against inflation and firmly in favor of policies producing it. (This schizophrenia hasn't caused them to lose touch with reality, however; Congressmen have made sure that their pensions - unlike practically all granted in the private sector - are indexed to cost-of-living changes after retirement.) Discussions regarding future inflation rates usually probe the subtleties of monetary and fiscal policies. These are important variables in determining the outcome of any specific inflationary equation. But, at the source, peacetime inflation is a political problem, not an economic problem. Human behavior, not monetary behavior, is the key. And when very human politicians choose between the next election and the next generation, it's clear what usually happens. Such broad generalizations do not produce precise numbers. However, it seems quite possible to me that inflation rates will average 7 percent in future years. I hope this forecast proves to be wrong. And it may well be. Forecasts usually tell us more of the forecaster than of the future. You are free to factor your own inflation rate into the investor's equation. But if you foresee a rate averaging 2 percent or 3 percent, you are wearing different glasses than I am. So there we are: 12 percent before taxes and inflation; 7 percent after taxes and before inflation; and maybe zero percent after taxes and inflation. It hardly sounds like a formula that will keep all those cattle stampeding on TV. As a common stockholder you will have more dollars, but you may have no more purchasing power. Out with Ben Franklin ("a penny saved is a penny earned") and in with Milton Friedman ("a man might as well consume his capital as invest it").
12
What widows don't notice The arithmetic makes it plain that inflation is a far more devastating tax than anything that has been enacted by our legislatures. The inflation tax has a fantastic ability to simply consume capital. It makes no difference to a widow with her savings in a 5 percent passbook account whether she pays 100 percent income tax on her interest income during a period of zero inflation, or pays no income taxes during years of 5 percent inflation. Either way, she is "taxed" in a manner that leaves her no real income whatsoever. Any money she spends comes right out of capital. She would find outrageous a 120 percent income tax, but doesn't seem to notice that 6 percent inflation is the economic equivalent. If my inflation assumption is close to correct, disappointing results will occur not because the market falls, but in spite of the fact that the market rises. At around 920 early last month, the Dow was up fifty-five points from where it was ten years ago. But adjusted for inflation, the Dow is down almost 345 points - from 865 to 520. And about half of the earnings of the Dow had to be withheld from their owners and reinvested in order to achieve even that result. In the next ten years, the Dow would be doubled just by a combination of the 12 percent equity coupon, a 40 percent payout ratio, and the present 110 percent ratio of market to book value. And with 7 percent inflation, investors who sold at 1800 would still be considerably worse off than they are today after paying their capital-gains taxes. I can almost hear the reaction of some investors to these downbeat thoughts. It will be to assume that, whatever the difficulties presented by the new investment era, they will somehow contrive to turn in superior results for themselves. Their success is most unlikely. And, in aggregate, of course, impossible. If you feel you can dance in and out of securities in a way that defeats the inflation tax, I would like to be your broker - but not your partner. Even the so-called tax-exempt investors, such as pension funds and college endowment funds, do not escape the inflation tax. If my assumption of a 7 percent inflation rate is correct, a college treasurer should regard the first 7 percent earned each year merely as a replenishment of purchasing power. Endowment funds are earning nothing until they have outpaced the inflation treadmill. At 7 percent inflation and, say, overall investment returns of 8 percent, these institutions, which believe they are tax-exempt, are in fact paying "income taxes" of 87½ percent. The social equation Unfortunately, the major problems from high inflation rates flow not to investors but to society as a whole. Investment income is a small portion of national income, and if per capita real income could grow at a healthy rate alongside zero real investment returns, social justice might well be advanced.
13
A market economy creates some lopsided payoffs to participants. The right endowment of vocal chords, anatomical structure, physical strength, or mental powers can produce enormous piles of claim checks (stocks, bonds, and other forms of capital) on future national output. Proper selection of ancestors similarly can result in lifetime supplies of such tickets upon birth. If zero real investment returns diverted a bit greater portion of the national output from such stockholders to equally worthy and hardworking citizens lacking jackpot-producing talents, it would seem unlikely to pose such an insult to an equitable world as to risk Divine Intervention. But the potential for real improvement in the welfare of workers at the expense of affluent stockholders is not significant. Employee compensation already totals twenty-eight times the amount paid out in dividends, and a lot of those dividends now go to pension funds, nonprofit institutions such as universities, and individual stockholders who are not affluent. Under these circumstances, if we now shifted all dividends of wealthy stockholders into wages - something we could do only once, like killing a cow (or, if you prefer, a pig) - we would increase real wages by less than we used to obtain from one year's growth of the economy. The Russians understand it too Therefore, diminishment of the affluent, through the impact of inflation on their investments, will not even provide material short-term aid to those who are not affluent. Their economic well-being will rise or fall with the general effects of inflation on the economy. And those effects are not likely to be good. Large gains in real capital, invested in modern production facilities, are required to produce large gains in economic well-being. Great labor availability, great consumer wants, and great government promises will lead to nothing but great frustration without continuous creation and employment of expensive new capital assets throughout industry. That's an equation understood by Russians as well as Rockefellers. And it's one that has been applied with stunning success in West Germany and Japan. High capital-accumulation rates have enabled those countries to achieve gains in living standards at rates far exceeding ours, even though we have enjoyed much the superior position in energy. To understand the impact of inflation upon real capital accumulation, a little math is required. Come back for a moment to that 12 percent return on equity capital. Such earnings are stated after depreciation, which presumably will allow replacement of present productive capacity - if that plant and equipment can be purchased in the future at prices similar to their original cost. The way it was Let's assume that about half of earnings are paid out in dividends, leaving 6 percent of equity capital available to finance future growth. If inflation is low - say, 2 percent - a large portion of that growth can be real growth in physical output. For under these
14
conditions, 2 percent more will have to be invested in receivables, inventories, and fixed assets next year just to duplicate this year's physical output - leaving 4 percent for investment in assets to produce more physical goods. The 2 percent finances illusory dollar growth reflecting inflation and the remaining 4 percent finances real growth. If population growth is 1 percent, the 4 percent gain in real output translates into a 3 percent gain in real per capita net income. That, very roughly, is what used to happen in our economy. Now move the inflation rate to 7 percent and compute what is left for real growth after the financing of the mandatory inflation component. The answer is nothing - if dividend policies and leverage ratios remain unchanged. After half of the 12 percent earnings are paid out, the same 6 percent is left, but it is all conscripted to provide the added dollars needed to transact last year's physical volume of business. Many companies, faced with no real retained earnings with which to finance physical expansion after normal dividend payments, will improvise. How, they will ask themselves, can we stop or reduce dividends without risking stockholder wrath? I have good news for them: a ready-made set of blueprints is available. In recent years the electric-utility industry has had little or no dividend-paying capacity. Or, rather, it has had the power to pay dividends if investors agree to buy stock from them. In 1975 electric utilities paid common dividends of $3.3 billion and asked investors to return $3.4 billion. Of course, they mixed in a little solicit-Peter-to-pay-Paul technique so as not to acquire a Con Ed reputation. Con Ed, you will remember, was unwise enough in 1974 to simply tell its shareholders it didn't have the money to pay the dividend. Candor was rewarded with calamity in the marketplace. The more sophisticated utility maintains - perhaps increases - the quarterly dividend and then asks shareholders (either old or new) to mail back the money. In other words, the company issues new stock. This procedure diverts massive amounts of capital to the tax collector and substantial sums to underwriters. Everyone, however, seems to remain in spirits (particularly the underwriters). More joy at AT&T Encouraged by such success, some utilities have devised a further shortcut. In this case, the company declares the dividend, the shareholder pays the tax, and - presto - more shares are issued. No cash changes hands, although the spoilsport as always, persists in treating the transaction as if it had. AT&T, for example, instituted a dividend-reinvestment program in 1973. This company, in fairness, must be described as very stockholder-minded, and its adoption of this program, considering the folkways of finance, must he regarded as totally understandable. But the substance of the program is out of Alice in Wonderland.
15
In 1976, AT&T paid $2.3 billion in cash dividends to about 2.9 million owners of its common stock. At the end of the year, 648,000 holders (up from 601,000 the previous year) reinvested $432 million (up from $327 million) in additional shares supplied directly by the company. Just for fun, let's assume that all AT&T shareholders ultimately sign up for this program. In that case, no cash at all would be mailed to shareholders - just as when Con Ed passed a dividend. However, each of the 2.9 million owners would be notified that he should pay income taxes on his share of the retained earnings that had that year been called a "dividend." Assuming that "dividends" totaled $2.3 billion, as in 1976, and that shareholders paid an average tax of 30 percent on these, they would end up, courtesy of this marvelous plan, paying nearly $700 million to the IRS. Imagine the joy of shareholders, in such circumstances, if the directors were then to double the dividend. The government will try to do it We can expect to see more use of disguised payout reductions as business struggles with the problem of real capital accumulation. But throttling back shareholders somewhat will not entirely solve the problem. A combination of 7 percent inflation and 12 percent returns will reduce the stream of corporate capital available to finance real growth. And so, as conventional private capital-accumulation methods falter under inflation, our government will increasingly attempt to influence capital flows to industry, either unsuccessfully as in England or successfully as in Japan. The necessary cultural and historical underpinning for a Japanese-style enthusiastic partnership of government, business, and labor seems lacking here. If we are lucky, we will avoid following the English path, where all segments fight over division of the pie rather than pool their energies to enlarge it. On balance, however, it seems likely that we will hear a great deal more as the years unfold about underinvestinent, stagflation, and the failures of the private sector to fulfill needs. END About Warren Buffett The author is, in fact, one of the most visible stock-market investors in the U.S. these days. He's had plenty to invest for his own account ever since he made $25 million running an investment partnership during the 1960's. Buffett Partnership Ltd., based in Omaha, was an immensely successful operation, but he nevertheless closed up shop at the end of the decade. A January, 1970, FORTUNE article explained his decision: "he suspects that some of the juice has gone out of the stock market and that sizable gains in the future are going to be very hard to come by."
16
Buffett, who is now forty-six and still operating out of Omaha, has a diverse portfolio. He and businesses he controls have interests in over thirty public corporations. His major holdings: Berkshire Hathaway (he owns about $35 million worth) and Blue Chip Stamps (about $10 million). His visibility, recently increased by a Wall Street Journal profile, reflects his active managerial role in both companies, both of which invest in a wide range of enterprises; one is the Washington Post. And why does a man who is gloomy about stocks own so much stock? "Partly, it's habit," he admits. "Partly, it's just that stocks mean business, and owning businesses is much more interesting than owning gold or farmland. Besides, stocks are probably still the best of all the poor alternatives in an era of inflation - at least they are if you buy in at appropriate prices."
17
1961 Letter to Partners The above description of our various areas of operation may provide some clues as to how conservatively our portfolio is invested. Many people some years back thought they were behaving in the most conservative manner by purchasing medium or long-term municipal or government bonds. This policy has produced substantial market depreciation in many cases, and most certainly has failed to maintain or increase real buying power. Conscious, perhaps overly conscious, of inflation, many people now feel that they are behaving in a conservative manner by buying blue chip securities almost regardless of price-earnings ratios, dividend yields, etc. Without the benefit of hindsight as ill the bond example, I feel this course of action is fraught with danger. There is nothing at all conservative, in my opinion, about speculating as to just how high a multiplier a greedy and capricious public will put on earnings. You will not be right simply because a large number of people momentarily agree with you. You will not be right simply because important people agree with you. In many quarters the simultaneous occurrence of the two above factors is enough to make a course of action meet the test of conservatism. You will be right, over the course of many transactions, if your hypotheses are correct, your facts are correct, and your reasoning is correct. True conservatism is only possible through knowledge and reason. 1977 Letter to Shareholders In 1977 the winds in insurance underwriting were squarely behind us. Very large rate increases were effected throughout the industry in 1976 to offset the disastrous underwriting results of 1974 and 1975. But, because insurance policies typically are written for one-year periods, with pricing mistakes capable of correction only upon renewal, it was 1977 before the full impact was felt upon earnings of those earlier rate increases. The pendulum now is beginning to swing the other way. We estimate that costs involved in the insurance areas in which we operate rise at close to 1% per month. This is due to continuous monetary inflation affecting the cost of repairing humans and property, as well as “social inflation”, a broadening definition by society and juries of what is covered by insurance policies. Unless rates rise at a comparable 1% per month, underwriting profits must shrink. Recently the pace of rate increases has slowed dramatically, and it is our expectation that underwriting margins generally will be declining by the second half of the year. 1978
18
Worker’s Compensation was a mixed bag in 1978. In its first year as a subsidiary, Cypress Insurance Company, managed by Milt Thornton, turned in outstanding results. The worker’s compensation line can cause large underwriting losses when rapid inflation interacts with changing social concepts, but Milt has a cautious and highly professional staff to cope with these problems. His performance in 1978 has reinforced our very good feelings about this purchase. 1979 The book value per share of Berkshire Hathaway on September 30, 1964 (the fiscal yearend prior to the time that your present management assumed responsibility) was $19.46 per share. At yearend 1979, book value with equity holdings carried at market value was $335.85 per share. The gain in book value comes to 20.5% compounded annually. This figure, of course, is far higher than any average of our yearly operating earnings calculations, and reflects the importance of capital appreciation of insurance equity investments in determining the overall results for our shareholders. It probably also is fair to say that the quoted book value in 1964 somewhat overstated the intrinsic value of the enterprise, since the assets owned at that time on either a going concern basis or a liquidating value basis were not worth 100 cents on the dollar. (The liabilities were solid, however.) We have achieved this result while utilizing a low amount of leverage (both financial leverage measured by debt to equity, and operating leverage measured by premium volume to capital funds of our insurance business), and also without significant issuance or repurchase of shares. Basically, we have worked with the capital with which we started. From our textile base we, or our Blue Chip and Wesco subsidiaries, have acquired total ownership of thirteen businesses through negotiated purchases from private owners for cash, and have started six others. (It’s worth a mention that those who have sold to us have, almost without exception, treated us with exceptional honor and fairness, both at the time of sale and subsequently.) But before we drown in a sea of self-congratulation, a further - and crucial - observation must be made. A few years ago, a business whose per-share net worth compounded at 20% annually would have guaranteed its owners a highly successful real investment return. Now such an outcome seems less certain. For the inflation rate, coupled with individual tax rates, will be the ultimate determinant as to whether our internal operating performance produces successful investment results - i.e., a reasonable gain in purchasing power from funds committed - for you as shareholders. Just as the original 3% savings bond, a 5% passbook savings account or an 8% U.S. Treasury Note have, in turn, been transformed by inflation into financial instruments that chew up, rather than enhance, purchasing power over their investment lives, a business earning 20% on capital can produce a negative real return for its owners under inflationary conditions not much more severe than presently prevail.
19
If we should continue to achieve a 20% compounded gain - not an easy or certain result by any means - and this gain is translated into a corresponding increase in the market value of Berkshire Hathaway stock as it has been over the last fifteen years, your after-tax purchasing power gain is likely to be very close to zero at a 14% inflation rate. Most of the remaining six percentage points will go for income tax any time you wish to convert your twenty percentage points of nominal annual gain into cash. That combination - the inflation rate plus the percentage of capital that must be paid by the owner to transfer into his own pocket the annual earnings achieved by the business (i.e., ordinary income tax on dividends and capital gains tax on retained earnings) - can be thought of as an “investor’s misery index”. When this index exceeds the rate of return earned on equity by the business, the investor’s purchasing power (real capital) shrinks even though he consumes nothing at all. We have no corporate solution to this problem; high inflation rates will not help us earn higher rates of return on equity. One friendly but sharp-eyed commentator on Berkshire has pointed out that our book value at the end of 1964 would have bought about one-half ounce of gold and, fifteen years later, after we have plowed back all earnings along with much blood, sweat and tears, the book value produced will buy about the same half ounce. A similar comparison could be drawn with Middle Eastern oil. The rub has been that government has been exceptionally able in printing money and creating promises, but is unable to print gold or create oil. We intend to continue to do as well as we can in managing the internal affairs of the business. But you should understand that external conditions affecting the stability of currency may very well be the most important factor in determining whether there are any real rewards from your investment in Berkshire Hathaway. ………. Since we have covered our philosophy regarding equities extensively in recent annual reports, a more extended discussion of bond investments may be appropriate for this one, particularly in light of what has happened since yearend. An extraordinary amount of money has been lost by the insurance industry in the bond area - notwithstanding the accounting convention that allows insurance companies to carry their bond investments at amortized cost, regardless of impaired market value. Actually, that very accounting convention may have contributed in a major way to the losses; had management been forced to recognize market values, its attention might have been focused much earlier on the dangers of a very long-term bond contract. Ironically, many insurance companies have decided that a one-year auto policy is inappropriate during a time of inflation, and six-month policies have been brought in as replacements. “How,” say many of the insurance managers, “can we be expected to look forward twelve months and estimate such imponderables as hospital costs, auto parts prices, etc.?” But, having decided that one year is too long a period for which to set a
20
fixed price for insurance in an inflationary world, they then have turned around, taken the proceeds from the sale of that six-month policy, and sold the money at a fixed price for thirty or forty years. The very long-term bond contract has been the last major fixed price contract of extended duration still regularly initiated in an inflation-ridden world. The buyer of money to be used between 1980 and 2020 has been able to obtain a firm price now for each year of its use while the buyer of auto insurance, medical services, newsprint, office space - or just about any other product or service - would be greeted with laughter if he were to request a firm price now to apply through 1985. For in virtually all other areas of commerce, parties to long-term contracts now either index prices in some manner, or insist on the right to review the situation every year or so. A cultural lag has prevailed in the bond area. The buyers (borrowers) and middlemen (underwriters) of money hardly could be expected to raise the question of whether it all made sense, and the sellers (lenders) slept through an economic and contractual revolution. For the last few years our insurance companies have not been a net purchaser of any straight long-term bonds (those without conversion rights or other attributes offering profit possibilities). There have been some purchases in the straight bond area, of course, but they have been offset by sales or maturities. Even prior to this period, we never would buy thirty or forty-year bonds; instead we tried to concentrate in the straight bond area on shorter issues with sinking funds and on issues that seemed relatively undervalued because of bond market inefficiencies. However, the mild degree of caution that we exercised was an improper response to the world unfolding about us. You do not adequately protect yourself by being half awake while others are sleeping. It was a mistake to buy fifteen-year bonds, and yet we did; we made an even more serious mistake in not selling them (at losses, if necessary) when our present views began to crystallize. (Naturally, those views are much clearer and definite in retrospect; it would be fair for you to ask why we weren’t writing about this subject last year.) Of course, we must hold significant amounts of bonds or other fixed dollar obligations in conjunction with our insurance operations. In the last several years our net fixed dollar commitments have been limited to the purchase of convertible bonds. We believe that the conversion options obtained, in effect, give that portion of the bond portfolio a far shorter average life than implied by the maturity terms of the issues (i.e., at an appropriate time of our choosing, we can terminate the bond contract by conversion into stock). This bond policy has given us significantly lower unrealized losses than those experienced by the great majority of property and casualty insurance companies. We also have been helped by our strong preference for equities in recent years that has kept our overall bond segment relatively low. Nevertheless, we are taking our lumps in bonds and
21
feel that, in a sense, our mistakes should be viewed less charitably than the mistakes of those who went about their business unmindful of the developing problems. Harking back to our textile experience, we should have realized the futility of trying to be very clever (via sinking funds and other special type issues) in an area where the tide was running heavily against us. We have severe doubts as to whether a very long-term fixed-interest bond, denominated in dollars, remains an appropriate business contract in a world where the value of dollars seems almost certain to shrink by the day. Those dollars, as well as paper creations of other governments, simply may have too many structural weaknesses to appropriately serve as a unit of long term commercial reference. If so, really long bonds may turn out to be obsolete instruments and insurers who have bought those maturities of 2010 or 2020 could have major and continuing problems on their hands. We, likewise, will be unhappy with our fifteen-year bonds and will annually pay a price in terms of earning power that reflects that mistake. Some of our convertible bonds appear exceptionally attractive to us, and have the same sort of earnings retention factor (applicable to the stock into which they may be converted) that prevails in our conventional equity portfolio. We expect to make money in these bonds (we already have, in a few cases) and have hopes that our profits in this area may offset losses in straight bonds. And, of course, there is the possibility that our present analysis is much too negative. The chances for very low rates of inflation are not nil. Inflation is man-made; perhaps it can be man-mastered. The threat which alarms us may also alarm legislators and other powerful groups, prompting some appropriate response. Furthermore, present interest rates incorporate much higher inflation projections than those of a year or two ago. Such rates may prove adequate or more than adequate to protect bond buyers. We even may miss large profits from a major rebound in bond prices. However, our unwillingness to fix a price now for a pound of See’s candy or a yard of Berkshire cloth to be delivered in 2010 or 2020 makes us equally unwilling to buy bonds which set a price on money now for use in those years. Overall, we opt for Polonius (slightly restated): “Neither a short-term borrower nor a long-term lender be.” 1980 Our own analysis of earnings reality differs somewhat from generally accepted accounting principles, particularly when those principles must be applied in a world of high and uncertain rates of inflation. (But it’s much easier to criticize than to improve such accounting rules. The inherent problems are monumental.) We have owned 100% of businesses whose reported earnings were not worth close to 100 cents on the dollar to us even though, in an accounting sense, we totally controlled their disposition. (The “control” was theoretical. Unless we reinvested all earnings, massive deterioration in the
22
value of assets already in place would occur. But those reinvested earnings had no prospect of earning anything close to a market return on capital.) We have also owned small fractions of businesses with extraordinary reinvestment possibilities whose retained earnings had an economic value to us far in excess of 100 cents on the dollar. The value to Berkshire Hathaway of retained earnings is not determined by whether we own 100%, 50%, 20% or 1% of the businesses in which they reside. Rather, the value of those retained earnings is determined by the use to which they are put and the subsequent level of earnings produced by that usage. This is true whether we determine the usage, or whether managers we did not hire - but did elect to join - determine that usage. (It’s the act that counts, not the actors.) And the value is in no way affected by the inclusion or non-inclusion of those retained earnings in our own reported operating earnings. If a tree grows in a forest partially owned by us, but we don’t record the growth in our financial statements, we still own part of the tree. Our view, we warn you, is non-conventional. But we would rather have earnings for which we did not get accounting credit put to good use in a 10%-owned company by a management we did not personally hire, than have earnings for which we did get credit put into projects of more dubious potential by another management - even if we are that management. (We can’t resist pausing here for a short commercial. One usage of retained earnings we often greet with special enthusiasm when practiced by companies in which we have an investment interest is repurchase of their own shares. The reasoning is simple: if a fine business is selling in the market place for far less than intrinsic value, what more certain or more profitable utilization of capital can there be than significant enlargement of the interests of all owners at that bargain price? The competitive nature of corporate acquisition activity almost guarantees the payment of a full - frequently more than full price when a company buys the entire ownership of another enterprise. But the auction nature of security markets often allows finely-run companies the opportunity to purchase portions of their own businesses at a price under 50% of that needed to acquire the same earning power through the negotiated acquisition of another enterprise.) Long-Term Corporate Results As we have noted, we evaluate single-year corporate performance by comparing operating earnings to shareholders’ equity with securities valued at cost. Our long-term yardstick of performance, however, includes all capital gains or losses, realized or unrealized. We continue to achieve a long-term return on equity that considerably exceeds the average of our yearly returns. The major factor causing this pleasant result is a simple one: the retained earnings of those non-controlled holdings we discussed earlier have been translated into gains in market value. Of course, this translation of retained earnings into market price appreciation is highly uneven (it goes in reverse some years), unpredictable as to timing, and unlikely to materialize on a precise dollar-for-dollar basis. And a silly purchase price for a block of
23
stock in a corporation can negate the effects of a decade of earnings retention by that corporation. But when purchase prices are sensible, some long-term market recognition of the accumulation of retained earnings almost certainly will occur. Periodically you even will receive some frosting on the cake, with market appreciation far exceeding post-purchase retained earnings. In the sixteen years since present management assumed responsibility for Berkshire, book value per share with insurance-held equities valued at market has increased from $19.46 to $400.80, or 20.5% compounded annually. (You’ve done better: the value of the mineral content in the human body compounded at 22% annually during the past decade.) It is encouraging, moreover, to realize that our record was achieved despite many mistakes. The list is too painful and lengthy to detail here. But it clearly shows that a reasonably competitive corporate batting average can be achieved in spite of a lot of managerial strikeouts. Our insurance companies will continue to make large investments in well-run, favorably-situated, non-controlled companies that very often will pay out in dividends only small proportions of their earnings. Following this policy, we would expect our long-term returns to continue to exceed the returns derived annually from reported operating earnings. Our confidence in this belief can easily be quantified: if we were to sell the equities that we hold and replace them with long-term tax-free bonds, our reported operating earnings would rise immediately by over $30 million annually. Such a shift tempts us not at all. So much for the good news. Results for Owners Unfortunately, earnings reported in corporate financial statements are no longer the dominant variable that determines whether there are any real earnings for you, the owner. For only gains in purchasing power represent real earnings on investment. If you (a) forego ten hamburgers to purchase an investment; (b) receive dividends which, after tax, buy two hamburgers; and (c) receive, upon sale of your holdings, after-tax proceeds that will buy eight hamburgers, then (d) you have had no real income from your investment, no matter how much it appreciated in dollars. You may feel richer, but you won’t eat richer. High rates of inflation create a tax on capital that makes much corporate investment unwise - at least if measured by the criterion of a positive real investment return to owners. This “hurdle rate” the return on equity that must be achieved by a corporation in order to produce any real return for its individual owners - has increased dramatically in recent years. The average tax-paying investor is now running up a down escalator whose pace has accelerated to the point where his upward progress is nil. For example, in a world of 12% inflation a business earning 20% on equity (which very few manage consistently to do) and distributing it all to individuals in the 50% bracket is
24
chewing up their real capital, not enhancing it. (Half of the 20% will go for income tax; the remaining 10% leaves the owners of the business with only 98% of the purchasing power they possessed at the start of the year - even though they have not spent a penny of their “earnings”). The investors in this bracket would actually be better off with a combination of stable prices and corporate earnings on equity capital of only a few per cent. Explicit income taxes alone, unaccompanied by any implicit inflation tax, never can turn a positive corporate return into a negative owner return. (Even if there were 90% personal income tax rates on both dividends and capital gains, some real income would be left for the owner at a zero inflation rate.) But the inflation tax is not limited by reported income. Inflation rates not far from those recently experienced can turn the level of positive returns achieved by a majority of corporations into negative returns for all owners, including those not required to pay explicit taxes. (For example, if inflation reached 16%, owners of the 60% plus of corporate America earning less than this rate of return would be realizing a negative real return - even if income taxes on dividends and capital gains were eliminated.) Of course, the two forms of taxation co-exist and interact since explicit taxes are levied on nominal, not real, income. Thus you pay income taxes on what would be deficits if returns to stockholders were measured in constant dollars. At present inflation rates, we believe individual owners in medium or high tax brackets (as distinguished from tax-free entities such as pension funds, eleemosynary institutions, etc.) should expect no real long-term return from the average American corporation, even though these individuals reinvest the entire after-tax proceeds from all dividends they receive. The average return on equity of corporations is fully offset by the combination of the implicit tax on capital levied by inflation and the explicit taxes levied both on dividends and gains in value produced by retained earnings. As we said last year, Berkshire has no corporate solution to the problem. (We’ll say it again next year, too.) Inflation does not improve our return on equity. Indexing is the insulation that all seek against inflation. But the great bulk (although there are important exceptions) of corporate capital is not even partially indexed. Of course, earnings and dividends per share usually will rise if significant earnings are “saved” by a corporation; i.e., reinvested instead of paid as dividends. But that would be true without inflation. A thrifty wage earner, likewise, could achieve regular annual increases in his total income without ever getting a pay increase - if he were willing to take only half of his paycheck in cash (his wage “dividend”) and consistently add the other half (his “retained earnings”) to a savings account. Neither this high-saving wage earner nor the stockholder in a high-saving corporation whose annual dividend rate increases while its rate of return on equity remains flat is truly indexed. For capital to be truly indexed, return on equity must rise, i.e., business earnings consistently must increase in proportion to the increase in the price level without any
25
need for the business to add to capital - including working capital - employed. (Increased earnings produced by increased investment don’t count.) Only a few businesses come close to exhibiting this ability. And Berkshire Hathaway isn’t one of them. We, of course, have a corporate policy of reinvesting earnings for growth, diversity and strength, which has the incidental effect of minimizing the current imposition of explicit taxes on our owners. However, on a day-by-day basis, you will be subjected to the implicit inflation tax, and when you wish to transfer your investment in Berkshire into another form of investment, or into consumption, you also will face explicit taxes. ………. Our acquisition preferences run toward businesses that generate cash, not those that consume it. As inflation intensifies, more and more companies find that they must spend all funds they generate internally just to maintain their existing physical volume of business. There is a certain mirage-like quality to such operations. However attractive the earnings numbers, we remain leery of businesses that never seem able to convert such pretty numbers into no-strings-attached cash. 1981 Non-Controlled Ownership Earnings In the 1980 annual report we discussed extensively the concept of non-controlled ownership earnings, i.e., Berkshire’s share of the undistributed earnings of companies we don’t control or significantly influence but in which we, nevertheless, have important investments. (We will be glad to make available to new or prospective shareholders copies of that discussion or others from earlier reports to which we refer in this report.) No portion of those undistributed earnings is included in the operating earnings of Berkshire. However, our belief is that, in aggregate, those undistributed and, therefore, unrecorded earnings will be translated into tangible value for Berkshire shareholders just as surely as if subsidiaries we control had earned, retained - and reported - similar earnings. We know that this translation of non-controlled ownership earnings into corresponding realized and unrealized capital gains for Berkshire will be extremely irregular as to time of occurrence. While market values track business values quite well over long periods, in any given year the relationship can gyrate capriciously. Market recognition of retained earnings also will be unevenly realized among companies. It will be disappointingly low or negative in cases where earnings are employed non-productively, and far greater than dollar-for-dollar of retained earnings in cases of companies that achieve high returns with their augmented capital. Overall, if a group of non-controlled companies is selected with reasonable skill, the group result should be quite satisfactory.
26
In aggregate, our non-controlled business interests have more favorable underlying economic characteristics than our controlled businesses. That’s understandable; the area of choice has been far wider. Small portions of exceptionally good businesses are usually available in the securities markets at reasonable prices. But such businesses are available for purchase in their entirety only rarely, and then almost always at high prices. General Acquisition Behavior As our history indicates, we are comfortable both with total ownership of businesses and with marketable securities representing small portions of businesses. We continually look for ways to employ large sums in each area. (But we try to avoid small commitments - “If something’s not worth doing at all, it’s not worth doing well”.) Indeed, the liquidity requirements of our insurance and trading stamp businesses mandate major investments in marketable securities. Our acquisition decisions will be aimed at maximizing real economic benefits, not at maximizing either managerial domain or reported numbers for accounting purposes. (In the long run, managements stressing accounting appearance over economic substance usually achieve little of either.) Regardless of the impact upon immediately reportable earnings, we would rather buy 10% of Wonderful Business T at X per share than 100% of T at 2X per share. Most corporate managers prefer just the reverse, and have no shortage of stated rationales for their behavior. However, we suspect three motivations - usually unspoken - to be, singly or in combination, the important ones in most high-premium takeovers: (1) Leaders, business or otherwise, seldom are deficient in animal spirits and often relish increased activity and challenge. At Berkshire, the corporate pulse never beats faster than when an acquisition is in prospect. (2) Most organizations, business or otherwise, measure themselves, are measured by others, and compensate their managers far more by the yardstick of size than by any other yardstick. (Ask a Fortune 500 manager where his corporation stands on that famous list and, invariably, the number responded will be from the list ranked by size of sales; he may well not even know where his corporation places on the list Fortune just as faithfully compiles ranking the same 500 corporations by profitability.) (3) Many managements apparently were overexposed in
27
impressionable childhood years to the story in which the imprisoned handsome prince is released from a toad’s body by a kiss from a beautiful princess. Consequently, they are certain their managerial kiss will do wonders for the profitability of Company T(arget). Such optimism is essential. Absent that rosy view, why else should the shareholders of Company A(cquisitor) want to own an interest in T at the 2X takeover cost rather than at the X market price they would pay if they made direct purchases on their own? In other words, investors can always buy toads at the going price for toads. If investors instead bankroll princesses who wish to pay double for the right to kiss the toad, those kisses had better pack some real dynamite. We’ve observed many kisses but very few miracles. Nevertheless, many managerial princesses remain serenely confident about the future potency of their kisses - even after their corporate backyards are knee-deep in unresponsive toads. In fairness, we should acknowledge that some acquisition records have been dazzling. Two major categories stand out. The first involves companies that, through design or accident, have purchased only businesses that are particularly well adapted to an inflationary environment. Such favored business must have two characteristics: (1) an ability to increase prices rather easily (even when product demand is flat and capacity is not fully utilized) without fear of significant loss of either market share or unit volume, and (2) an ability to accommodate large dollar volume increases in business (often produced more by inflation than by real growth) with only minor additional investment of capital. Managers of ordinary ability, focusing solely on acquisition possibilities meeting these tests, have achieved excellent results in recent decades. However, very few enterprises possess both characteristics, and competition to buy those that do has now become fierce to the point of being self-defeating. The second category involves the managerial superstars - men who can recognize that rare prince who is disguised as a toad, and who have managerial abilities that enable them to peel away the disguise. We salute such managers as Ben Heineman at Northwest Industries, Henry Singleton at Teledyne, Erwin Zaban at National Service Industries, and especially Tom Murphy at Capital Cities Communications (a real managerial “twofer”, whose acquisition efforts have been properly focused in Category 1 and whose operating talents also make him a leader of Category 2). From both direct and vicarious experience, we recognize the difficulty and rarity of these executives’ achievements. (So
28
do they; these champs have made very few deals in recent years, and often have found repurchase of their own shares to be the most sensible employment of corporate capital.) Your Chairman, unfortunately, does not qualify for Category 2. And, despite a reasonably good understanding of the economic factors compelling concentration in Category 1, our actual acquisition activity in that category has been sporadic and inadequate. Our preaching was better than our performance. (We neglected the Noah principle: predicting rain doesn’t count, building arks does.) We have tried occasionally to buy toads at bargain prices with results that have been chronicled in past reports. Clearly our kisses fell flat. We have done well with a couple of princes - but they were princes when purchased. At least our kisses didn’t turn them into toads. And, finally, we have occasionally been quite successful in purchasing fractional interests in easily-identifiable princes at toad-like prices. Berkshire Acquisition Objectives We will continue to seek the acquisition of businesses in their entirety at prices that will make sense, even should the future of the acquired enterprise develop much along the lines of its past. We may very well pay a fairly fancy price for a Category 1 business if we are reasonably confident of what we are getting. But we will not normally pay a lot in any purchase for what we are supposed to bring to the party - for we find that we ordinarily don’t bring a lot. During 1981 we came quite close to a major purchase involving both a business and a manager we liked very much. However, the price finally demanded, considering alternative uses for the funds involved, would have left our owners worse off than before the purchase. The empire would have been larger, but the citizenry would have been poorer. Although we had no success in 1981, from time to time in the future we will be able to purchase 100% of businesses meeting our standards. Additionally, we expect an occasional offering of a major “non-voting partnership” as discussed under the Pinkerton’s heading on page 47 of this report. We welcome suggestions regarding such companies where we, as a substantial junior partner, can achieve good economic results while furthering the long-term objectives of present owners and managers. Currently, we find values most easily obtained through the open-market purchase of fractional positions in companies with excellent business franchises and competent, honest managements. We never expect to run these companies, but we do expect to profit from them. We expect that undistributed earnings from such companies will produce full value (subject to tax when realized) for Berkshire and its shareholders. If they don’t, we have
29
made mistakes as to either: (1) the management we have elected to join; (2) the future economics of the business; or (3) the price we have paid. We have made plenty of such mistakes - both in the purchase of non-controlling and controlling interests in businesses. Category (2) miscalculations are the most common. Of course, it is necessary to dig deep into our history to find illustrations of such mistakes - sometimes as deep as two or three months back. For example, last year your Chairman volunteered his expert opinion on the rosy future of the aluminum business. Several minor adjustments to that opinion - now aggregating approximately 180 degrees - have since been required. For personal as well as more objective reasons, however, we generally have been able to correct such mistakes far more quickly in the case of non-controlled businesses (marketable securities) than in the case of controlled subsidiaries. Lack of control, in effect, often has turned out to be an economic plus. As we mentioned last year, the magnitude of our non-recorded “ownership” earnings has grown to the point where their total is greater than our reported operating earnings. We expect this situation will continue. In just four ownership positions in this category - GEICO Corporation, General Foods Corporation, R. J. Reynolds Industries, Inc. and The Washington Post Company - our share of undistributed and therefore unrecorded earnings probably will total well over $35 million in 1982. The accounting rules that entirely ignore these undistributed earnings diminish the utility of our annual return on equity calculation, or any other single year measure of economic performance. Long-Term Corporate Performance In measuring long-term economic performance, equities held by our insurance subsidiaries are valued at market subject to a charge reflecting the amount of taxes that would have to be paid if unrealized gains were actually realized. If we are correct in the premise stressed in the preceding section of this report, our unreported ownership earnings will find their way, irregularly but inevitably, into our net worth. To date, this has been the case. An even purer calculation of performance would involve a valuation of bonds and non-insurance held equities at market. However, GAAP accounting does not prescribe this procedure, and the added purity would change results only very slightly. Should any valuation difference widen to significant proportions, as it has at most major insurance companies, we will report its effect to you. On a GAAP basis, during the present management’s term of seventeen years, book value has increased from $19.46 per share to $526.02 per share, or 21.1% compounded annually. This rate of return number is highly likely to drift downward in future years. We hope, however, that it can be maintained significantly above the rate of return achieved by the average large American corporation.
30
Over half of the large gain in Berkshire’s net worth during 1981 - it totaled $124 million, or about 31% - resulted from the market performance of a single investment, GEICO Corporation. In aggregate, our market gain from securities during the year considerably outstripped the gain in underlying business values. Such market variations will not always be on the pleasant side. In past reports we have explained how inflation has caused our apparently satisfactory long-term corporate performance to be illusory as a measure of true investment results for our owners. We applaud the efforts of Federal Reserve Chairman Volcker and note the currently more moderate increases in various price indices. Nevertheless, our views regarding long-term inflationary trends are as negative as ever. Like virginity, a stable price level seems capable of maintenance, but not of restoration. Despite the overriding importance of inflation in the investment equation, we will not punish you further with another full recital of our views; inflation itself will be punishment enough. (Copies of previous discussions are available for masochists.) But, because of the unrelenting destruction of currency values, our corporate efforts will continue to do a much better job of filling your wallet than of filling your stomach. Equity Value-Added An additional factor should further subdue any residual enthusiasm you may retain regarding our long-term rate of return. The economic case justifying equity investment is that, in aggregate, additional earnings above passive investment returns - interest on fixed-income securities - will be derived through the employment of managerial and entrepreneurial skills in conjunction with that equity capital. Furthermore, the case says that since the equity capital position is associated with greater risk than passive forms of investment, it is “entitled” to higher returns. A “value-added” bonus from equity capital seems natural and certain. But is it? Several decades back, a return on equity of as little as 10% enabled a corporation to be classified as a “good” business - i.e., one in which a dollar reinvested in the business logically could be expected to be valued by the market at more than one hundred cents. For, with long-term taxable bonds yielding 5% and long-term tax-exempt bonds 3%, a business operation that could utilize equity capital at 10% clearly was worth some premium to investors over the equity capital employed. That was true even though a combination of taxes on dividends and on capital gains would reduce the 10% earned by the corporation to perhaps 6%-8% in the hands of the individual investor. Investment markets recognized this truth. During that earlier period, American business earned an average of 11% or so on equity capital employed and stocks, in aggregate, sold at valuations far above that equity capital (book value), averaging over 150 cents on the dollar. Most businesses were “good” businesses because they earned far more than their
31
keep (the return on long-term passive money). The value-added produced by equity investment, in aggregate, was substantial. That day is gone. But the lessons learned during its existence are difficult to discard. While investors and managers must place their feet in the future, their memories and nervous systems often remain plugged into the past. It is much easier for investors to utilize historic p/e ratios or for managers to utilize historic business valuation yardsticks than it is for either group to rethink their premises daily. When change is slow, constant rethinking is actually undesirable; it achieves little and slows response time. But when change is great, yesterday’s assumptions can be retained only at great cost. And the pace of economic change has become breathtaking. During the past year, long-term taxable bond yields exceeded 16% and long-term tax-exempts 14%. The total return achieved from such tax-exempts, of course, goes directly into the pocket of the individual owner. Meanwhile, American business is producing earnings of only about 14% on equity. And this 14% will be substantially reduced by taxation before it can be banked by the individual owner. The extent of such shrinkage depends upon the dividend policy of the corporation and the tax rates applicable to the investor. Thus, with interest rates on passive investments at late 1981 levels, a typical American business is no longer worth one hundred cents on the dollar to owners who are individuals. (If the business is owned by pension funds or other tax-exempt investors, the arithmetic, although still unenticing, changes substantially for the better.) Assume an investor in a 50% tax bracket; if our typical company pays out all earnings, the income return to the investor will be equivalent to that from a 7% tax-exempt bond. And, if conditions persist - if all earnings are paid out and return on equity stays at 14% - the 7% tax-exempt equivalent to the higher-bracket individual investor is just as frozen as is the coupon on a tax-exempt bond. Such a perpetual 7% tax-exempt bond might be worth fifty cents on the dollar as this is written. If, on the other hand, all earnings of our typical American business are retained and return on equity again remains constant, earnings will grow at 14% per year. If the p/e ratio remains constant, the price of our typical stock will also grow at 14% per year. But that 14% is not yet in the pocket of the shareholder. Putting it there will require the payment of a capital gains tax, presently assessed at a maximum rate of 20%. This net return, of course, works out to a poorer rate of return than the currently available passive after-tax rate. Unless passive rates fall, companies achieving 14% per year gains in earnings per share while paying no cash dividend are an economic failure for their individual shareholders. The returns from passive capital outstrip the returns from active capital. This is an unpleasant fact for both investors and corporate managers and, therefore, one they may wish to ignore. But facts do not cease to exist, either because they are unpleasant or because they are ignored.
32
Most American businesses pay out a significant portion of their earnings and thus fall between the two examples. And most American businesses are currently “bad” businesses economically - producing less for their individual investors after-tax than the tax-exempt passive rate of return on money. Of course, some high-return businesses still remain attractive, even under present conditions. But American equity capital, in aggregate, produces no value-added for individual investors. It should be stressed that this depressing situation does not occur because corporations are jumping, economically, less high than previously. In fact, they are jumping somewhat higher: return on equity has improved a few points in the past decade. But the crossbar of passive return has been elevated much faster. Unhappily, most companies can do little but hope that the bar will be lowered significantly; there are few industries in which the prospects seem bright for substantial gains in return on equity. Inflationary experience and expectations will be major (but not the only) factors affecting the height of the crossbar in future years. If the causes of long-term inflation can be tempered, passive returns are likely to fall and the intrinsic position of American equity capital should significantly improve. Many businesses that now must be classified as economically “bad” would be restored to the “good” category under such circumstances. A further, particularly ironic, punishment is inflicted by an inflationary environment upon the owners of the “bad” business. To continue operating in its present mode, such a low-return business usually must retain much of its earnings - no matter what penalty such a policy produces for shareholders. Reason, of course, would prescribe just the opposite policy. An individual, stuck with a 5% bond with many years to run before maturity, does not take the coupons from that bond and pay one hundred cents on the dollar for more 5% bonds while similar bonds are available at, say, forty cents on the dollar. Instead, he takes those coupons from his low-return bond and - if inclined to reinvest - looks for the highest return with safety currently available. Good money is not thrown after bad. What makes sense for the bondholder makes sense for the shareholder. Logically, a company with historic and prospective high returns on equity should retain much or all of its earnings so that shareholders can earn premium returns on enhanced capital. Conversely, low returns on corporate equity would suggest a very high dividend payout so that owners could direct capital toward more attractive areas. (The Scriptures concur. In the parable of the talents, the two high-earning servants are rewarded with 100% retention of earnings and encouraged to expand their operations. However, the non-earning third servant is not only chastised - “wicked and slothful” - but also is required to redirect all of his capital to the top performer. Matthew 25: 14-30) But inflation takes us through the looking glass into the upside-down world of Alice in Wonderland. When prices continuously rise, the “bad” business must retain every nickel that it can. Not because it is attractive as a repository for equity capital, but precisely because it is so unattractive, the low-return business must follow a high retention policy.
33
If it wishes to continue operating in the future as it has in the past - and most entities, including businesses, do - it simply has no choice. For inflation acts as a gigantic corporate tapeworm. That tapeworm preemptively consumes its requisite daily diet of investment dollars regardless of the health of the host organism. Whatever the level of reported profits (even if nil), more dollars for receivables, inventory and fixed assets are continuously required by the business in order to merely match the unit volume of the previous year. The less prosperous the enterprise, the greater the proportion of available sustenance claimed by the tapeworm. Under present conditions, a business earning 8% or 10% on equity often has no leftovers for expansion, debt reduction or “real” dividends. The tapeworm of inflation simply cleans the plate. (The low-return company’s inability to pay dividends, understandably, is often disguised. Corporate America increasingly is turning to dividend reinvestment plans, sometimes even embodying a discount arrangement that all but forces shareholders to reinvest. Other companies sell newly issued shares to Peter in order to pay dividends to Paul. Beware of “dividends” that can be paid out only if someone promises to replace the capital distributed.) Berkshire continues to retain its earnings for offensive, not defensive or obligatory, reasons. But in no way are we immune from the pressures that escalating passive returns exert on equity capital. We continue to clear the crossbar of after-tax passive return - but barely. Our historic 21% return - not at all assured for the future - still provides, after the current capital gain tax rate (which we expect to rise considerably in future years), a modest margin over current after-tax rates on passive money. It would be a bit humiliating to have our corporate value-added turn negative. But it can happen here as it has elsewhere, either from events outside anyone’s control or from poor relative adaptation on our part. ………. Insurance Industry Conditions “Forecasts”, said Sam Goldwyn, “are dangerous, particularly those about the future.” (Berkshire shareholders may have reached a similar conclusion after rereading our past annual reports featuring your Chairman’s prescient analysis of textile prospects.) There is no danger, however, in forecasting that 1982 will be the worst year in recent history for insurance underwriting. That result already has been guaranteed by present pricing behavior, coupled with the term nature of the insurance contract. While many auto policies are priced and sold at six-month intervals - and many property policies are sold for a three-year term - a weighted average of the duration of all property-casualty insurance policies probably runs a little under twelve months. And prices for the insurance coverage, of course, are frozen for the life of the contract. Thus, this year’s sales contracts (“premium written” in the parlance of the industry) determine about one-
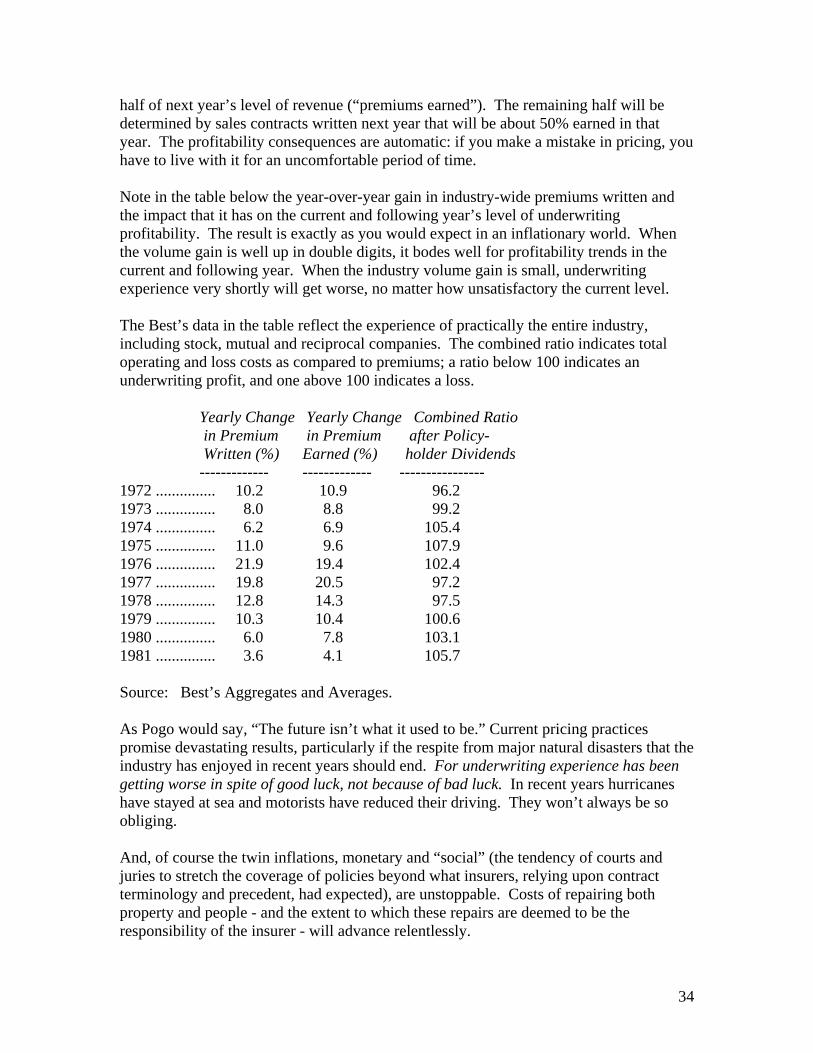
34
half of next year’s level of revenue (“premiums earned”). The remaining half will be determined by sales contracts written next year that will be about 50% earned in that year. The profitability consequences are automatic: if you make a mistake in pricing, you have to live with it for an uncomfortable period of time. Note in the table below the year-over-year gain in industry-wide premiums written and the impact that it has on the current and following year’s level of underwriting profitability. The result is exactly as you would expect in an inflationary world. When the volume gain is well up in double digits, it bodes well for profitability trends in the current and following year. When the industry volume gain is small, underwriting experience very shortly will get worse, no matter how unsatisfactory the current level. The Best’s data in the table reflect the experience of practically the entire industry, including stock, mutual and reciprocal companies. The combined ratio indicates total operating and loss costs as compared to premiums; a ratio below 100 indicates an underwriting profit, and one above 100 indicates a loss. Yearly Change Yearly Change Combined Ratio in Premium in Premium after Policy- Written (%) Earned (%) holder Dividends ------------- ------------- ---------------- 1972 ............... 10.2 10.9 96.2 1973 ............... 8.0 8.8 99.2 1974 ............... 6.2 6.9 105.4 1975 ............... 11.0 9.6 107.9 1976 ............... 21.9 19.4 102.4 1977 ............... 19.8 20.5 97.2 1978 ............... 12.8 14.3 97.5 1979 ............... 10.3 10.4 100.6 1980 ............... 6.0 7.8 103.1 1981 ............... 3.6 4.1 105.7 Source: Best’s Aggregates and Averages. As Pogo would say, “The future isn’t what it used to be.” Current pricing practices promise devastating results, particularly if the respite from major natural disasters that the industry has enjoyed in recent years should end. For underwriting experience has been getting worse in spite of good luck, not because of bad luck. In recent years hurricanes have stayed at sea and motorists have reduced their driving. They won’t always be so obliging. And, of course the twin inflations, monetary and “social” (the tendency of courts and juries to stretch the coverage of policies beyond what insurers, relying upon contract terminology and precedent, had expected), are unstoppable. Costs of repairing both property and people - and the extent to which these repairs are deemed to be the responsibility of the insurer - will advance relentlessly.
35
Absent any bad luck (catastrophes, increased driving, etc.), an immediate industry volume gain of at least 10% per year probably is necessary to stabilize the record level of underwriting losses that will automatically prevail in mid-1982. (Most underwriters expect incurred losses in aggregate to rise at least 10% annually; each, of course, counts on getting less than his share.) Every percentage point of annual premium growth below the 10% equilibrium figure quickens the pace of deterioration. Quarterly data in 1981 underscore the conclusion that a terrible underwriting picture is worsening at an accelerating rate. In the 1980 annual report we discussed the investment policies that have destroyed the integrity of many insurers’ balance sheets, forcing them to abandon underwriting discipline and write business at any price in order to avoid negative cash flow. It was clear that insurers with large holdings of bonds valued, for accounting purposes, at nonsensically high prices would have little choice but to keep the money revolving by selling large numbers of policies at nonsensically low prices. Such insurers necessarily fear a major decrease in volume more than they fear a major underwriting loss. But, unfortunately, all insurers are affected; it’s difficult to price much differently than your most threatened competitor. This pressure continues unabated and adds a new motivation to the others that drive many insurance managers to push for business; worship of size over profitability, and the fear that market share surrendered never can be regained. Whatever the reasons, we believe it is true that virtually no major property-casualty insurer - despite protests by the entire industry that rates are inadequate and great selectivity should be exercised - has been willing to turn down business to the point where cash flow has turned significantly negative. Absent such a willingness, prices will remain under severe pressure. Commentators continue to talk of the underwriting cycle, usually implying a regularity of rhythm and a relatively constant midpoint of profitability Our own view is different. We believe that very large, although obviously varying, underwriting losses will be the norm for the industry, and that the best underwriting years in the future decade may appear substandard against the average year of the past decade. We have no magic formula to insulate our controlled insurance companies against this deteriorating future. Our managers, particularly Phil Liesche, Bill Lyons, Roland Miller, Floyd Taylor and Milt Thornton, have done a magnificent job of swimming against the tide. We have sacrificed much volume, but have maintained a substantial underwriting superiority in relation to industry-wide results. The outlook at Berkshire is for continued low volume. Our financial position offers us maximum flexibility, a very rare condition in the property-casualty insurance industry. And, at some point, should fear ever prevail throughout the industry, our financial strength could become an operational asset of immense value.
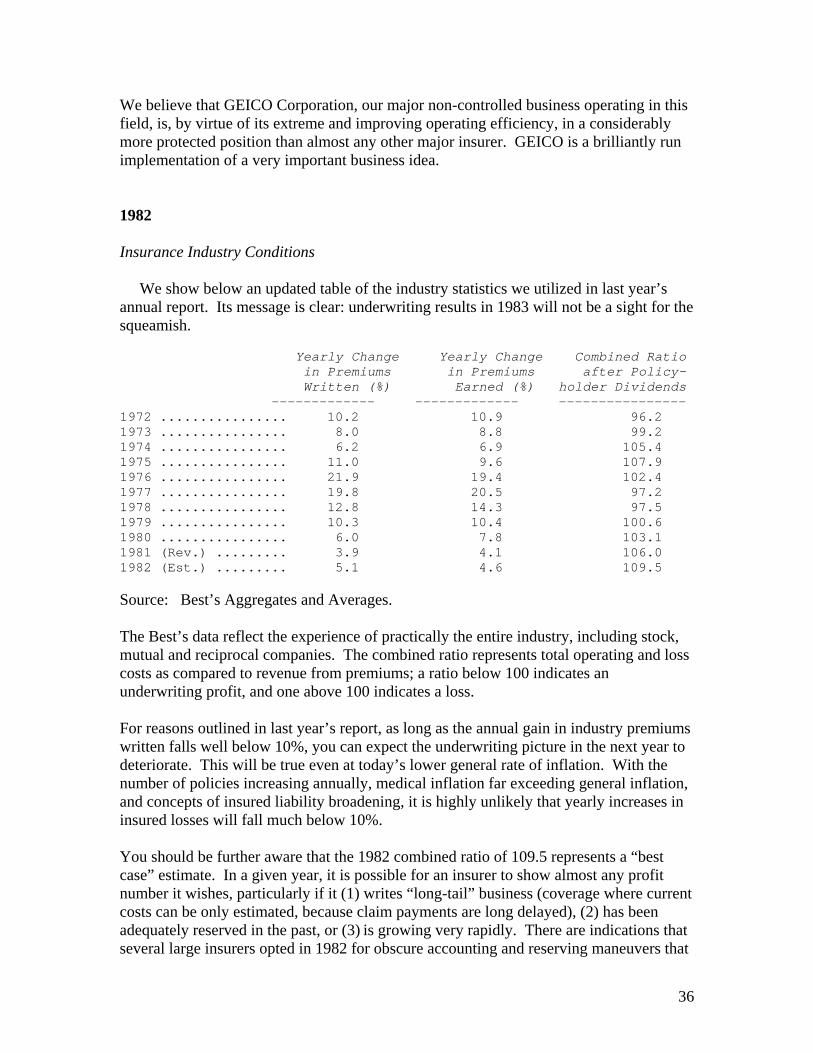
36
We believe that GEICO Corporation, our major non-controlled business operating in this field, is, by virtue of its extreme and improving operating efficiency, in a considerably more protected position than almost any other major insurer. GEICO is a brilliantly run implementation of a very important business idea. 1982 Insurance Industry Conditions We show below an updated table of the industry statistics we utilized in last year’s annual report. Its message is clear: underwriting results in 1983 will not be a sight for the squeamish. Yearly Change Yearly Change Combined Ratio in Premiums in Premiums after Policy- Written (%) Earned (%) holder Dividends ------------- ------------- ---------------- 1972 ................ 10.2 10.9 96.2 1973 ................ 8.0 8.8 99.2 1974 ................ 6.2 6.9 105.4 1975 ................ 11.0 9.6 107.9 1976 ................ 21.9 19.4 102.4 1977 ................ 19.8 20.5 97.2 1978 ................ 12.8 14.3 97.5 1979 ................ 10.3 10.4 100.6 1980 ................ 6.0 7.8 103.1 1981 (Rev.) ......... 3.9 4.1 106.0 1982 (Est.) ......... 5.1 4.6 109.5 Source: Best’s Aggregates and Averages. The Best’s data reflect the experience of practically the entire industry, including stock, mutual and reciprocal companies. The combined ratio represents total operating and loss costs as compared to revenue from premiums; a ratio below 100 indicates an underwriting profit, and one above 100 indicates a loss. For reasons outlined in last year’s report, as long as the annual gain in industry premiums written falls well below 10%, you can expect the underwriting picture in the next year to deteriorate. This will be true even at today’s lower general rate of inflation. With the number of policies increasing annually, medical inflation far exceeding general inflation, and concepts of insured liability broadening, it is highly unlikely that yearly increases in insured losses will fall much below 10%. You should be further aware that the 1982 combined ratio of 109.5 represents a “best case” estimate. In a given year, it is possible for an insurer to show almost any profit number it wishes, particularly if it (1) writes “long-tail” business (coverage where current costs can be only estimated, because claim payments are long delayed), (2) has been adequately reserved in the past, or (3) is growing very rapidly. There are indications that several large insurers opted in 1982 for obscure accounting and reserving maneuvers that
37
masked significant deterioration in their underlying businesses. In insurance, as elsewhere, the reaction of weak managements to weak operations is often weak accounting. (“It’s difficult for an empty sack to stand upright.”) The great majority of managements, however, try to play it straight. But even managements of integrity may subconsciously be less willing in poor profit years to fully recognize adverse loss trends. Industry statistics indicate some deterioration in loss reserving practices during 1982 and the true combined ratio is likely to be modestly worse than indicated by our table. The conventional wisdom is that 1983 or 1984 will see the worst of underwriting experience and then, as in the past, the “cycle” will move, significantly and steadily, toward better results. We disagree because of a pronounced change in the competitive environment, hard to see for many years but now quite visible. To understand the change, we need to look at some major factors that affect levels of corporate profitability generally. Businesses in industries with both substantial over-capacity and a “commodity” product (undifferentiated in any customer-important way by factors such as performance, appearance, service support, etc.) are prime candidates for profit troubles. These may be escaped, true, if prices or costs are administered in some manner and thereby insulated at least partially from normal market forces. This administration can be carried out (a) legally through government intervention (until recently, this category included pricing for truckers and deposit costs for financial institutions), (b) illegally through collusion, or (c) “extra-legally” through OPEC-style foreign cartelization (with tag-along benefits for domestic non-cartel operators). If, however, costs and prices are determined by full-bore competition, there is more than ample capacity, and the buyer cares little about whose product or distribution services he uses, industry economics are almost certain to be unexciting. They may well be disastrous. Hence the constant struggle of every vendor to establish and emphasize special qualities of product or service. This works with candy bars (customers buy by brand name, not by asking for a “two-ounce candy bar”) but doesn’t work with sugar (how often do you hear, “I’ll have a cup of coffee with cream and C & H sugar, please”). In many industries, differentiation simply can’t be made meaningful. A few producers in such industries may consistently do well if they have a cost advantage that is both wide and sustainable. By definition such exceptions are few, and, in many industries, are non-existent. For the great majority of companies selling “commodity” products, a depressing equation of business economics prevails: persistent over-capacity without administered prices (or costs) equals poor profitability. Of course, over-capacity may eventually self-correct, either as capacity shrinks or demand expands. Unfortunately for the participants, such corrections often are long delayed. When they finally occur, the rebound to prosperity frequently produces a
38
pervasive enthusiasm for expansion that, within a few years, again creates over-capacity and a new profitless environment. In other words, nothing fails like success. What finally determines levels of long-term profitability in such industries is the ratio of supply-tight to supply-ample years. Frequently that ratio is dismal. (It seems as if the most recent supply-tight period in our textile business - it occurred some years back - lasted the better part of a morning.) In some industries, however, capacity-tight conditions can last a long time. Sometimes actual growth in demand will outrun forecasted growth for an extended period. In other cases, adding capacity requires very long lead times because complicated manufacturing facilities must be planned and built. But in the insurance business, to return to that subject, capacity can be instantly created by capital plus an underwriter’s willingness to sign his name. (Even capital is less important in a world in which state-sponsored guaranty funds protect many policyholders against insurer insolvency.) Under almost all conditions except that of fear for survival - produced, perhaps, by a stock market debacle or a truly major natural disaster - the insurance industry operates under the competitive sword of substantial overcapacity. Generally, also, despite heroic attempts to do otherwise, the industry sells a relatively undifferentiated commodity-type product. (Many insureds, including the managers of large businesses, do not even know the names of their insurers.) Insurance, therefore, would seem to be a textbook case of an industry usually faced with the deadly combination of excess capacity and a “commodity” product. Why, then, was underwriting, despite the existence of cycles, generally profitable over many decades? (From 1950 through 1970, the industry combined ratio averaged 99.0. allowing all investment income plus 1% of premiums to flow through to profits.) The answer lies primarily in the historic methods of regulation and distribution. For much of this century, a large portion of the industry worked, in effect, within a legal quasi-administered pricing system fostered by insurance regulators. While price competition existed, it was not pervasive among the larger companies. The main competition was for agents, who were courted via various non-price-related strategies. For the giants of the industry, most rates were set through negotiations between industry “bureaus” (or through companies acting in accord with their recommendations) and state regulators. Dignified haggling occurred, but it was between company and regulator rather than between company and customer. When the dust settled, Giant A charged the same price as Giant B - and both companies and agents were prohibited by law from cutting such filed rates. The company-state negotiated prices included specific profit allowances and, when loss data indicated that current prices were unprofitable, both company managements and state regulators expected that they would act together to correct the situation. Thus, most of the pricing actions of the giants of the industry were “gentlemanly”, predictable, and profit-producing. Of prime importance - and in contrast to the way most of the business
39
world operated - insurance companies could legally price their way to profitability even in the face of substantial over-capacity. That day is gone. Although parts of the old structure remain, far more than enough new capacity exists outside of that structure to force all parties, old and new, to respond. The new capacity uses various methods of distribution and is not reluctant to use price as a prime competitive weapon. Indeed, it relishes that use. In the process, customers have learned that insurance is no longer a one-price business. They won’t forget. Future profitability of the industry will be determined by current competitive characteristics, not past ones. Many managers have been slow to recognize this. It’s not only generals that prefer to fight the last war. Most business and investment analysis also comes from the rear-view mirror. It seems clear to us, however, that only one condition will allow the insurance industry to achieve significantly improved underwriting results. That is the same condition that will allow better results for the aluminum, copper, or corn producer - a major narrowing of the gap between demand and supply. Unfortunately, there can be no surge in demand for insurance policies comparable to one that might produce a market tightness in copper or aluminum. Rather, the supply of available insurance coverage must be curtailed. “Supply”, in this context, is mental rather than physical: plants or companies need not be shut; only the willingness of underwriters to sign their names need be curtailed. This contraction will not happen because of generally poor profit levels. Bad profits produce much hand-wringing and finger-pointing. But they do not lead major sources of insurance capacity to turn their backs on very large chunks of business, thereby sacrificing market share and industry significance. Instead, major capacity withdrawals require a shock factor such as a natural or financial “megadisaster”. One might occur tomorrow - or many years from now. The insurance business - even taking investment income into account - will not be particularly profitable in the meantime. When supply ultimately contracts, large amounts of business will be available for the few with large capital capacity, a willingness to commit it, and an in-place distribution system. We would expect great opportunities for our insurance subsidiaries at such a time. During 1982, our insurance underwriting deteriorated far more than did the industry’s. From a profit position well above average, we, slipped to a performance modestly below average. The biggest swing was in National Indemnity’s traditional coverages. Lines that have been highly profitable for us in the past are now priced at levels that guarantee underwriting losses. In 1983 we expect our insurance group to record an average performance in an industry in which average is very poor.
40
Two of our stars, Milt Thornton at Cypress and Floyd Taylor at Kansas Fire and Casualty, continued their outstanding records of producing an underwriting profit every year since joining us. Both Milt and Floyd simply are incapable of being average. They maintain a passionately proprietary attitude toward their operations and have developed a business culture centered upon unusual cost-consciousness and customer service. It shows on their scorecards. During 1982, parent company responsibility for most of our insurance operations was given to Mike Goldberg. Planning, recruitment, and monitoring all have shown significant improvement since Mike replaced me in this role. GEICO continues to be managed with a zeal for efficiency and value to the customer that virtually guarantees unusual success. Jack Byrne and Bill Snyder are achieving the most elusive of human goals - keeping things simple and remembering what you set out to do. In Lou Simpson, additionally, GEICO has the best investment manager in the property-casualty business. We are happy with every aspect of this operation. GEICO is a magnificent illustration of the high-profit exception we described earlier in discussing commodity industries with over-capacity - a company with a wide and sustainable cost advantage. Our 35% interest in GEICO represents about $250 million of premium volume, an amount considerably greater than all of the direct volume we produce. 1983 See’s Candy Shops The financial results at See’s continue to be exceptional. The business possesses a valuable and solid consumer franchise and a manager equally valuable and solid. In recent years See’s has encountered two important problems, at least one of which is well on its way toward solution. That problem concerns costs, except those for raw materials. We have enjoyed a break on raw material costs in recent years though so, of course, have our competitors. One of these days we will get a nasty surprise in the opposite direction. In effect, raw material costs are largely beyond our control since we will, as a matter of course, buy the finest ingredients that we can, regardless of changes in their price levels. We regard product quality as sacred. But other kinds of costs are more controllable, and it is in this area that we have had problems. On a per-pound basis, our costs (not including those for raw materials) have increased in the last few years at a rate significantly greater than the increase in the general price level. It is vital to our competitive position and profit potential that we reverse this trend. In recent months much better control over costs has been attained and we feel certain that our rate of growth in these costs in 1984 will be below the rate of inflation. This confidence arises out of our long experience with the managerial talents of Chuck
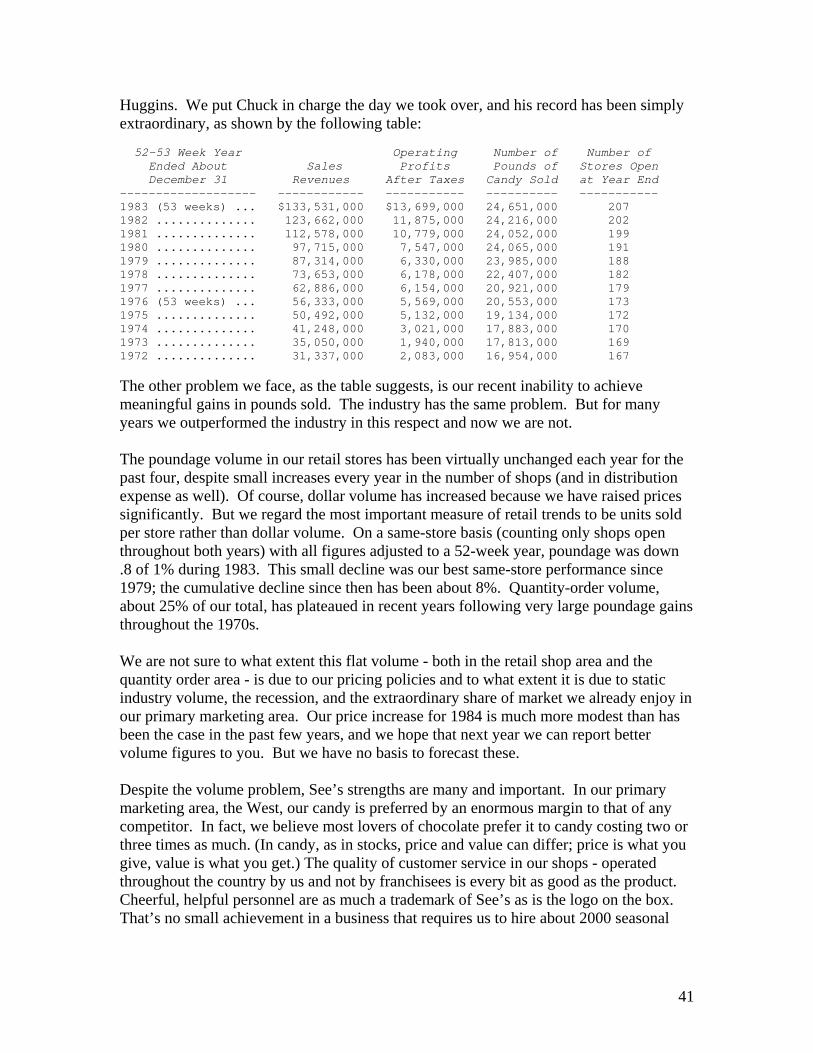
41
Huggins. We put Chuck in charge the day we took over, and his record has been simply extraordinary, as shown by the following table: 52-53 Week Year Operating Number of Number of Ended About Sales Profits Pounds of Stores Open December 31 Revenues After Taxes Candy Sold at Year End ------------------- ------------ ----------- ---------- ----------- 1983 (53 weeks) ... $133,531,000 $13,699,000 24,651,000 207 1982 .............. 123,662,000 11,875,000 24,216,000 202 1981 .............. 112,578,000 10,779,000 24,052,000 199 1980 .............. 97,715,000 7,547,000 24,065,000 191 1979 .............. 87,314,000 6,330,000 23,985,000 188 1978 .............. 73,653,000 6,178,000 22,407,000 182 1977 .............. 62,886,000 6,154,000 20,921,000 179 1976 (53 weeks) ... 56,333,000 5,569,000 20,553,000 173 1975 .............. 50,492,000 5,132,000 19,134,000 172 1974 .............. 41,248,000 3,021,000 17,883,000 170 1973 .............. 35,050,000 1,940,000 17,813,000 169 1972 .............. 31,337,000 2,083,000 16,954,000 167
The other problem we face, as the table suggests, is our recent inability to achieve meaningful gains in pounds sold. The industry has the same problem. But for many years we outperformed the industry in this respect and now we are not. The poundage volume in our retail stores has been virtually unchanged each year for the past four, despite small increases every year in the number of shops (and in distribution expense as well). Of course, dollar volume has increased because we have raised prices significantly. But we regard the most important measure of retail trends to be units sold per store rather than dollar volume. On a same-store basis (counting only shops open throughout both years) with all figures adjusted to a 52-week year, poundage was down .8 of 1% during 1983. This small decline was our best same-store performance since 1979; the cumulative decline since then has been about 8%. Quantity-order volume, about 25% of our total, has plateaued in recent years following very large poundage gains throughout the 1970s. We are not sure to what extent this flat volume - both in the retail shop area and the quantity order area - is due to our pricing policies and to what extent it is due to static industry volume, the recession, and the extraordinary share of market we already enjoy in our primary marketing area. Our price increase for 1984 is much more modest than has been the case in the past few years, and we hope that next year we can report better volume figures to you. But we have no basis to forecast these. Despite the volume problem, See’s strengths are many and important. In our primary marketing area, the West, our candy is preferred by an enormous margin to that of any competitor. In fact, we believe most lovers of chocolate prefer it to candy costing two or three times as much. (In candy, as in stocks, price and value can differ; price is what you give, value is what you get.) The quality of customer service in our shops - operated throughout the country by us and not by franchisees is every bit as good as the product. Cheerful, helpful personnel are as much a trademark of See’s as is the logo on the box. That’s no small achievement in a business that requires us to hire about 2000 seasonal
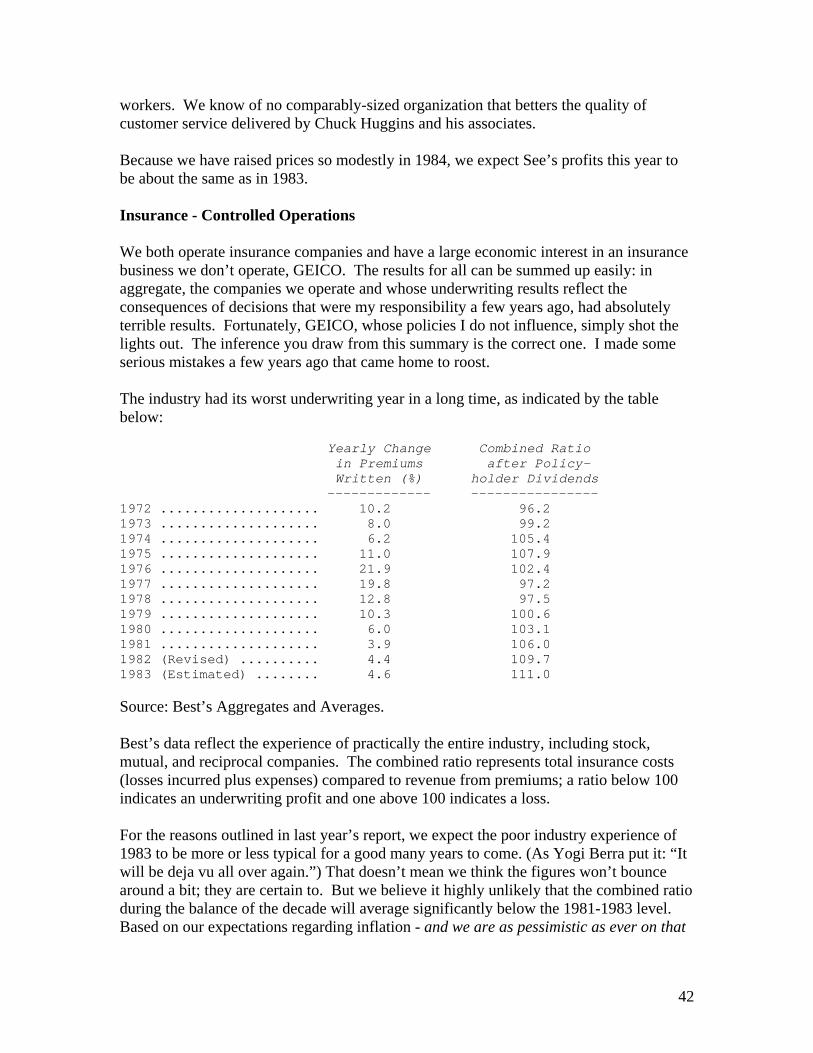
42
workers. We know of no comparably-sized organization that betters the quality of customer service delivered by Chuck Huggins and his associates. Because we have raised prices so modestly in 1984, we expect See’s profits this year to be about the same as in 1983. Insurance - Controlled Operations We both operate insurance companies and have a large economic interest in an insurance business we don’t operate, GEICO. The results for all can be summed up easily: in aggregate, the companies we operate and whose underwriting results reflect the consequences of decisions that were my responsibility a few years ago, had absolutely terrible results. Fortunately, GEICO, whose policies I do not influence, simply shot the lights out. The inference you draw from this summary is the correct one. I made some serious mistakes a few years ago that came home to roost. The industry had its worst underwriting year in a long time, as indicated by the table below: Yearly Change Combined Ratio in Premiums after Policy- Written (%) holder Dividends ------------- ---------------- 1972 .................... 10.2 96.2 1973 .................... 8.0 99.2 1974 .................... 6.2 105.4 1975 .................... 11.0 107.9 1976 .................... 21.9 102.4 1977 .................... 19.8 97.2 1978 .................... 12.8 97.5 1979 .................... 10.3 100.6 1980 .................... 6.0 103.1 1981 .................... 3.9 106.0 1982 (Revised) .......... 4.4 109.7 1983 (Estimated) ........ 4.6 111.0 Source: Best’s Aggregates and Averages. Best’s data reflect the experience of practically the entire industry, including stock, mutual, and reciprocal companies. The combined ratio represents total insurance costs (losses incurred plus expenses) compared to revenue from premiums; a ratio below 100 indicates an underwriting profit and one above 100 indicates a loss. For the reasons outlined in last year’s report, we expect the poor industry experience of 1983 to be more or less typical for a good many years to come. (As Yogi Berra put it: “It will be deja vu all over again.”) That doesn’t mean we think the figures won’t bounce around a bit; they are certain to. But we believe it highly unlikely that the combined ratio during the balance of the decade will average significantly below the 1981-1983 level. Based on our expectations regarding inflation - and we are as pessimistic as ever on that
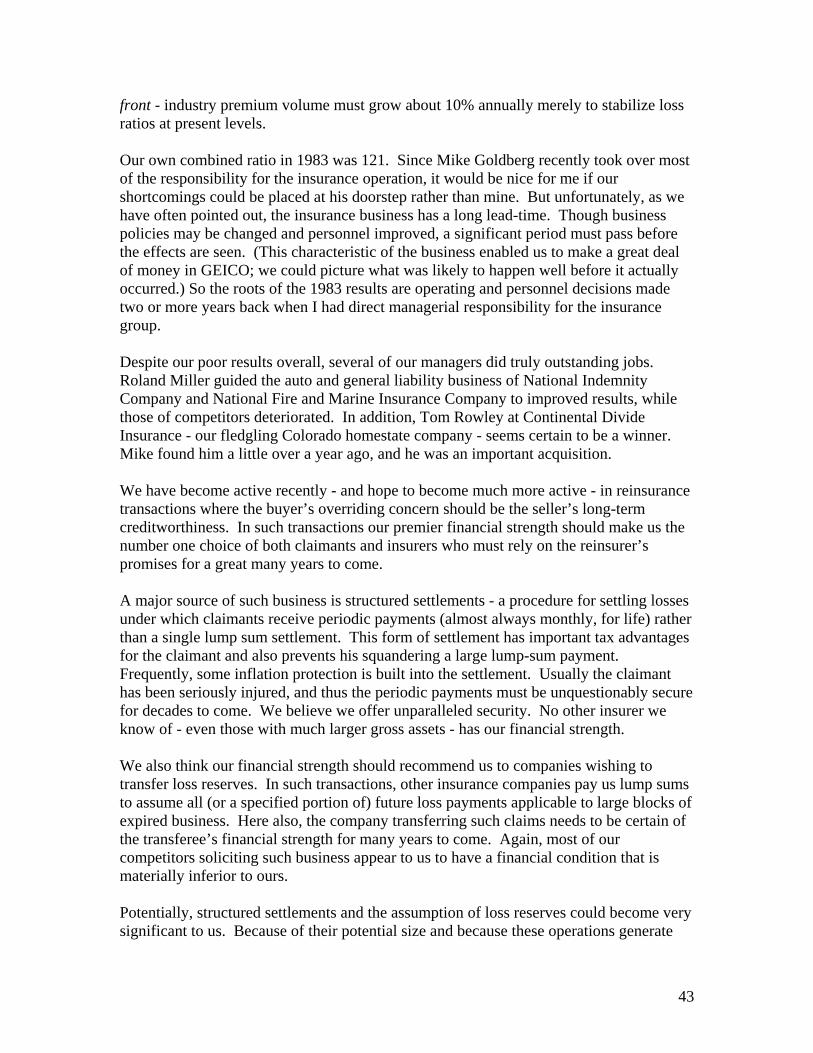
43
front - industry premium volume must grow about 10% annually merely to stabilize loss ratios at present levels. Our own combined ratio in 1983 was 121. Since Mike Goldberg recently took over most of the responsibility for the insurance operation, it would be nice for me if our shortcomings could be placed at his doorstep rather than mine. But unfortunately, as we have often pointed out, the insurance business has a long lead-time. Though business policies may be changed and personnel improved, a significant period must pass before the effects are seen. (This characteristic of the business enabled us to make a great deal of money in GEICO; we could picture what was likely to happen well before it actually occurred.) So the roots of the 1983 results are operating and personnel decisions made two or more years back when I had direct managerial responsibility for the insurance group. Despite our poor results overall, several of our managers did truly outstanding jobs. Roland Miller guided the auto and general liability business of National Indemnity Company and National Fire and Marine Insurance Company to improved results, while those of competitors deteriorated. In addition, Tom Rowley at Continental Divide Insurance - our fledgling Colorado homestate company - seems certain to be a winner. Mike found him a little over a year ago, and he was an important acquisition. We have become active recently - and hope to become much more active - in reinsurance transactions where the buyer’s overriding concern should be the seller’s long-term creditworthiness. In such transactions our premier financial strength should make us the number one choice of both claimants and insurers who must rely on the reinsurer’s promises for a great many years to come. A major source of such business is structured settlements - a procedure for settling losses under which claimants receive periodic payments (almost always monthly, for life) rather than a single lump sum settlement. This form of settlement has important tax advantages for the claimant and also prevents his squandering a large lump-sum payment. Frequently, some inflation protection is built into the settlement. Usually the claimant has been seriously injured, and thus the periodic payments must be unquestionably secure for decades to come. We believe we offer unparalleled security. No other insurer we know of - even those with much larger gross assets - has our financial strength. We also think our financial strength should recommend us to companies wishing to transfer loss reserves. In such transactions, other insurance companies pay us lump sums to assume all (or a specified portion of) future loss payments applicable to large blocks of expired business. Here also, the company transferring such claims needs to be certain of the transferee’s financial strength for many years to come. Again, most of our competitors soliciting such business appear to us to have a financial condition that is materially inferior to ours. Potentially, structured settlements and the assumption of loss reserves could become very significant to us. Because of their potential size and because these operations generate
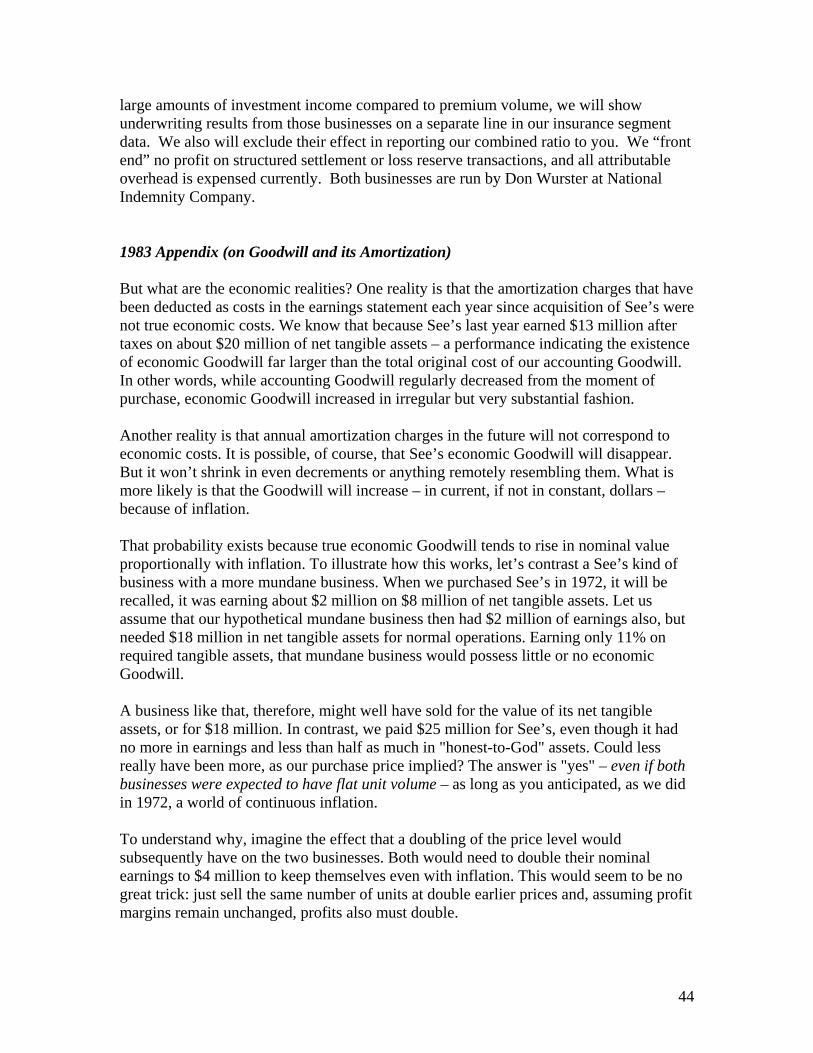
44
large amounts of investment income compared to premium volume, we will show underwriting results from those businesses on a separate line in our insurance segment data. We also will exclude their effect in reporting our combined ratio to you. We “front end” no profit on structured settlement or loss reserve transactions, and all attributable overhead is expensed currently. Both businesses are run by Don Wurster at National Indemnity Company. 1983 Appendix (on Goodwill and its Amortization) But what are the economic realities? One reality is that the amortization charges that have been deducted as costs in the earnings statement each year since acquisition of See’s were not true economic costs. We know that because See’s last year earned $13 million after taxes on about $20 million of net tangible assets – a performance indicating the existence of economic Goodwill far larger than the total original cost of our accounting Goodwill. In other words, while accounting Goodwill regularly decreased from the moment of purchase, economic Goodwill increased in irregular but very substantial fashion. Another reality is that annual amortization charges in the future will not correspond to economic costs. It is possible, of course, that See’s economic Goodwill will disappear. But it won’t shrink in even decrements or anything remotely resembling them. What is more likely is that the Goodwill will increase – in current, if not in constant, dollars – because of inflation. That probability exists because true economic Goodwill tends to rise in nominal value proportionally with inflation. To illustrate how this works, let’s contrast a See’s kind of business with a more mundane business. When we purchased See’s in 1972, it will be recalled, it was earning about $2 million on $8 million of net tangible assets. Let us assume that our hypothetical mundane business then had $2 million of earnings also, but needed $18 million in net tangible assets for normal operations. Earning only 11% on required tangible assets, that mundane business would possess little or no economic Goodwill. A business like that, therefore, might well have sold for the value of its net tangible assets, or for $18 million. In contrast, we paid $25 million for See’s, even though it had no more in earnings and less than half as much in "honest-to-God" assets. Could less really have been more, as our purchase price implied? The answer is "yes" – even if both businesses were expected to have flat unit volume – as long as you anticipated, as we did in 1972, a world of continuous inflation. To understand why, imagine the effect that a doubling of the price level would subsequently have on the two businesses. Both would need to double their nominal earnings to $4 million to keep themselves even with inflation. This would seem to be no great trick: just sell the same number of units at double earlier prices and, assuming profit margins remain unchanged, profits also must double.
45
But, crucially, to bring that about, both businesses probably would have to double their nominal investment in net tangible assets, since that is the kind of economic requirement that inflation usually imposes on businesses, both good and bad. A doubling of dollar sales means correspondingly more dollars must be employed immediately in receivables and inventories. Dollars employed in fixed assets will respond more slowly to inflation, but probably just as surely. And all of this inflation-required investment will produce no improvement in rate of return. The motivation for this investment is the survival of the business, not the prosperity of the owner. Remember, however, that See’s had net tangible assets of only $8 million. So it would only have had to commit an additional $8 million to finance the capital needs imposed by inflation. The mundane business, meanwhile, had a burden over twice as large – a need for $18 million of additional capital. After the dust had settled, the mundane business, now earning $4 million annually, might still be worth the value of its tangible assets, or $36 million. That means its owners would have gained only a dollar of nominal value for every new dollar invested. (This is the same dollar-for-dollar result they would have achieved if they had added money to a savings account.) See’s, however, also earning $4 million, might be worth $50 million if valued (as it logically would be) on the same basis as it was at the time of our purchase. So it would have gained $25 million in nominal value while the owners were putting up only $8 million in additional capital – over $3 of nominal value gained for each $1 invested. Remember, even so, that the owners of the See’s kind of business were forced by inflation to ante up $8 million in additional capital just to stay even in real profits. Any unleveraged business that requires some net tangible assets to operate (and almost all do) is hurt by inflation. Businesses needing little in the way of tangible assets simply are hurt the least. And that fact, of course, has been hard for many people to grasp. For years the traditional wisdom – long on tradition, short on wisdom – held that inflation protection was best provided by businesses laden with natural resources, plants and machinery, or other tangible assets ("In Goods We Trust"). It doesn’t work that way. Asset-heavy businesses generally earn low rates of return – rates that often barely provide enough capital to fund the inflationary needs of the existing business, with nothing left over for real growth, for distribution to owners, or for acquisition of new businesses. In contrast, a disproportionate number of the great business fortunes built up during the inflationary years arose from ownership of operations that combined intangibles of lasting value with relatively minor requirements for tangible assets. In such cases earnings have bounded upward in nominal dollars, and these dollars have been largely available for the acquisition of additional businesses. This phenomenon has been particularly evident in the communications business. That business has required little in
46
the way of tangible investment – yet its franchises have endured. During inflation, Goodwill is the gift that keeps giving. But that statement applies, naturally, only to true economic Goodwill. Spurious accounting Goodwill – and there is plenty of it around – is another matter. When an overexcited management purchases a business at a silly price, the same accounting niceties described earlier are observed. Because it can’t go anywhere else, the silliness ends up in the Goodwill account. Considering the lack of managerial discipline that created the account, under such circumstances it might better be labeled "No-Will". Whatever the term, the 40-year ritual typically is observed and the adrenalin so capitalized remains on the books as an "asset" just as if the acquisition had been a sensible one. 1984 [on See’s] In 1985 we will intensify our efforts to keep per-pound cost increases below the rate of inflation. Continued success in these efforts, however, will require gains in same-store poundage. Prices in 1985 should average 6% - 7% above those of 1984. Assuming no change in same-store volume, profits should show a moderate gain. ………. [insurance business] For a number of years, we have told you that an annual increase by the industry of about 10% per year in premiums written is necessary for the combined ratio to remain roughly unchanged. We assumed in making that assertion that expenses as a percentage of premium volume would stay relatively stable and that losses would grow at about 10% annually because of the combined influence of unit volume increases, inflation, and judicial rulings that expand what is covered by the insurance policy. Our opinion is proving dismayingly accurate: a premium increase of 10% per year since 1979 would have produced an aggregate increase through 1984 of 61% and a combined ratio in 1984 almost identical to the 100.6 of 1979. Instead, the industry had only a 30% increase in premiums and a 1984 combined ratio of 117.7. Today, we continue to believe that the key index to the trend of underwriting profitability is the year-to-year percentage change in industry premium volume. It now appears that premium volume in 1985 will grow well over 10%. Therefore, assuming that catastrophes are at a “normal” level, we would expect the combined ratio to begin easing downward toward the end of the year. However, under our industrywide loss assumptions (i.e., increases of 10% annually), five years of 15%-per-year increases in premiums would be required to get the combined ratio back to 100. This would mean a doubling of industry volume by 1989, an outcome that seems highly unlikely to us. Instead, we expect several years of premium gains somewhat above the 10% level,
47
followed by highly-competitive pricing that generally will produce combined ratios in the 108-113 range. ………. We extend this business-valuation approach even to bond purchases such as WPPSS. We compare the $139 million cost of our yearend investment in WPPSS to a similar $139 million investment in an operating business. In the case of WPPSS, the “business” contractually earns $22.7 million after tax (via the interest paid on the bonds), and those earnings are available to us currently in cash. We are unable to buy operating businesses with economics close to these. Only a relatively few businesses earn the 16.3% after tax on unleveraged capital that our WPPSS investment does and those businesses, when available for purchase, sell at large premiums to that capital. In the average negotiated business transaction, unleveraged corporate earnings of $22.7 million after-tax (equivalent to about $45 million pre-tax) might command a price of $250 - $300 million (or sometimes far more). For a business we understand well and strongly like, we will gladly pay that much. But it is double the price we paid to realize the same earnings from WPPSS bonds. However, in the case of WPPSS, there is what we view to be a very slight risk that the “business” could be worth nothing within a year or two. There also is the risk that interest payments might be interrupted for a considerable period of time. Furthermore, the most that the “business” could be worth is about the $205 million face value of the bonds that we own, an amount only 48% higher than the price we paid. This ceiling on upside potential is an important minus. It should be realized, however, that the great majority of operating businesses have a limited upside potential also unless more capital is continuously invested in them. That is so because most businesses are unable to significantly improve their average returns on equity - even under inflationary conditions, though these were once thought to automatically raise returns. (Let’s push our bond-as-a-business example one notch further: if you elect to “retain” the annual earnings of a 12% bond by using the proceeds from coupons to buy more bonds, earnings of that bond “business” will grow at a rate comparable to that of most operating businesses that similarly reinvest all earnings. In the first instance, a 30-year, zero-coupon, 12% bond purchased today for $10 million will be worth $300 million in 2015. In the second, a $10 million business that regularly earns 12% on equity and retains all earnings to grow, will also end up with $300 million of capital in 2015. Both the business and the bond will earn over $32 million in the final year.) Our approach to bond investment - treating it as an unusual sort of “business” with special advantages and disadvantages - may strike you as a bit quirky. However, we believe that many staggering errors by investors could have been avoided if they had viewed bond investment with a businessman’s perspective. For example, in 1946, 20-year AAA tax-exempt bonds traded at slightly below a 1% yield. In effect, the buyer of those bonds at that time bought a “business” that earned about 1% on “book value” (and
48
that, moreover, could never earn a dime more than 1% on book), and paid 100 cents on the dollar for that abominable business. If an investor had been business-minded enough to think in those terms - and that was the precise reality of the bargain struck - he would have laughed at the proposition and walked away. For, at the same time, businesses with excellent future prospects could have been bought at, or close to, book value while earning 10%, 12%, or 15% after tax on book. Probably no business in America changed hands in 1946 at book value that the buyer believed lacked the ability to earn more than 1% on book. But investors with bond-buying habits eagerly made economic commitments throughout the year on just that basis. Similar, although less extreme, conditions prevailed for the next two decades as bond investors happily signed up for twenty or thirty years on terms outrageously inadequate by business standards. (In what I think is by far the best book on investing ever written - “The Intelligent Investor”, by Ben Graham - the last section of the last chapter begins with, “Investment is most intelligent when it is most businesslike.” This section is called “A Final Word”, and it is appropriately titled.) We will emphasize again that there is unquestionably some risk in the WPPSS commitment. It is also the sort of risk that is difficult to evaluate. Were Charlie and I to deal with 50 similar evaluations over a lifetime, we would expect our judgment to prove reasonably satisfactory. But we do not get the chance to make 50 or even 5 such decisions in a single year. Even though our long-term results may turn out fine, in any given year we run a risk that we will look extraordinarily foolish. (That’s why all of these sentences say “Charlie and I”, or “we”.) Most managers have very little incentive to make the intelligent-but-with-some-chance-of-looking-like-an-idiot decision. Their personal gain/loss ratio is all too obvious: if an unconventional decision works out well, they get a pat on the back and, if it works out poorly, they get a pink slip. (Failing conventionally is the route to go; as a group, lemmings may have a rotten image, but no individual lemming has ever received bad press.) Our equation is different. With 47% of Berkshire’s stock, Charlie and I don’t worry about being fired, and we receive our rewards as owners, not managers. Thus we behave with Berkshire’s money as we would with our own. That frequently leads us to unconventional behavior both in investments and general business management. We remain unconventional in the degree to which we concentrate the investments of our insurance companies, including those in WPPSS bonds. This concentration makes sense only because our insurance business is conducted from a position of exceptional financial strength. For almost all other insurers, a comparable degree of concentration (or anything close to it) would be totally inappropriate. Their capital positions are not strong enough to withstand a big error, no matter how attractive an investment opportunity might appear when analyzed on the basis of probabilities.
49
With our financial strength we can own large blocks of a few securities that we have thought hard about and bought at attractive prices. (Billy Rose described the problem of over-diversification: “If you have a harem of forty women, you never get to know any of them very well.”) Over time our policy of concentration should produce superior results, though these will be tempered by our large size. When this policy produces a really bad year, as it must, at least you will know that our money was committed on the same basis as yours. We made the major part of our WPPSS investment at different prices and under somewhat different factual circumstances than exist at present. If we decide to change our position, we will not inform shareholders until long after the change has been completed. (We may be buying or selling as you read this.) The buying and selling of securities is a competitive business, and even a modest amount of added competition on either side can cost us a great deal of money. Our WPPSS purchases illustrate this principle. From October, 1983 through June, 1984, we attempted to buy almost all the bonds that we could of Projects 1, 2, and 3. Yet we purchased less than 3% of the bonds outstanding. Had we faced even a few additional well-heeled investors, stimulated to buy because they knew we were, we could have ended up with a materially smaller amount of bonds, purchased at a materially higher price. (A couple of coat-tail riders easily could have cost us $5 million.) For this reason, we will not comment about our activities in securities - neither to the press, nor shareholders, nor to anyone else - unless legally required to do so. One final observation regarding our WPPSS purchases: we dislike the purchase of most long-term bonds under most circumstances and have bought very few in recent years. That’s because bonds are as sound as a dollar - and we view the long-term outlook for dollars as dismal. We believe substantial inflation lies ahead, although we have no idea what the average rate will turn out to be. Furthermore, we think there is a small, but not insignificant, chance of runaway inflation. Such a possibility may seem absurd, considering the rate to which inflation has dropped. But we believe that present fiscal policy - featuring a huge deficit - is both extremely dangerous and difficult to reverse. (So far, most politicians in both parties have followed Charlie Brown’s advice: “No problem is so big that it can’t be run away from.”) Without a reversal, high rates of inflation may be delayed (perhaps for a long time), but will not be avoided. If high rates materialize, they bring with them the potential for a runaway upward spiral. While there is not much to choose between bonds and stocks (as a class) when annual inflation is in the 5%-10% range, runaway inflation is a different story. In that circumstance, a diversified stock portfolio would almost surely suffer an enormous loss in real value. But bonds already outstanding would suffer far more. Thus, we think an all-bond portfolio carries a small but unacceptable “wipe out” risk, and we require any purchase of long-term bonds to clear a special hurdle. Only when bond purchases appear decidedly superior to other business opportunities will we engage in them. Those occasions are likely to be few and far between.
50
Dividend Policy Dividend policy is often reported to shareholders, but seldom explained. A company will say something like, “Our goal is to pay out 40% to 50% of earnings and to increase dividends at a rate at least equal to the rise in the CPI”. And that’s it - no analysis will be supplied as to why that particular policy is best for the owners of the business. Yet, allocation of capital is crucial to business and investment management. Because it is, we believe managers and owners should think hard about the circumstances under which earnings should be retained and under which they should be distributed. The first point to understand is that all earnings are not created equal. In many businesses particularly those that have high asset/profit ratios - inflation causes some or all of the reported earnings to become ersatz. The ersatz portion - let’s call these earnings “restricted” - cannot, if the business is to retain its economic position, be distributed as dividends. Were these earnings to be paid out, the business would lose ground in one or more of the following areas: its ability to maintain its unit volume of sales, its long-term competitive position, its financial strength. No matter how conservative its payout ratio, a company that consistently distributes restricted earnings is destined for oblivion unless equity capital is otherwise infused. Restricted earnings are seldom valueless to owners, but they often must be discounted heavily. In effect, they are conscripted by the business, no matter how poor its economic potential. (This retention-no-matter-how-unattractive-the-return situation was communicated unwittingly in a marvelously ironic way by Consolidated Edison a decade ago. At the time, a punitive regulatory policy was a major factor causing the company’s stock to sell as low as one-fourth of book value; i.e., every time a dollar of earnings was retained for reinvestment in the business, that dollar was transformed into only 25 cents of market value. But, despite this gold-into-lead process, most earnings were reinvested in the business rather than paid to owners. Meanwhile, at construction and maintenance sites throughout New York, signs proudly proclaimed the corporate slogan, “Dig We Must”.) Restricted earnings need not concern us further in this dividend discussion. Let’s turn to the much-more-valued unrestricted variety. These earnings may, with equal feasibility, be retained or distributed. In our opinion, management should choose whichever course makes greater sense for the owners of the business. This principle is not universally accepted. For a number of reasons managers like to withhold unrestricted, readily distributable earnings from shareholders - to expand the corporate empire over which the managers rule, to operate from a position of exceptional financial comfort, etc. But we believe there is only one valid reason for retention. Unrestricted earnings should be retained only when there is a reasonable prospect - backed preferably by historical evidence or, when appropriate, by a thoughtful analysis of the future - that for every dollar retained by the corporation, at least one dollar of market
51
value will be created for owners. This will happen only if the capital retained produces incremental earnings equal to, or above, those generally available to investors. To illustrate, let’s assume that an investor owns a risk-free 10% perpetual bond with one very unusual feature. Each year the investor can elect either to take his 10% coupon in cash, or to reinvest the coupon in more 10% bonds with identical terms; i.e., a perpetual life and coupons offering the same cash-or-reinvest option. If, in any given year, the prevailing interest rate on long-term, risk-free bonds is 5%, it would be foolish for the investor to take his coupon in cash since the 10% bonds he could instead choose would be worth considerably more than 100 cents on the dollar. Under these circumstances, the investor wanting to get his hands on cash should take his coupon in additional bonds and then immediately sell them. By doing that, he would realize more cash than if he had taken his coupon directly in cash. Assuming all bonds were held by rational investors, no one would opt for cash in an era of 5% interest rates, not even those bondholders needing cash for living purposes. If, however, interest rates were 15%, no rational investor would want his money invested for him at 10%. Instead, the investor would choose to take his coupon in cash, even if his personal cash needs were nil. The opposite course - reinvestment of the coupon - would give an investor additional bonds with market value far less than the cash he could have elected. If he should want 10% bonds, he can simply take the cash received and buy them in the market, where they will be available at a large discount. An analysis similar to that made by our hypothetical bondholder is appropriate for owners in thinking about whether a company’s unrestricted earnings should be retained or paid out. Of course, the analysis is much more difficult and subject to error because the rate earned on reinvested earnings is not a contractual figure, as in our bond case, but rather a fluctuating figure. Owners must guess as to what the rate will average over the intermediate future. However, once an informed guess is made, the rest of the analysis is simple: you should wish your earnings to be reinvested if they can be expected to earn high returns, and you should wish them paid to you if low returns are the likely outcome of reinvestment. Many corporate managers reason very much along these lines in determining whether subsidiaries should distribute earnings to their parent company. At that level,. the managers have no trouble thinking like intelligent owners. But payout decisions at the parent company level often are a different story. Here managers frequently have trouble putting themselves in the shoes of their shareholder-owners. With this schizoid approach, the CEO of a multi-divisional company will instruct Subsidiary A, whose earnings on incremental capital may be expected to average 5%, to distribute all available earnings in order that they may be invested in Subsidiary B, whose earnings on incremental capital are expected to be 15%. The CEO’s business school oath will allow no lesser behavior. But if his own long-term record with incremental capital is 5% - and market rates are 10% - he is likely to impose a dividend policy on shareholders of the parent company that merely follows some historical or industry-wide payout
52
pattern. Furthermore, he will expect managers of subsidiaries to give him a full account as to why it makes sense for earnings to be retained in their operations rather than distributed to the parent-owner. But seldom will he supply his owners with a similar analysis pertaining to the whole company. In judging whether managers should retain earnings, shareholders should not simply compare total incremental earnings in recent years to total incremental capital because that relationship may be distorted by what is going on in a core business. During an inflationary period, companies with a core business characterized by extraordinary economics can use small amounts of incremental capital in that business at very high rates of return (as was discussed in last year’s section on Goodwill). But, unless they are experiencing tremendous unit growth, outstanding businesses by definition generate large amounts of excess cash. If a company sinks most of this money in other businesses that earn low returns, the company’s overall return on retained capital may nevertheless appear excellent because of the extraordinary returns being earned by the portion of earnings incrementally invested in the core business. The situation is analogous to a Pro-Am golf event: even if all of the amateurs are hopeless duffers, the team’s best-ball score will be respectable because of the dominating skills of the professional. Many corporations that consistently show good returns both on equity and on overall incremental capital have, indeed, employed a large portion of their retained earnings on an economically unattractive, even disastrous, basis. Their marvelous core businesses, however, whose earnings grow year after year, camouflage repeated failures in capital allocation elsewhere (usually involving high-priced acquisitions of businesses that have inherently mediocre economics). The managers at fault periodically report on the lessons they have learned from the latest disappointment. They then usually seek out future lessons. (Failure seems to go to their heads.) In such cases, shareholders would be far better off if earnings were retained only to expand the high-return business, with the balance paid in dividends or used to repurchase stock (an action that increases the owners’ interest in the exceptional business while sparing them participation in subpar businesses). Managers of high-return businesses who consistently employ much of the cash thrown off by those businesses in other ventures with low returns should be held to account for those allocation decisions, regardless of how profitable the overall enterprise is. Nothing in this discussion is intended to argue for dividends that bounce around from quarter to quarter with each wiggle in earnings or in investment opportunities. Shareholders of public corporations understandably prefer that dividends be consistent and predictable. Payments, therefore, should reflect long-term expectations for both earnings and returns on incremental capital. Since the long-term corporate outlook changes only infrequently, dividend patterns should change no more often. But over time distributable earnings that have been withheld by managers should earn their keep. If earnings have been unwisely retained, it is likely that managers, too, have been unwisely retained.
53
Let’s now turn to Berkshire Hathaway and examine how these dividend principles apply to it. Historically, Berkshire has earned well over market rates on retained earnings, thereby creating over one dollar of market value for every dollar retained. Under such circumstances, any distribution would have been contrary to the financial interest of shareholders, large or small. In fact, significant distributions in the early years might have been disastrous, as a review of our starting position will show you. Charlie and I then controlled and managed three companies, Berkshire Hathaway Inc., Diversified Retailing Company, Inc., and Blue Chip Stamps (all now merged into our present operation). Blue Chip paid only a small dividend, Berkshire and DRC paid nothing. If, instead, the companies had paid out their entire earnings, we almost certainly would have no earnings at all now - and perhaps no capital as well. The three companies each originally made their money from a single business: (1) textiles at Berkshire; (2) department stores at Diversified; and (3) trading stamps at Blue Chip. These cornerstone businesses (carefully chosen, it should be noted, by your Chairman and Vice Chairman) have, respectively, (1) survived but earned almost nothing, (2) shriveled in size while incurring large losses, and (3) shrunk in sales volume to about 5% its size at the time of our entry. (Who says “you can’t lose ‘em all”?) Only by committing available funds to much better businesses were we able to overcome these origins. (It’s been like overcoming a misspent youth.) Clearly, diversification has served us well. We expect to continue to diversify while also supporting the growth of current operations though, as we’ve pointed out, our returns from these efforts will surely be below our historical returns. But as long as prospective returns are above the rate required to produce a dollar of market value per dollar retained, we will continue to retain all earnings. Should our estimate of future returns fall below that point, we will distribute all unrestricted earnings that we believe can not be effectively used. In making that judgment, we will look at both our historical record and our prospects. Because our year-to-year results are inherently volatile, we believe a five-year rolling average to be appropriate for judging the historical record. Our present plan is to use our retained earnings to further build the capital of our insurance companies. Most of our competitors are in weakened financial condition and reluctant to expand substantially. Yet large premium-volume gains for the industry are imminent, amounting probably to well over $15 billion in 1985 versus less than $5 billion in 1983. These circumstances could produce major amounts of profitable business for us. Of course, this result is no sure thing, but prospects for it are far better than they have been for many years. 1985 Three Very Good Businesses (and a Few Thoughts About Incentive Compensation)
54
When I was 12, I lived with my grandfather for about four months. A grocer by trade, he was also working on a book and each night he dictated a few pages to me. The title - brace yourself - was “How to Run a Grocery Store and a Few Things I Have Learned About Fishing”. My grandfather was sure that interest in these two subjects was universal and that the world awaited his views. You may conclude from this section’s title and contents that I was overexposed to Grandpa’s literary style (and personality). I am merging the discussion of Nebraska Furniture Mart, See’s Candy Shops, and Buffalo Evening News here because the economic strengths, weaknesses, and prospects of these businesses have changed little since I reported to you a year ago. The shortness of this discussion, however, is in no way meant to minimize the importance of these businesses to us: in 1985 they earned an aggregate of $72 million pre-tax. Fifteen years ago, before we had acquired any of them, their aggregate earnings were about $8 million pre-tax. While an increase in earnings from $8 million to $72 million sounds terrific - and usually is - you should not automatically assume that to be the case. You must first make sure that earnings were not severely depressed in the base year. If they were instead substantial in relation to capital employed, an even more important point must be examined: how much additional capital was required to produce the additional earnings? In both respects, our group of three scores well. First, earnings 15 years ago were excellent compared to capital then employed in the businesses. Second, although annual earnings are now $64 million greater, the businesses require only about $40 million more in invested capital to operate than was the case then. The dramatic growth in earning power of these three businesses, accompanied by their need for only minor amounts of capital, illustrates very well the power of economic goodwill during an inflationary period (a phenomenon explained in detail in the 1983 annual report). The financial characteristics of these businesses have allowed us to use a very large portion of the earnings they generate elsewhere. Corporate America, however, has had a different experience: in order to increase earnings significantly, most companies have needed to increase capital significantly also. The average American business has required about $5 of additional capital to generate an additional $1 of annual pre-tax earnings. That business, therefore, would have required over $300 million in additional capital from its owners in order to achieve an earnings performance equal to our group of three. When returns on capital are ordinary, an earn-more-by-putting-up-more record is no great managerial achievement. You can get the same result personally while operating from your rocking chair. just quadruple the capital you commit to a savings account and you will quadruple your earnings. You would hardly expect hosannas for that particular accomplishment. Yet, retirement announcements regularly sing the praises of CEOs who have, say, quadrupled earnings of their widget company during their reign - with no one examining whether this gain was attributable simply to many years of retained earnings and the workings of compound interest.
55
If the widget company consistently earned a superior return on capital throughout the period, or if capital employed only doubled during the CEO’s reign, the praise for him may be well deserved. But if return on capital was lackluster and capital employed increased in pace with earnings, applause should be withheld. A savings account in which interest was reinvested would achieve the same year-by-year increase in earnings - and, at only 8% interest, would quadruple its annual earnings in 18 years. The power of this simple math is often ignored by companies to the detriment of their shareholders. Many corporate compensation plans reward managers handsomely for earnings increases produced solely, or in large part, by retained earnings - i.e., earnings withheld from owners. For example, ten-year, fixed-price stock options are granted routinely, often by companies whose dividends are only a small percentage of earnings. An example will illustrate the inequities possible under such circumstances. Let’s suppose that you had a $100,000 savings account earning 8% interest and “managed” by a trustee who could decide each year what portion of the interest you were to be paid in cash. Interest not paid out would be “retained earnings” added to the savings account to compound. And let’s suppose that your trustee, in his superior wisdom, set the “pay-out ratio” at one-quarter of the annual earnings. Under these assumptions, your account would be worth $179,084 at the end of ten years. Additionally, your annual earnings would have increased about 70% from $8,000 to $13,515 under this inspired management. And, finally, your “dividends” would have increased commensurately, rising regularly from $2,000 in the first year to $3,378 in the tenth year. Each year, when your manager’s public relations firm prepared his annual report to you, all of the charts would have had lines marching skyward. Now, just for fun, let’s push our scenario one notch further and give your trustee-manager a ten-year fixed-price option on part of your “business” (i.e., your savings account) based on its fair value in the first year. With such an option, your manager would reap a substantial profit at your expense - just from having held on to most of your earnings. If he were both Machiavellian and a bit of a mathematician, your manager might also have cut the pay-out ratio once he was firmly entrenched. This scenario is not as farfetched as you might think. Many stock options in the corporate world have worked in exactly that fashion: they have gained in value simply because management retained earnings, not because it did well with the capital in its hands. Managers actually apply a double standard to options. Leaving aside warrants (which deliver the issuing corporation immediate and substantial compensation), I believe it is fair to say that nowhere in the business world are ten-year fixed-price options on all or a portion of a business granted to outsiders. Ten months, in fact, would be regarded as extreme. It would be particularly unthinkable for managers to grant a long-term option
56
on a business that was regularly adding to its capital. Any outsider wanting to secure such an option would be required to pay fully for capital added during the option period. The unwillingness of managers to do-unto-outsiders, however, is not matched by an unwillingness to do-unto-themselves. (Negotiating with one’s self seldom produces a barroom brawl.) Managers regularly engineer ten-year, fixed-price options for themselves and associates that, first, totally ignore the fact that retained earnings automatically build value and, second, ignore the carrying cost of capital. As a result, these managers end up profiting much as they would have had they had an option on that savings account that was automatically building up in value. Of course, stock options often go to talented, value-adding managers and sometimes deliver them rewards that are perfectly appropriate. (Indeed, managers who are really exceptional almost always get far less than they should.) But when the result is equitable, it is accidental. Once granted, the option is blind to individual performance. Because it is irrevocable and unconditional (so long as a manager stays in the company), the sluggard receives rewards from his options precisely as does the star. A managerial Rip Van Winkle, ready to doze for ten years, could not wish for a better “incentive” system. (I can’t resist commenting on one long-term option given an “outsider”: that granted the U.S. Government on Chrysler shares as partial consideration for the government’s guarantee of some lifesaving loans. When these options worked out well for the government, Chrysler sought to modify the payoff, arguing that the rewards to the government were both far greater than intended and outsize in relation to its contribution to Chrysler’s recovery. The company’s anguish over what it saw as an imbalance between payoff and performance made national news. That anguish may well be unique: to my knowledge, no managers - anywhere - have been similarly offended by unwarranted payoffs arising from options granted to themselves or their colleagues.) Ironically, the rhetoric about options frequently describes them as desirable because they put managers and owners in the same financial boat. In reality, the boats are far different. No owner has ever escaped the burden of capital costs, whereas a holder of a fixed-price option bears no capital costs at all. An owner must weigh upside potential against downside risk; an option holder has no downside. In fact, the business project in which you would wish to have an option frequently is a project in which you would reject ownership. (I’ll be happy to accept a lottery ticket as a gift - but I’ll never buy one.) In dividend policy also, the option holders’ interests are best served by a policy that may ill serve the owner. Think back to the savings account example. The trustee, holding his option, would benefit from a no-dividend policy. Conversely, the owner of the account should lean to a total payout so that he can prevent the option-holding manager from sharing in the account’s retained earnings. Despite their shortcomings, options can be appropriate under some circumstances. My criticism relates to their indiscriminate use and, in that connection, I would like to emphasize three points:
57
First, stock options are inevitably tied to the overall performance of a corporation. Logically, therefore, they should be awarded only to those managers with overall responsibility. Managers with limited areas of responsibility should have incentives that pay off in relation to results under their control. The .350 hitter expects, and also deserves, a big payoff for his performance - even if he plays for a cellar-dwelling team. And the .150 hitter should get no reward - even if he plays for a pennant winner. Only those with overall responsibility for the team should have their rewards tied to its results. Second, options should be structured carefully. Absent special factors, they should have built into them a retained-earnings or carrying-cost factor. Equally important, they should be priced realistically. When managers are faced with offers for their companies, they unfailingly point out how unrealistic market prices can be as an index of real value. But why, then, should these same depressed prices be the valuations at which managers sell portions of their businesses to themselves? (They may go further: officers and directors sometimes consult the Tax Code to determine the lowest prices at which they can, in effect, sell part of the business to insiders. While they’re at it, they often elect plans that produce the worst tax result for the company.) Except in highly unusual cases, owners are not well served by the sale of part of their business at a bargain price - whether the sale is to outsiders or to insiders. The obvious conclusion: options should be priced at true business value. Third, I want to emphasize that some managers whom I admire enormously - and whose operating records are far better than mine - disagree with me regarding fixed-price options. They have built corporate cultures that work, and fixed-price options have been a tool that helped them. By their leadership and example, and by the use of options as incentives, these managers have taught their colleagues to think like owners. Such a Culture is rare and when it exists should perhaps be left intact - despite inefficiencies and inequities that may infest the option program. “If it ain’t broke, don’t fix it” is preferable to “purity at any price”. At Berkshire, however, we use an incentive@compensation system that rewards key managers for meeting targets in their own bailiwicks. If See’s does well, that does not produce incentive compensation at the News - nor vice versa. Neither do we look at the price of Berkshire stock when we write bonus checks. We believe good unit performance should be rewarded whether Berkshire stock rises, falls, or stays even. Similarly, we think average performance should earn no special rewards even if our stock should soar. “Performance”, furthermore, is defined in different ways depending upon the underlying economics of the business: in some our managers enjoy tailwinds not of their own making, in others they fight unavoidable headwinds. The rewards that go with this system can be large. At our various business units, top managers sometimes receive incentive bonuses of five times their base salary, or more, and it would appear possible that one manager’s bonus could top $2 million in 1986. (I hope so.) We do not put a cap on bonuses, and the potential for rewards is not hierarchical. The manager of a relatively small unit can earn far more than the manager
58
of a larger unit if results indicate he should. We believe, further, that such factors as seniority and age should not affect incentive compensation (though they sometimes influence basic compensation). A 20-year-old who can hit .300 is as valuable to us as a 40-year-old performing as well. Obviously, all Berkshire managers can use their bonus money (or other funds, including borrowed money) to buy our stock in the market. Many have done just that - and some now have large holdings. By accepting both the risks and the carrying costs that go with outright purchases, these managers truly walk in the shoes of owners. Now let’s get back - at long last - to our three businesses: At Nebraska Furniture Mart our basic strength is an exceptionally low-cost operation that allows the business to regularly offer customers the best values available in home furnishings. NFM is the largest store of its kind in the country. Although the already-depressed farm economy worsened considerably in 1985, the store easily set a new sales record. I also am happy to report that NFM’s Chairman, Rose Blumkin (the legendary “Mrs. B”), continues at age 92 to set a pace at the store that none of us can keep up with. She’s there wheeling and dealing seven days a week, and I hope that any of you who visit Omaha will go out to the Mart and see her in action. It will inspire you, as it does me. At See’s we continue to get store volumes that are far beyond those achieved by any competitor we know of. Despite the unmatched consumer acceptance we enjoy, industry trends are not good, and we continue to experience slippage in poundage sales on a same-store basis. This puts pressure on per-pound costs. We now are willing to increase prices only modestly and, unless we can stabilize per-shop poundage, profit margins will narrow. At the News volume gains are also difficult to achieve. Though linage increased during 1985, the gain was more than accounted for by preprints. ROP linage (advertising printed on our own pages) declined. Preprints are far less profitable than ROP ads, and also more vulnerable to competition. In 1985, the News again controlled costs well and our household penetration continues to be exceptional. One problem these three operations do not have is management. At See’s we have Chuck Huggins, the man we put in charge the day we bought the business. Selecting him remains one of our best business decisions. At the News we have Stan Lipsey, a manager of equal caliber. Stan has been with us 17 years, and his unusual business talents have become more evident with every additional level of responsibility he has tackled. And, at the Mart, we have the amazing Blumkins - Mrs. B, Louie, Ron, Irv, and Steve - a three-generation miracle of management. I consider myself extraordinarily lucky to be able to work with managers such as these. I like them personally as much as I admire them professionally. Insurance Operations
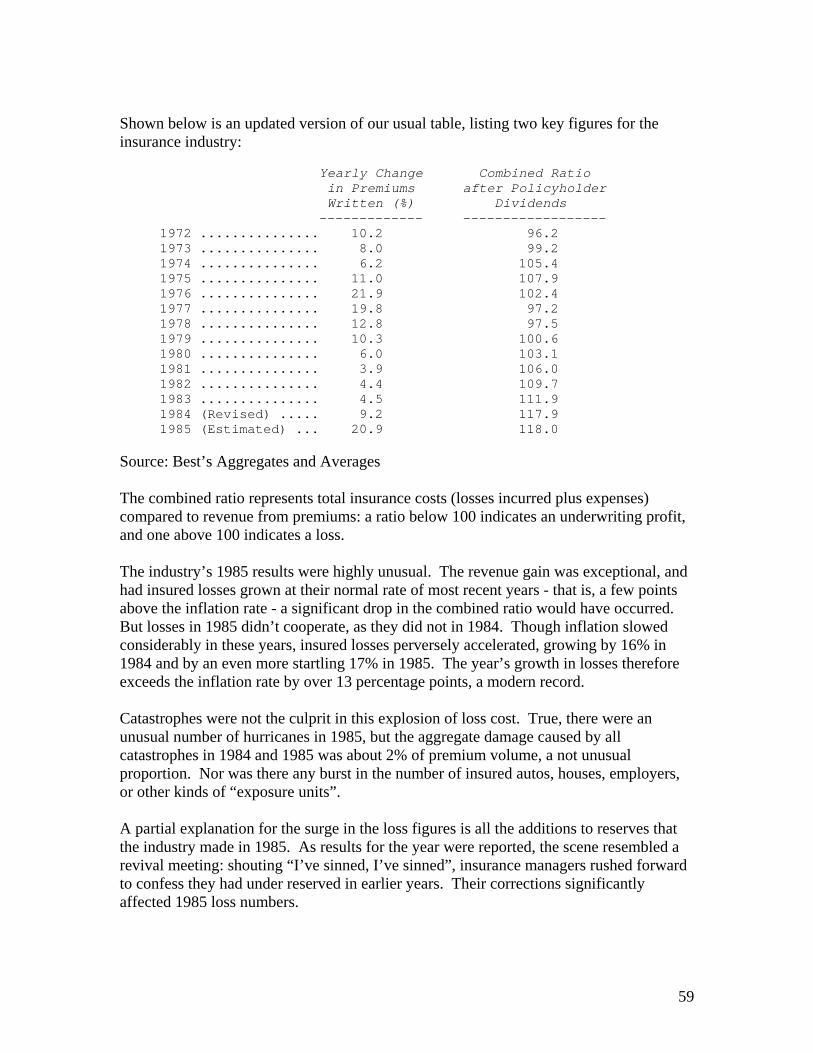
59
Shown below is an updated version of our usual table, listing two key figures for the insurance industry: Yearly Change Combined Ratio in Premiums after Policyholder Written (%) Dividends ------------- ------------------ 1972 ............... 10.2 96.2 1973 ............... 8.0 99.2 1974 ............... 6.2 105.4 1975 ............... 11.0 107.9 1976 ............... 21.9 102.4 1977 ............... 19.8 97.2 1978 ............... 12.8 97.5 1979 ............... 10.3 100.6 1980 ............... 6.0 103.1 1981 ............... 3.9 106.0 1982 ............... 4.4 109.7 1983 ............... 4.5 111.9 1984 (Revised) ..... 9.2 117.9 1985 (Estimated) ... 20.9 118.0 Source: Best’s Aggregates and Averages The combined ratio represents total insurance costs (losses incurred plus expenses) compared to revenue from premiums: a ratio below 100 indicates an underwriting profit, and one above 100 indicates a loss. The industry’s 1985 results were highly unusual. The revenue gain was exceptional, and had insured losses grown at their normal rate of most recent years - that is, a few points above the inflation rate - a significant drop in the combined ratio would have occurred. But losses in 1985 didn’t cooperate, as they did not in 1984. Though inflation slowed considerably in these years, insured losses perversely accelerated, growing by 16% in 1984 and by an even more startling 17% in 1985. The year’s growth in losses therefore exceeds the inflation rate by over 13 percentage points, a modern record. Catastrophes were not the culprit in this explosion of loss cost. True, there were an unusual number of hurricanes in 1985, but the aggregate damage caused by all catastrophes in 1984 and 1985 was about 2% of premium volume, a not unusual proportion. Nor was there any burst in the number of insured autos, houses, employers, or other kinds of “exposure units”. A partial explanation for the surge in the loss figures is all the additions to reserves that the industry made in 1985. As results for the year were reported, the scene resembled a revival meeting: shouting “I’ve sinned, I’ve sinned”, insurance managers rushed forward to confess they had under reserved in earlier years. Their corrections significantly affected 1985 loss numbers.
60
A more disturbing ingredient in the loss surge is the acceleration in “social” or “judicial” inflation. The insurer’s ability to pay has assumed overwhelming importance with juries and judges in the assessment of both liability and damages. More and more, “the deep pocket” is being sought and found, no matter what the policy wording, the facts, or the precedents. This judicial inflation represents a wild card in the industry’s future, and makes forecasting difficult. Nevertheless, the short-term outlook is good. Premium growth improved as 1985 went along (quarterly gains were an estimated 15%, 19%, 24%, and 22%) and, barring a supercatastrophe, the industry’s combined ratio should fall sharply in 1986. The profit improvement, however, is likely to be of short duration. Two economic principles will see to that. First, commodity businesses achieve good levels of profitability only when prices are fixed in some manner or when capacity is short. Second, managers quickly add to capacity when prospects start to improve and capital is available. In my 1982 report to you, I discussed the commodity nature of the insurance industry extensively. The typical policyholder does not differentiate between products but concentrates instead on price. For many decades a cartel-like procedure kept prices up, but this arrangement has disappeared for good. The insurance product now is priced as any other commodity for which a free market exists: when capacity is tight, prices will be set remuneratively; otherwise, they will not be. Capacity currently is tight in many lines of insurance - though in this industry, unlike most, capacity is an attitudinal concept, not a physical fact. Insurance managers can write whatever amount of business they feel comfortable writing, subject only to pressures applied by regulators and Best’s, the industry’s authoritative rating service. The comfort level of both managers and regulators is tied to capital. More capital means more comfort, which in turn means more capacity. In the typical commodity business, furthermore, such as aluminum or steel, a long gestation precedes the birth of additional capacity. In the insurance industry, capital can be secured instantly. Thus, any capacity shortage can be eliminated in short order. That’s exactly what’s going on right now. In 1985, about 15 insurers raised well over $3 billion, piling up capital so that they can write all the business possible at the better prices now available. The capital-raising trend has accelerated dramatically so far in 1986. If capacity additions continue at this rate, it won’t be long before serious price-cutting appears and next a fall in profitability. When the fall comes, it will be the fault of the capital-raisers of 1985 and 1986, not the price-cutters of 198X. (Critics should be understanding, however: as was the case in our textile example, the dynamics of capitalism cause each insurer to make decisions that for itself appear sensible, but that collectively slash profitability.)
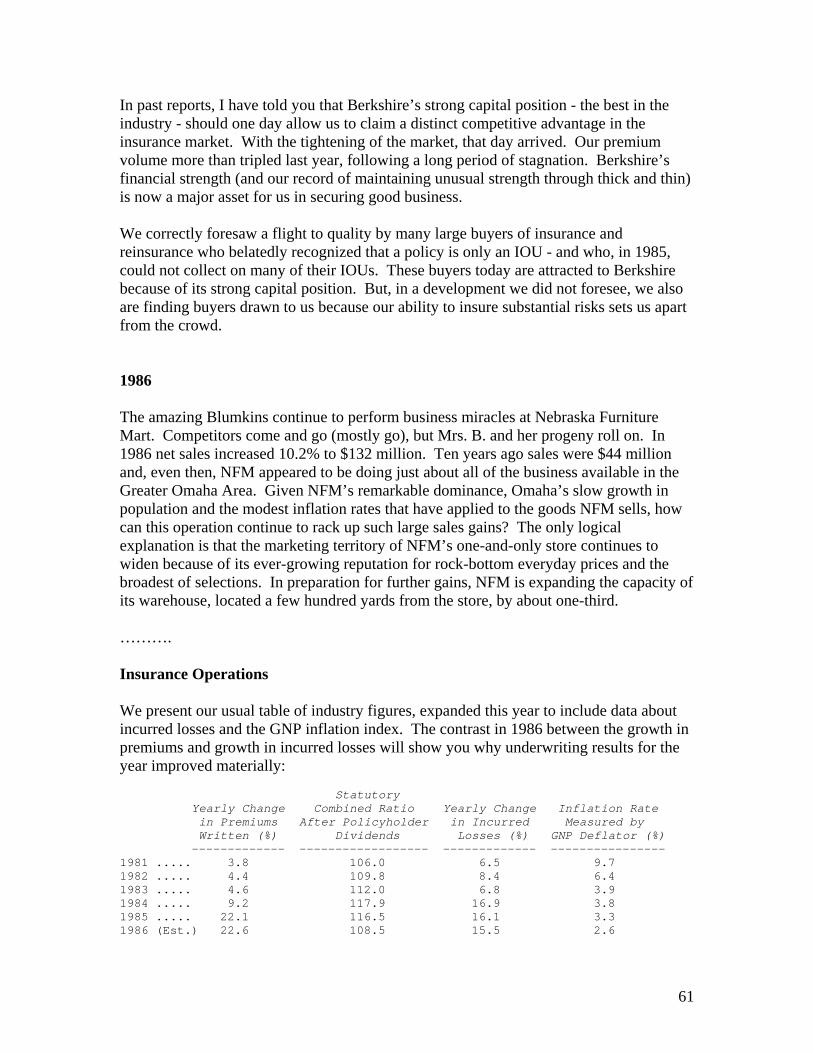
61
In past reports, I have told you that Berkshire’s strong capital position - the best in the industry - should one day allow us to claim a distinct competitive advantage in the insurance market. With the tightening of the market, that day arrived. Our premium volume more than tripled last year, following a long period of stagnation. Berkshire’s financial strength (and our record of maintaining unusual strength through thick and thin) is now a major asset for us in securing good business. We correctly foresaw a flight to quality by many large buyers of insurance and reinsurance who belatedly recognized that a policy is only an IOU - and who, in 1985, could not collect on many of their IOUs. These buyers today are attracted to Berkshire because of its strong capital position. But, in a development we did not foresee, we also are finding buyers drawn to us because our ability to insure substantial risks sets us apart from the crowd. 1986 The amazing Blumkins continue to perform business miracles at Nebraska Furniture Mart. Competitors come and go (mostly go), but Mrs. B. and her progeny roll on. In 1986 net sales increased 10.2% to $132 million. Ten years ago sales were $44 million and, even then, NFM appeared to be doing just about all of the business available in the Greater Omaha Area. Given NFM’s remarkable dominance, Omaha’s slow growth in population and the modest inflation rates that have applied to the goods NFM sells, how can this operation continue to rack up such large sales gains? The only logical explanation is that the marketing territory of NFM’s one-and-only store continues to widen because of its ever-growing reputation for rock-bottom everyday prices and the broadest of selections. In preparation for further gains, NFM is expanding the capacity of its warehouse, located a few hundred yards from the store, by about one-third. ………. Insurance Operations We present our usual table of industry figures, expanded this year to include data about incurred losses and the GNP inflation index. The contrast in 1986 between the growth in premiums and growth in incurred losses will show you why underwriting results for the year improved materially: Statutory Yearly Change Combined Ratio Yearly Change Inflation Rate in Premiums After Policyholder in Incurred Measured by Written (%) Dividends Losses (%) GNP Deflator (%) ------------- ------------------ ------------- ---------------- 1981 ..... 3.8 106.0 6.5 9.7 1982 ..... 4.4 109.8 8.4 6.4 1983 ..... 4.6 112.0 6.8 3.9 1984 ..... 9.2 117.9 16.9 3.8 1985 ..... 22.1 116.5 16.1 3.3 1986 (Est.) 22.6 108.5 15.5 2.6
62
Source: Best’s Insurance Management Reports The combined ratio represents total insurance costs (losses incurred plus expenses) compared to revenue from premiums: a ratio below 100 indicates an underwriting profit, and one above 100 indicates a loss. When the investment income that an insurer earns from holding on to policyholders’ funds ("the float") is taken into account, a combined ratio in the 107-112 range typically produces an overall break-even result, exclusive of earnings on the funds provided by shareholders. The math of the insurance business, encapsulated by the table, is not very complicated. In years when the industry’s annual gain in revenues (premiums) pokes along at 4% or 5%, underwriting losses are sure to mount. This is not because auto accidents, fires, windstorms and the like are occurring more frequently, nor has it lately been the fault of general inflation. Today, social and judicial inflation are the major culprits; the cost of entering a courtroom has simply ballooned. Part of the jump in cost arises from skyrocketing verdicts, and part from the tendency of judges and juries to expand the coverage of insurance policies beyond that contemplated by the insurer when the policies were written. Seeing no let-up in either trend, we continue to believe that the industry’s revenues must grow at close to 10% annually for it to just hold its own in terms of profitability, even though general inflation may be running only 2% - 4%. In 1986, as noted, the industry’s premium volume soared even faster than loss costs. Consequently, the underwriting loss of the industry fell dramatically. In last year’s report we predicted this sharp improvement but also predicted that prosperity would be fleeting. Alas, this second prediction is already proving accurate. The rate of gain in the industry’s premium volume has slowed significantly (from an estimated 27.1% in 1986’s first quarter, to 23.5% in the second, to 21.8% in the third, to 18.7% in the fourth), and we expect further slowing in 1987. Indeed, the rate of gain may well fall below my 10% "equilibrium" figure by the third quarter. Nevertheless, underwriting results in 1987, assuming they are not dragged down by a major natural catastrophe, will again improve materially because price increases are recognized in revenues on a lagged basis. In effect, the good news in earnings follows the good news in prices by six to twelve months. But the improving trend in earnings will probably end by late 1988 or early 1989. Thereafter the industry is likely to head south in a hurry. Pricing behavior in the insurance industry continues to be exactly what can be expected in a commodity-type business. Only under shortage conditions are high profits achieved, and such conditions don’t last long. When the profit sun begins to shine, long-established insurers shower investors with new shares in order to build capital. In addition, newly-formed insurers rush to sell shares at the advantageous prices available in the new-issue market (prices advantageous, that is, to the insiders promoting the company but rarely to the new shareholders). These moves guarantee future trouble: capacity soars, competitive juices flow, and prices fade.
63
It’s interesting to observe insurance leaders beseech their colleagues to behave in a more "statesmanlike" manner when pricing policies. "Why," they ask, "can’t we learn from history, even out the peaks and valleys, and consistently price to make reasonable profits?" What they wish, of course, is pricing that resembles, say, that of The Wall Street journal, whose prices are ample to start with and rise consistently each year. Such calls for improved behavior have all of the efficacy of those made by a Nebraska corn grower asking his fellow growers, worldwide, to market their corn with more statesmanship. What’s needed is not more statesmen, but less corn. By raising large amounts of capital in the last two years, the insurance industry has, to continue our metaphor, vastly expanded its plantings of corn. The resulting increase in "crop" - i.e., the proliferation of insurance capacity - will have the same effect on prices and profits that surplus crops have had since time immemorial. Our own insurance operation did well in 1986 and is also likely to do well in 1987. We have benefited significantly from industry conditions. But much of our prosperity arises from the efforts and ability of Mike Goldberg, manager of all insurance operations. ………. The second category of investments open to our insurance companies is long-term bonds. These are unlikely to be of interest to us except in very special situations, such as the Washington Public Power Supply System #1, #2 and #3 issues, discussed in our 1984 report. (At yearend, we owned WPPSS issues having an amortized cost of $218 million and a market value of $310 million, paying us $31.7 million in annual tax-exempt income.) Our aversion to long-term bonds relates to our fear that we will see much higher rates of inflation within the next decade. Over time, the behavior of our currency will be determined by the behavior of our legislators. This relationship poses a continuing threat to currency stability - and a corresponding threat to the owners of long-term bonds. We continue to periodically employ money in the arbitrage field. However, unlike most arbitrageurs, who purchase dozens of securities each year, we purchase only a few. We restrict ourselves to large deals that have been announced publicly and do not bet on the come. Therefore, our potential profits are apt to be small; but, with luck, our disappointments will also be few. Our yearend portfolio shown below includes one arbitrage commitment, Lear-Siegler. Our balance sheet also includes a receivable for $145 million, representing the money owed us (and paid a few days later) by Unilever, then in the process of purchasing Chesebrough-Ponds, another of our arbitrage holdings. Arbitrage is an alternative to Treasury Bills as a short-term parking place for money - a choice that combines potentially higher returns with higher risks. To date, our returns from the funds committed to arbitrage have been many times higher than they would have been had we left those funds in Treasury Bills. Nonetheless, one bad experience could change the scorecard markedly.
64
We also, though it takes some straining, currently view medium-term tax-exempt bonds as an alternative to short-term Treasury holdings. Buying these bonds, we run a risk of significant loss if, as seems probable, we sell many of them well before maturity. However, we believe this risk is more than counter-balanced first, by the much higher after-tax returns currently realizable from these securities as compared to Treasury Bills and second, by the possibility that sales will produce an overall profit rather than a loss. Our expectation of a higher total return, after allowing for the possibility of loss and after taking into account all tax effects, is a relatively close call and could well be wrong. Even if we sell our bonds at a fairly large loss, however, we may end up reaping a higher after-tax return than we would have realized by repeatedly rolling over Treasury Bills. In any event, you should know that our expectations for both the stocks and bonds we now hold are exceptionally modest, given current market levels. Probably the best thing that could happen to us is a market in which we would choose to sell many of our bond holdings at a significant loss in order to re-allocate funds to the far-better equity values then very likely to exist. The bond losses I am talking about would occur if high interest rates came along; the same rates would probably depress common stocks considerably more than medium-term bonds. ………. In the case of unregulated businesses blessed with strong franchises, however, it’s a different story: the corporation and its shareholders are then the major beneficiaries of tax cuts. These companies benefit from a tax cut much as the electric company would if it lacked a regulator to force down prices. Many of our businesses, both those we own in whole and in part, possess such franchises. Consequently, reductions in their taxes largely end up in our pockets rather than the pockets of our customers. While this may be impolitic to state, it is impossible to deny. If you are tempted to believe otherwise, think for a moment of the most able brain surgeon or lawyer in your area. Do you really expect the fees of this expert (the local "franchise-holder" in his or her specialty) to be reduced now that the top personal tax rate is being cut from 50% to 28%? Your joy at our conclusion that lower rates benefit a number of our operating businesses and investees should be severely tempered, however, by another of our convictions: scheduled 1988 tax rates, both individual and corporate, seem totally unrealistic to us. These rates will very likely bestow a fiscal problem on Washington that will prove incompatible with price stability. We believe, therefore, that ultimately - within, say, five years - either higher tax rates or higher inflation rates are almost certain to materialize. And it would not surprise us to see both. 1987 Insurance Operations
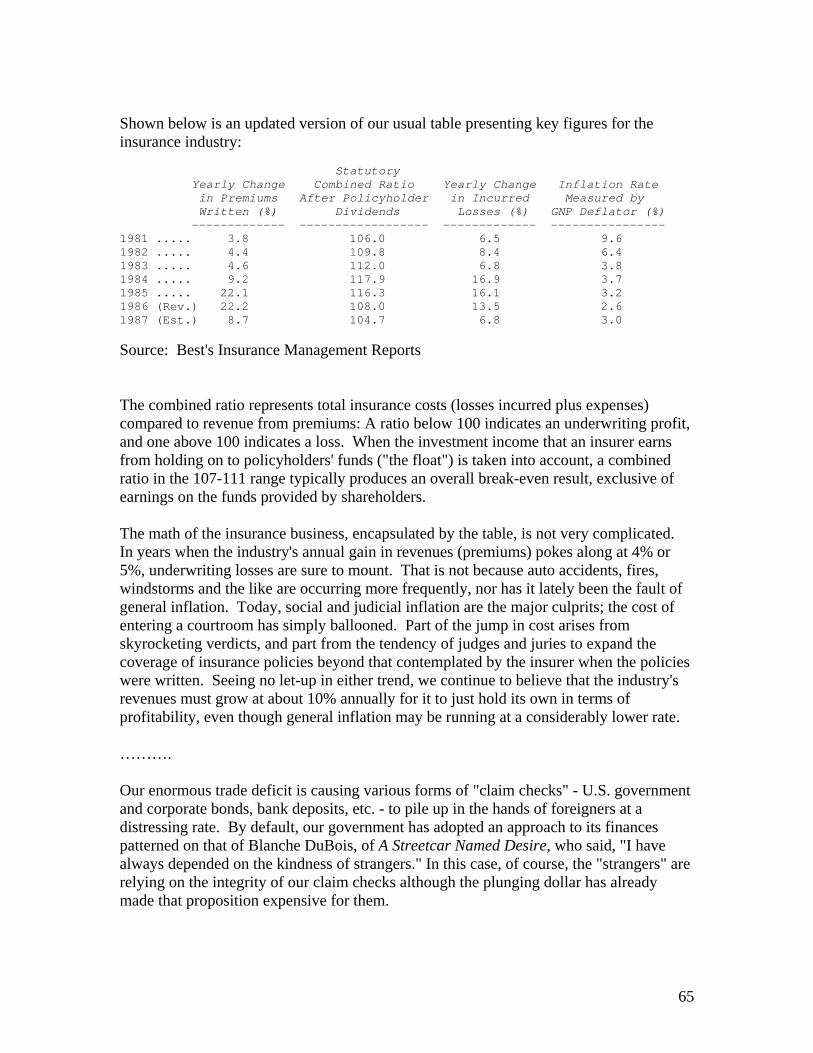
65
Shown below is an updated version of our usual table presenting key figures for the insurance industry: Statutory Yearly Change Combined Ratio Yearly Change Inflation Rate in Premiums After Policyholder in Incurred Measured by Written (%) Dividends Losses (%) GNP Deflator (%) ------------- ------------------ ------------- ---------------- 1981 ..... 3.8 106.0 6.5 9.6 1982 ..... 4.4 109.8 8.4 6.4 1983 ..... 4.6 112.0 6.8 3.8 1984 ..... 9.2 117.9 16.9 3.7 1985 ..... 22.1 116.3 16.1 3.2 1986 (Rev.) 22.2 108.0 13.5 2.6 1987 (Est.) 8.7 104.7 6.8 3.0
Source: Best's Insurance Management Reports The combined ratio represents total insurance costs (losses incurred plus expenses) compared to revenue from premiums: A ratio below 100 indicates an underwriting profit, and one above 100 indicates a loss. When the investment income that an insurer earns from holding on to policyholders' funds ("the float") is taken into account, a combined ratio in the 107-111 range typically produces an overall break-even result, exclusive of earnings on the funds provided by shareholders. The math of the insurance business, encapsulated by the table, is not very complicated. In years when the industry's annual gain in revenues (premiums) pokes along at 4% or 5%, underwriting losses are sure to mount. That is not because auto accidents, fires, windstorms and the like are occurring more frequently, nor has it lately been the fault of general inflation. Today, social and judicial inflation are the major culprits; the cost of entering a courtroom has simply ballooned. Part of the jump in cost arises from skyrocketing verdicts, and part from the tendency of judges and juries to expand the coverage of insurance policies beyond that contemplated by the insurer when the policies were written. Seeing no let-up in either trend, we continue to believe that the industry's revenues must grow at about 10% annually for it to just hold its own in terms of profitability, even though general inflation may be running at a considerably lower rate. ………. Our enormous trade deficit is causing various forms of "claim checks" - U.S. government and corporate bonds, bank deposits, etc. - to pile up in the hands of foreigners at a distressing rate. By default, our government has adopted an approach to its finances patterned on that of Blanche DuBois, of A Streetcar Named Desire, who said, "I have always depended on the kindness of strangers." In this case, of course, the "strangers" are relying on the integrity of our claim checks although the plunging dollar has already made that proposition expensive for them.
66
The faith that foreigners are placing in us may be misfounded. When the claim checks outstanding grow sufficiently numerous and when the issuing party can unilaterally determine their purchasing power, the pressure on the issuer to dilute their value by inflating the currency becomes almost irresistible. For the debtor government, the weapon of inflation is the economic equivalent of the "H" bomb, and that is why very few countries have been allowed to swamp the world with debt denominated in their own currency. Our past, relatively good record for fiscal integrity has let us break this rule, but the generosity accorded us is likely to intensify, rather than relieve, the eventual pressure on us to inflate. If we do succumb to that pressure, it won't be just the foreign holders of our claim checks who will suffer. It will be all of us as well. Of course, the U.S. may take steps to stem our trade deficit well before our position as a net debtor gets out of hand. (In that respect, the falling dollar will help, though unfortunately it will hurt in other ways.) Nevertheless, our government's behavior in this test of its mettle is apt to be consistent with its Scarlett O'Hara approach generally: "I'll think about it tomorrow." And, almost inevitably, procrastination in facing up to fiscal problems will have inflationary consequences. Both the timing and the sweep of those consequences are unpredictable. But our inability to quantify or time the risk does not mean we should ignore it. While recognizing the possibility that we may be wrong and that present interest rates may adequately compensate for the inflationary risk, we retain a general fear of long-term bonds. We are, however, willing to invest a moderate portion of our funds in this category if we think we have a significant edge in a specific security. That willingness explains our holdings of the Washington Public Power Supply Systems #1, #2 and #3 issues, discussed in our 1984 report. We added to our WPPSS position during 1987. At yearend, we had holdings with an amortized cost of $240 million and a market value of $316 million, paying us tax-exempt income of $34 million annually. o We continued to do well in arbitrage last year, though - or perhaps because - we operated on a very limited scale. We enter into only a few arbitrage commitments each year and restrict ourselves to large transactions that have been publicly announced. We do not participate in situations in which green-mailers are attempting to put a target company "in play." We have practiced arbitrage on an opportunistic basis for decades and, to date, our results have been quite good. Though we've never made an exact calculation, I believe that overall we have averaged annual pre-tax returns of at least 25% from arbitrage. I'm quite sure we did better than that in 1987. But it should be emphasized that a really bad experience or two - such as many arbitrage operations suffered in late 1987 - could change the figures dramatically. Our only $50 million-plus arbitrage position at yearend 1987 was 1,096,200 shares of Allegis, with a cost of $76 million and a market value of $78 million.
67
o We had two other large holdings at yearend that do not fit precisely into any of our five categories. One was various Texaco, Inc. bonds with short maturities, all purchased after Texaco went into bankruptcy. Were it not for the extraordinarily strong capital position of our insurance companies, it would be inappropriate for us to buy defaulted bonds. At prices prevailing after Texaco's bankruptcy filing, however, we regarded these issues as by far the most attractive bond investment available to us. On a worst-case basis with respect to the Pennzoil litigation, we felt the bonds were likely to be worth about what we paid for them. Given a sensible settlement, which seemed likely, we expected the bonds to be worth considerably more. At yearend our Texaco bonds were carried on our books at $104 million and had a market value of $119 million. By far our largest - and most publicized - investment in 1987 was a $700 million purchase of Salomon Inc 9% preferred stock. This preferred is convertible after three years into Salomon common stock at $38 per share and, if not converted, will be redeemed ratably over five years beginning October 31, 1995. From most standpoints, this commitment fits into the medium-term fixed-income securities category. In addition, we have an interesting conversion possibility. We, of course, have no special insights regarding the direction or future profitability of investment banking. By their nature, the economics of this industry are far less predictable than those of most other industries in which we have major Commitments. This unpredictability is one of the reasons why our participation is in the form of a convertible preferred. What we do have a strong feeling about is the ability and integrity of John Gutfreund, CEO of Salomon Inc. Charlie and I like, admire and trust John. We first got to know him in 1976 when he played a key role in GEICO's escape from near-bankruptcy. Several times since, we have seen John steer clients away from transactions that would have been unwise, but that the client clearly wanted to make - even though his advice provided no fee to Salomon and acquiescence would have delivered a large fee. Such service-above-self behavior is far from automatic in Wall Street. [Note: Buffett eventually had to take over for Gutfreund at Salomon, in 1991-1992, and save it from going under – events that were initially started because of some illegal trading by a couple of employees. –JK] For the reasons Charlie outlines on page 50, at yearend we valued our Salomon investment at 98% of par, $14 million less than our cost. However, we believe there is a reasonable likelihood that a leading, high-quality capital-raising and market-making operation can average good returns on equity. If so, our conversion right will eventually prove to be valuable. ………. Financing Shortly after yearend, Berkshire sold two issues of debentures, totaling $250 million. Both issues mature in 2018 and will be retired at an even pace through sinking fund
68
operations that begin in 1999. Our overall interest cost, after allowing for expenses of issuance, is slightly over 10%. Salomon was our investment banker, and its service was excellent. Despite our pessimistic views about inflation, our taste for debt is quite limited. To be sure, it is likely that Berkshire could improve its return on equity by moving to a much higher, though still conventional, debt-to-business-value ratio. It's even more likely that we could handle such a ratio, without problems, under economic conditions far worse than any that have prevailed since the early 1930s. But we do not wish it to be only likely that we can meet our obligations; we wish that to be certain. Thus we adhere to policies - both in regard to debt and all other matters - that will allow us to achieve acceptable long-term results under extraordinarily adverse conditions, rather than optimal results under a normal range of conditions. Good business or investment decisions will eventually produce quite satisfactory economic results, with no aid from leverage. Therefore, it seems to us to be both foolish and improper to risk what is important (including, necessarily, the welfare of innocent bystanders such as policyholders and employees) for some extra returns that are relatively unimportant. This view is not the product of either our advancing age or prosperity: Our opinions about debt have remained constant. However, we are not phobic about borrowing. (We're far from believing that there is no fate worse than debt.) We are willing to borrow an amount that we believe - on a worst-case basis - will pose no threat to Berkshire's well-being. Analyzing what that amount might be, we can look to some important strengths that would serve us well if major problems should engulf our economy: Berkshire's earnings come from many diverse and well-entrenched businesses; these businesses seldom require much capital investment; what debt we have is structured well; and we maintain major holdings of liquid assets. Clearly, we could be comfortable with a higher debt-to-business-value ratio than we now have. One further aspect of our debt policy deserves comment: Unlike many in the business world, we prefer to finance in anticipation of need rather than in reaction to it. A business obtains the best financial results possible by managing both sides of its balance sheet well. This means obtaining the highest-possible return on assets and the lowest-possible cost on liabilities. It would be convenient if opportunities for intelligent action on both fronts coincided. However, reason tells us that just the opposite is likely to be the case: Tight money conditions, which translate into high costs for liabilities, will create the best opportunities for acquisitions, and cheap money will cause assets to be bid to the sky. Our conclusion: Action on the liability side should sometimes be taken independent of any action on the asset side. Alas, what is "tight" and "cheap" money is far from clear at any particular time. We have no ability to forecast interest rates and - maintaining our usual open-minded spirit - believe that no one else can. Therefore, we simply borrow when conditions seem non-
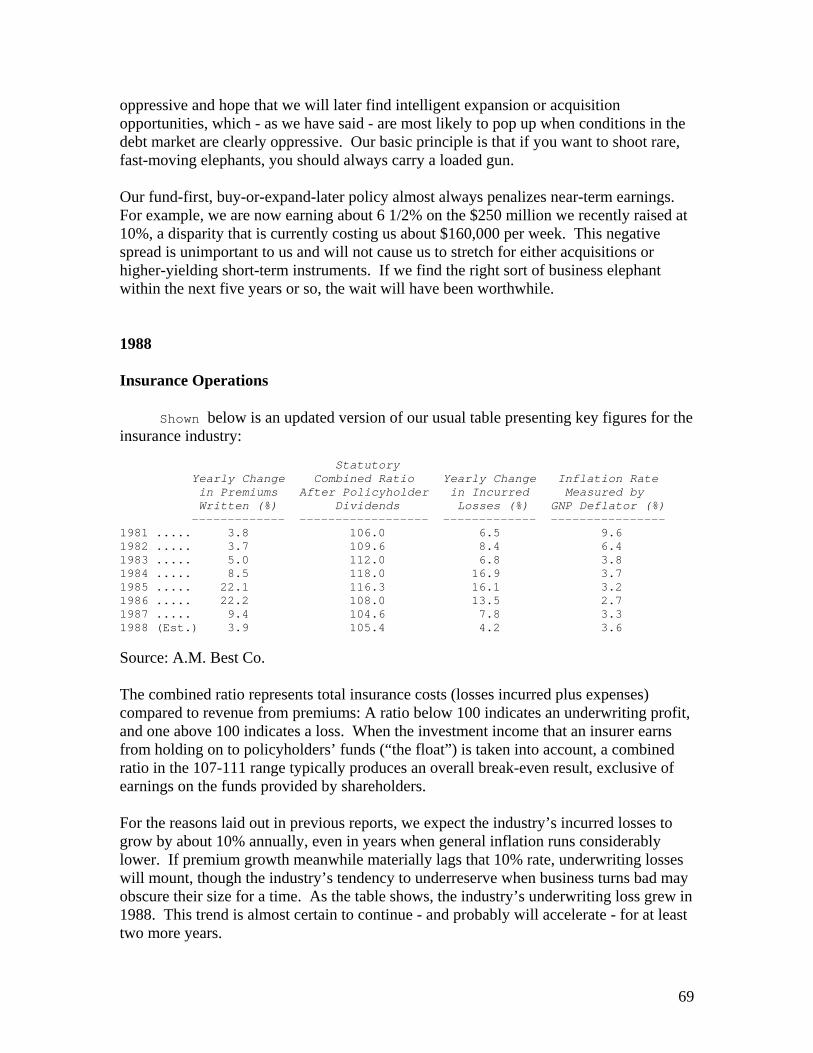
69
oppressive and hope that we will later find intelligent expansion or acquisition opportunities, which - as we have said - are most likely to pop up when conditions in the debt market are clearly oppressive. Our basic principle is that if you want to shoot rare, fast-moving elephants, you should always carry a loaded gun. Our fund-first, buy-or-expand-later policy almost always penalizes near-term earnings. For example, we are now earning about 6 1/2% on the $250 million we recently raised at 10%, a disparity that is currently costing us about $160,000 per week. This negative spread is unimportant to us and will not cause us to stretch for either acquisitions or higher-yielding short-term instruments. If we find the right sort of business elephant within the next five years or so, the wait will have been worthwhile. 1988 Insurance Operations Shown below is an updated version of our usual table presenting key figures for the insurance industry: Statutory Yearly Change Combined Ratio Yearly Change Inflation Rate in Premiums After Policyholder in Incurred Measured by Written (%) Dividends Losses (%) GNP Deflator (%) ------------- ------------------ ------------- ---------------- 1981 ..... 3.8 106.0 6.5 9.6 1982 ..... 3.7 109.6 8.4 6.4 1983 ..... 5.0 112.0 6.8 3.8 1984 ..... 8.5 118.0 16.9 3.7 1985 ..... 22.1 116.3 16.1 3.2 1986 ..... 22.2 108.0 13.5 2.7 1987 ..... 9.4 104.6 7.8 3.3 1988 (Est.) 3.9 105.4 4.2 3.6
Source: A.M. Best Co. The combined ratio represents total insurance costs (losses incurred plus expenses) compared to revenue from premiums: A ratio below 100 indicates an underwriting profit, and one above 100 indicates a loss. When the investment income that an insurer earns from holding on to policyholders’ funds (“the float”) is taken into account, a combined ratio in the 107-111 range typically produces an overall break-even result, exclusive of earnings on the funds provided by shareholders. For the reasons laid out in previous reports, we expect the industry’s incurred losses to grow by about 10% annually, even in years when general inflation runs considerably lower. If premium growth meanwhile materially lags that 10% rate, underwriting losses will mount, though the industry’s tendency to underreserve when business turns bad may obscure their size for a time. As the table shows, the industry’s underwriting loss grew in 1988. This trend is almost certain to continue - and probably will accelerate - for at least two more years.
70
The property-casualty insurance industry is not only subnormally profitable, it is subnormally popular. (As Sam Goldwyn philosophized: “In life, one must learn to take the bitter with the sour.”) One of the ironies of business is that many relatively-unprofitable industries that are plagued by inadequate prices habitually find themselves beat upon by irate customers even while other, hugely profitable industries are spared complaints, no matter how high their prices. Take the breakfast cereal industry, whose return on invested capital is more than double that of the auto insurance industry (which is why companies like Kellogg and General Mills sell at five times book value and most large insurers sell close to book). The cereal companies regularly impose price increases, few of them related to a significant jump in their costs. Yet not a peep is heard from consumers. But when auto insurers raise prices by amounts that do not even match cost increases, customers are outraged. If you want to be loved, it’s clearly better to sell high-priced corn flakes than low-priced auto insurance. The antagonism that the public feels toward the industry can have serious consequences: Proposition 103, a California initiative passed last fall, threatens to push auto insurance prices down sharply, even though costs have been soaring. The price cut has been suspended while the courts review the initiative, but the resentment that brought on the vote has not been suspended: Even if the initiative is overturned, insurers are likely to find it tough to operate profitably in California. (Thank heavens the citizenry isn’t mad at bonbons: If Proposition 103 applied to candy as well as insurance, See’s would be forced to sell its product for $5.76 per pound. rather than the $7.60 we charge - and would be losing money by the bucketful.) The immediate direct effects on Berkshire from the initiative are minor, since we saw few opportunities for profit in the rate structure that existed in California prior to the vote. However, the forcing down of prices would seriously affect GEICO, our 44%-owned investee, which gets about 10% of its premium volume from California. Even more threatening to GEICO is the possibility that similar pricing actions will be taken in other states, through either initiatives or legislation. If voters insist that auto insurance be priced below cost, it eventually must be sold by government. Stockholders can subsidize policyholders for a short period, but only taxpayers can subsidize them over the long term. At most property-casualty companies, socialized auto insurance would be no disaster for shareholders. Because of the commodity characteristics of the industry, most insurers earn mediocre returns and therefore have little or no economic goodwill to lose if they are forced by government to leave the auto insurance business. But GEICO, because it is a low-cost producer able to earn high returns on equity, has a huge amount of economic goodwill at risk. In turn, so do we. 1989
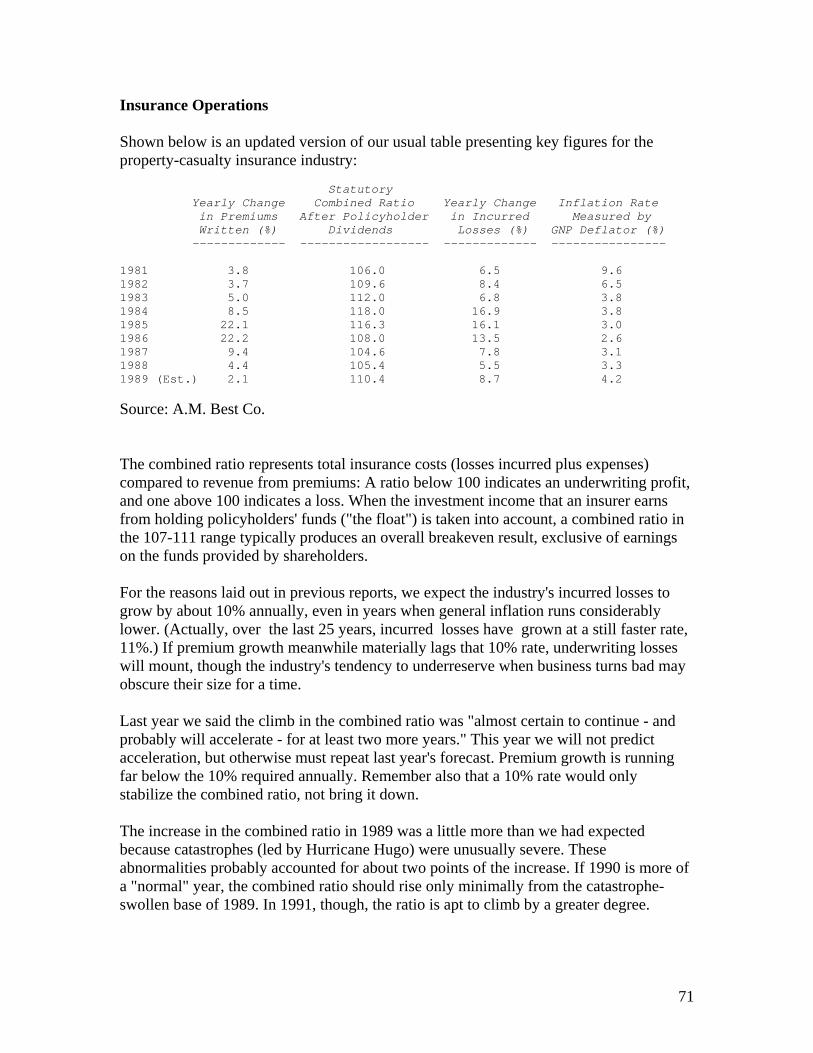
71
Insurance Operations Shown below is an updated version of our usual table presenting key figures for the property-casualty insurance industry: Statutory Yearly Change Combined Ratio Yearly Change Inflation Rate in Premiums After Policyholder in Incurred Measured by Written (%) Dividends Losses (%) GNP Deflator (%) ------------- ------------------ ------------- ---------------- 1981 3.8 106.0 6.5 9.6 1982 3.7 109.6 8.4 6.5 1983 5.0 112.0 6.8 3.8 1984 8.5 118.0 16.9 3.8 1985 22.1 116.3 16.1 3.0 1986 22.2 108.0 13.5 2.6 1987 9.4 104.6 7.8 3.1 1988 4.4 105.4 5.5 3.3 1989 (Est.) 2.1 110.4 8.7 4.2
Source: A.M. Best Co. The combined ratio represents total insurance costs (losses incurred plus expenses) compared to revenue from premiums: A ratio below 100 indicates an underwriting profit, and one above 100 indicates a loss. When the investment income that an insurer earns from holding policyholders' funds ("the float") is taken into account, a combined ratio in the 107-111 range typically produces an overall breakeven result, exclusive of earnings on the funds provided by shareholders. For the reasons laid out in previous reports, we expect the industry's incurred losses to grow by about 10% annually, even in years when general inflation runs considerably lower. (Actually, over the last 25 years, incurred losses have grown at a still faster rate, 11%.) If premium growth meanwhile materially lags that 10% rate, underwriting losses will mount, though the industry's tendency to underreserve when business turns bad may obscure their size for a time. Last year we said the climb in the combined ratio was "almost certain to continue - and probably will accelerate - for at least two more years." This year we will not predict acceleration, but otherwise must repeat last year's forecast. Premium growth is running far below the 10% required annually. Remember also that a 10% rate would only stabilize the combined ratio, not bring it down. The increase in the combined ratio in 1989 was a little more than we had expected because catastrophes (led by Hurricane Hugo) were unusually severe. These abnormalities probably accounted for about two points of the increase. If 1990 is more of a "normal" year, the combined ratio should rise only minimally from the catastrophe-swollen base of 1989. In 1991, though, the ratio is apt to climb by a greater degree.
72
Commentators frequently discuss the "underwriting cycle" and speculate about its next turn. If that term is used to connote rhythmic qualities, it is in our view a misnomer that leads to faulty thinking about the industry's fundamental economics. The term was appropriate some decades ago when the industry and regulators cooperated to conduct the business in cartel fashion. At that time, the combined ratio fluctuated rhythmically for two reasons, both related to lags. First, data from the past were analyzed and then used to set new "corrected" rates, which were subsequently put into effect by virtually all insurers. Second, the fact that almost all policies were then issued for a one-to three-year term - which meant that it took a considerable time for mispriced policies to expire - delayed the impact of new rates on revenues. These two lagged responses made combined ratios behave much like alternating current. Meanwhile, the absence of significant price competition guaranteed that industry profits, averaged out over the cycle, would be satisfactory. The cartel period is long gone. Now the industry has hundreds of participants selling a commodity-like product at independently-established prices. Such a configuration - whether the product being sold is steel or insurance policies - is certain to cause subnormal profitability in all circumstances but one: a shortage of usable capacity. Just how often these periods occur and how long they last determines the average profitability of the industry in question. In most industries, capacity is described in physical terms. In the insurance world, however, capacity is customarily described in financial terms; that is, it's considered appropriate for a company to write no more than X dollars of business if it has Y dollars of net worth. In practice, however, constraints of this sort have proven ineffective. Regulators, insurance brokers, and customers are all slow to discipline companies that strain their resources. They also acquiesce when companies grossly overstate their true capital. Hence, a company can write a great deal of business with very little capital if it is so inclined. At bottom, therefore, the amount of industry capacity at any particular moment primarily depends on the mental state of insurance managers. All this understood, it is not very difficult to prognosticate the industry's profits. Good profits will be realized only when there is a shortage of capacity. Shortages will occur only when insurers are frightened. That happens rarely - and most assuredly is not happening now. Some analysts have argued that the more onerous taxes recently imposed on the insurance industry and 1989's catastrophes - Hurricane Hugo and the California earthquake - will cause prices to strengthen significantly. We disagree. These adversities have not destroyed the eagerness of insurers to write business at present prices. Therefore, premium volume won't grow by 10% in 1990, which means the negative underwriting trend will not reverse. The industry will meantime say it needs higher prices to achieve profitability matching that of the average American business. Of course it does. So does the steel business. But
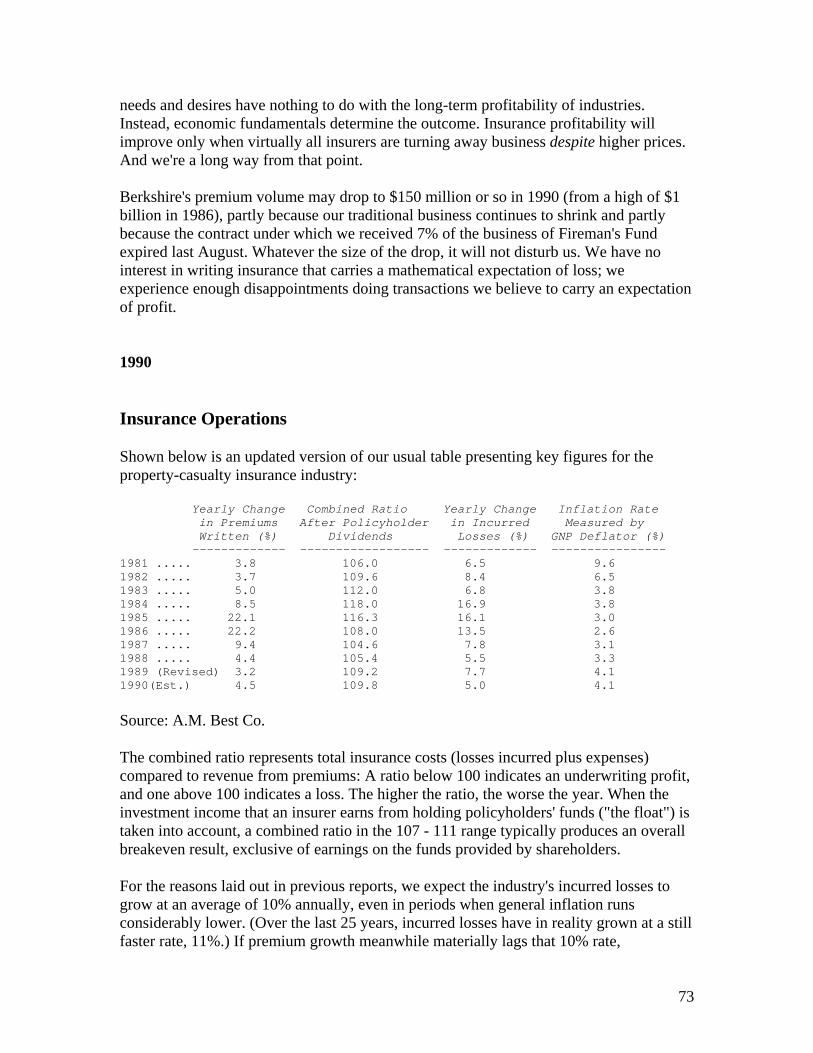
73
needs and desires have nothing to do with the long-term profitability of industries. Instead, economic fundamentals determine the outcome. Insurance profitability will improve only when virtually all insurers are turning away business despite higher prices. And we're a long way from that point. Berkshire's premium volume may drop to $150 million or so in 1990 (from a high of $1 billion in 1986), partly because our traditional business continues to shrink and partly because the contract under which we received 7% of the business of Fireman's Fund expired last August. Whatever the size of the drop, it will not disturb us. We have no interest in writing insurance that carries a mathematical expectation of loss; we experience enough disappointments doing transactions we believe to carry an expectation of profit. 1990
Insurance Operations
Shown below is an updated version of our usual table presenting key figures for the property-casualty insurance industry:
Yearly Change Combined Ratio Yearly Change Inflation Rate in Premiums After Policyholder in Incurred Measured by Written (%) Dividends Losses (%) GNP Deflator (%) ------------- ------------------ ------------- ---------------- 1981 ..... 3.8 106.0 6.5 9.6 1982 ..... 3.7 109.6 8.4 6.5 1983 ..... 5.0 112.0 6.8 3.8 1984 ..... 8.5 118.0 16.9 3.8 1985 ..... 22.1 116.3 16.1 3.0 1986 ..... 22.2 108.0 13.5 2.6 1987 ..... 9.4 104.6 7.8 3.1 1988 ..... 4.4 105.4 5.5 3.3 1989 (Revised) 3.2 109.2 7.7 4.1 1990(Est.) 4.5 109.8 5.0 4.1
Source: A.M. Best Co.
The combined ratio represents total insurance costs (losses incurred plus expenses) compared to revenue from premiums: A ratio below 100 indicates an underwriting profit, and one above 100 indicates a loss. The higher the ratio, the worse the year. When the investment income that an insurer earns from holding policyholders' funds ("the float") is taken into account, a combined ratio in the 107 - 111 range typically produces an overall breakeven result, exclusive of earnings on the funds provided by shareholders.
For the reasons laid out in previous reports, we expect the industry's incurred losses to grow at an average of 10% annually, even in periods when general inflation runs considerably lower. (Over the last 25 years, incurred losses have in reality grown at a still faster rate, 11%.) If premium growth meanwhile materially lags that 10% rate,
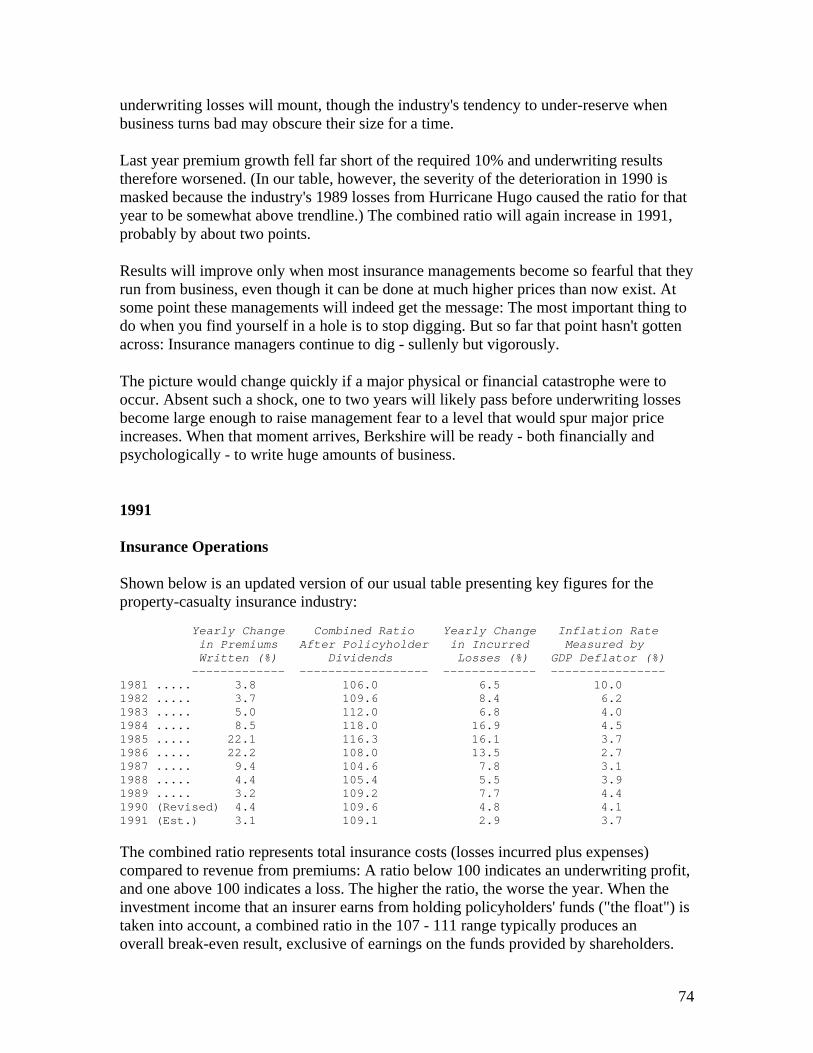
74
underwriting losses will mount, though the industry's tendency to under-reserve when business turns bad may obscure their size for a time.
Last year premium growth fell far short of the required 10% and underwriting results therefore worsened. (In our table, however, the severity of the deterioration in 1990 is masked because the industry's 1989 losses from Hurricane Hugo caused the ratio for that year to be somewhat above trendline.) The combined ratio will again increase in 1991, probably by about two points.
Results will improve only when most insurance managements become so fearful that they run from business, even though it can be done at much higher prices than now exist. At some point these managements will indeed get the message: The most important thing to do when you find yourself in a hole is to stop digging. But so far that point hasn't gotten across: Insurance managers continue to dig - sullenly but vigorously.
The picture would change quickly if a major physical or financial catastrophe were to occur. Absent such a shock, one to two years will likely pass before underwriting losses become large enough to raise management fear to a level that would spur major price increases. When that moment arrives, Berkshire will be ready - both financially and psychologically - to write huge amounts of business.
1991 Insurance Operations Shown below is an updated version of our usual table presenting key figures for the property-casualty insurance industry: Yearly Change Combined Ratio Yearly Change Inflation Rate in Premiums After Policyholder in Incurred Measured by Written (%) Dividends Losses (%) GDP Deflator (%) ------------- ------------------ ------------- ---------------- 1981 ..... 3.8 106.0 6.5 10.0 1982 ..... 3.7 109.6 8.4 6.2 1983 ..... 5.0 112.0 6.8 4.0 1984 ..... 8.5 118.0 16.9 4.5 1985 ..... 22.1 116.3 16.1 3.7 1986 ..... 22.2 108.0 13.5 2.7 1987 ..... 9.4 104.6 7.8 3.1 1988 ..... 4.4 105.4 5.5 3.9 1989 ..... 3.2 109.2 7.7 4.4 1990 (Revised) 4.4 109.6 4.8 4.1 1991 (Est.) 3.1 109.1 2.9 3.7 The combined ratio represents total insurance costs (losses incurred plus expenses) compared to revenue from premiums: A ratio below 100 indicates an underwriting profit, and one above 100 indicates a loss. The higher the ratio, the worse the year. When the investment income that an insurer earns from holding policyholders' funds ("the float") is taken into account, a combined ratio in the 107 - 111 range typically produces an overall break-even result, exclusive of earnings on the funds provided by shareholders.
75
For the reasons laid out in previous reports, we expect the industry's incurred losses to grow at close to 10% annually, even in periods when general inflation runs considerably lower. (Over the last 25 years, incurred losses have in reality grown at a still faster rate, 11%.) If premium growth meanwhile materially lags that 10% rate, underwriting losses will mount. However, the industry's tendency to under-reserve when business turns bad may obscure the picture for a time - and that could well describe the situation last year. Though premiums did not come close to growing 10%, the combined ratio failed to deteriorate as I had expected but instead slightly improved. Loss-reserve data for the industry indicate that there is reason to be skeptical of that outcome, and it may turn out that 1991's ratio should have been worse than was reported. In the long run, of course, trouble awaits managements that paper over operating problems with accounting maneuvers. Eventually, managements of this kind achieve the same result as the seriously-ill patient who tells his doctor: "I can't afford the operation, but would you accept a small payment to touch up the x-rays?" Berkshire's insurance business has changed in ways that make combined ratios, our own or the industry's, largely irrelevant to our performance. What counts with us is the "cost of funds developed from insurance," or in the vernacular, "the cost of float." 1993 In our opinion, the real risk that an investor must assess is whether his aggregate after-tax receipts from an investment (including those he receives on sale) will, over his prospective holding period, give him at least as much purchasing power as he had to begin with, plus a modest rate of interest on that initial stake. Though this risk cannot be calculated with engineering precision, it can in some cases be judged with a degree of accuracy that is useful. The primary factors bearing upon this evaluation are: 1) The certainty with which the long-term economic characteristics of the business can be evaluated; 2) The certainty with which management can be evaluated, both as to its ability to realize the full potential of the business and to wisely employ its cash flows; 3) The certainty with which management can be counted on to channel the rewards from the business to the shareholders rather than to itself; 4) The purchase price of the business; 5) The levels of taxation and inflation that will be
76
experienced and that will determine the degree by which an investor's purchasing-power return is reduced from his gross return. These factors will probably strike many analysts as unbearably fuzzy, since they cannot be extracted from a data base of any kind. But the difficulty of precisely quantifying these matters does not negate their importance nor is it insuperable. Just as Justice Stewart found it impossible to formulate a test for obscenity but nevertheless asserted, "I know it when I see it," so also can investors - in an inexact but useful way - "see" the risks inherent in certain investments without reference to complex equations or price histories. Is it really so difficult to conclude that Coca-Cola and Gillette possess far less business risk over the long term than, say, any computer company or retailer? Worldwide, Coke sells about 44% of all soft drinks, and Gillette has more than a 60% share (in value) of the blade market. Leaving aside chewing gum, in which Wrigley is dominant, I know of no other significant businesses in which the leading company has long enjoyed such global power. Moreover, both Coke and Gillette have actually increased their worldwide shares of market in recent years. The might of their brand names, the attributes of their products, and the strength of their distribution systems give them an enormous competitive advantage, setting up a protective moat around their economic castles. The average company, in contrast, does battle daily without any such means of protection. As Peter Lynch says, stocks of companies selling commodity-like products should come with a warning label: "Competition may prove hazardous to human wealth." 1997 Our second non-traditional commitment is in silver. Last year, we purchased 111.2 million ounces. Marked to market, that position produced a pre-tax gain of $97.4 million for us in 1997. In a way, this is a return to the past for me: Thirty years ago, I bought silver because I anticipated its demonetization by the U.S. Government. Ever since, I have followed the metal's fundamentals but not owned it. In recent years, bullion inventories have fallen materially, and last summer Charlie and I concluded that a higher price would be needed to establish equilibrium between supply and demand. Inflation expectations, it should be noted, play no part in our calculation of silver's value. 1999 If we have a strength, it is in recognizing when we are operating well within our circle of competence and when we are approaching the perimeter. Predicting the long-term economics of companies that operate in fast-changing industries is simply far beyond our perimeter. If others claim predictive skill in those industries -- and seem to have their claims validated by the behavior of the stock market -- we neither envy nor emulate them.
77
Instead, we just stick with what we understand. If we stray, we will have done so inadvertently, not because we got restless and substituted hope for rationality. Fortunately, it's almost certain there will be opportunities from time to time for Berkshire to do well within the circle we've staked out. Right now, the prices of the fine businesses we already own are just not that attractive. In other words, we feel much better about the businesses than their stocks. That's why we haven't added to our present holdings. Nevertheless, we haven't yet scaled back our portfolio in a major way: If the choice is between a questionable business at a comfortable price or a comfortable business at a questionable price, we much prefer the latter. What really gets our attention, however, is a comfortable business at a comfortable price. Our reservations about the prices of securities we own apply also to the general level of equity prices. We have never attempted to forecast what the stock market is going to do in the next month or the next year, and we are not trying to do that now. But, as I point out in the enclosed article, equity investors currently seem wildly optimistic in their expectations about future returns. We see the growth in corporate profits as being largely tied to the business done in the country (GDP), and we see GDP growing at a real rate of about 3%. In addition, we have hypothesized 2% inflation. Charlie and I have no particular conviction about the accuracy of 2%. However, it's the market's view: Treasury Inflation-Protected Securities (TIPS) yield about two percentage points less than the standard treasury bond, and if you believe inflation rates are going to be higher than that, you can profit by simply buying TIPS and shorting Governments. If profits do indeed grow along with GDP, at about a 5% rate, the valuation placed on American business is unlikely to climb by much more than that. Add in something for dividends, and you emerge with returns from equities that are dramatically less than most investors have either experienced in the past or expect in the future. If investor expectations become more realistic -- and they almost certainly will -- the market adjustment is apt to be severe, particularly in sectors in which speculation has been concentrated. Berkshire will someday have opportunities to deploy major amounts of cash in equity markets -- we are confident of that. But, as the song goes, "Who knows where or when?" Meanwhile, if anyone starts explaining to you what is going on in the truly-manic portions of this "enchanted" market, you might remember still another line of song: "Fools give you reasons, wise men never try." 2001 Even when companies have the best of intentions, it's not easy to reserve properly. I've told the story in the past about the fellow traveling abroad whose sister called to tell him
78
that their dad had died. The brother replied that it was impossible for him to get home for the funeral; he volunteered, however, to shoulder its cost. Upon returning, the brother received a bill from the mortuary for $4,500, which he promptly paid. A month later, and a month after that also, he paid $10 pursuant to an add-on invoice. When a third $10 invoice came, he called his sister for an explanation. "Oh," she replied, "I forgot to tell you. We buried dad in a rented suit." There are a lot of "rented suits" buried in the past operations of insurance companies. Sometimes the problems they signify lie dormant for decades, as was the case with asbestos liability, before virulently manifesting themselves. Difficult as the job may be, it's management's responsibility to adequately account for all possibilities. Conservatism is essential. When a claims manager walks into the CEO's office and says "Guess what just happened," his boss, if a veteran, does not expect to hear it's good news. Surprises in the insurance world have been far from symmetrical in their effect on earnings. Because of this one-sided experience, it is folly to suggest, as some are doing, that all property/casualty insurance reserves be discounted, an approach reflecting the fact that they will be paid in the future and that therefore their present value is less than the stated liability for them. Discounting might be acceptable if reserves could be precisely established. They can't, however, because a myriad of forces ¾ judicial broadening of policy language and medical inflation, to name just two chronic problems ¾ are constantly working to make reserves inadequate. Discounting would exacerbate this already-serious situation and, additionally, would provide a new tool for the companies that are inclined to fudge. I'd say that the effects from telling a profit-challenged insurance CEO to lower reserves through discounting would be comparable to those that would ensue if a father told his 16-year-old son to have a normal sex life. Neither party needs that kind of push. 2004 Large and persisting current account deficits produce an entirely different result. As time passes, and as claims against us grow, we own less and less of what we produce. In effect, the rest of the world enjoys an ever-growing royalty on American output. Here, we are like a family that consistently overspends its income. As time passes, the family finds that it is working more and more for the “finance company” and less for itself. Should we continue to run current account deficits comparable to those now prevailing, the net ownership of the U.S. by other countries and their citizens a decade from now will amount to roughly $11 trillion. And, if foreign investors were to earn only 5% on that net holding, we would need to send a net of $.55 trillion of goods and services abroad every year merely to service the U.S. investments then held by foreigners. At that date, a decade out, our GDP would probably total about $18 trillion (assuming low inflation, which is far from a sure thing). Therefore, our U.S. “family” would then be delivering 3% of its annual output to the rest of the world simply as tribute for the overindulgences
79
of the past. In this case, unlike that involving budget deficits, the sons would truly pay for the sins of their fathers. This annual royalty paid the world – which would not disappear unless the U.S. massively underconsumed and began to run consistent and large trade surpluses – would undoubtedly produce significant political unrest in the U.S. Americans would still be living very well, indeed better than now because of the growth in our economy. But they would chafe at the idea of perpetually paying tribute to their creditors and owners abroad. A country that is now aspiring to an “Ownership Society” will not find happiness in – and I’ll use hyperbole here for emphasis – a “Sharecropper’s Society.” But that’s precisely where our trade policies, supported by Republicans and Democrats alike, are taking us. Many prominent U.S. financial figures, both in and out of government, have stated that our current-account deficits cannot persist. For instance, the minutes of the Federal Reserve Open Market Committee of June 29-30, 2004 say: “The staff noted that outsized external deficits could not be sustained indefinitely.” But, despite the constant handwringing by luminaries, they offer no substantive suggestions to tame the burgeoning imbalance. In the article I wrote for Fortune 16 months ago, I warned that “a gently declining dollar would not provide the answer.” And so far it hasn’t. Yet policymakers continue to hope for a “soft landing,” meanwhile counseling other countries to stimulate (read “inflate”) their economies and Americans to save more. In my view these admonitions miss the mark: There are deep-rooted structural problems that will cause America to continue to run a huge current-account deficit unless trade policies either change materially or the dollar declines by a degree that could prove unsettling to financial markets. Proponents of the trade status quo are fond of quoting Adam Smith: “What is prudence in the conduct of every family can scarce be folly in that of a great kingdom. If a foreign country can supply us with a commodity cheaper than we ourselves can make it, better buy it of them with some part of the produce of our own industry, employed in a way in which we have some advantage.” I agree. Note, however, that Mr. Smith’s statement refers to trade of product for product, not of wealth for product as our country is doing to the tune of $.6 trillion annually. Moreover, I am sure that he would never have suggested that “prudence” consisted of his “family” selling off part of its farm every day in order to finance its overconsumption. Yet that is just what the “great kingdom” called the United States is doing. If the U.S. was running a $.6 trillion current-account surplus, commentators worldwide would violently condemn our policy, viewing it as an extreme form of “mercantilism” – a long-discredited economic strategy under which countries fostered exports, discouraged imports, and piled up treasure. I would condemn such a policy as well. But, in effect if not in intent, the rest of the world is practicing mercantilism in respect to the U.S., an act made possible by our vast store of assets and our pristine credit history. Indeed, the world would never let any other country use a credit card denominated in its own currency to
80
the insatiable extent we are employing ours. Presently, most foreign investors are sanguine: they may view us as spending junkies, but they know we are rich junkies as well. Our spendthrift behavior won’t, however, be tolerated indefinitely. And though it’s impossible to forecast just when and how the trade problem will be resolved, it’s improbable that the resolution will foster an increase in the value of our currency relative to that of our trading partners. We hope the U.S. adopts policies that will quickly and substantially reduce the current-account deficit. True, a prompt solution would likely cause Berkshire to record losses on its foreign-exchange contracts. But Berkshire’s resources remain heavily concentrated in dollar-based assets, and both a strong dollar and a low-inflation environment are very much in our interest. If you wish to keep abreast of trade and currency matters, read The Financial Times. This London-based paper has long been the leading source for daily international financial news and now has an excellent American edition. Both its reporting and commentary on trade are first-class.
* * * * * * * * * * * * And, again, our usual caveat: macro-economics is a tough game in which few people, Charlie and I included, have demonstrated skill. We may well turn out to be wrong in our currency judgments. (Indeed, the fact that so many pundits now predict weakness for the dollar makes us uneasy.) If so, our mistake will be very public. The irony is that if we chose the opposite course, leaving all of Berkshire’s assets in dollars even as they declined significantly in value, no one would notice our mistake. John Maynard Keynes said in his masterful The General Theory: “Worldly wisdom teaches that it is better for reputation to fail conventionally than to succeed unconventionally.” (Or, to put it in less elegant terms, lemmings as a class may be derided but never does an individual lemming get criticized.) From a reputational standpoint, Charlie and I run a clear risk with our foreign-exchange commitment. But we believe in managing Berkshire as if we owned 100% of it ourselves. And, were that the case, we would not be following a dollar-only policy. 2007 Businesses – The Great, the Good and the Gruesome Let’s take a look at what kind of businesses turn us on. And while we’re at it, let’s also discuss what we wish to avoid. Charlie and I look for companies that have a) a business we understand; b) favorable long-term economics; c) able and trustworthy management; and d) a sensible price tag.
81
We like to buy the whole business or, if management is our partner, at least 80%. When control-type purchases of quality aren’t available, though, we are also happy to simply buy small portions of great businesses by way of stockmarket purchases. It’s better to have a part interest in the Hope Diamond than to own all of a rhinestone. A truly great business must have an enduring “moat” that protects excellent returns on invested capital. The dynamics of capitalism guarantee that competitors will repeatedly assault any business “castle” that is earning high returns. Therefore a formidable barrier such as a company’s being the lowcost producer (GEICO, Costco) or possessing a powerful world-wide brand (Coca-Cola, Gillette, American Express) is essential for sustained success. Business history is filled with “Roman Candles,” companies whose moats proved illusory and were soon crossed. Our criterion of “enduring” causes us to rule out companies in industries prone to rapid and continuous change. Though capitalism’s “creative destruction” is highly beneficial for society, it precludes investment certainty. A moat that must be continuously rebuilt will eventually be no moat at all. Additionally, this criterion eliminates the business whose success depends on having a great manager. Of course, a terrific CEO is a huge asset for any enterprise, and at Berkshire we have an abundance of these managers. Their abilities have created billions of dollars of value that would never have materialized if typical CEOs had been running their businesses. But if a business requires a superstar to produce great results, the business itself cannot be deemed great. A medical partnership led by your area’s premier brain surgeon may enjoy outsized and growing earnings, but that tells little about its future. The partnership’s moat will go when the surgeon goes. You can count, though, on the moat of the Mayo Clinic to endure, even though you can’t name its CEO. Long-term competitive advantage in a stable industry is what we seek in a business. If that comes with rapid organic growth, great. But even without organic growth, such a business is rewarding. We will simply take the lush earnings of the business and use them to buy similar businesses elsewhere. There’s no rule that you have to invest money where you’ve earned it. Indeed, it’s often a mistake to do so: Truly great businesses, earning huge returns on tangible assets, can’t for any extended period reinvest a large portion of their earnings internally at high rates of return. Let’s look at the prototype of a dream business, our own See’s Candy. The boxed-chocolates industry in which it operates is unexciting: Per-capita consumption in the U.S. is extremely low and doesn’t grow. Many once-important brands have disappeared, and only three companies have earned more than token profits over the last forty years. Indeed, I believe that See’s, though it obtains the bulk of its revenues from only a few states, accounts for nearly half of the entire industry’s earnings. At See’s, annual sales were 16 million pounds of candy when Blue Chip Stamps purchased the company in 1972. (Charlie and I controlled Blue Chip at the time and later
82
merged it into Berkshire.) Last year See’s sold 31 million pounds, a growth rate of only 2% annually. Yet its durable competitive advantage, built by the See’s family over a 50-year period, and strengthened subsequently by Chuck Huggins and Brad Kinstler, has produced extraordinary results for Berkshire. We bought See’s for $25 million when its sales were $30 million and pre-tax earnings were less than $5 million. The capital then required to conduct the business was $8 million. (Modest seasonal debt was also needed for a few months each year.) Consequently, the company was earning 60% pre-tax on invested capital. Two factors helped to minimize the funds required for operations. First, the product was sold for cash, and that eliminated accounts receivable. Second, the production and distribution cycle was short, which minimized inventories. Last year See’s sales were $383 million, and pre-tax profits were $82 million. The capital now required to run the business is $40 million. This means we have had to reinvest only $32 million since 1972 to handle the modest physical growth – and somewhat immodest financial growth – of the business. In the meantime pre-tax earnings have totaled $1.35 billion. All of that, except for the $32 million, has been sent to Berkshire (or, in the early years, to Blue Chip). After paying corporate taxes on the profits, we have used the rest to buy other attractive businesses. Just as Adam and Eve kick-started an activity that led to six billion humans, See’s has given birth to multiple new streams of cash for us. (The biblical command to “be fruitful and multiply” is one we take seriously at Berkshire.) There aren’t many See’s in Corporate America. Typically, companies that increase their earnings from $5 million to $82 million require, say, $400 million or so of capital investment to finance their growth. That’s because growing businesses have both working capital needs that increase in proportion to sales growth and significant requirements for fixed asset investments. A company that needs large increases in capital to engender its growth may well prove to be a satisfactory investment. There is, to follow through on our example, nothing shabby about earning $82 million pre-tax on $400 million of net tangible assets. But that equation for the owner is vastly different from the See’s situation. It’s far better to have an ever-increasing stream of earnings with virtually no major capital requirements. Ask Microsoft or Google. One example of good, but far from sensational, business economics is our own FlightSafety. This company delivers benefits to its customers that are the equal of those delivered by any business that I know of. It also possesses a durable competitive advantage: Going to any other flight-training provider than the best is like taking the low bid on a surgical procedure. Nevertheless, this business requires a significant reinvestment of earnings if it is to grow. When we purchased FlightSafety in 1996, its pre-tax operating earnings were $111 million, and its net investment in fixed assets was $570 million. Since our purchase, depreciation charges have totaled $923 million. But capital expenditures have totaled
83
$1.635 billion, most of that for simulators to match the new airplane models that are constantly being introduced. (A simulator can cost us more than $12 million, and we have 273 of them.) Our fixed assets, after depreciation, now amount to $1.079 billion. Pre-tax operating earnings in 2007 were $270 million, a gain of $159 million since 1996. That gain gave us a good, but far from See’s-like, return on our incremental investment of $509 million. Consequently, if measured only by economic returns, FlightSafety is an excellent but not extraordinary business. Its put-up-more-to-earn-more experience is that faced by most corporations. For example, our large investment in regulated utilities falls squarely in this category. We will earn considerably more money in this business ten years from now, but we will invest many billions to make it. Now let’s move to the gruesome. The worst sort of business is one that grows rapidly, requires significant capital to engender the growth, and then earns little or no money. Think airlines. Here a durable competitive advantage has proven elusive ever since the days of the Wright Brothers. Indeed, if a farsighted capitalist had been present at Kitty Hawk, he would have done his successors a huge favor by shooting Orville down. The airline industry’s demand for capital ever since that first flight has been insatiable. Investors have poured money into a bottomless pit, attracted by growth when they should have been repelled by it. And I, to my shame, participated in this foolishness when I had Berkshire buy U.S. Air preferred stock in 1989. As the ink was drying on our check, the company went into a tailspin, and before long our preferred dividend was no longer being paid. But we then got very lucky. In one of the recurrent, but always misguided, bursts of optimism for airlines, we were actually able to sell our shares in 1998 for a hefty gain. In the decade following our sale, the company went bankrupt. Twice. To sum up, think of three types of “savings accounts.” The great one pays an extraordinarily high interest rate that will rise as the years pass. The good one pays an attractive rate of interest that will be earned also on deposits that are added. Finally, the gruesome account both pays an inadequate interest rate and requires you to keep adding money at those disappointing returns.
* * * * * * * * * * * * And now it’s confession time. It should be noted that no consultant, board of directors or investment banker pushed me into the mistakes I will describe. In tennis parlance, they were all unforced errors. To begin with, I almost blew the See’s purchase. The seller was asking $30 million, and I was adamant about not going above $25 million. Fortunately, he caved. Otherwise I would have balked, and that $1.35 billion would have gone to somebody else. About the time of the See’s purchase, Tom Murphy, then running Capital Cities Broadcasting, called and offered me the Dallas-Fort Worth NBC station for $35 million. The station came with the Fort Worth paper that Capital Cities was buying, and under the “cross-ownership” rules Murph had to divest it. I knew that TV stations were See’s-like
84
businesses that required virtually no capital investment and had excellent prospects for growth. They were simple to run and showered cash on their owners. Moreover, Murph, then as now, was a close friend, a man I admired as an extraordinary manager and outstanding human being. He knew the television business forward and backward and would not have called me unless he felt a purchase was certain to work. In effect Murph whispered “buy” into my ear. But I didn’t listen. In 2006, the station earned $73 million pre-tax, bringing its total earnings since I turned down the deal to at least $1 billion – almost all available to its owner for other purposes. Moreover, the property now has a capital value of about $800 million. Why did I say “no”? The only explanation is that my brain had gone on vacation and forgot to notify me. (My behavior resembled that of a politician Molly Ivins once described: “If his I.Q. was any lower, you would have to water him twice a day.”) Finally, I made an even worse mistake when I said “yes” to Dexter, a shoe business I bought in 1993 for $433 million in Berkshire stock (25,203 shares of A). What I had assessed as durable competitive advantage vanished within a few years. But that’s just the beginning: By using Berkshire stock, I compounded this error hugely. That move made the cost to Berkshire shareholders not $400 million, but rather $3.5 billion. In essence, I gave away 1.6% of a wonderful business – one now valued at $220 billion – to buy a worthless business. To date, Dexter is the worst deal that I’ve made. But I’ll make more mistakes in the future – you can bet on that. A line from Bobby Bare’s country song explains what too often happens with acquisitions: “I’ve never gone to bed with an ugly woman, but I’ve sure woke up with a few.” 2008 As the year progressed, a series of life-threatening problems within many of the world’s great financial institutions was unveiled. This led to a dysfunctional credit market that in important respects soon turned non-functional. The watchword throughout the country became the creed I saw on restaurant walls when I was young: “In God we trust; all others pay cash.” By the fourth quarter, the credit crisis, coupled with tumbling home and stock prices, had produced a paralyzing fear that engulfed the country. A freefall in business activity ensued, accelerating at a pace that I have never before witnessed. The U.S. – and much of the world – became trapped in a vicious negative-feedback cycle. Fear led to business contraction, and that in turn led to even greater fear. This debilitating spiral has spurred our government to take massive action. In poker terms, the Treasury and the Fed have gone “all in.” Economic medicine that was previously meted out by the cupful has recently been dispensed by the barrel. These once-unthinkable dosages will almost certainly bring on unwelcome aftereffects. Their
85
precise nature is anyone’s guess, though one likely consequence is an onslaught of inflation. Moreover, major industries have become dependent on Federal assistance, and they will be followed by cities and states bearing mind-boggling requests. Weaning these entities from the public teat will be a political challenge. They won’t leave willingly. Whatever the downsides may be, strong and immediate action by government was essential last year if the financial system was to avoid a total breakdown. Had that occurred, the consequences for every area of our economy would have been cataclysmic. Like it or not, the inhabitants of Wall Street, Main Street and the various Side Streets of America were all in the same boat. Amid this bad news, however, never forget that our country has faced far worse travails in the past. In the 20th Century alone, we dealt with two great wars (one of which we initially appeared to be losing); a dozen or so panics and recessions; virulent inflation that led to a 211⁄2% prime rate in 1980; and the Great Depression of the 1930s, when unemployment ranged between 15% and 25% for many years. America has had no shortage of challenges. Without fail, however, we’ve overcome them. In the face of those obstacles – and many others – the real standard of living for Americans improved nearly seven-fold during the 1900s, while the Dow Jones Industrials rose from 66 to 11,497. Compare the record of this period with the dozens of centuries during which humans secured only tiny gains, if any, in how they lived. Though the path has not been smooth, our economic system has worked extraordinarily well over time. It has unleashed human potential as no other system has, and it will continue to do so. America’s best days lie ahead. Take a look again at the 44-year table on page 2. In 75% of those years, the S&P stocks recorded a gain. I would guess that a roughly similar percentage of years will be positive in the next 44. But neither Charlie Munger, my partner in running Berkshire, nor I can predict the winning and losing years in advance. (In our usual opinionated view, we don’t think anyone else can either.) We’re certain, for example, that the economy will be in shambles throughout 2009 – and, for that matter, probably well beyond – but that conclusion does not tell us whether the stock market will rise or fall. In good years and bad, Charlie and I simply focus on four goals: (1) maintaining Berkshire’s Gibraltar-like financial position, which features huge amounts of excess liquidity, near-term obligations that are modest, and dozens of sources of earnings and cash; (2) widening the “moats” around our operating businesses that give them durable competitive advantages; (3) acquiring and developing new and varied streams of earnings; (4) expanding and nurturing the cadre of outstanding operating managers who, over the years, have delivered Berkshire exceptional results.
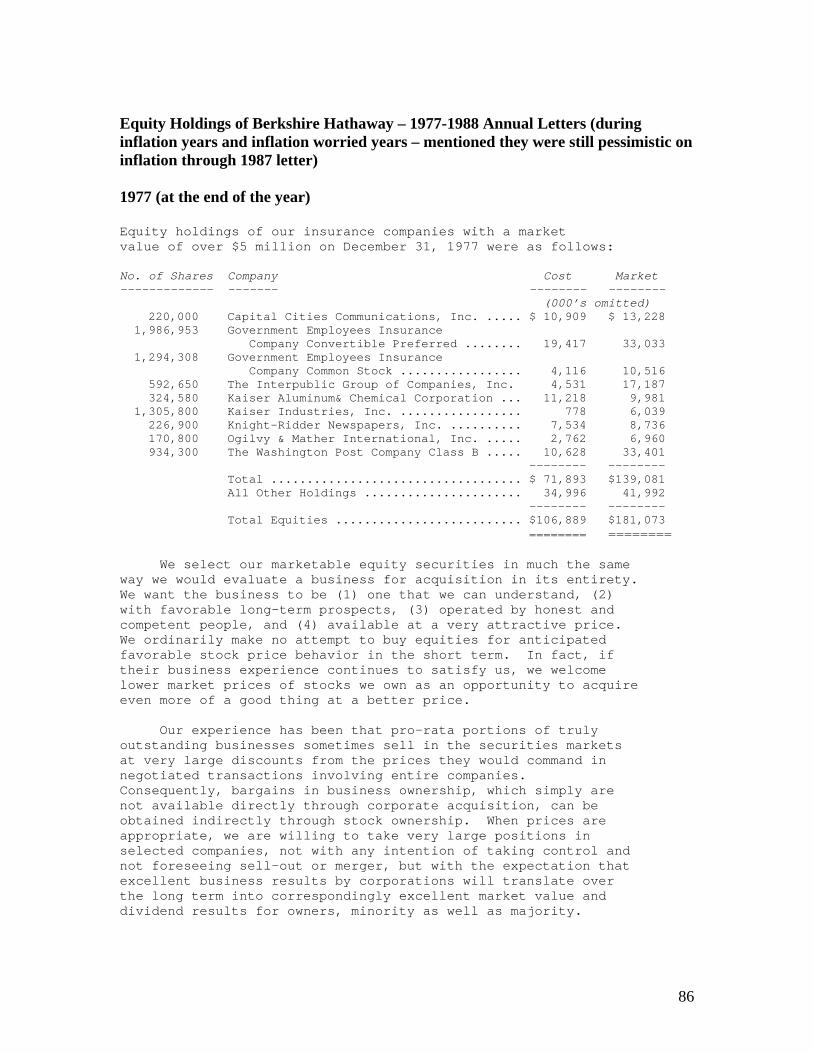
86
Equity Holdings of Berkshire Hathaway – 1977-1988 Annual Letters (during inflation years and inflation worried years – mentioned they were still pessimistic on inflation through 1987 letter) 1977 (at the end of the year) Equity holdings of our insurance companies with a market value of over $5 million on December 31, 1977 were as follows: No. of Shares Company Cost Market ------------- ------- -------- -------- (000’s omitted) 220,000 Capital Cities Communications, Inc. ..... $ 10,909 $ 13,228 1,986,953 Government Employees Insurance Company Convertible Preferred ........ 19,417 33,033 1,294,308 Government Employees Insurance Company Common Stock ................. 4,116 10,516 592,650 The Interpublic Group of Companies, Inc. 4,531 17,187 324,580 Kaiser Aluminum& Chemical Corporation ... 11,218 9,981 1,305,800 Kaiser Industries, Inc. ................. 778 6,039 226,900 Knight-Ridder Newspapers, Inc. .......... 7,534 8,736 170,800 Ogilvy & Mather International, Inc. ..... 2,762 6,960 934,300 The Washington Post Company Class B ..... 10,628 33,401 -------- -------- Total ................................... $ 71,893 $139,081 All Other Holdings ...................... 34,996 41,992 -------- -------- Total Equities .......................... $106,889 $181,073 ======== ======== We select our marketable equity securities in much the same way we would evaluate a business for acquisition in its entirety. We want the business to be (1) one that we can understand, (2) with favorable long-term prospects, (3) operated by honest and competent people, and (4) available at a very attractive price. We ordinarily make no attempt to buy equities for anticipated favorable stock price behavior in the short term. In fact, if their business experience continues to satisfy us, we welcome lower market prices of stocks we own as an opportunity to acquire even more of a good thing at a better price. Our experience has been that pro-rata portions of truly outstanding businesses sometimes sell in the securities markets at very large discounts from the prices they would command in negotiated transactions involving entire companies. Consequently, bargains in business ownership, which simply are not available directly through corporate acquisition, can be obtained indirectly through stock ownership. When prices are appropriate, we are willing to take very large positions in selected companies, not with any intention of taking control and not foreseeing sell-out or merger, but with the expectation that excellent business results by corporations will translate over the long term into correspondingly excellent market value and dividend results for owners, minority as well as majority.
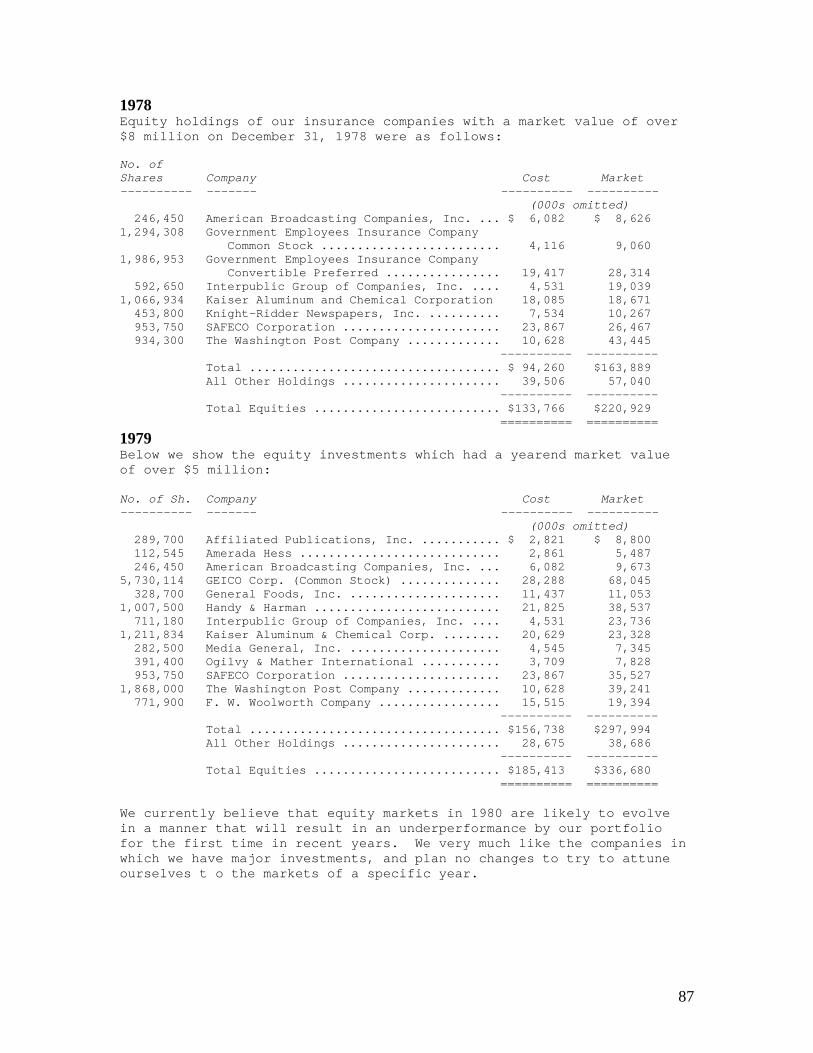
87
1978 Equity holdings of our insurance companies with a market value of over $8 million on December 31, 1978 were as follows: No. of Shares Company Cost Market ---------- ------- ---------- ---------- (000s omitted) 246,450 American Broadcasting Companies, Inc. ... $ 6,082 $ 8,626 1,294,308 Government Employees Insurance Company Common Stock ......................... 4,116 9,060 1,986,953 Government Employees Insurance Company Convertible Preferred ................ 19,417 28,314 592,650 Interpublic Group of Companies, Inc. .... 4,531 19,039 1,066,934 Kaiser Aluminum and Chemical Corporation 18,085 18,671 453,800 Knight-Ridder Newspapers, Inc. .......... 7,534 10,267 953,750 SAFECO Corporation ...................... 23,867 26,467 934,300 The Washington Post Company ............. 10,628 43,445 ---------- ---------- Total ................................... $ 94,260 $163,889 All Other Holdings ...................... 39,506 57,040 ---------- ---------- Total Equities .......................... $133,766 $220,929 ========== ==========
1979 Below we show the equity investments which had a yearend market value of over $5 million: No. of Sh. Company Cost Market ---------- ------- ---------- ---------- (000s omitted) 289,700 Affiliated Publications, Inc. ........... $ 2,821 $ 8,800 112,545 Amerada Hess ............................ 2,861 5,487 246,450 American Broadcasting Companies, Inc. ... 6,082 9,673 5,730,114 GEICO Corp. (Common Stock) .............. 28,288 68,045 328,700 General Foods, Inc. ..................... 11,437 11,053 1,007,500 Handy & Harman .......................... 21,825 38,537 711,180 Interpublic Group of Companies, Inc. .... 4,531 23,736 1,211,834 Kaiser Aluminum & Chemical Corp. ........ 20,629 23,328 282,500 Media General, Inc. ..................... 4,545 7,345 391,400 Ogilvy & Mather International ........... 3,709 7,828 953,750 SAFECO Corporation ...................... 23,867 35,527 1,868,000 The Washington Post Company ............. 10,628 39,241 771,900 F. W. Woolworth Company ................. 15,515 19,394 ---------- ---------- Total ................................... $156,738 $297,994 All Other Holdings ...................... 28,675 38,686 ---------- ---------- Total Equities .......................... $185,413 $336,680 ========== ========== We currently believe that equity markets in 1980 are likely to evolve in a manner that will result in an underperformance by our portfolio for the first time in recent years. We very much like the companies in which we have major investments, and plan no changes to try to attune ourselves t o the markets of a specific year.
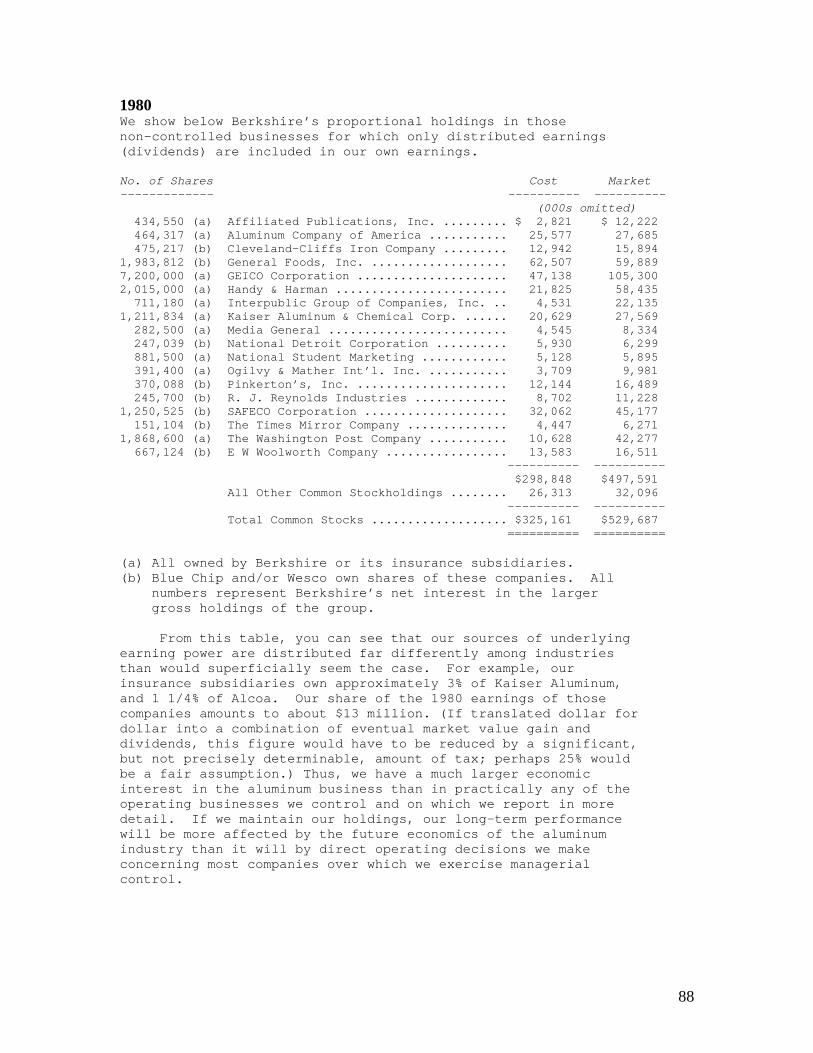
88
1980 We show below Berkshire’s proportional holdings in those non-controlled businesses for which only distributed earnings (dividends) are included in our own earnings. No. of Shares Cost Market ------------- ---------- ---------- (000s omitted) 434,550 (a) Affiliated Publications, Inc. ......... $ 2,821 $ 12,222 464,317 (a) Aluminum Company of America ........... 25,577 27,685 475,217 (b) Cleveland-Cliffs Iron Company ......... 12,942 15,894 1,983,812 (b) General Foods, Inc. ................... 62,507 59,889 7,200,000 (a) GEICO Corporation ..................... 47,138 105,300 2,015,000 (a) Handy & Harman ........................ 21,825 58,435 711,180 (a) Interpublic Group of Companies, Inc. .. 4,531 22,135 1,211,834 (a) Kaiser Aluminum & Chemical Corp. ...... 20,629 27,569 282,500 (a) Media General ......................... 4,545 8,334 247,039 (b) National Detroit Corporation .......... 5,930 6,299 881,500 (a) National Student Marketing ............ 5,128 5,895 391,400 (a) Ogilvy & Mather Int’l. Inc. ........... 3,709 9,981 370,088 (b) Pinkerton’s, Inc. ..................... 12,144 16,489 245,700 (b) R. J. Reynolds Industries ............. 8,702 11,228 1,250,525 (b) SAFECO Corporation .................... 32,062 45,177 151,104 (b) The Times Mirror Company .............. 4,447 6,271 1,868,600 (a) The Washington Post Company ........... 10,628 42,277 667,124 (b) E W Woolworth Company ................. 13,583 16,511 ---------- ---------- $298,848 $497,591 All Other Common Stockholdings ........ 26,313 32,096 ---------- ---------- Total Common Stocks ................... $325,161 $529,687 ========== ========== (a) All owned by Berkshire or its insurance subsidiaries. (b) Blue Chip and/or Wesco own shares of these companies. All numbers represent Berkshire’s net interest in the larger gross holdings of the group. From this table, you can see that our sources of underlying earning power are distributed far differently among industries than would superficially seem the case. For example, our insurance subsidiaries own approximately 3% of Kaiser Aluminum, and 1 1/4% of Alcoa. Our share of the 1980 earnings of those companies amounts to about $13 million. (If translated dollar for dollar into a combination of eventual market value gain and dividends, this figure would have to be reduced by a significant, but not precisely determinable, amount of tax; perhaps 25% would be a fair assumption.) Thus, we have a much larger economic interest in the aluminum business than in practically any of the operating businesses we control and on which we report in more detail. If we maintain our holdings, our long-term performance will be more affected by the future economics of the aluminum industry than it will by direct operating decisions we make concerning most companies over which we exercise managerial control.
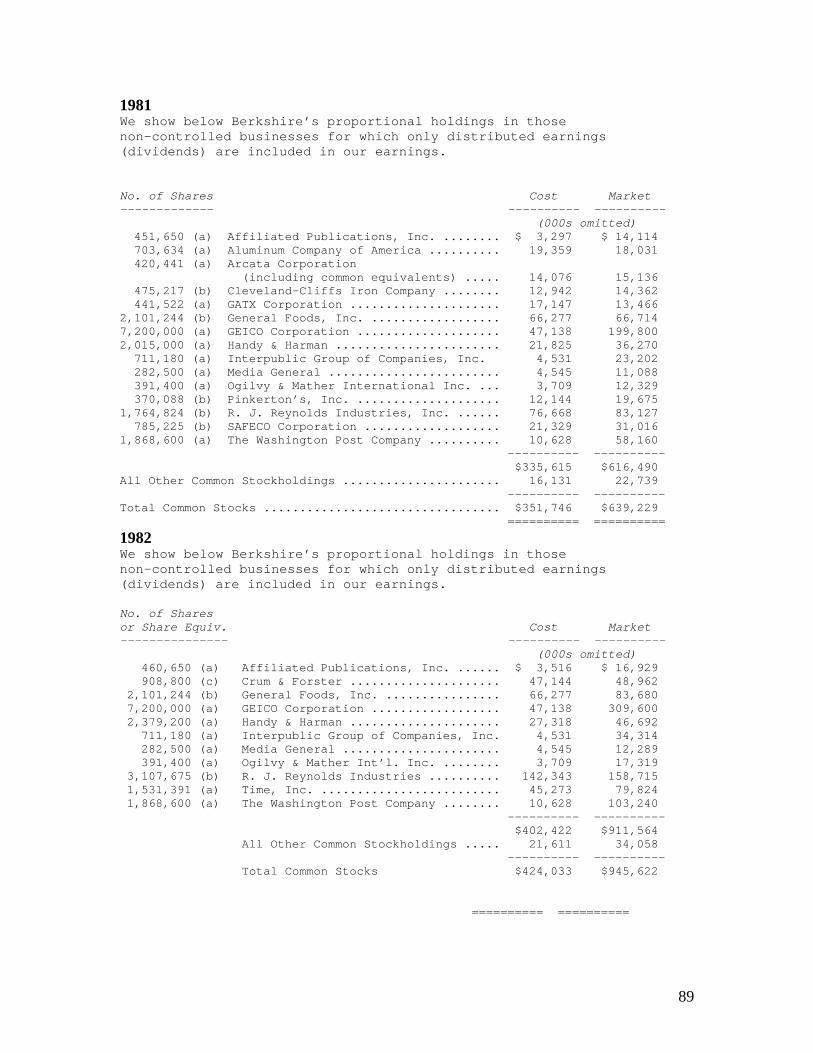
89
1981 We show below Berkshire’s proportional holdings in those non-controlled businesses for which only distributed earnings (dividends) are included in our earnings. No. of Shares Cost Market ------------- ---------- ---------- (000s omitted) 451,650 (a) Affiliated Publications, Inc. ........ $ 3,297 $ 14,114 703,634 (a) Aluminum Company of America .......... 19,359 18,031 420,441 (a) Arcata Corporation (including common equivalents) ..... 14,076 15,136 475,217 (b) Cleveland-Cliffs Iron Company ........ 12,942 14,362 441,522 (a) GATX Corporation ..................... 17,147 13,466 2,101,244 (b) General Foods, Inc. .................. 66,277 66,714 7,200,000 (a) GEICO Corporation .................... 47,138 199,800 2,015,000 (a) Handy & Harman ....................... 21,825 36,270 711,180 (a) Interpublic Group of Companies, Inc. 4,531 23,202 282,500 (a) Media General ........................ 4,545 11,088 391,400 (a) Ogilvy & Mather International Inc. ... 3,709 12,329 370,088 (b) Pinkerton’s, Inc. .................... 12,144 19,675 1,764,824 (b) R. J. Reynolds Industries, Inc. ...... 76,668 83,127 785,225 (b) SAFECO Corporation ................... 21,329 31,016 1,868,600 (a) The Washington Post Company .......... 10,628 58,160 ---------- ---------- $335,615 $616,490 All Other Common Stockholdings ...................... 16,131 22,739 ---------- ---------- Total Common Stocks ................................. $351,746 $639,229 ========== ==========
1982 We show below Berkshire’s proportional holdings in those non-controlled businesses for which only distributed earnings (dividends) are included in our earnings. No. of Shares or Share Equiv. Cost Market --------------- ---------- ---------- (000s omitted) 460,650 (a) Affiliated Publications, Inc. ...... $ 3,516 $ 16,929 908,800 (c) Crum & Forster ..................... 47,144 48,962 2,101,244 (b) General Foods, Inc. ................ 66,277 83,680 7,200,000 (a) GEICO Corporation .................. 47,138 309,600 2,379,200 (a) Handy & Harman ..................... 27,318 46,692 711,180 (a) Interpublic Group of Companies, Inc. 4,531 34,314 282,500 (a) Media General ...................... 4,545 12,289 391,400 (a) Ogilvy & Mather Int’l. Inc. ........ 3,709 17,319 3,107,675 (b) R. J. Reynolds Industries .......... 142,343 158,715 1,531,391 (a) Time, Inc. ......................... 45,273 79,824 1,868,600 (a) The Washington Post Company ........ 10,628 103,240 ---------- ---------- $402,422 $911,564 All Other Common Stockholdings ..... 21,611 34,058 ---------- ---------- Total Common Stocks $424,033 $945,622 ========== ==========
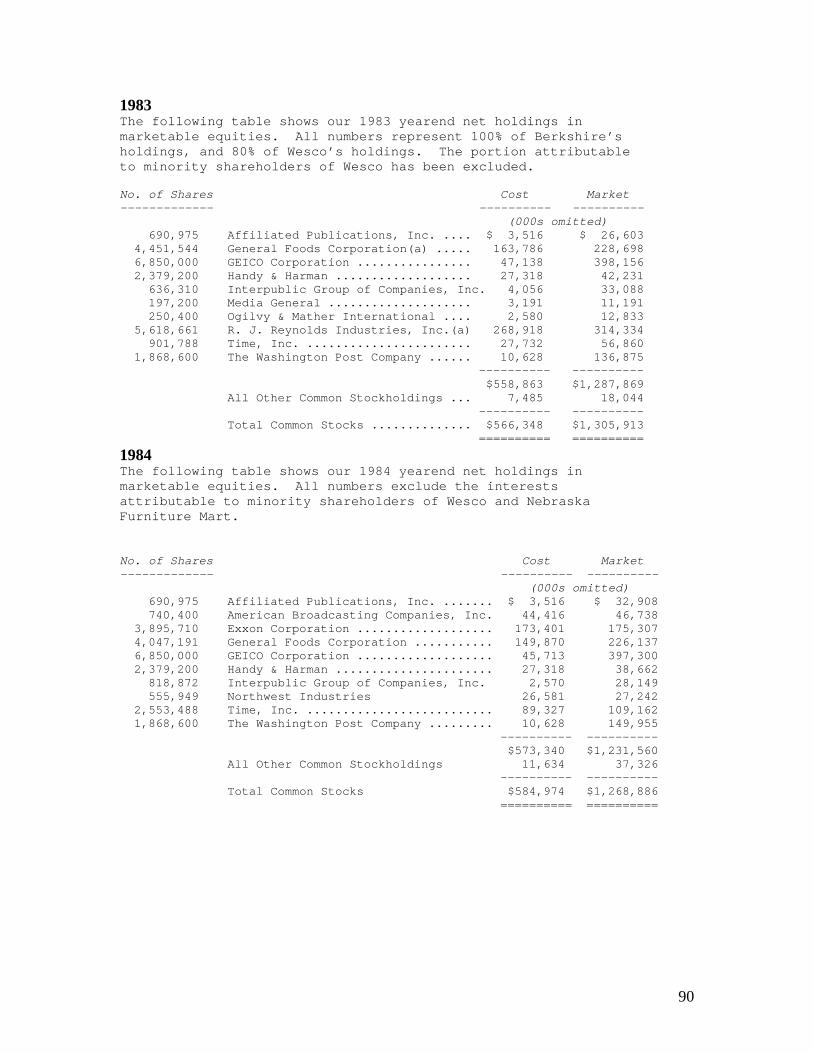
90
1983 The following table shows our 1983 yearend net holdings in marketable equities. All numbers represent 100% of Berkshire’s holdings, and 80% of Wesco’s holdings. The portion attributable to minority shareholders of Wesco has been excluded. No. of Shares Cost Market ------------- ---------- ---------- (000s omitted) 690,975 Affiliated Publications, Inc. .... $ 3,516 $ 26,603 4,451,544 General Foods Corporation(a) ..... 163,786 228,698 6,850,000 GEICO Corporation ................ 47,138 398,156 2,379,200 Handy & Harman ................... 27,318 42,231 636,310 Interpublic Group of Companies, Inc. 4,056 33,088 197,200 Media General .................... 3,191 11,191 250,400 Ogilvy & Mather International .... 2,580 12,833 5,618,661 R. J. Reynolds Industries, Inc.(a) 268,918 314,334 901,788 Time, Inc. ....................... 27,732 56,860 1,868,600 The Washington Post Company ...... 10,628 136,875 ---------- ---------- $558,863 $1,287,869 All Other Common Stockholdings ... 7,485 18,044 ---------- ---------- Total Common Stocks .............. $566,348 $1,305,913 ========== ==========
1984 The following table shows our 1984 yearend net holdings in marketable equities. All numbers exclude the interests attributable to minority shareholders of Wesco and Nebraska Furniture Mart. No. of Shares Cost Market ------------- ---------- ---------- (000s omitted) 690,975 Affiliated Publications, Inc. ....... $ 3,516 $ 32,908 740,400 American Broadcasting Companies, Inc. 44,416 46,738 3,895,710 Exxon Corporation ................... 173,401 175,307 4,047,191 General Foods Corporation ........... 149,870 226,137 6,850,000 GEICO Corporation ................... 45,713 397,300 2,379,200 Handy & Harman ...................... 27,318 38,662 818,872 Interpublic Group of Companies, Inc. 2,570 28,149 555,949 Northwest Industries 26,581 27,242 2,553,488 Time, Inc. .......................... 89,327 109,162 1,868,600 The Washington Post Company ......... 10,628 149,955 ---------- ---------- $573,340 $1,231,560 All Other Common Stockholdings 11,634 37,326 ---------- ---------- Total Common Stocks $584,974 $1,268,886 ========== ==========
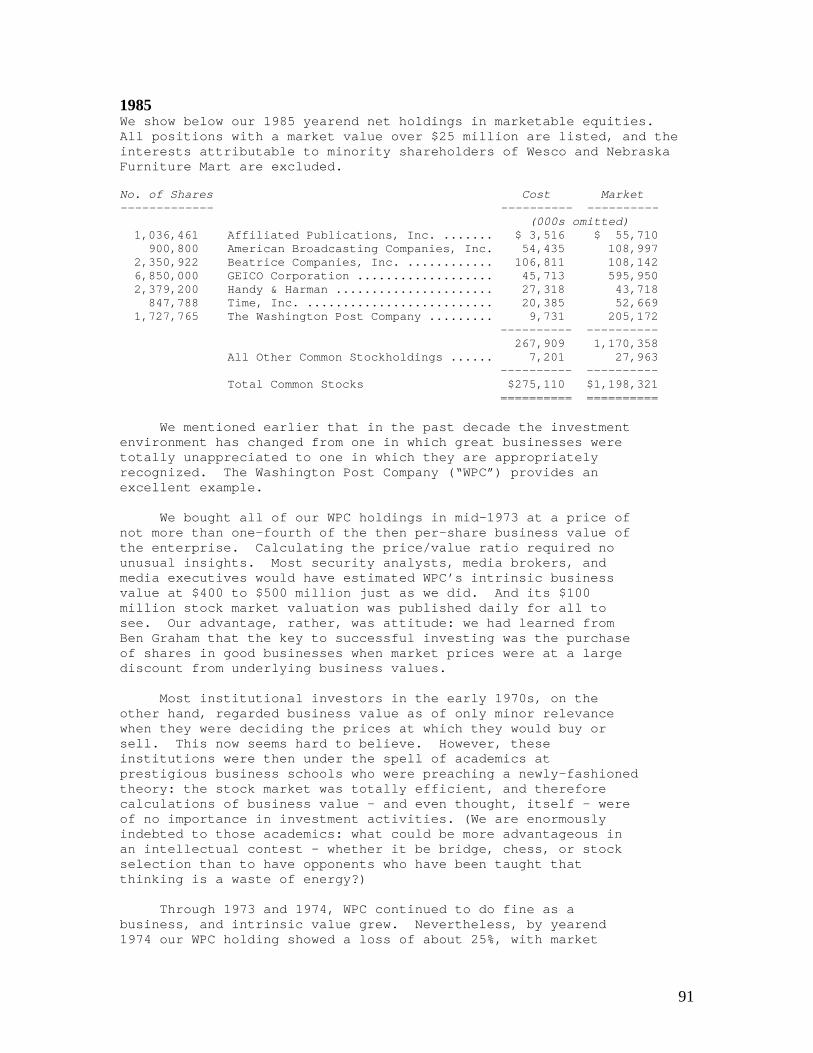
91
1985 We show below our 1985 yearend net holdings in marketable equities. All positions with a market value over $25 million are listed, and the interests attributable to minority shareholders of Wesco and Nebraska Furniture Mart are excluded. No. of Shares Cost Market ------------- ---------- ---------- (000s omitted) 1,036,461 Affiliated Publications, Inc. ....... $ 3,516 $ 55,710 900,800 American Broadcasting Companies, Inc. 54,435 108,997 2,350,922 Beatrice Companies, Inc. ............ 106,811 108,142 6,850,000 GEICO Corporation ................... 45,713 595,950 2,379,200 Handy & Harman ...................... 27,318 43,718 847,788 Time, Inc. .......................... 20,385 52,669 1,727,765 The Washington Post Company ......... 9,731 205,172 ---------- ---------- 267,909 1,170,358 All Other Common Stockholdings ...... 7,201 27,963 ---------- ---------- Total Common Stocks $275,110 $1,198,321 ========== ========== We mentioned earlier that in the past decade the investment environment has changed from one in which great businesses were totally unappreciated to one in which they are appropriately recognized. The Washington Post Company (“WPC”) provides an excellent example. We bought all of our WPC holdings in mid-1973 at a price of not more than one-fourth of the then per-share business value of the enterprise. Calculating the price/value ratio required no unusual insights. Most security analysts, media brokers, and media executives would have estimated WPC’s intrinsic business value at $400 to $500 million just as we did. And its $100 million stock market valuation was published daily for all to see. Our advantage, rather, was attitude: we had learned from Ben Graham that the key to successful investing was the purchase of shares in good businesses when market prices were at a large discount from underlying business values. Most institutional investors in the early 1970s, on the other hand, regarded business value as of only minor relevance when they were deciding the prices at which they would buy or sell. This now seems hard to believe. However, these institutions were then under the spell of academics at prestigious business schools who were preaching a newly-fashioned theory: the stock market was totally efficient, and therefore calculations of business value - and even thought, itself - were of no importance in investment activities. (We are enormously indebted to those academics: what could be more advantageous in an intellectual contest - whether it be bridge, chess, or stock selection than to have opponents who have been taught that thinking is a waste of energy?) Through 1973 and 1974, WPC continued to do fine as a business, and intrinsic value grew. Nevertheless, by yearend 1974 our WPC holding showed a loss of about 25%, with market
92
value at $8 million against our cost of $10.6 million. What we had thought ridiculously cheap a year earlier had become a good bit cheaper as the market, in its infinite wisdom, marked WPC stock down to well below 20 cents on the dollar of intrinsic value. You know the happy outcome. Kay Graham, CEO of WPC, had the brains and courage to repurchase large quantities of stock for the company at those bargain prices, as well as the managerial skills necessary to dramatically increase business values. Meanwhile, investors began to recognize the exceptional economics of the business and the stock price moved closer to underlying value. Thus, we experienced a triple dip: the company’s business value soared upward, per-share business value increased considerably faster because of stock repurchases and, with a narrowing of the discount, the stock price outpaced the gain in per-share business value. We hold all of the WPC shares we bought in 1973, except for those sold back to the company in 1985’s proportionate redemption. Proceeds from the redemption plus yearend market value of our holdings total $221 million. If we had invested our $10.6 million in any of a half-dozen media companies that were investment favorites in mid-1973, the value of our holdings at yearend would have been in the area of $40 - $60 million. Our gain would have far exceeded the gain in the general market, an outcome reflecting the exceptional economics of the media business. The extra $160 million or so we gained through ownership of WPC came, in very large part, from the superior nature of the managerial decisions made by Kay as compared to those made by managers of most media companies. Her stunning business success has in large part gone unreported but among Berkshire shareholders it should not go unappreciated. Our Capital Cities purchase, described in the next section, required me to leave the WPC Board early in 1986. But we intend to hold indefinitely whatever WPC stock FCC rules allow us to. We expect WPC’s business values to grow at a reasonable rate, and we know that management is both able and shareholder-oriented. However, the market now values the company at over $1.8 billion, and there is no way that the value can progress from that level at a rate anywhere close to the rate possible when the company’s valuation was only $100 million. Because market prices have also been bid up for our other holdings, we face the same vastly- reduced potential throughout our portfolio. You will notice that we had a significant holding in Beatrice Companies at yearend. This is a short-term arbitrage holding - in effect, a parking place for money (though not a totally safe one, since deals sometimes fall through and create substantial losses). We sometimes enter the arbitrage field when we have more money than ideas, but only to participate in announced mergers and sales. We would be a lot happier if the funds currently employed on this short-term basis found a long- term home. At the moment, however, prospects are bleak.
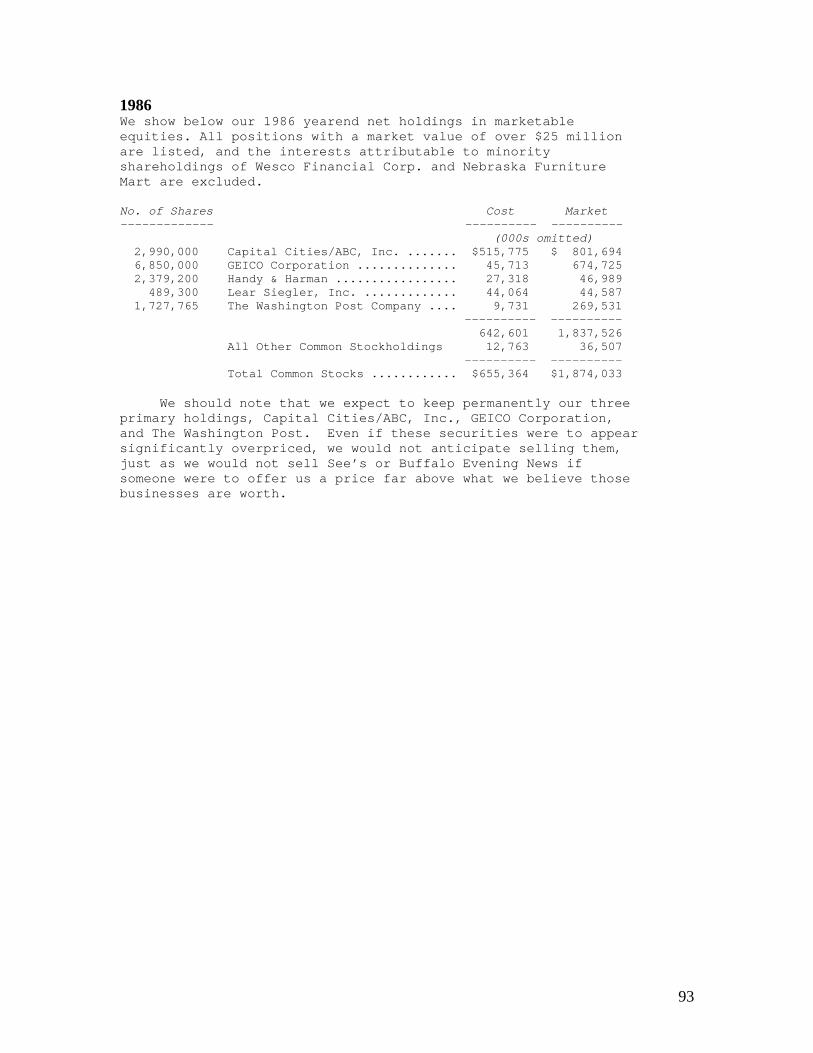
93
1986 We show below our 1986 yearend net holdings in marketable equities. All positions with a market value of over $25 million are listed, and the interests attributable to minority shareholdings of Wesco Financial Corp. and Nebraska Furniture Mart are excluded. No. of Shares Cost Market ------------- ---------- ---------- (000s omitted) 2,990,000 Capital Cities/ABC, Inc. ....... $515,775 $ 801,694 6,850,000 GEICO Corporation .............. 45,713 674,725 2,379,200 Handy & Harman ................. 27,318 46,989 489,300 Lear Siegler, Inc. ............. 44,064 44,587 1,727,765 The Washington Post Company .... 9,731 269,531 ---------- ---------- 642,601 1,837,526 All Other Common Stockholdings 12,763 36,507 ---------- ---------- Total Common Stocks ............ $655,364 $1,874,033 We should note that we expect to keep permanently our three primary holdings, Capital Cities/ABC, Inc., GEICO Corporation, and The Washington Post. Even if these securities were to appear significantly overpriced, we would not anticipate selling them, just as we would not sell See’s or Buffalo Evening News if someone were to offer us a price far above what we believe those businesses are worth.
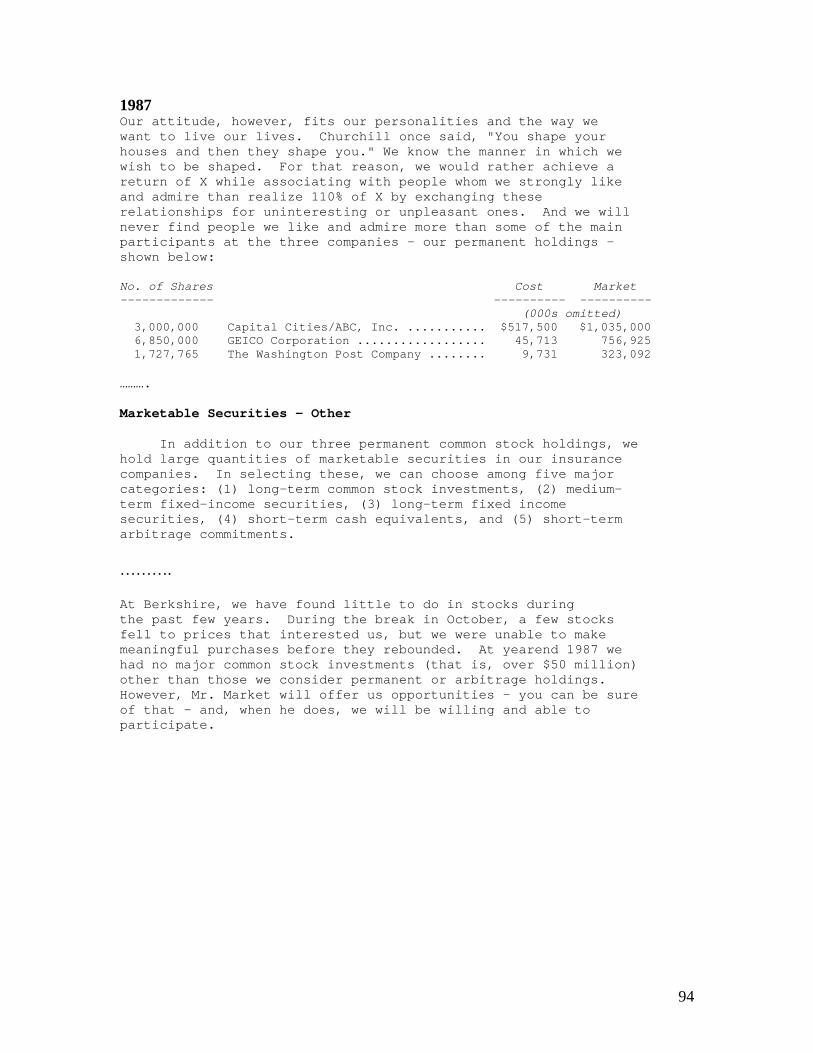
94
1987 Our attitude, however, fits our personalities and the way we want to live our lives. Churchill once said, "You shape your houses and then they shape you." We know the manner in which we wish to be shaped. For that reason, we would rather achieve a return of X while associating with people whom we strongly like and admire than realize 110% of X by exchanging these relationships for uninteresting or unpleasant ones. And we will never find people we like and admire more than some of the main participants at the three companies - our permanent holdings - shown below: No. of Shares Cost Market ------------- ---------- ---------- (000s omitted) 3,000,000 Capital Cities/ABC, Inc. ........... $517,500 $1,035,000 6,850,000 GEICO Corporation .................. 45,713 756,925 1,727,765 The Washington Post Company ........ 9,731 323,092 ………. Marketable Securities - Other In addition to our three permanent common stock holdings, we hold large quantities of marketable securities in our insurance companies. In selecting these, we can choose among five major categories: (1) long-term common stock investments, (2) medium- term fixed-income securities, (3) long-term fixed income securities, (4) short-term cash equivalents, and (5) short-term arbitrage commitments. ………. At Berkshire, we have found little to do in stocks during the past few years. During the break in October, a few stocks fell to prices that interested us, but we were unable to make meaningful purchases before they rebounded. At yearend 1987 we had no major common stock investments (that is, over $50 million) other than those we consider permanent or arbitrage holdings. However, Mr. Market will offer us opportunities - you can be sure of that - and, when he does, we will be willing and able to participate.
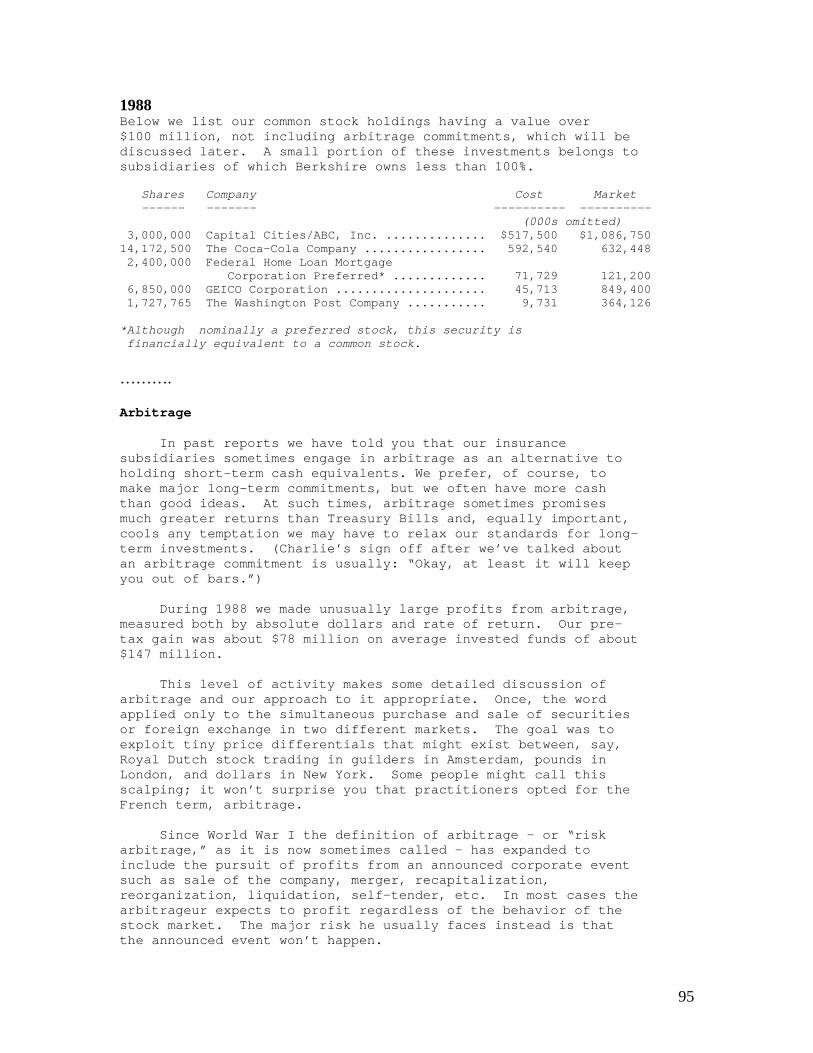
95
1988 Below we list our common stock holdings having a value over $100 million, not including arbitrage commitments, which will be discussed later. A small portion of these investments belongs to subsidiaries of which Berkshire owns less than 100%. Shares Company Cost Market ------ ------- ---------- ---------- (000s omitted) 3,000,000 Capital Cities/ABC, Inc. .............. $517,500 $1,086,750 14,172,500 The Coca-Cola Company ................. 592,540 632,448 2,400,000 Federal Home Loan Mortgage Corporation Preferred* ............. 71,729 121,200 6,850,000 GEICO Corporation ..................... 45,713 849,400 1,727,765 The Washington Post Company ........... 9,731 364,126 *Although nominally a preferred stock, this security is financially equivalent to a common stock.
………. Arbitrage In past reports we have told you that our insurance subsidiaries sometimes engage in arbitrage as an alternative to holding short-term cash equivalents. We prefer, of course, to make major long-term commitments, but we often have more cash than good ideas. At such times, arbitrage sometimes promises much greater returns than Treasury Bills and, equally important, cools any temptation we may have to relax our standards for long- term investments. (Charlie’s sign off after we’ve talked about an arbitrage commitment is usually: “Okay, at least it will keep you out of bars.”) During 1988 we made unusually large profits from arbitrage, measured both by absolute dollars and rate of return. Our pre- tax gain was about $78 million on average invested funds of about $147 million. This level of activity makes some detailed discussion of arbitrage and our approach to it appropriate. Once, the word applied only to the simultaneous purchase and sale of securities or foreign exchange in two different markets. The goal was to exploit tiny price differentials that might exist between, say, Royal Dutch stock trading in guilders in Amsterdam, pounds in London, and dollars in New York. Some people might call this scalping; it won’t surprise you that practitioners opted for the French term, arbitrage. Since World War I the definition of arbitrage - or “risk arbitrage,” as it is now sometimes called - has expanded to include the pursuit of profits from an announced corporate event such as sale of the company, merger, recapitalization, reorganization, liquidation, self-tender, etc. In most cases the arbitrageur expects to profit regardless of the behavior of the stock market. The major risk he usually faces instead is that the announced event won’t happen.
96
Some offbeat opportunities occasionally arise in the arbitrage field. I participated in one of these when I was 24 and working in New York for Graham-Newman Corp. Rockwood & Co., a Brooklyn based chocolate products company of limited profitability, had adopted LIFO inventory valuation in 1941 when cocoa was selling for 5¢ per pound. In 1954 a temporary shortage of cocoa caused the price to soar to over 60¢. Consequently Rockwood wished to unload its valuable inventory - quickly, before the price dropped. But if the cocoa had simply been sold off, the company would have owed close to a 50% tax on the proceeds. The 1954 Tax Code came to the rescue. It contained an arcane provision that eliminated the tax otherwise due on LIFO profits if inventory was distributed to shareholders as part of a plan reducing the scope of a corporation’s business. Rockwood decided to terminate one of its businesses, the sale of cocoa butter, and said 13 million pounds of its cocoa bean inventory was attributable to that activity. Accordingly, the company offered to repurchase its stock in exchange for the cocoa beans it no longer needed, paying 80 pounds of beans for each share. For several weeks I busily bought shares, sold beans, and made periodic stops at Schroeder Trust to exchange stock certificates for warehouse receipts. The profits were good and my only expense was subway tokens. The architect of Rockwood’s restructuring was an unknown, but brilliant Chicagoan, Jay Pritzker, then 32. If you’re familiar with Jay’s subsequent record, you won’t be surprised to hear the action worked out rather well for Rockwood’s continuing shareholders also. From shortly before the tender until shortly after it, Rockwood stock appreciated from 15 to 100, even though the company was experiencing large operating losses. Sometimes there is more to stock valuation than price-earnings ratios. In recent years, most arbitrage operations have involved takeovers, friendly and unfriendly. With acquisition fever rampant, with anti-trust challenges almost non-existent, and with bids often ratcheting upward, arbitrageurs have prospered mightily. They have not needed special talents to do well; the trick, a la Peter Sellers in the movie, has simply been “Being There.” In Wall Street the old proverb has been reworded: “Give a man a fish and you feed him for a day. Teach him how to arbitrage and you feed him forever.” (If, however, he studied at the Ivan Boesky School of Arbitrage, it may be a state institution that supplies his meals.) To evaluate arbitrage situations you must answer four questions: (1) How likely is it that the promised event will indeed occur? (2) How long will your money be tied up? (3) What chance is there that something still better will transpire - a competing takeover bid, for example? and (4) What will happen if the event does not take place because of anti-trust action, financing glitches, etc.?
97
Arcata Corp., one of our more serendipitous arbitrage experiences, illustrates the twists and turns of the business. On September 28, 1981 the directors of Arcata agreed in principle to sell the company to Kohlberg, Kravis, Roberts & Co. (KKR), then and now a major leveraged-buy out firm. Arcata was in the printing and forest products businesses and had one other thing going for it: In 1978 the U.S. Government had taken title to 10,700 acres of Arcata timber, primarily old-growth redwood, to expand Redwood National Park. The government had paid $97.9 million, in several installments, for this acreage, a sum Arcata was contesting as grossly inadequate. The parties also disputed the interest rate that should apply to the period between the taking of the property and final payment for it. The enabling legislation stipulated 6% simple interest; Arcata argued for a much higher and compounded rate. Buying a company with a highly-speculative, large-sized claim in litigation creates a negotiating problem, whether the claim is on behalf of or against the company. To solve this problem, KKR offered $37.00 per Arcata share plus two-thirds of any additional amounts paid by the government for the redwood lands. Appraising this arbitrage opportunity, we had to ask ourselves whether KKR would consummate the transaction since, among other things, its offer was contingent upon its obtaining “satisfactory financing.” A clause of this kind is always dangerous for the seller: It offers an easy exit for a suitor whose ardor fades between proposal and marriage. However, we were not particularly worried about this possibility because KKR’s past record for closing had been good. We also had to ask ourselves what would happen if the KKR deal did fall through, and here we also felt reasonably comfortable: Arcata’s management and directors had been shopping the company for some time and were clearly determined to sell. If KKR went away, Arcata would likely find another buyer, though of course, the price might be lower. Finally, we had to ask ourselves what the redwood claim might be worth. Your Chairman, who can’t tell an elm from an oak, had no trouble with that one: He coolly evaluated the claim at somewhere between zero and a whole lot. We started buying Arcata stock, then around $33.50, on September 30 and in eight weeks purchased about 400,000 shares, or 5% of the company. The initial announcement said that the $37.00 would be paid in January, 1982. Therefore, if everything had gone perfectly, we would have achieved an annual rate of return of about 40% - not counting the redwood claim, which would have been frosting. All did not go perfectly. In December it was announced that the closing would be delayed a bit. Nevertheless, a definitive agreement was signed on January 4. Encouraged, we raised our stake, buying at around $38.00 per share and increasing our holdings to 655,000 shares, or over 7% of the company. Our
98
willingness to pay up - even though the closing had been postponed - reflected our leaning toward “a whole lot” rather than “zero” for the redwoods. Then, on February 25 the lenders said they were taking a “second look” at financing terms “ in view of the severely depressed housing industry and its impact on Arcata’s outlook.” The stockholders’ meeting was postponed again, to April. An Arcata spokesman said he “did not think the fate of the acquisition itself was imperiled.” When arbitrageurs hear such reassurances, their minds flash to the old saying: “He lied like a finance minister on the eve of devaluation.” On March 12 KKR said its earlier deal wouldn’t work, first cutting its offer to $33.50, then two days later raising it to $35.00. On March 15, however, the directors turned this bid down and accepted another group’s offer of $37.50 plus one-half of any redwood recovery. The shareholders okayed the deal, and the $37.50 was paid on June 4. We received $24.6 million versus our cost of $22.9 million; our average holding period was close to six months. Considering the trouble this transaction encountered, our 15% annual rate of return excluding any value for the redwood claim - was more than satisfactory. But the best was yet to come. The trial judge appointed two commissions, one to look at the timber’s value, the other to consider the interest rate questions. In January 1987, the first commission said the redwoods were worth $275.7 million and the second commission recommended a compounded, blended rate of return working out to about 14%. In August 1987 the judge upheld these conclusions, which meant a net amount of about $600 million would be due Arcata. The government then appealed. In 1988, though, before this appeal was heard, the claim was settled for $519 million. Consequently, we received an additional $29.48 per share, or about $19.3 million. We will get another $800,000 or so in 1989. Berkshire’s arbitrage activities differ from those of many arbitrageurs. First, we participate in only a few, and usually very large, transactions each year. Most practitioners buy into a great many deals perhaps 50 or more per year. With that many irons in the fire, they must spend most of their time monitoring both the progress of deals and the market movements of the related stocks. This is not how Charlie nor I wish to spend our lives. (What’s the sense in getting rich just to stare at a ticker tape all day?) Because we diversify so little, one particularly profitable or unprofitable transaction will affect our yearly result from arbitrage far more than it will the typical arbitrage operation. So far, Berkshire has not had a really bad experience. But we will - and when it happens we’ll report the gory details to you. The other way we differ from some arbitrage operations is
99
that we participate only in transactions that have been publicly announced. We do not trade on rumors or try to guess takeover candidates. We just read the newspapers, think about a few of the big propositions, and go by our own sense of probabilities. At yearend, our only major arbitrage position was 3,342,000 shares of RJR Nabisco with a cost of $281.8 million and a market value of $304.5 million. In January we increased our holdings to roughly four million shares and in February we eliminated our position. About three million shares were accepted when we tendered our holdings to KKR, which acquired RJR, and the returned shares were promptly sold in the market. Our pre-tax profit was a better-than-expected $64 million. Earlier, another familiar face turned up in the RJR bidding contest: Jay Pritzker, who was part of a First Boston group that made a tax-oriented offer. To quote Yogi Berra; “It was deja vu all over again.” During most of the time when we normally would have been purchasers of RJR, our activities in the stock were restricted because of Salomon’s participation in a bidding group. Customarily, Charlie and I, though we are directors of Salomon, are walled off from information about its merger and acquisition work. We have asked that it be that way: The information would do us no good and could, in fact, occasionally inhibit Berkshire’s arbitrage operations. However, the unusually large commitment that Salomon proposed to make in the RJR deal required that all directors be fully informed and involved. Therefore, Berkshire’s purchases of RJR were made at only two times: first, in the few days immediately following management’s announcement of buyout plans, before Salomon became involved; and considerably later, after the RJR board made its decision in favor of KKR. Because we could not buy at other times, our directorships cost Berkshire significant money. Considering Berkshire’s good results in 1988, you might expect us to pile into arbitrage during 1989. Instead, we expect to be on the sidelines. One pleasant reason is that our cash holdings are down - because our position in equities that we expect to hold for a very long time is substantially up. As regular readers of this report know, our new commitments are not based on a judgment about short-term prospects for the stock market. Rather, they reflect an opinion about long-term business prospects for specific companies. We do not have, never have had, and never will have an opinion about where the stock market, interest rates, or business activity will be a year from now. Even if we had a lot of cash we probably would do little in arbitrage in 1989. Some extraordinary excesses have developed in the takeover field. As Dorothy says: “Toto, I have a feeling we’re not in Kansas any more.”

100
We have no idea how long the excesses will last, nor do we know what will change the attitudes of government, lender and buyer that fuel them. But we do know that the less the prudence with which others conduct their affairs, the greater the prudence with which we should conduct our own affairs. We have no desire to arbitrage transactions that reflect the unbridled - and, in our view, often unwarranted - optimism of both buyers and lenders. In our activities, we will heed the wisdom of Herb Stein: “If something can’t go on forever, it will end.”