building a data warehouse at clover
TRANSCRIPT
Footer
CloverReinventing Health Insurance: Using Data to Put Patient Care First
Healthcare Analytics Lean in ConferenceOct 23, 2015

Footer 2
Agenda
1 What is Clover?
2 Who am I?
3 Data Science and Clover
4 What are we doing with all this?
5 Questions

3
Who am I?

4
Data Science at Clover
Ian BlumenfeldPlatform - Health modeling at Archimedes, lapsed physics Phd
Otis AndersonProduct - analytics at Yammer, MS Office, former affirmative action consultant

5Footer
Data Science at Clover

6
Data Science Expertise

7
• Actuarial Science
• Health Economics
• Medical Informatics
• Finance
• Accounting
List of data science areas of non-expertise

8
What is Clover Health?
9
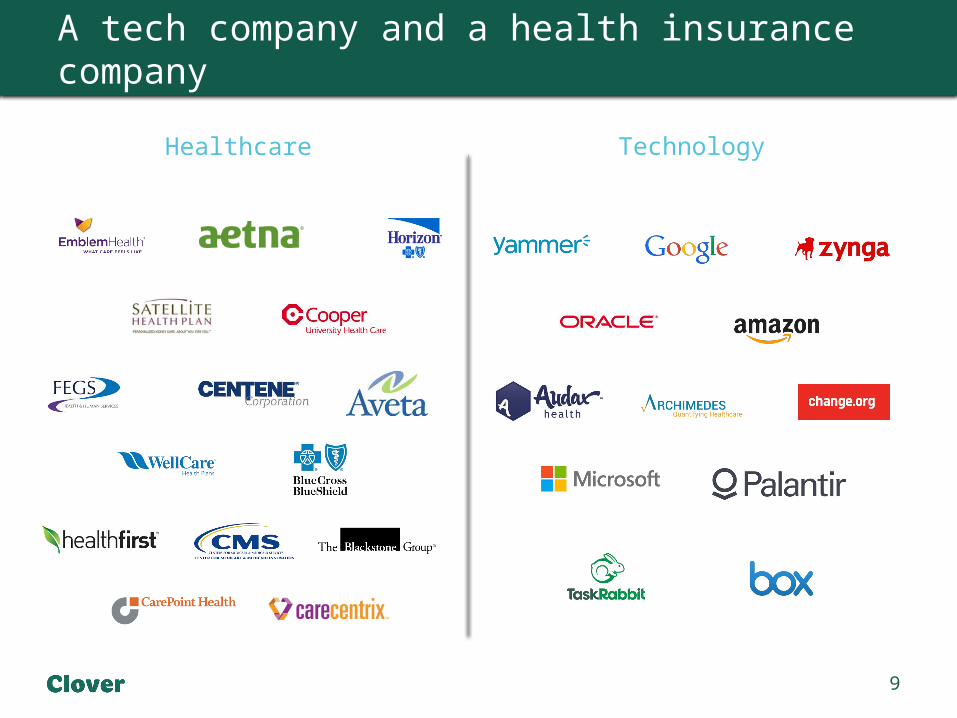
A tech company and a health insurance company
Healthcare Technology

10
• Medicare Advantage Part D plan• Why?
• More unit cost -> more opportunity• We think chronic disease management represents the
biggest opportunity to reduce cost of care by improving outcomes
• 7K enrollees in New Jersey (OPEN ENROLLMENT)• Clinical operations and customer service are in-house
• More on that later
Clover is a health insurance company

Our goal is to organize and leverage data to fix our healthcare system.
Clover is trying to improve health outcomes for our member population. We are using the tools of data science and modern web development to prioritize, assess and iterate upon our interventions.
11

Why did Clover build the data science function first?


Clinical Outcomes? So What?
There’s measuring clinical outcomes and then there is optimizing them.
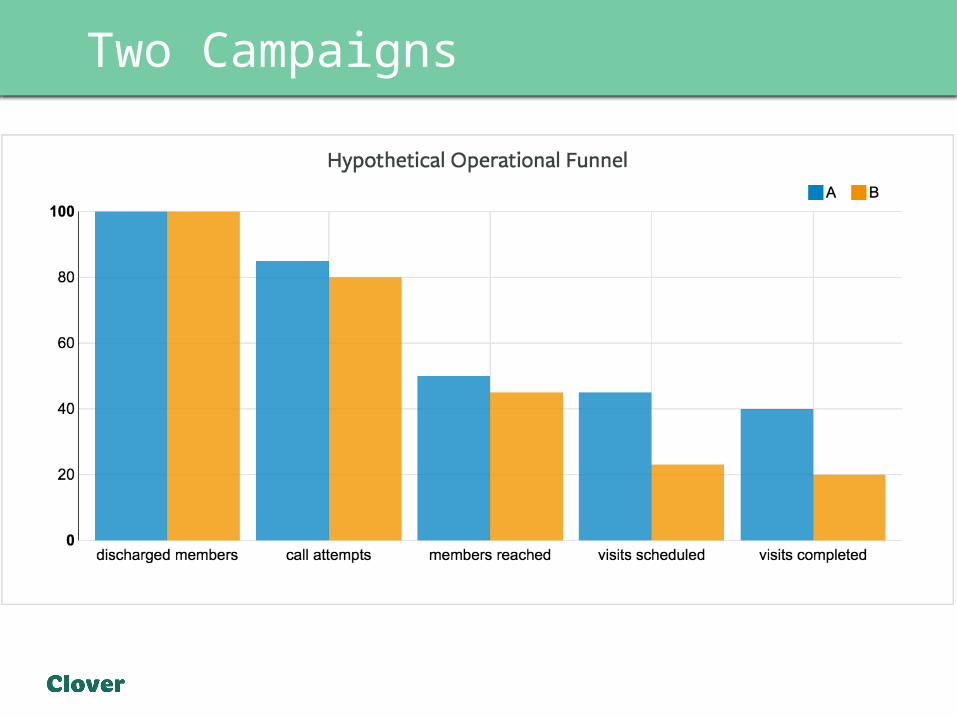
To see what I mean let us imagine two campaigns around nurse visits.

Two Campaigns
Campaign Discharged Members
Clinical Effectiveness Coverage Control
Readmission Rate
Covered PopReadmissions
Uncovered Pop
Readmissions
A 100 .15 .4 .4 10 24
B 100 .2 .2 .4 4 32
Total readmissions in campaign A - 34Total readmissions in B – 36
So A is more effective at preventing readmissions, even though the intervention from B is the more clinically effective campaign
Two Campaigns
Two Campaigns
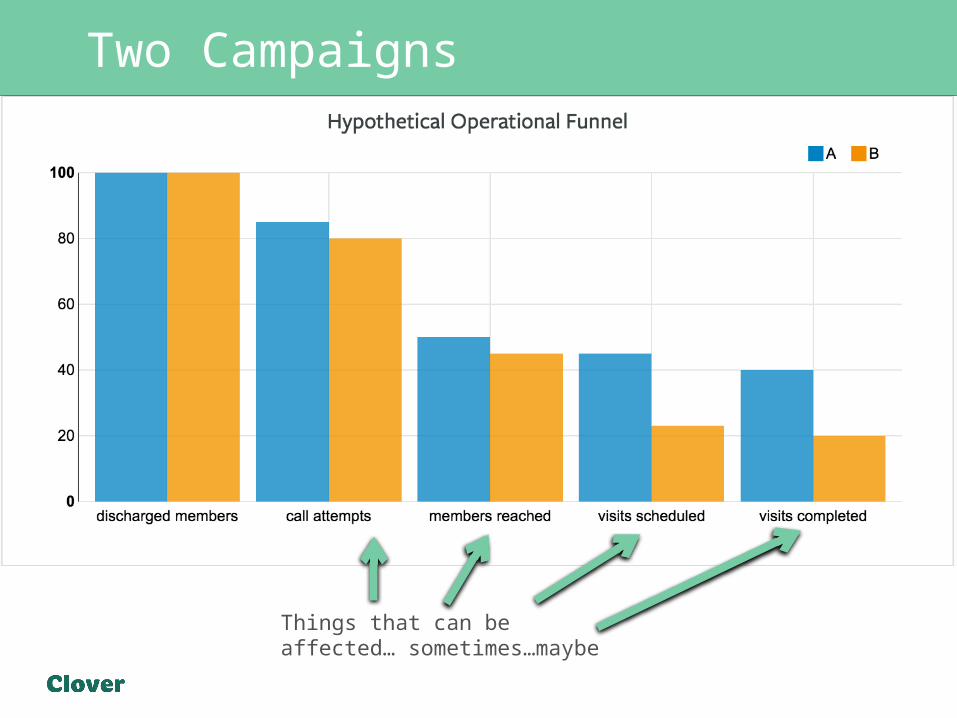
Things that can be affected… sometimes…maybe

So even when you know the outcomes
. . .you still can push to the optimal result by pushing up the processes that lead to the outcomes. If you want to talk about outcomes where the targeting is less obvious than a hospital discharge, then predictive modeling is more important.
What do you want to optimize outcomes then?• Flexible clinical operations team• Data warehouse full of joinable outcome and process
data• Apps that gather information as they enable operations• Speed – data speed and decision speed

Footer
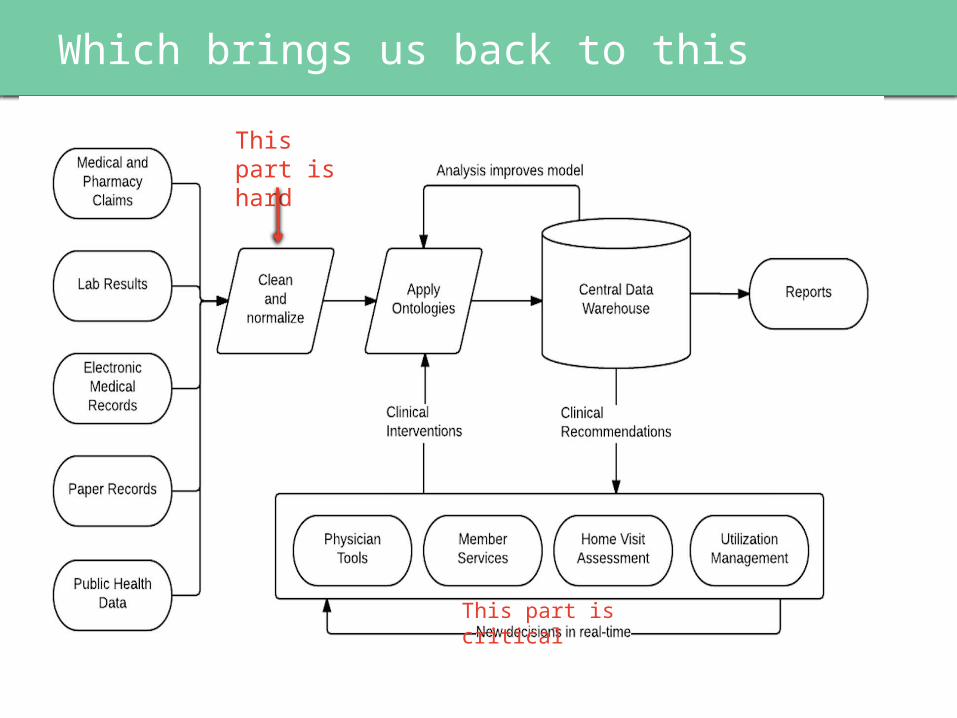
Which brings us back to this
Footer
Which brings us back to thisThis part is hard
This part is critical

Difficulties we faced, part I • Assembling catalogue of necessary
data
• Adding joinable keys into separate data sources
• Pinning down when membership starts and stops
• Parsing unstructured data
• Transforming hard to scrape-data (PDFs, invoices, one actual photograph of a series of data points)
• Interpreting claim duplications –
different for different files and different use cases
• Reconciling multiple sources of truth
• Understanding claim semantics
• PROVIDER DATA
• Interpreting part d accounting rules
• Counting hospital visits
• Automating all of the above
• Making sure that the automation doesn’t break any of the above
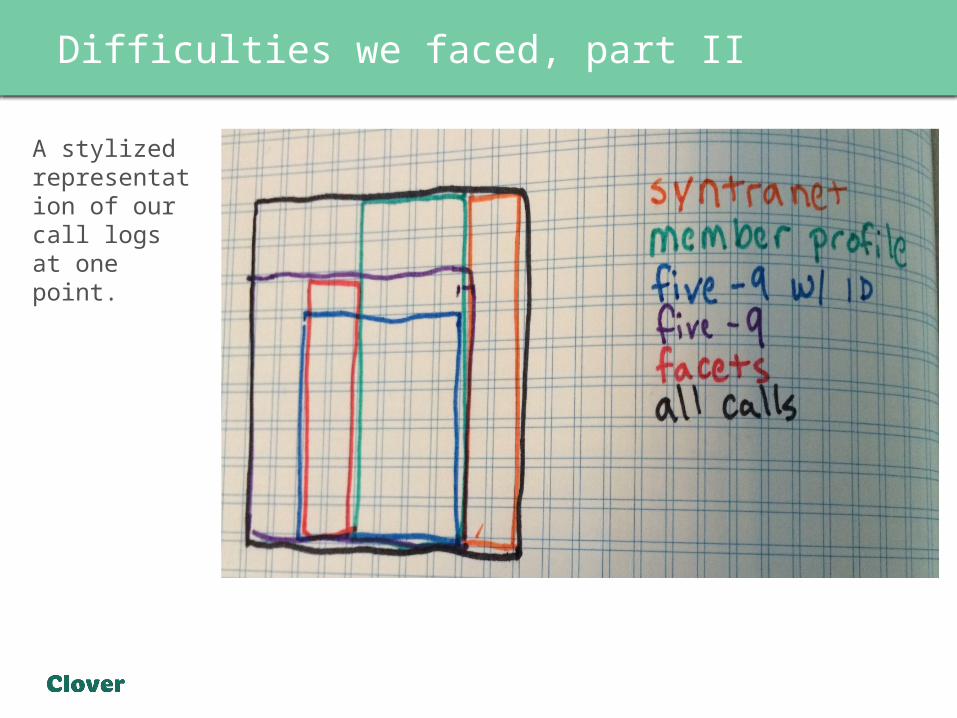
Difficulties we faced, part II A stylized representation of our call logs at one point.

An example – provider dataTo someone who has thought about it for a few minutes, provider data seems easy.
You want one row per provider with at least address, an identifier, name, specialty, and whether they are in network.
What happened?1. Our provider data migrated from Access to a more custom 🙀
physician data management solution.2. UI in new solution made it hard to validate data.3. Most accurate data ended up going onto paper. All sorts of horrible
consequences follow when the source of truth is paper 🙀🙀🙀

An example – provider data
What did we do?We took control of the data validation process. The object was to get provider data into a good state and be able to maintain and update it.
But provider data is bad because it is complex. You need to reconcile multiple sources of truth and update based on occasionally provisional data.
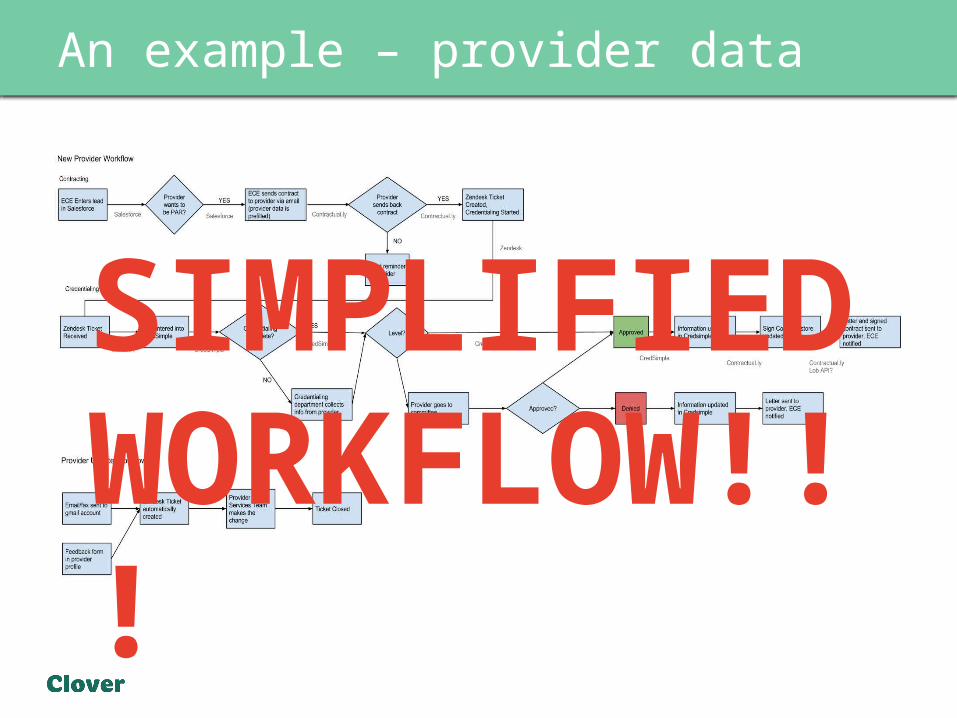
An example – provider data
SIMPLIFIED WORKFLOW!!!

26
What have we built out of this?

Footer 27
• We can run all of the things you have to do – star ratings, finance, customer service, claim forensics out of our data warehouse.
• It can all be joined on a unique of a member, so everything can be related to everything else.
• We can run lots of things in SQL and Python cutting down on less automatable solutions like Excel and access.
• Speed and flexibility to answer any ad-hoc question quickly!
A working data warehouse!

28
Useful things engineers have built
Member profile used by Clover staff surfaces history and captures observations.

29
Useful things engineers have built
Gaps in care surfaced as clinical reminders
30
Questions?