building a healthy food and beverage strategy for north ...finalreport_cowichan_… · building a...
TRANSCRIPT

Building a Healthy Food and Beverage Strategy for North Cowichan Parks and
Recreation
Submitted to: Municipality of North Cowichan, Parks and Recreation Department December 17, 2009
Author: Matt Thomson

1. Introduction
1.1. Background on the Initiative
In May 2007, the BC Healthy Living Alliance approved a Healthy Eating Strategy, as one of their four key strategies that will contribute to significant improvements in nutrition and healthy weights in British Columbia.1 The goal of the Healthy Eating Strategy was to achieve significant improvements in nutrition in BC. One of the key initiatives of this strategy is the Healthy Food and Beverage Sales Initiative. Grants for this initiative are being distributed by the Union of BC Municipalities and the BC Recreation and Parks Association. Currently in Phase 3 of the Healthy Food and Beverage Sales Grant, North Cowichan was selected as a grant recipient. This report is the outcome of the assessment and consultations undertaken by North Cowichan to develop a Healthy Food and Beverage Strategy for its Parks and Recreation facilities.
1.2. Purpose and Goal
Healthy eating has been proven to have a number of long-term benefits to communities and encouraging youth to choose healthy food can improve lifelong eating habits, which in turn result in improved health and education outcomes. Parks and Recreation Departments are a natural starting place for healthy initiatives, and there are a number of reasons why their leadership is key in promoting healthy eating in British Columbia. Parks and Recreation Departments, through their facilities, venues and programs already focus on developing physical, social and emotional well-being in a wide variety of community residents. This initiative is just an additional component of that existing role. Additionally, Parks & Recreation Departments employ a large number of people and therefore have the potential to impact the behaviour of a range of facility users and create greater demand for healthy food and beverages. Finally, healthy food in public recreation settings can help provide equitable access to healthy food choices for all members of the community, particularly community members that might not otherwise have access to healthy food in their homes or at work. This report lays out a road map for improving access to and knowledge of healthy food and beverages for North Cowichan Parks and Recreation Department’s facilities, venues and programs. This first step in a long-term process identifies current barriers to healthy eating the facilities, strategies implemented by other municipalities and recommendations suited to North Cowichan that work to comprehensively address healthy eating.
1 Their three other strategies are Physical Activity, Tobacco Reduction and Capacity Building.

2. Barriers and Best Practices for Healthy Eating: Results of Facilities
Assessments, Community Consultations and Review of Potential
Policies
Barriers The barriers identified in this report are drawn from a range of survey and engagement tools implemented over the course of this project. They include the following:
• Vending machine audit: completed in August, 2009, this audit was analyzed by a team from Exercise and Health Education Department at the University of Victoria (see Appendix 1 for complete results)
• Patron survey: completed in September, 2009, this survey received 53 results, and was also analyzed by a team from Exercise and Health Education Department at the University of Victoria (see Appendix 2 for complete results)
• Public consultations: In late November and early December, 2009 a number of meetings and workshops were held with the Parks Commission, North Cowichan municipal staff, food service providers and the public (though the public workshops received low turnout)
• Supplementary surveys: In order to elicit more feedback from the public and municipal staff, two additional surveys were distributed in early December, 2009. The public survey received 170 responses while the staff survey received 47 responses. These surveys do represent a limited sampling, as respondents were more likely to complete the survey if they were interested in healthy eating. Nonetheless, they represent an important segment of the public who are currently being underserved by food options in recreation facilities.
Each of the surveys conducted provided us with information on important barriers to healthy eating in parks and recreation facilities and venues. These include:
• September, 2009 Patron Survey: The three top barriers noted by patrons in this survey were lack of selection (34%), cost (23%) and don’t like selection (21%)2
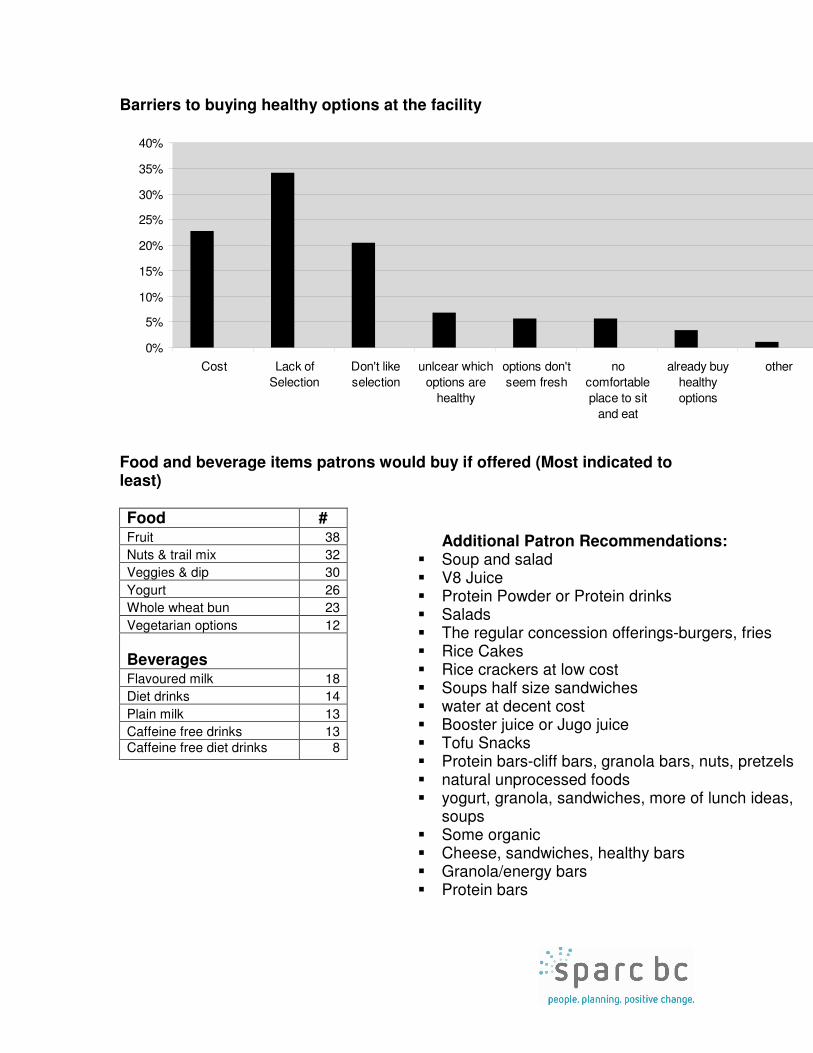
• December, 2009 Patron Survey: cost (38.8%), lack of selection (33.1%) and there is no place I feel comfortable to sit (26.6%)
• December, 2009 Staff Survey: lack of selection (50%), cost (47.7%) and don’t like the selection (27.3%)
Responses were similar in all three surveys, particularly with regard to the lack of selection and cost of healthy options (see Appendices 2 and 3 for all barriers cited by survey respondents). These barriers were combined with feedback received during public
2 Raw data from this survey is not available, as it was analyzed by the University of Victoria Exercise and Health Education Department; results are therefore approximate based on graphs supplied to the municipality.

Understanding the Categories
This audit divided available food into four categories:
• recommended
• choose least
• choose sometimes
• choose most. For more information on what each of these categories mean, see http://www.brandnamefoodlist.ca/FAQs.aspx
consultation sessions and four key barriers to healthy eating recreation facilities emerged, which are discussed in this section:
1. Availability of healthy food 2. Cost of healthy eating 3. Acceptance and awareness of healthy eating 4. Public perception of food in recreation facilities
2.1. Availability of Healthy Food
Availability of healthy food in vending machines and at concession stands represents a major barrier to healthy eating at recreation facilities in North Cowichan. The vending machine audit conducted in August, 2009 found that the majority of food and beverages available at both the Cowichan Aquatic Centre (CAC) and the Fuller Lake Arena were among the least nutritionally sound products available. At the Cowichan Aquatic Centre (CAC) 39 food items were available in vending machines, but only 7.7% (3) of these items were in the ‘choose most’ or ‘choose sometimes’ category. Of the 46 beverages available in the Cowichan Aquatic Centre 32.6% (15 items) were in the ‘choose most’ or ‘choose sometimes’ category (see Chart 1 below for more details). The results for food and beverage choices at the Arena were somewhat better. 25.9% (8 items) of the 31 food choices were in the ‘choose sometimes’ or ‘choose most’ categories. For beverages, 35.9% (14 items) of the 39 items at the Arena were in the ‘choose sometimes’ or ‘choose most’ category (see Chart 2 for more details).
Chart 1: Vending Machine Audit – Cowichan Aquatic Centre
Vending Machines - Food
76.9%
15.4%
2.6%5.1%
Not Recommended
Choose Least
Choose Sometimes
Choose Most
Vending Machines - Beverages
50.0%
17.4%
21.7%
10.9%
Not Recommended
Choose Least
Choose Sometimes
Choose Most
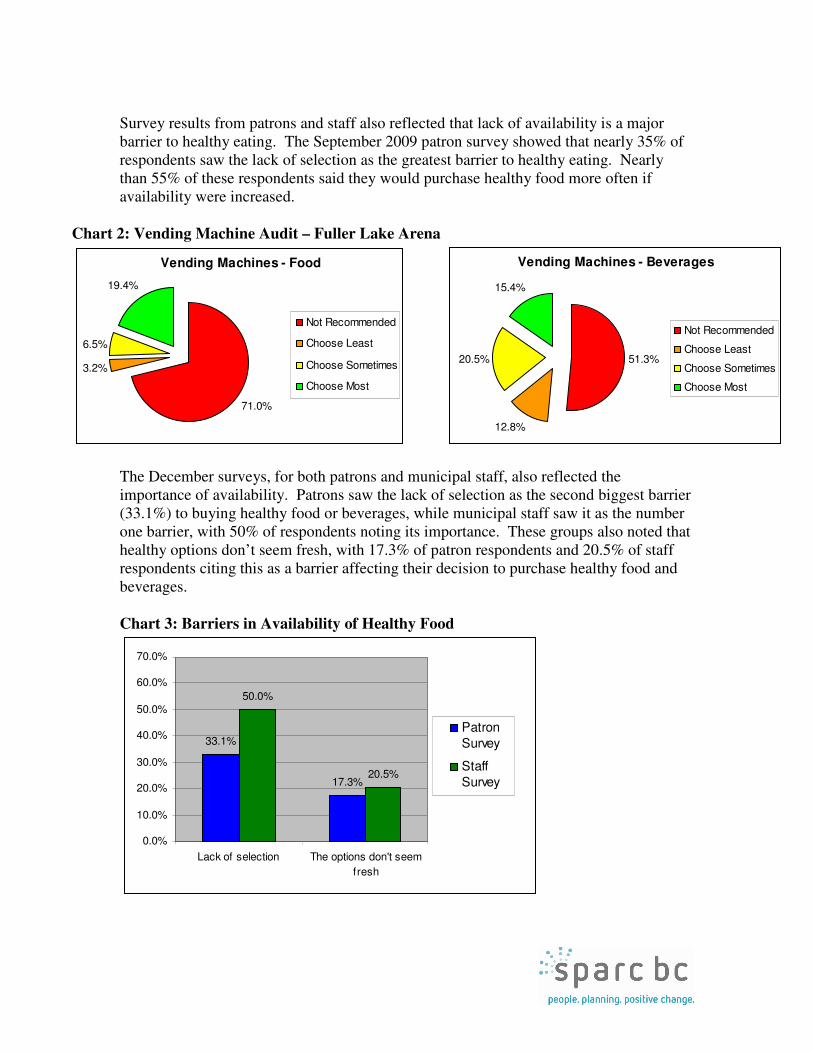
Survey results from patrons and staff also reflected that lack of availability is a major barrier to healthy eating. The September 2009 patron survey showed that nearly 35% of respondents saw the lack of selection as the greatest barrier to healthy eating. Nearly than 55% of these respondents said they would purchase healthy food more often if availability were increased.
Chart 2: Vending Machine Audit – Fuller Lake Arena
Vending Machines - Food
71.0%
3.2%
6.5%
19.4%
Not Recommended
Choose Least
Choose Sometimes
Choose Most
Vending Machines - Beverages
51.3%
12.8%
20.5%
15.4%
Not Recommended
Choose Least
Choose Sometimes
Choose Most
The December surveys, for both patrons and municipal staff, also reflected the importance of availability. Patrons saw the lack of selection as the second biggest barrier (33.1%) to buying healthy food or beverages, while municipal staff saw it as the number one barrier, with 50% of respondents noting its importance. These groups also noted that healthy options don’t seem fresh, with 17.3% of patron respondents and 20.5% of staff respondents citing this as a barrier affecting their decision to purchase healthy food and beverages. Chart 3: Barriers in Availability of Healthy Food
33.1%
17.3%
50.0%
20.5%
0.0%
10.0%
20.0%
30.0%
40.0%
50.0%
60.0%
70.0%
Lack of selection The options don't seem
fresh
PatronSurvey
StaffSurvey
How much are patrons willing to spend
on healthy food?
• Nearly 60% of patrons said they would purchase healthy food at a comparable price
• Nearly 20% would buy healthy food at a slightly higher price
How much are patrons currently
spending?
• More than 60% of those who purchased from vending machines spent $1-2
• Slightly more than 50% of those who purchased food or beverages at concession stands spent $3-5
• About 15% of patrons spent $11 or more on food, and this was at concession stands
Availability of healthy food is issue, as there is more to ensuring availability of healthy food than simply putting it in vending machines. Vendors noted at consultation meetings that healthy foods often don’t last as long as unhealthy foods, and spoilage is a major concern. The vendors also pointed out that they have attempted providing healthy food, within their range of services; however they have had little success. Providing healthy food can represent a risk to food service providers if it does not sell, and availability of healthy foods is tied into other barriers, such as its cost and public awareness. It should be noted, though, that the vendors’ efforts to offer healthy food have been implemented without customer consultation, pre-planning or strategic placement in mind, and can be considered ‘one off’ attempts, rather than efforts that form part of a broader strategy for healthy eating.
2.2. Cost of Healthy Options
Cost of healthy food is another key barrier cited in both surveys and community consultations. In the September, 2009 survey, about 75% of respondents said they would buy healthy food options that were at a comparable or lower price than the available food options. Less than 20% of respondents said they would purchase healthy food at a slightly higher price than existing options, and none of the respondents would pay a significantly higher price for healthy food. This is further reflected in patron spending: less than 20% of respondents spent over $5 at recreational food facilities (either vending machines or concession stands). More than 60% of those who purchased from vending machines spent only $1-2, while just over 50% of those who purchased food or beverages from concession stands spent $3-5. Additionally, in the December, 2009 patron survey, 38.8% of respondents cited cost as a major barrier to healthy eating, making it the number one barrier for this group. Municipal staff also saw it as a significant challenge, with 47.7% of respondents say it was one of the biggest barriers to healthy eating in recreation facilities. These findings were borne out in consultation meetings. Municipal staff noted that because healthier foods tend to be more costly, they are less desirable to the public. This was also a major concern noted by food service providers. The cost of healthy food, as well as delivery and storage of these types of food tends to be more expensive than less

healthy options.3 Vendors also noted the upcoming challenge of the Harmonized Sales Tax, which may adversely affect food and beverage sales in vending machines, concession stands and restaurants. Cost therefore represents a major barrier to healthy eating in recreation facilities from the standpoint of both the vendor and the public. The outcomes of the survey and consultations show that improving availability alone is not enough; cost plays a major role in consumer choices and unless healthy options are also cost effective, they are unlikely to be accepted by the public. However, increased awareness of healthy food options can make comparable or slightly greater costs for healthy options less of a barrier, as patrons are more knowledgeable of the benefits of healthy eating.
2.3. Acceptance, Awareness and Availability of Information
Another major barrier affecting the success of any healthy eating initiative is public awareness and perception, and the availability of information about healthy food and beverages. In the surveys this issue came across as less important than cost and availability, with 17.3% of patron respondents and 11.4% of staff respondents noting it as a major barrier. However, during consultations with municipal staff, food service providers and the public, a lack of information about healthy options was noted as a major barrier. Lack of information can be addressed through a number of potential strategies, including posting nutritional information on vending machines, inadequate product labeling, a ‘checkmark’ program (e.g. Heart Smart food, or marking foods as ‘choose most,’ ‘choose least,’ etc.), or permanent displays providing nutritional information and facts. Participants in the various consultation workshops noted that the influence of large food companies is significant in the food choices many consumers make. Marketing and advertising play a significant role in determining what foods are seen as ‘cool’ or desirable. This in turn affects consumer choices, particularly among youth. Participants in some of these workshops also felt that there was a general lack of interest in healthy eating from the public. Though the December 2009 survey results show high level of interest in healthy eating, as noted above there is a strong likelihood that patrons less interested in healthy eating issues were less likely to respond to the survey. Finally, many workshop participants noted the importance of changing the perception of healthy food so that it is seen as more desirable. Public acceptance and knowledge of healthy food is therefore another important barrier to address in promoting healthy eating. In fact, creating a demand for healthy food through public engagement and outreach will likely help make it more feasible to profitably provide more healthy options, thus also helping keep costs down for food service providers and facility patrons and staff.
3 For example, refrigerated vending machines can cost between $12,000 and $14,000, as compared with non-refrigerated vending machines, which cost around $8,000.

Changing the Public Perception of Vending Machiness
VS.
2.4. Public Perception of the Role of Food in Recreation Buildings
A final major barrier to healthy eating in recreation facilities is the perceived role of food in recreation facilities. With less than 10% of survey respondents from the September, 2009 survey purchasing a meal at recreation food facilities, the majority are seeking a snack, drink or a combination of the two when purchasing food from either a vending machine or a concession stand. Furthermore, the surroundings provided in many recreation facilities are not conducive to anything more than a quick snack: 26.6% of patron respondents from the December, 2009 survey said that a major barrier to healthy eating was a comfortable place to sit and eat, while 15.9% of staff respondents noted the same concern. These responses were also heard through the consultation workshops. Many participants noted that point-of-sale purchases (at vending machines and concession stands) were generally impulse purchases, and that for many patrons and families getting a snack at the recreation facilities represented a treat, as compared with the normally healthy food options available at home. Additionally, several additional comments made to the December, 2009 survey noted the importance of providing options, as treats are desirable at recreation facilities, as healthy food is what’s on the table at home. The public’s perception of what food should be available in recreation facilities represents a final major barrier to healthy eating in Parks and Recreation buildings. Generally, the role of food in recreation facilities is seen as a luxury or treat; candy bars, chips and sodas that may not be available at home. More, public attitudes toward vending machines and concession services are based on the atmosphere they create: these types of food service are geared toward the quick meal or snack; however, by shifting design. By shifting the language, presentation and design accompanying food services, public perception of what food should be offered can be shifted, from unhealthy to healthy. To ensure the success of healthy eating initiatives in recreation facilities, this strategy therefore needs to address the public’s perception of the role that food can and should play in recreation facilities. This perception should shift away from the idea recreation facilities are there to provide treats and unhealthy snacks, toward the sense that healthy and desirable food is available and affordable.

Best Practices and Policy
For Phases 1 through 3 of the Healthy Food and Beverage Initiative, approximately 40 local governments and First Nations have developed policies, plans or strategies to promote healthy eating in their respective facilities. The following series of best practices draw from some policy and practice highlights of three BC municipalities, showing the types of strategies used to promote healthy eating. These highlights were selected as they most effectively address some of the challenges North Cowichan faces.
2.5. Education, Awareness and Outreach
Prince George:
• Products that are ‘choose most/choose sometimes’ should be placed more prominently
• Where possible, the City will support and access local food security initiatives Delta:
• Post and maintain signage that promotes healthy choices
• Add trial runs of healthier (choose most) foods
• Monitor current nutrition information and respond accordingly Nanaimo:
• Currently offer a range of cooking classes, focusing on locally available and ethnic cuisine, to build food skills in local residents
• Food vendors and contractors work with a local nutritionist to ensure menus meet guidelines, ensuring fresh, healthy and appropriately portioned meals and snacks
2.6. Setting Targets and Portions for Healthy Food Availability:
Prince George:
• Has a minimum percentage from the ‘choose most’ and ‘choose sometimes’ categories of 50% and allows no more than 15% from the ‘not recommended’
• Pre-packaged food and beverages are limited to regular sizes (e.g. no king size candy bars, jumbo hot dogs, jumbo potato chips)
• For every product that does not meet the ‘choose most/choose sometimes’ guidelines, a like product that does meet these guidelines should be provided (e.g. pepperoni pizza vs. vegetable pizza, hamburgers vs. turkey sandwiches)
Delta:
• Provides a minimum of 60% healthy (choose most) choices at concessions
Nanaimo:
• 80% of food and beverages come from the ‘choose most’ and ‘choose sometimes’ categories
• 20% come from the ‘choose least’ and ‘not recommended’ categories

3. Final Recommendations
The final recommendations fall under three categories: Education and Outreach, Setting Feasible Targets and Guidelines, and Additional Considerations. Each of these has particular recommendations that are short, medium or long-term.
• Short-term recommendations – successful implementation within 3 to 6 months.
• Medium-term recommendations – successful implementation within 6 months to 2 years.
• Long-term recommendations – successful implementation within 2 to 5 years (particularly those with lease or contractual agreements associated with them).
Each of the categories discussed below offers a range of practical strategies that begin with short-term efforts and culminate in medium to long-term plans.
3.1. Education and Outreach
Education and outreach initiatives are designed to promote a demand for healthy eating, allowing food service providers to make healthier options more available, while keeping costs down. Education on healthy eating represents a first key step in ensuring that longer-term initiatives, such as guidelines and healthy-eating targets, are successfully met.
3.1.1. Nutritional information at vending machines and concession stands
(short-term): Providing appropriate labeling of nutritional information in vending machine and concession stand food represents the first step in raising public awareness regarding the importance of healthy eating. Foods should be labeled as ‘not recommended,’ ‘choose least,’ ‘choose sometimes,’ and ‘choose most,’ and these terms should be explained with regards to nutritional. This provides consumer with an opportunity to make educated choices about the food and beverages they purchase.
3.1.2. Educational fact sheets and posters as part of permanently available
information and displays (short-term): As part of broader education initiative, facts and information on healthy eating and nutrition should be prominently displayed in recreation facilities. These educational initiatives could include key facts (for example, sodium, fat and sugar content in various junk foods), benefits of healthy eating, and information on the long-term health impacts of junk food.
3.1.3. Providing food skills workshops and programs (medium-term): Providing food skills workshops and classes is an excellent strategy for ensuring that community members can and will make better food choices over the long-term. Food skills can also be built into existing activities at the recreation centre.

3.2. Setting Feasible Guidelines and Targets
Without some guidelines around what is and is not permissible in public buildings, educational opportunities will likely not affect long-term patron purchasing behaviours. It is therefore key to better understand how to most effectively allow food service providers to set targets that increase the availability of healthy food, while keeping costs down for themselves and patrons.
3.2.1. Explore healthy options and provide greater variety (short to medium-
term): Work with food service providers to determine what suppliers may have healthier food options for vending machines and concession stands. Implement trial runs of healthy foods, including promotional days, to see what patrons are more likely to purchase. These trial runs can help recreation facilities determine what will and won’t work in creating stronger demand for healthy food. Each of the three surveys reflected a strong desire for wider variety of options at concession stands and vending machines, indicating that a large portion of the public is not being well-served by existing food services. There are a number of opportunities for innovation with regards to availability of healthy food. One option includes creating stronger ties with locals farmers and food processors, allowing them to showcase their goods at recreation facilities and venues. Another opportunity is to contact food suppliers to organize taste testing or product sampling at recreational venues. These options offer an opportunity to explore what works and what may need to be reconsidered when looking for healthy options.
3.2.2. Use community nutritionists (medium-term): Community nutritionists are a key resource in improving healthy eating options. Food service providers should work with a local nutritionist to develop food guidelines around nutritional content and portion size of what is available in vending machines and concession stands.
3.2.3. Set healthy food targets (medium to long-term): Most municipalities developing healthy eating strategies set limits around what is available from each category, including a minimum from the ‘choose most’ and ‘choose sometimes’ categories, and a maximum from the ‘not recommended’ category. Work with food service providers to determine what is feasible. As lease agreements or discussions ensure, phase healthy food options into vending machines and food vendors.4
3.3. Additional Considerations
4 It should be noted that most survey participants expressed a desire for continued choice with regards to food, so some ‘not recommended’ options will likely need to remain available.

Other considerations emerged from consultations and surveys. These may not directly inform the short and medium-term actions to promote healthy eating in recreation facilities, but could do much to improve the overall eating culture in the municipality of North Cowichan.
3.3.1. Lead by example (short to long-term): The Municipality should provide greater diversity in terms of healthy food available on a regular basis. This means healthier drink options, as well as more healthy food available at municipal and public events.
• Vending machines accessible primarily by employees primarily (e.g. operations building) should have healthy food and beverage options
• At a minimum, all public program delivery should always include healthy options; ideally healthy food and beverages become the standard for all public programs, rather than just an option (e.g. birthday parties at CAC)
• Develop protocols around municipal meetings: offer healthy options consistently
3.3.2. Rethink the role of food in recreation facilities (medium to long-term): A major barrier cited above concerning healthy eating options is the perceived role it plays in recreation facilities. Providing more space for people to sit, and changing the perception that concessions are there to simply there to provide snacks and treats, could strongly shape what types of foods people order.5
3.3.3. Set targets for success (medium to long-term): Consider what specific target outcomes (e.g. more healthy food is being purchased than unhealthy food) and what indicators can be used to measure these outcomes. Incorporate measurement indicators into the healthy eating plan in order to make any necessary changes as the plan unfolds.
5 The café at CAC is cited as a good example of atmosphere and healthy options, but even there some survey respondents noted that there was not enough seating room.

Appendix 1: Vending Machine Audit Results August, 2009
Cowichan Aquatic Centre Vending Machines
Food (39 items)
• Not Recommended: 76.9% (30 items)
• Choose Least: 15.4% (6 items)
• Choose Sometimes: 2.6% (1 item)
• Choose Most: 5.1% (2 items) Beverages (46 items)
• Not Recommended: 50% (23 items)
• Choose Least: 17.4% (8 items)
• Choose Sometimes: 21.7% (10 items)
• Choose Most: 10.9% (5 items) Fuller Lake Arena
Food (31 items)
• Not Recommended: 71% (22 items)
• Choose Least: 3.2% (1 item)
• Choose Sometimes: 6.5% (2 items)
• Choose Most: 19.4% (6 items) Beverages (39 items)
• Not Recommended: 51.3% (20 items)
• Choose Least: 12.8% (5 items)
• Choose Sometimes: 20.5% (8 items)
• Choose Most: 15.4% (6 items)

APPENDIX 2: UNIVERSITY OF VICTORIA PATRON SURVEY RESULTS6
Survey Period: September 2009 Total survey respondents: N = 53
I. Patron Background Patron gender
0%
10%
20%
30%
40%
50%
60%
Male Female
Patron age group
0%
5%
10%
15%
20%
25%
30%
35%
40%
45%
50%
18-25 26-35 36-50 51-70 70+
6 Evaluation Team: Patti-Jean Naylor, PhD (lead), Suzanne Vander Wekken, Emily George, David Trill;
School of Exercise Science, Exercise and Health Education, University of Victoria.

The reasons why patrons come to the facility
0
5
10
15
20
25
Children
programs
Youth
programs
Senior
programs
Adult
programs
Ice arena Pool &
swimming
Gym &
fitness
Other
Frequency patrons visit the facility
0%
5%
10%
15%
20%
25%
30%
35%
40%
Almost never 1-2
days/month
1 day/week 2-4
days/week
5+
days/week

How important healthy eating is to patrons
0%
10%
20%
30%
40%
50%
60%
Not important sort of not
important
somewhat
important
important very important

II. What Patrons Do at the Facility Patrons purchased something to eat or drink at the facility on the day surveyed
0%
10%
20%
30%
40%
50%
60%
70%
Yes No
Frequency patrons buy from the concession stand and the vending machines
0%
10%
20%
30%
40%
50%
60%
Almost always Often Sometimes Rarely Never
Concession
Vending

What patrons usually buy from the concession stands and the vending machines
0%
5%
10%
15%
20%
25%
30%
35%
40%
45%
50%
Drink Snack Meal Drink & snack
Concession
Vending
How much patrons usually spend at the concession stand and the vending machines

0%
10%
20%
30%
40%
50%
60%
70%
$1-2 $3-5 $6-10 $11+
Concession
Vending
For whom the patrons usually buy from the concession stand and the vending machine
0%
10%
20%
30%
40%
50%
60%
Me My Child Another adult Me & child Me & adult
Concession
Vending

III. Patron Input Price at which patrons would buy healthy food options
0%
10%
20%
30%
40%
50%
60%
Won't buy lower price comparable
price
slightly
higher price
significantly
higher price
Percentage of patrons that would buy less often, the same amount, and more often with the presence of more healthy food/beverage options
0%
10%
20%
30%
40%
50%
60%
less often same amount more often
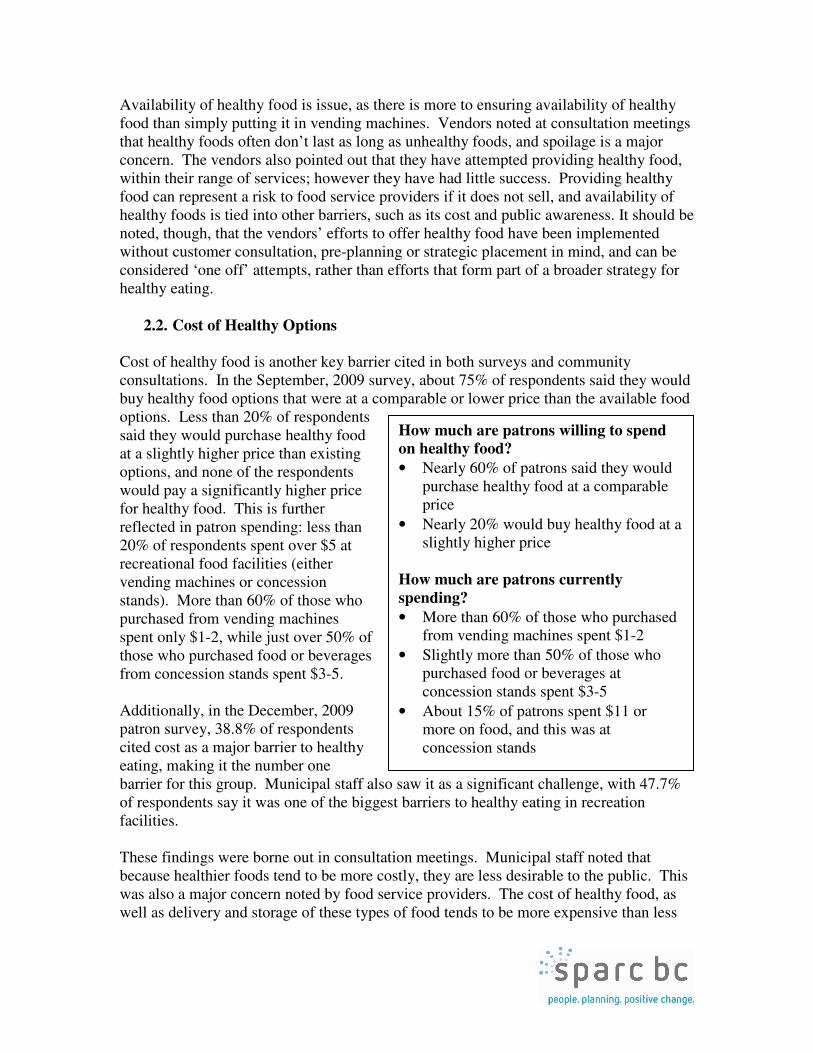
Additional Patron Recommendations:
� Soup and salad � V8 Juice � Protein Powder or Protein drinks � Salads � The regular concession offerings-burgers, fries � Rice Cakes � Rice crackers at low cost � Soups half size sandwiches � water at decent cost � Booster juice or Jugo juice � Tofu Snacks � Protein bars-cliff bars, granola bars, nuts, pretzels � natural unprocessed foods � yogurt, granola, sandwiches, more of lunch ideas,
soups � Some organic � Cheese, sandwiches, healthy bars � Granola/energy bars � Protein bars
Barriers to buying healthy options at the facility
0%
5%
10%
15%
20%
25%
30%
35%
40%
Cost Lack of
Selection
Don't like
selection
unlcear which
options are
healthy
options don't
seem fresh
no
comfortable
place to sit
and eat
already buy
healthy
options
other
Food and beverage items patrons would buy if offered (Most indicated to least) Food # Fruit 38
Nuts & trail mix 32
Veggies & dip 30
Yogurt 26
Whole wheat bun 23
Vegetarian options 12
Beverages Flavoured milk 18
Diet drinks 14
Plain milk 13
Caffeine free drinks 13 Caffeine free diet drinks 8

Patrons aware of healthy eating promotions at the facility
0%
10%
20%
30%
40%
50%
60%
70%
80%
Yes No
Number of patrons aware of the following promotions and activities
0
2
4
6
8
10
12
14
printed
materials
events,
workshops or
classes
healthy foods
in recreation
programs
healthy
options sold
in the vending
machines
healthy
options in the
concession
stand
stickers or
health mark
check beside
healthy food
options
other

Other: We haven't seen any but then we haven't looked. We eat healthy at home and on occasion buy snacks here
Promotions and activities have influenced patrons’ purchases
0%
10%
20%
30%
40%
50%
60%
Yes No
Additional Patron Comments: � At 60 years old it's noy my eating habits that I'm concerned about but my
grandchildrens and future generations. � Let Us Choose what we eat. Don’t dictate , but provide the healthy choice as
option � Shower after steam and hot tub use life guards please remind people � might not have been best candidate. I bring my own water in a reusable
container and don’t snack right before or right after working out � Looking forward to more healthy options , foods available � If a café was present offering healthy lunch selections (sandwiches, buns,
soup, etc) at reasonable prices (nothing stupid)then myself, staff, and patrons would be more into buying food here.
� Thank you for asking � Thank you for considering healthy foods. The kids still do like the occasional
chocolate bar
Appendix 3: Barriers to Healthy Eating, December Surveys December, 2009 Patron Survey
38.8%
33.1%
26.6%25.2%
17.3%15.1% 14.4%
0.0%
10.0%
20.0%
30.0%
40.0%
50.0%
Cost Lack of
selection
There is no
place I feel
comfortable
to sit and
eat
I don't like
the
selection
The options
don't seem
fresh
It is not
clear which
options are
healthy
I already
buy healthy
options,
there are no
barriers
December, 2009 Staff Survey

50.0%47.7%
27.3%
20.5%
15.9% 15.9%
11.4%
0.0%
10.0%
20.0%
30.0%
40.0%
50.0%
60.0%
Lack of
selection
Cost I don't like
the
selection
The options
don't seem
fresh
I already
buy healthy
options,
there are no
barriers
There is no
place I feel
comfortable
to sit and
eat
It is not
clear which
options are
healthy