building a presence in today's growth markets: the experience of privately held companies
TRANSCRIPT
Building a presence in today’s growth marketsThe experience of privately held companies
Opportunities and challenges in the BRICs and beyond
Building a presence in today’s growth marketsThe experience of privately held companies
The surveyThis publication was created in cooperation with the Economist Intelligence Unit (EIU). The f indings presented in the main report are based on a survey and analysis conducted in 2010 by the EIU on behalf of PwC. A total of 158 corporate chiefs, directors, and senior executives of non-f inancial private companies from around the globe and across 17 industries participated in the survey. They represent companies with annual revenue ranging from US$100 million to US$5 billion; 58% of respondents work at f irms with annual revenue of US$500 million or more. Two-thirds of the respondents are either C-suite executives or board members.
The interviewsIn addition to the survey, in-depth interviews with f ive executives were conducted for this report. We thank the following individuals for their valuable contributions: Robert Koch, CEO, Koch Enterprises; Bill Kozyra, CEO, TI Automotive; Jochen Meissner, CEO, Goss International; Gus Ramirez, CEO, Husco International; and David Whittleton, COO, Arup Group.
We also interviewed f ive PwC partners from around the globe, who shared their insights about the opportunities and challenges that private companies face in emerging and fast-growing markets: Humphrey Choi, China; Ray Headifen, Indonesia; Rama Krishna, India; Abelardo Macotela, Mexico; and Carlos Mendonça, Brazil.
To the interviewees and the 158 individuals who participated in the survey, we extend our appreciation and gratitude.

Revenue growth Internationally active US private companies consistently project higher revenue growth than their domestic-only peers.
At the turn of this new century, we saw only a handful of US private companies pursuing business abroad. A decade later, that’s no longer the case. A signif icant number of our private-company clients have an inter- national presence these days or are seriously consider-ing one. For some, it’s a way to control costs. For even more, however, it’s a way to make up for lost revenue at home and a path to growth.
Companies seeking growth abroad are setting their sights on emerging and fast-growing markets (EFGMs), where economic conditions are rebounding more quickly than in mature markets. At present, the EFGM landscape is dominated by the BRICs — Brazil, Russia, India, and China — but a second tier of rapidly develop- ing economies, including Indonesia and Mexico, are catching up.
While all of these markets have their share of chal-lenges — ranging from infrastructure to regulatory uncertainty — private companies are increasingly f inding that the rewards outweigh the risks. Our ongoing research1 shows that US private businesses operating abroad — particularly those active in EFGMs — consistently project higher revenue growth than their domestic-only peers, as well as report higher gross-margin increases. They’re also planning greater capital investment, operational spending, and M&A activity.
As little as several years ago, investing in more than one foreign market at once was relatively uncommon among our private-company clients. The norm was to venture into a single country, typically in Western Europe, and test the waters there before moving into a second country. Now we’re beginning to see a number of clients take a bolder approach, entering multiple markets simultaneously. Even for them, however, “testing the waters” remains a standard approach, with companies often f irst setting up a sales off ice to feel things out before further committing themselves in a particular country or region. Another popular route is to form a joint venture, sometimes via a company’s current network — for instance, by leveraging a distributor or supplier.
Joint ventures and other strategic alliances can be particularly important for midsize private companies, which generally lack the resources of large public companies and therefore don’t have the luxury of learning the ropes of a new market slowly. Regional partners who understand the local market and customs, as well as have good relationships with key government off icials, can help mitigate the risks of doing business in an EFGM.
In especially large, complex markets such as China and India, where there are many submarkets that can vary widely in their differences — including tax, regulatory, and legal differences from one region to the next, as well as among municipalities — lever-aging local expertise is particularly critical. So, too,
It stands to reason, then, that of the 158 private- company executives surveyed for this publication, all say they have or are considering establishing operations in EFGMs. And while the desire to keep manufacturing costs down is a key factor in why private companies are going abroad, they are less interested in making goods in EFGMs than they are in selling them there. This shift in focus ref lects how rising wages in EFGMs are not only making new consumers out of the workers in those countries, but also making those individuals more costly for foreign manufacturers to employ.
Although rising consumerism abroad, coupled with sluggish growth at home, is the biggest impetus for private-company investment in EFGMs (82% of com- panies surveyed cite market growth opportunities as the top reason for EFGM investment; 51% cite the economic slowdown), there are other powerful mo- tivators as well. Some are negative, such as increased competitive pressure in home markets (cited by 49% of companies surveyed). Others are positive, including EFGMs’ lower cost base (45%) and access to other nearby major markets (42%).
An additional lure is the introduction of policy reforms aimed at creating friendlier business environments in EFGMs. Brazil, for instance, has implemented a sys- tem to reduce the complexity of complying with corporate tax rules, while Mexico looks poised to pass anti-monopoly legislation in 2011.
Meanwhile, private companies are growing more adept at dealing with the challenges in EFGMs as their exposure to those markets increases. Consequently, EFGMs are beginning to appear less risky to many of those companies. For instance, three-quarters of private businesses investing (or planning to invest) in just one or two EFGMs characterize China as high-risk, whereas this view of China is held by only 41% of companies investing (or planning to invest) in f ive or more EFGMs.
1 PwC’s quarterly, survey-based Trendsetter Barometer Business Outlook reports: http://www.barometersurveys.com/trendsetter
is focused business-planning that’s tailored to each submarket and administrative region; a blanket strategy won’t work. In this respect, midsize private companies enjoy an important advantage over their larger, better-resourced public counterparts: faster, more-eff icient decision making. F lexibility and agility are very helpful qualities to have when doing business in EFGMs.
For these and other reasons discussed in the following pages, many private companies have been meeting with success in EFGMs. They are apt to only increase their presence there in the coming years, given that EFGMs’ macroeconomic fundamentals now look health- ier than those of the heavily indebted developed world.
This publication shares some of the stories of private companies that are doing business in EFGMs, with CEOs describing how they’ve overcome challenges to suc- cessfully establish themselves in those markets. It also shares the insights of PwC partners in Brazil, China, India, Indonesia, and Mexico regarding what they view as the top opportunities and diff iculties for foreign businesses in their countries. I hope that this on-the-ground knowledge, coupled with the survey f indings summarized in the pages to come, proves helpful to you in plotting your company’s growth strategy for the new decade and beyond.
Sincerely,
3Q 20
10
1Q 20
09
4Q 20
09
2Q 20
08
2Q 20
10
4Q 20
08
3Q 20
09
1Q 20
10
3Q 20
08
2Q 20
09
10%
12%
14%
8%
6%
2%
4%
12.2
%13
.6%
7.7%
* * *
10.6
%14
.3%
7.6%
11.8
%12
.3%
8.5%
9.4% 9.6%
7.8%
7.4%
9.7%
6.8%
5.5%
7.9%
4.9%
4.8%
7.5%
2.1%
6.1%
4.5%
12.3
%
8.5%
12.9
%
9.4%
* Emerging market data began to be collected in 2009.
All international marketersEmerging markets
Domestic onlyData derived from PwC’s quarterly Trendsetter Barometer Business Outlook surveys.
Rich Stovsky US Leader Private Company Services

Table of contents
24Country snapshots
22What to do now
26Brazil
58Mexico
19Top risks when investing abroad
Preface 6
7Where private companies are going The BRICs and beyond
34China
10Why are they going there? The successful experience so far
42India
14The risk landscape How it’s changing
50Indonesia

6 Private Company Services Private Company Services 7
It’s no wonder that privately held and midsize businesses in the United States, Europe, and elsewhere are looking abroad to grow — emerging markets are leading the world’s growth, presenting signif icant opportunities for investors. In fact, the growth gap between emerging and fast-growing markets (EFGMs) and the world’s mature markets has never been wider.1 The countries outside North America, Western Europe, and Japan account for about only half of global GDP, but since 2007 have accounted for over $2 trillion worth of growth — far more than the $200 bil- lion of the mature economies, according to Economist Intelligence Unit (EIU) f igures.
At the same time, the risks of doing business in EFGMs are declining. Across a range of business risks — from inadequate infrastructure to hard-to-interpret laws and diff icult-to-navigate bureaucracies — there are fewer uncertainties associated with doing business in most of those markets. The EIU’s Business Environment Index, which has tracked a detailed set of operational risks across 59 countries since 2002, shows sharp drops in risks pertaining to economic volatility, political instability, infrastructure (from ports and roads to broadband connections), and banking systems.
This paper, which draws from interviews and a survey of executives in privately held businesses in North America and Western Europe, explores how private companies are turning to emerging and fast-growing markets that, in the recession year of 2009, contributed to only half of the world’s GDP but accounted for all of its growth.2
None of the executives interviewed for this research regret their decision to move into the EFGMs. All say that the more experience abroad they gain, the more the perceived risk of doing business there diminishes for them. And while their near-term impetus for investing away from home might be immediate growth via market penetration in countries with a rapidly expanding middle class, the executives we spoke with also expect to reap the longer-term benef it of greater global competitiveness, with more opportunities to outsource and to develop a lower cost base as the world’s economic center of gravity moves to the south and east.
1 According to the International Monetary Fund, in 2008 the “emerging and developing” category of countries accounted for 90% of the world’s growth; in 2009, when the mature economies shrank, these countries accounted for all of the growth.
2 The rising economies of Asia, Latin America, Eastern Europe, the Middle East, and Africa—typically referred to as emerging markets—are described in this paper as emerging and fast-growing markets (EFGMs). The commonly used distinction between emerging and mature economies still has considerable validity, especially on a per-capita GDP basis. In this report, EFGMs encompass markets outside North America, Western Europe, Australasia, and Japan that are experiencing rapid development.
Where private companies are going The BRICs and beyond
Preface
Companies are going where demand is growing — and they are going there in large numbers. All of the 158 survey participants have already moved to establish operations abroad or are planning to do so in the next three years. The most frequently mentioned destinations are the BRICs: Brazil, Russia, India, and China. But the story of EFGM ascendency is broader than just the BRICs: Survey results suggest that six additional markets — Mexico, South Korea, Turkey, Poland, Indonesia, and South Africa — repre-sent the second wave of overseas investment.
Figure 1 Top targets for foreign investment by private companies
Q1: In which of these emerging and fast-growing markets are you doing or considering doing business? (N = 158)
60%
40%
20%
China
Mex
ico
Indones
ia
Egypt
India
South K
orea
South A
frica
Thailan
d
Brazil
Turk
ey
Taiw
anChile
Russia
Poland
Czech
Rep
ublic
Colom
bia
Argen
tina
Among survey respondents, most com-panies planning investments in the BRICs already operate in those countries. Like-wise, companies investing in EFGMs such as Mexico or Poland already have opera-tions there.
Who took the surveyThe survey, conducted by the Economist Intelligence Unit on behalf of PwC, was designed to discover why and how non-f inancial private companies are investing abroad. A total of 158 corporate chiefs, directors, and senior executives of non-f inancial private companies from around the world participated in the survey. Two-thirds of the respondents are either C-suite executives (61%) or board members. They hail from companies either already operating in EFGMs or planning to establish operations there imminently. These f irms are mainly headquartered in Western Europe (47%) or North America (40%). They come from across 17 industries and represent a range of company sizes, from US$100m to US$5bn in annual revenue; 58% of respondents work at f irms with annual revenue of US$500m or more.
8 Private Company Services Private Company Services 9
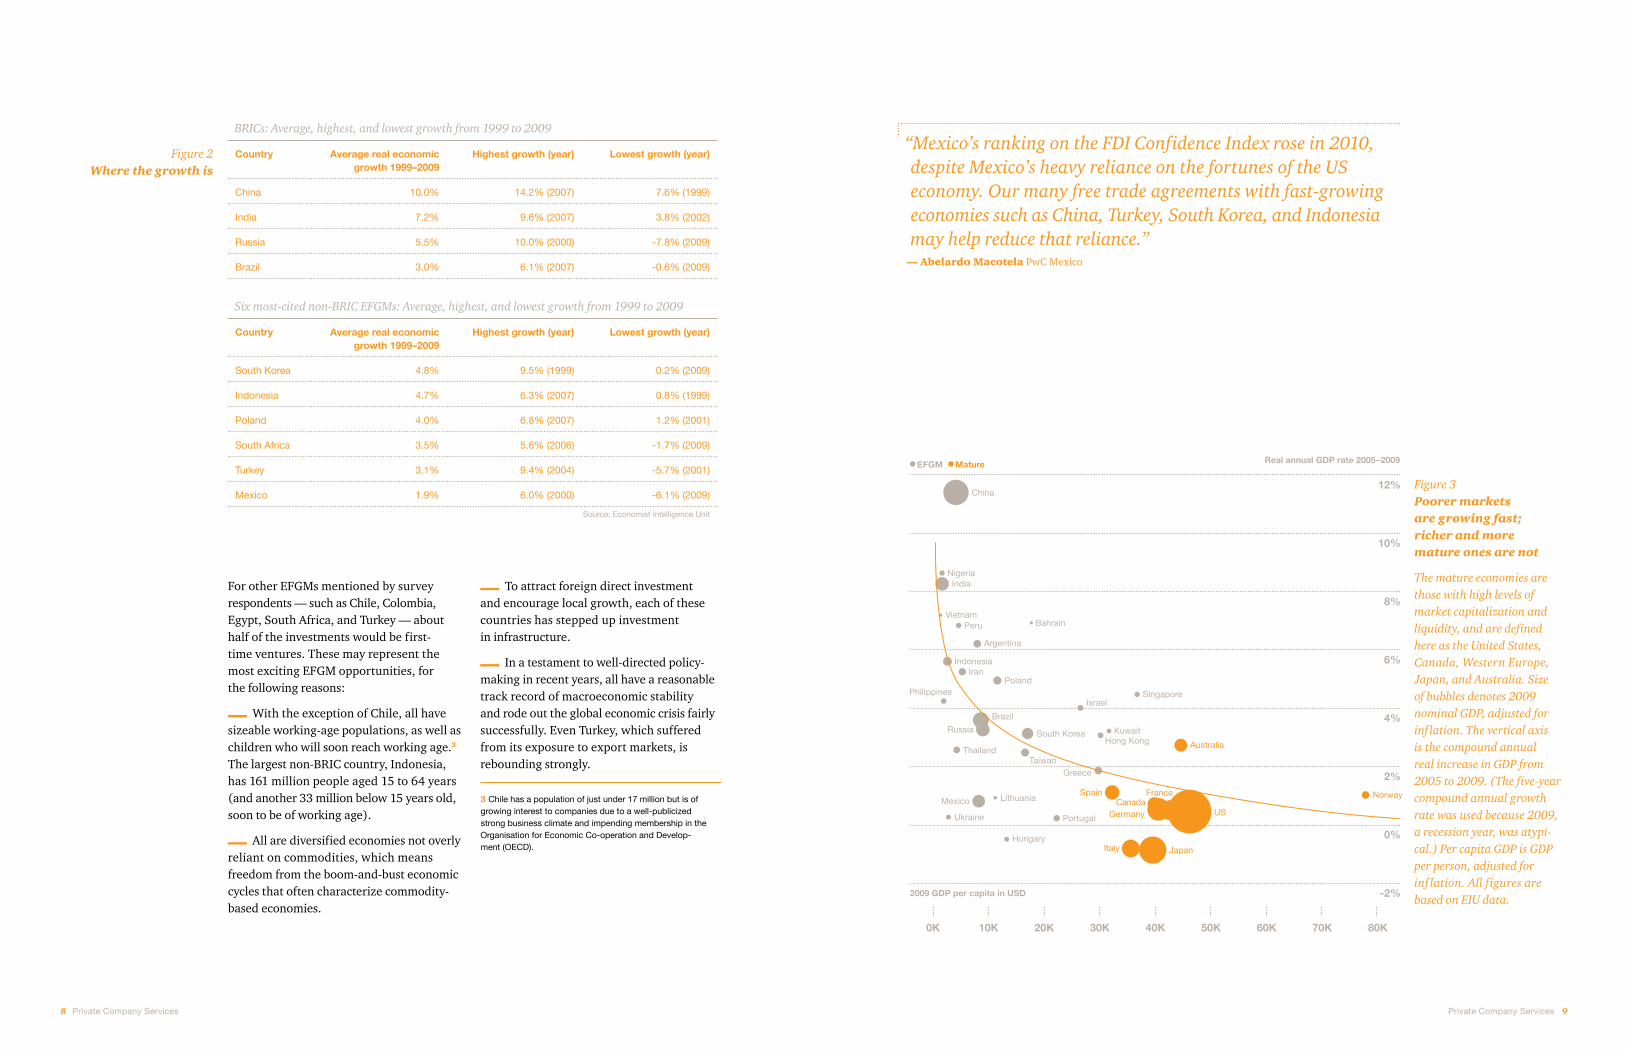
Figure 2 Where the growth is
For other EFGMs mentioned by survey respondents — such as Chile, Colombia, Egypt, South Africa, and Turkey — about half of the investments would be f irst- time ventures. These may represent the most exciting EFGM opportunities, for the following reasons:
With the exception of Chile, all have sizeable working-age populations, as well as children who will soon reach working age.3 The largest non-BRIC country, Indonesia, has 161 million people aged 15 to 64 years (and another 33 million below 15 years old, soon to be of working age).
All are diversif ied economies not overly reliant on commodities, which means freedom from the boom-and-bust economic cycles that often characterize commodity-based economies.
To attract foreign direct investment and encourage local growth, each of these countries has stepped up investment in infrastructure.
In a testament to well-directed policy-making in recent years, all have a reasonable track record of macroeconomic stability and rode out the global economic crisis fairly successfully. Even Turkey, which suffered from its exposure to export markets, is rebounding strongly.
Country Average real economic growth 1999–2009
Highest growth (year) Lowest growth (year)
China 10.0% 14.2% (2007) 7.6% (1999)
India 7.2% 9.6% (2007) 3.8% (2002)
Russia 5.5% 10.0% (2000) -7.8% (2009)
Brazil 3.0% 6.1% (2007) -0.6% (2009)
BRICs: Average, highest, and lowest growth from 1999 to 2009
Country Average real economic growth 1999–2009
Highest growth (year) Lowest growth (year)
South Korea 4.8% 9.5% (1999) 0.2% (2009)
Indonesia 4.7% 6.3% (2007) 0.8% (1999)
Poland 4.0% 6.8% (2007) 1.2% (2001)
South Africa 3.5% 5.6% (2006) -1.7% (2009)
Turkey 3.1% 9.4% (2004) -5.7% (2001)
Mexico 1.9% 6.0% (2000) -6.1% (2009)
Six most-cited non-BRIC EFGMs: Average, highest, and lowest growth from 1999 to 2009
Source: Economist Intelligence Unit
3 Chile has a population of just under 17 million but is of growing interest to companies due to a well-publicized strong business climate and impending membership in the Organisation for Economic Co-operation and Develop- ment (OECD).
Figure 3 Poorer markets are growing fast; richer and more mature ones are not The mature economies are those with high levels of market capitalization and liquidity, and are defined here as the United States, Canada, Western Europe, Japan, and Australia. Size of bubbles denotes 2009 nominal GDP, adjusted for inf lation. The vertical axis is the compound annual real increase in GDP from 2005 to 2009. (The five-year compound annual growth rate was used because 2009, a recession year, was atypi- cal.) Per capita GDP is GDP per person, adjusted for inf lation. All figures are based on EIU data.
0K 10K 20K 30K 40K 50K 80K60K 70K
12%
10%
8%
6%
4%
0%
2%
-2%
China
India
Vietnam
Nigeria
Peru
Argentina
Bahrain
KuwaitHong Kong
Israel
PolandIran
Indonesia
Philippines
Brazil
Russia
Thailand
Ukraine
Lithuania
TaiwanGreece
South Korea
Mexico
Hungary
Portugal
Singapore
Italy Japan
Germany
Spain FranceCanada
US
Australia
Norway
2009 GDP per capita in USD
Real annual GDP rate 2005–2009MatureEFGM
“Mexico’s ranking on the FDI Confidence Index rose in 2010, despite Mexico’s heavy reliance on the fortunes of the US economy. Our many free trade agreements with fast-growing economies such as China, Turkey, South Korea, and Indonesia may help reduce that reliance.”
— Abelardo Macotela PwC Mexico

10 Private Company Services Private Company Services 11
Why are they going there? The successful experience so far
Past three years
15% to 25% growth
5% to 15% growth
0% to 5% growth
Decrease
0% 15% 30% 45% 0% 15% 30% 45%
Over 25% growth
Next three years
Home market Overseas market
0% 100%100%
Market growth opportunities
Economic slowdown in developed markets
Outsourcing opportunities or lower cost base
Better location to serve global clients
Competitive pressures in your home market
Closer proximity and access to other major markets
Easier regulatory environment
Better availability of talent
Better access to natural resources
The need to follow competitors
A better environment for innovation
ImportantUnimportant
Figure 5 Revenue growth abroad beats domestic growth — both now and in the future
Q9&10: Over the past three years, what has been the average annual rate of revenue growth in your company’s home market? (N=153) Outside your home market? What do you expect at home and abroad in the next three years? (N=128)
Figure 4 Bright prospects outside slow-growing, increas-ingly competitive home markets are the main driver of private-company investments in EFGMs
Q6: Why has your company invested in emerging and fast- growing markets? (N=158)
Eighty-two percent of survey respondents say that the opportunity to grow is highly important in driving their investment decisions (see Figure 4). Despite the global downturn, companies’ performance in EFGMs in recent years has been impres-sive — and signif icantly better than that of their home markets.
Eighty percent of respondents report aver- age annual revenue growth of more than 5% in EFGMs in the past three years, while 40% enjoyed annual growth of more than 15%. Performance is expected to improve further over the next three years and sub- stantially outstrip that in companies’ home markets: 84% of survey-takers expect average annual revenue growth to exceed 5% in EFGMs where they have already invested; 57% expect revenues to grow more than 15% per year.
While the pull is the lure of growth, the push is the outlook at home. Burdened by aging populations, sticky wages, high cost structures, reluctant consumers, deleveraging banks, and higher public debt burdens, the mature economies appear to be stagnating. Stay and stagnate, or go and grow? For most executives, the answer is clear. To them, expanding abroad is increasingly viewed as a necessity, not just an attractive option.
This shift in focus is evident in UK-head-quartered Arup Group, a building design and engineering f irm. Its COO, David Whittleton, admits that the company’s early expansions abroad, which began with Ireland, were not necessarily part of a set strategy. If the f irm won business in a coun- try and saw the promise of more, it set up shop. But its approach to foreign investment has changed recently. The company has identif ied Russia, for example, as a country with market potential that demands a pres- ence. Arup now employs roughly 75 people in Moscow and a similar number in St Pe- tersburg. It has also been looking at other leading EFGMs, expanding strongly in China (via Hong Kong), where it now employs roughly 600 workers.
“Nearly three-quarters of India’s population resides in rural areas. There you have what remains a largely untapped consumer base.”
— Rama Krishna PwC India
12 Private Company Services Private Company Services 13
Global competitiveness Greater global competitiveness is another clear benef it of investing abroad. Much of that competitiveness stems from oppor-tunities to outsource in EFGMs and to develop a lower cost base there. As Jochen Meissner, CEO of Goss International, a global printing and publishing company based in the United States, notes, moving into China helped Goss’s mature business “lower the overall cost structure.” Goss’s experience highlights another benef it of global expansion: visibility to the next generation of global investors. The company was bought out by Chinese investors after establishing operations there.
The journey to greater global expansion also involves going up against a more global group of competitors. A sizeable majority (74%) of respondents say that subsidiaries of foreign multinationals are their main competitors in key EFGMs. Yet local compa- nies and locally based multinationals are also cited as main competitors by large minorities (49% and 42%, respectively). At the moment, many companies still operate in a two-tier market, and local competition is mainly at the cheaper end. Mr Meissner notes that in China, “We compete on two different levels. There is the so-called import segment, where we face our traditional Japanese and German competitors. But there is also a domestic segment, where we have a number of Chinese competitors.”
Because competition from EFGM f irms will continue to grow, extending beyond EFGMs into mature markets, the opportunity to face these competitors early — and to learn from them — can be seen as an advantage. EFGM competitors have years of experience in low-cost manufacturing, strong local knowledge, and the relationships to compete strongly with their Western counterparts in cheaper segments. As they move up the value chain they will pursue expansion through acquisition, in search not just of market share but also of technology, know- how, and established brands. For Western manufacturers, keys to competing success-fully with these f irms include eff iciency, strong supplier relationships, and the con- stant quest for improvement (as in, for instance, lean manufacturing processes).
“Chinese businesses are no longer in the shadow of their foreign counterparts.”
— Humphrey Choi PwC China
Private companies that have already invested in EFGMs have generally found it rewarding, survey data show. Smaller companies can be just as successful as their larger counterparts when investing overseas — as the executives interviewed for this research demonstrate. They are often more nimble than bigger, public companies when it comes to drawing on peer networks, enlisting local advisors, and collaborating with local partners.
For example, when Koch Enterprises, a US-based company that manufactures aluminum die-casting parts, sought to move into Brazil, it solicited recom- mendations from its automotive customers and eventually acquired a struggling local f irm. Goss, meanwhile, started its operations in China by launch ing a joint venture with a Chinese f irm, Shang- hai Electric, which is now Goss’s parent company.
Nimbleness and leveraging relationships aren’t useful simply in helping companies get an initial foothold in EFGMs. They can also be helpful in coping with business challenges brought on by success in those markets. Gus Ramirez, CEO of US-based Husco International, which provides components for off-road vehicles, relates his experience of meeting the challenge of rapid growth in China, where his f irm supplies a large Chinese equipment manufacturer: “The growth rates are just incredible,” he says. “The challenge of staying on top of the demand is certainly unlike that of any other country we have ever worked in.”
Husco meets the challenge by cultivating suppliers. The recession of 2008 and 2009 created turmoil in the small universe of companies supplying criti-cal automotive components, with demand dropping by as much as 80% in some cases. After pulling back, many found it diff icult to f inance the ramping up of operations in response to renewed demand. Luckily, Husco has experience in dealing with ex-treme market cycles: “We deal in a cyclical business in cyclical markets. We go down hard and come back hard,” says Mr Ramirez. “That’s the nature of [the] industry.”
To respond quickly to these f luctuations in demand, Husco focuses on four factors:
Volume Husco seeks preference from suppliers by being a big buyer. “We want to be important to [our suppliers],” says Mr Ramirez. “So we work very hard to have exclusive relationships.” Even when Husco’s suppliers sell to the industry as a whole, Husco strives to remain at or near the head of the line. In every case, says Mr Ramirez, “We want to be number one or no worse than second so that we get priority.”
Support Husco has helped domestic Chinese companies get into the automotive components business. F irst, it provides expertise: Although Husco doesn’t make the parts itself, its executives know the processes required to make them, as well as what capital equipment is necessary. “It typically takes two or three years to take [new suppliers] up the learning curve,” says Mr Ramirez. Second, Husco provides suff icient volume to ensure a viable business oppor- tunity for the local company. “The combination of the two is critical,” says Mr Ramirez.
Diversification In cyclical markets, the drawbacks of a brittle supply chain become apparent — as do the advan-tages of f lexibility. Husco has suppliers in Europe, India, China, North America, and South America. Many have similar capabilities. If one stumbles, another can often take over. “That’s the game of manufacturing,” says Mr Ramirez. “You’re always juggling. If one ball falls, you better be nimble enough to put another ball in the air.”
Building relationships F inally, suggests Mr Ramirez, it is diff icult for Westerners to overestimate the power of personal relationships in Asia. In North America he allows his staff to manage supplier relationships. Not in Asia: Every visit is spent paying personal calls on the owners and senior executives of as many suppliers as possible.
These factors don’t completely solve the problem of keeping up with demand in hot markets. But they do help Husco manage its business better when the company inevitably hits a snag.
Private-company EFGM success stories

14 Private Company Services Private Company Services 15
Risk and the ability to cope with risk are two different things. The more experience a com- pany has in operating abroad, the better it can mitigate the risks. That said, some oper- ating environments are clearly riskier than others, and levels of risk change over time.
Measuring the risk of operating abroad Risk is a slippery concept to quantify even when applied to prices, populations, and other things that can be counted. But the art of quantifying qualitative risk concepts has developed rapidly as organizations like Transparency International (corruption), the World Bank (ease of doing business), the United Nations Development Programme (quality of life), and Friends of the Earth (ecological health) have taken on the task of aggregating information in specif ic categories and developing indices that show progress over time.
Since 2002, according to the ratings devel- oped by the Economist Intelligence Unit, the overall risk of operating in Brazil, Russia, and China — and all but four of the coun- tries cited by survey respondents as destina- tions for foreign operations — has fallen. Some of the declines in risk were dramatic.
Romania, Egypt, and Argentina wit- nessed the biggest declines. Macroeconomic risk dropped as the economies of all three countries became more robust. Financial risk fell when Argentina’s banking sector became stronger and more eff icient. Roma- nia acceded to the EU in 2007 and has made progress in tackling corruption and regulatory convergence. And Egypt’s infra- structure — especially port facilities, air transport, and IT connectivity — improved signif icantly, cutting infrastructure risk.
Brazil, China, and Russia also pose less risk to foreign companies than they did eight years ago. (India’s risk rating hasn’t changed.) All three countries have more-resilient governments and economies and more-developed f inancial markets than they did in 2002. Brazil’s infrastructure has not kept up with its growth, while the infrastructure of the other three countries was judged to have improved, especially in India and China.
China’s risk rating improved signif i-cantly in the category of legal and regulatory risk, particularly regarding speediness and fairness of judicial processes and unfair competitive practices.
South Korea saw a slight increase in risk. Its risk score was very low to start with; the small increase mainly ref lects the possibility of an economic downturn resulting from the country’s extreme export dependence.
The risk landscape How it’s changing
“Foreign investors are generally cautious about Indonesia because of certain misconceptions out there. For example, I don’t think the security risk is as dire as it’s been made out. Overall, Indonesia is pretty stable.”
— Ray Headifen PwC Indonesia
The risk-reward equation turns more favorable with greater market exposure While the actual level of risk in an EFGM may decline for a variety of reasons, a decrease in a company’s perception of risk tends to hinge primarily on exposure. The more EFGMs a company invests in, the more its ability to cope with risks grows, and hence the more comfortable its leaders become with taking the plunge into new markets. For instance, 75% of companies investing or planning to invest in just one or two EFGMs see China as a market with high risk, compared with just 41% of companies investing or planning to invest in f ive or more markets.
This decline in perceived risk is ref lected in the hurdle rates of TI Automotive, a British company headquartered in Detroit. According to TI Automotive CEO Bill Kozyra, the company used to require a higher inter- nal rate of return in EFGMs — up to 35%, compared with 20% for a mature economy — to compensate for what it saw as higher risk. Now the company considers a 20% rate of return in EFGMs suff icient. “In the last two years,” he adds, “we’ve certainly had more stability in countries such as India and China in terms of volume growth, versus Western Europe.”
Arup’s Mr Whittleton also notes this narrow-ing of the risk gap between EFGMs and more mature economies. And trends that are contributing to a lower level of risk may present business opportunities. For example, as Indonesia’s government works to make the country more attractive to foreign investors, observes Mr Whittleton, there’s a signif icant market developing for the types of services the company offers.
10
0
-10
Mex
ico
Brazil
Russia
Avera
ge
Poland
Greec
eIn
dia
Turk
ey
Singap
ore
Venez
uela
USSouth K
orea
Germ
any
China
Roman
ia
Indones
ia
Ratings are on a scale of 0–100. Positive change equates to decline in risk
Number of countries in which company has invested: 1–2 countries 5 or more countries
Figure 6 Change in EIU overall business risk ratings for selected countries since 2002
Figure 7 The more countries a company invests in, the less likely executives are to characterize key EFGMs as “high risk”
Percentage of executives who say that investment in a country is “high risk”
50%
100%
0%Russian Federation China Brazil India

16 Private Company Services Private Company Services 17
A global supplier of automotive f luid systems that’s headquartered in Detroit (although incorpo-rated in the UK), TI Automotive employs some 14,000 people in 27 countries. It relies on its close proximity to the auto companies’ assembly plants around the world, as shipping costs are not eco- nomical. It therefore operates in a number of EFGMs, in Asia, Latin America, Eastern Europe, and Africa, including all four BRIC countries.
Bill Kozyra, TI Automotive’s CEO, says that the main diff iculty in working in EFGMs is that different regulatory frameworks can change the economics and execution of strategic initiatives. The real issues are the amount of regulation, the clarity and complexity of regulations, the diff iculties of compliance, and executives’ lack of familiarity with regulation in different kinds of economic systems.
For example, in China, where TI Automotive has 12 manufacturing facilities, the process of f inding land is a major issue. Land must be rented from the Chinese government, and “there’s a long lead time,” Mr Kozyra says. He estimates that it takes roughly three years to set up a factory in China, compared with a year in Mexico.
Extensive and lengthy experience operating in a market helps companies deal with the challenges and manage the risks. For example, despite China’s reputation as a risky environment for intel- lectual property (IP), the company’s 25 years of experience in China have convinced it that placing its most valuable technology there does not put the company at risk.
TI Automotive has also made a point of employing only local staff to manage its foreign operations, which helps navigate any obstacles. “Our president of [operations in] China is a Chinese national,” notes Mr Kozyra. “His whole management team are Chinese nationals. We don’t have any Westerners running our business for us. The same is true [of our operations] pretty much all over the world.”
While China and India are TI Automotive’s fastest-growing markets, establishing the company in those countries has not come overnight — it began operating there 30 years ago. “You have to be patient and plant seeds, and develop them over decades,” says Mr Kozyra.
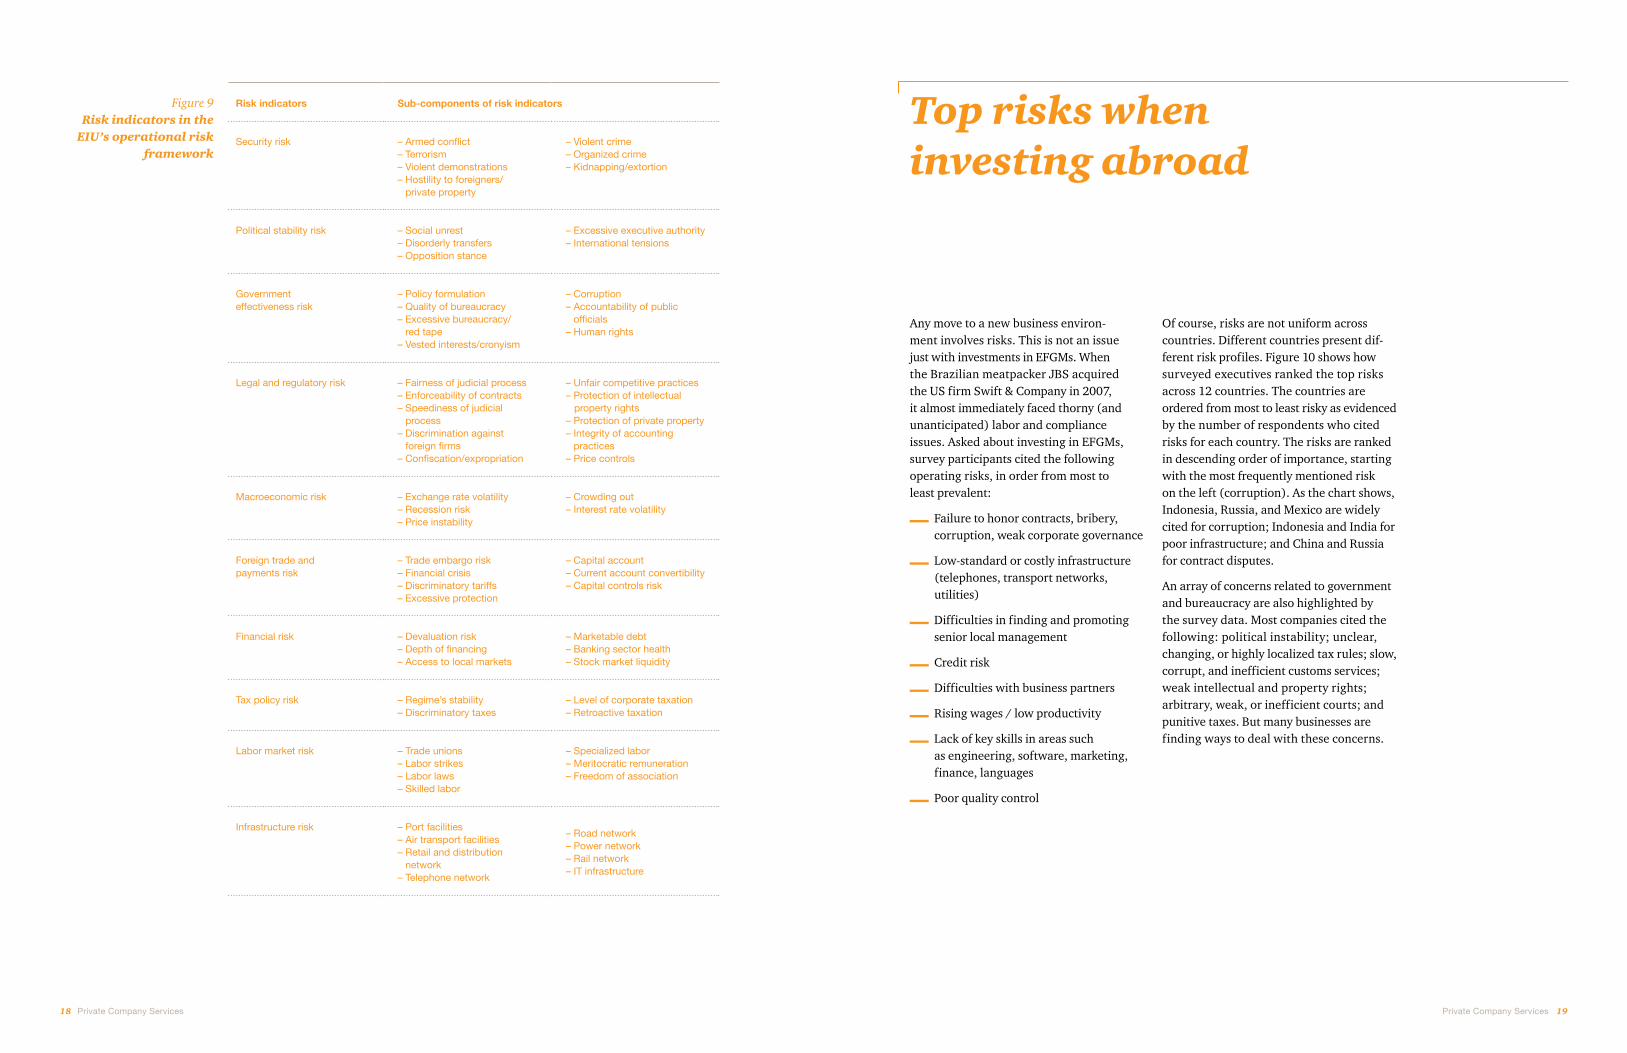
Case study: TI AutomotiveDeconstructing risk: The EIU business risk framework Since 1982, the Economist Intelligence Unit has maintained a set of operational risk indicators designed to quantify the risks to business prof itability across 180 countries. The overall score is an average of ten sub- scores, each of which is based on four to ten specif ic ratings (see Figure 9). The result is a framework of risk indicators built up from the specif ic to the general, and based on criteria that are clearly def ined and stable over time.
Although the risk scale theoretically runs from zero to 100, no country receives a score of zero or 100. This ref lects that even the least risky countries have some risk, while riskiest countries could become even more risky. (Switzerland is currently judged to have the lowest risk, at 10, while Somalia is the highest, at 83.)
Figure 8 shows the world’s major economies plotted by operational risk (the horizontal axis) versus the forecast compound annual real GDP growth rate from 2010 to 2015. In general, the higher the operational risk, the higher the GDP growth. But some countries (China and India in particular) offer an extremely high rate of growth relative to the level of risk, while others (such as Italy, Portugal, and Japan) are far below the trendline.
Figure 9 shows the hierarchy of risks that make up the risk framework. About one-third of the indicators are based on quantitative data (e.g., crime statistics) and are mostly drawn from recognized national and international statistical sources. All make use of in-country experts who provide detailed, regular information on conditions within a country. Since companies in differ- ent industries pay attention to different risks, the indicators can be weighted to create a company-specif ic risk assessment.
10 20 30 40 50 60 8070
9%
8%
7%
6%
5%
4%
3%
1%
2%
0%
South Korea
Venezuela
Netherlands
India
QatarVietnam
Indonesia Nigeria
Kazakhstan
KenyaTurkey
Egypt
RussiaThailand
PakistanMexico
Romania
Brazil
KuwaitMalaysiaChile
Singapore
Hong Kong
TaiwanPoland
Iran
Portugal
Italy
Japan
US
Australia
Sweden
Finland
Germany
China
EIU operational risk score 2010–2015 (higher is riskier)
Compound annual real GDP growth rate 2010–2015MatureEFGM
Size of bubbles denotes forecast nominal GDP in 2015. Forecast growth is compound annual real increase in GDP. The operational risk score is the simple average of 10 sub-scores covering security, political stability, government effective- ness, legal and regulatory environment, macroeco-nomic risk, foreign trade and payments, financial markets, tax policies, the labor market, and infra-structure (see Figure 9). All figures are based on EIU data.
Figure 8Forecast real GDP growth rate versus operational risk score for major economies, 2010–2015
18 Private Company Services Private Company Services 19
Figure 9 Risk indicators in the
EIU’s operational risk framework
Risk indicators Sub-components of risk indicators
Security risk – Armed conflict – Terrorism – Violent demonstrations – Hostility to foreigners/
private property
– Violent crime – Organized crime – Kidnapping/extortion
Political stability risk – Social unrest – Disorderly transfers – Opposition stance
– Excessive executive authority – International tensions
Government effectiveness risk
– Policy formulation – Quality of bureaucracy – Excessive bureaucracy/
red tape– Vested interests/cronyism
– Corruption – Accountability of public
officials– Human rights
Legal and regulatory risk – Fairness of judicial process – Enforceability of contracts – Speediness of judicial
process– Discrimination against
foreign firms– Confiscation/expropriation
– Unfair competitive practices – Protection of intellectual property rights – Protection of private property – Integrity of accounting
practices– Price controls
Macroeconomic risk – Exchange rate volatility – Recession risk – Price instability
– Crowding out – Interest rate volatility
Foreign trade and payments risk
– Trade embargo risk – Financial crisis – Discriminatory tariffs – Excessive protection
– Capital account – Current account convertibility – Capital controls risk
Financial risk – Devaluation risk – Depth of financing – Access to local markets
– Marketable debt – Banking sector health – Stock market liquidity
Tax policy risk – Regime’s stability – Discriminatory taxes
– Level of corporate taxation – Retroactive taxation
Labor market risk – Trade unions – Labor strikes – Labor laws – Skilled labor
– Specialized labor – Meritocratic remuneration – Freedom of association
Infrastructure risk – Port facilities – Air transport facilities – Retail and distribution
network– Telephone network
– Road network – Power network – Rail network – IT infrastructure
Top risks when investing abroad
Any move to a new business environ- ment involves risks. This is not an issue just with investments in EFGMs. When the Brazilian meatpacker JBS acquired the US f irm Swift & Company in 2007, it almost immediately faced thorny (and unanticipated) labor and compliance issues. Asked about investing in EFGMs, survey participants cited the following operating risks, in order from most to least prevalent:
Failure to honor contracts, bribery, corruption, weak corporate governance
Low-standard or costly infrastructure (telephones, transport networks, utilities)
Diff iculties in f inding and promoting senior local management
Credit risk
Diff iculties with business partners
Rising wages / low productivity
Lack of key skills in areas such as engineering, software, marketing, f inance, languages
Poor quality control
Of course, risks are not uniform across countries. Different countries present dif- ferent risk prof iles. Figure 10 shows how surveyed executives ranked the top risks across 12 countries. The countries are ordered from most to least risky as evidenced by the number of respondents who cited risks for each country. The risks are ranked in descending order of importance, starting with the most frequently mentioned risk on the left (corruption). As the chart shows, Indonesia, Russia, and Mexico are widely cited for corruption; Indonesia and India for poor infrastructure; and China and Russia for contract disputes.
An array of concerns related to government and bureaucracy are also highlighted by the survey data. Most companies cited the following: political instability; unclear, changing, or highly localized tax rules; slow, corrupt, and ineff icient customs services; weak intellectual and property rights; arbitrary, weak, or ineff icient courts; and punitive taxes. But many businesses are f inding ways to deal with these concerns.

20 Private Company Services Private Company Services 21
South Africa India Mexico China
“The different kinds of taxes and all the places where the taxes are levied” has been challenging for the Brazilian operations of Koch Enterprises, acknowledges the company’s CEO Robert Koch. But he says the company hired Brazilian accountants to help overcome the challenge and used the accounting system of a Brazilian f irm it had acquired while Koch’s management gained familiarity with the different taxes.
Minimizing these and other risks entails learning to work with governments in EFGMs — and not just at a national level. However, lack of access to government off icials is among the risks cited by a large minority of companies surveyed, and overcoming it may take a concerted effort. According to Mr Koch, when a f irm invests in China, “you invite all the local govern-ment off icials, and there are f ireworks and a big party.”
Macroeconomic instability Aside from regulatory burdens, macro- economic instability over the long term remains a leading worry, cited by 81% of the companies we surveyed. The economic volatility of the past f ive years makes this an issue for all companies, public and private, domestic and international, regardless of where they’re investing. While it’s true that companies investing in EFGMs may be facing a legacy of the days of emerging-market boom and bust, including the crises in the 1990s (Mexico, Russia, Brazil, Argentina, and Asian countries), EFGMs have increased their economic resilience considerably in recent years. For many of them, growth either held up well during the recent global economic crisis or rebounded quickly thereafter. Meanwhile, macroeconomic volatility in mature markets has grown.
Despite the concern about bureaucracy, executives like Husco’s Mr Ramirez have found ways to work through the impedi-ments — for instance, by employing local staff who are familiar with local regula-tions and can help build strong relationships with key civil servants. Indeed, 84% of respondents say that they use locals to staff foreign operations, and not just for junior posts: Where locals are employed, they occu- py senior positions in 75% of f irms surveyed.
But retaining staff can be a challenge. Fifty- six percent of respondents say that pressure on wages is a signif icant problem and that job-switching is frequent. Speaking of his f irm’s India operations, Mr Ramirez of Husco says: “People tend to leave for smaller [wage] premiums than would be the case in the United States. But if you keep on top of it and ensure that your key people are appropri-ately paid, compensated, and promoted, you can deal with that challenge.”
Some companies are now looking again at markets they previously considered too volatile. “Historically we steered away from setting up manufacturing [in Brazil] because the cycles there have been very steep,” says Mr Ramirez of Husco. “Even though you make a lot of money in good times, you tend to lose a lot of money in bad times. [But] I think that’s changing, and my expectation is that over the next f ive years we will likely have some form of manufacturing in Brazil as well.”
Indonesia Russia Brazil Turkey Poland Czech Republic South Korea Taiwan
60%
40%
20%
Corruption Economic instability Poor corporate governancePoor infrastructure Political instability Contract disputes
“Hong Kong Chinese and home-country personnel are no longer the primary ones running foreign businesses on the mainland. The local people are taking on greater responsibility, too. This is what we call the succession plan.”
— Humphrey Choi PwC China
“Brazil is stronger than it was before the global crisis began. Within six to eight months, our economy rebounded. Fortunately, Brazilian companies were already running lean before the crisis started, and so they were in good shape to weather the downturn.”
— Carlos Mendonça PwC Brazil
Figure 10 Top risks by country
cited by surveyed executives
Only countries and risks with at least
15 responses were included

22 Private Company Services Private Company Services 23
In the new competitive landscape, where businesses from across the world are competing everywhere in the world, private companies are increasingly looking to EFGMs for the best growth opportunities. They’re eyeing not only the BRICs, but also smaller economies that are equally dynamic and ascending rapidly. Successfully pursuing growth opportunities in EFGMs entails putting the following actions at the heart of a company’s corporate strategy:
Build networks. Executives should develop strong networks of advisors, part- ners, and government contacts to ensure that they go into markets well-informed of the operating realities. One example is Koch Enterprises’ solicitation of advice from its Brazilian customers before its move there. Another is Goss’s joint venture with Shanghai Electric.
Cultivate local talent. Local exec- utives — and local partners — will become the rule. Aware of the risks in each market and drawing on their experience there, local executives and partners will be able to f ind ways to mitigate those risks. Mr Kozyra of TI Automotive partly credits his company’s ability to deal with local obstacles to the deci- sion to employ only local staff at all locations and levels around the world.
Build a strong due diligence process. Companies should learn as much as they can about how the local business environment might affect operations. Says Mr Koch of his company’s entrance into China and Brazil: “Probably the longest part was our preliminary investigations, learning more about the country, the culture, the geography, where our customers would be, where competition might be, the quality of competition.” Here is where tapping net- work relationships can be especially helpful, particularly for private companies that don’t have the investigative resources of a large, public multinational.
Focus on planning, leavened with f lexibility. Companies that operate in — or plan to enter — EFGMs need to plan well. In economies as dynamic and evolving as EFGMs, good planning entails constantly ref ining strategies to meet local needs and keep pace with competition. Says Arup’s Mr Whittleton about the need for f lexibility: “There is no single development model for us that suits all of these markets. There’s no template that you take to Russia that you [then] take to China and Vietnam. You have to tailor it to the local needs.”
As they take these actions, companies will have to continually assess the shifting risk landscape — and against the backdrop of an increasingly volatile world economy. That landscape is broader than the EFGMs. Says Arup’s Mr Whittleton of the company’s decision to look outside the UK: “You could say that the UK is pretty risky at the moment on the grounds that expenditures are being cut and growth is very doubtful.” One could say that about other mature markets as well.
And so investment in EFGMs — where growth is near certain — looks ready to surge. Companies that regard such invest- ment as vital to their business strategy will f ind no shortage of opportunities along- side the challenges — and may even f ind that the rewards outweigh the risks, as many of the companies in our survey have already discovered.
What to do now
“Companies should come here with a long-term strategy. Those that do tend to be more successful than businesses that come looking for short-term gains.”
— Rama Krishna PwC India
Country snapshots Brazil, China, India, Indonesia, Mexico
Private Company Services 27
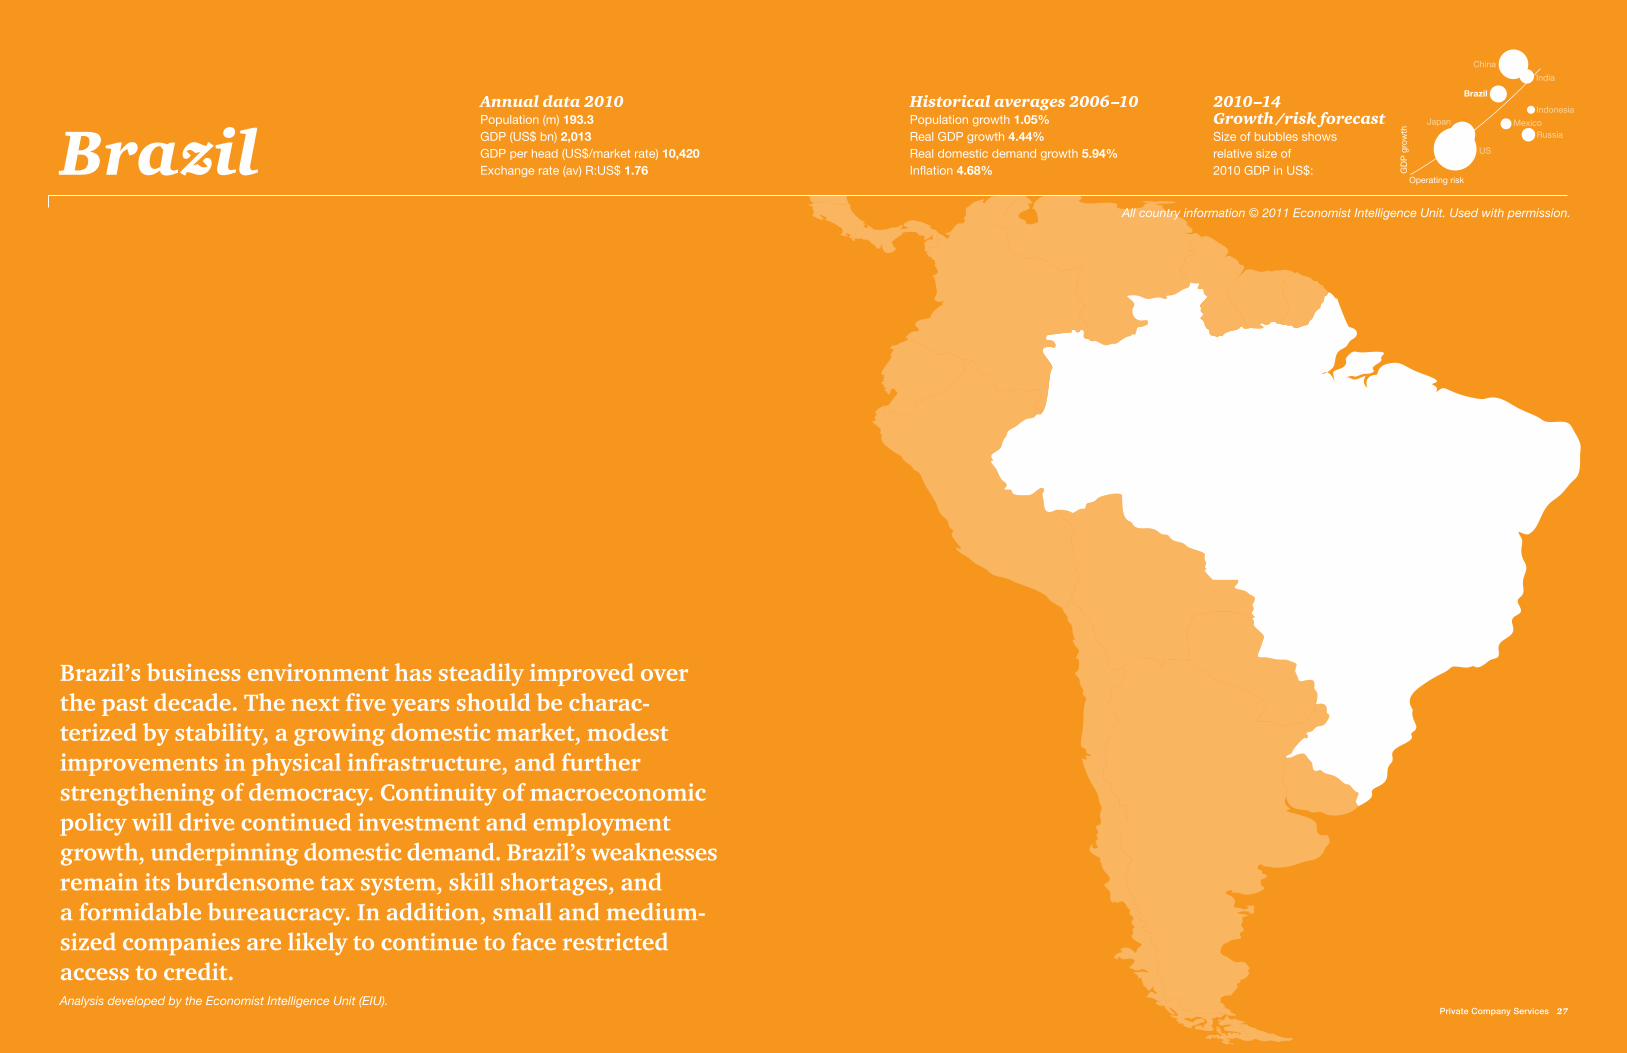
Brazil’s business environment has steadily improved over the past decade. The next f ive years should be charac- terized by stability, a growing domestic market, modest improvements in physical infrastructure, and further strengthening of democracy. Continuity of macroeconomic policy will drive continued investment and employment growth, underpinning domestic demand. Brazil’s weaknesses remain its burdensome tax system, skill shortages, and a formidable bureaucracy. In addition, small and medium-sized companies are likely to continue to face restricted access to credit.
All country information © 2011 Economist Intelligence Unit. Used with permission.
Analysis developed by the Economist Intelligence Unit (EIU).
Historical averages 2006–10 Population growth 1.05%Real GDP growth 4.44%Real domestic demand growth 5.94%Inflation 4.68%
Annual data 2010Population (m) 193.3GDP (US$ bn) 2,013GDP per head (US$/market rate) 10,420Exchange rate (av) R:US$ 1.76Brazil
2010–14 Growth /risk forecast Size of bubbles shows relative size of 2010 GDP in US$: G
DP
gro
wth
Operating risk
US
Japan
RussiaMexico
Indonesia
India
China
Brazil
28 Private Company Services Private Company Services 29
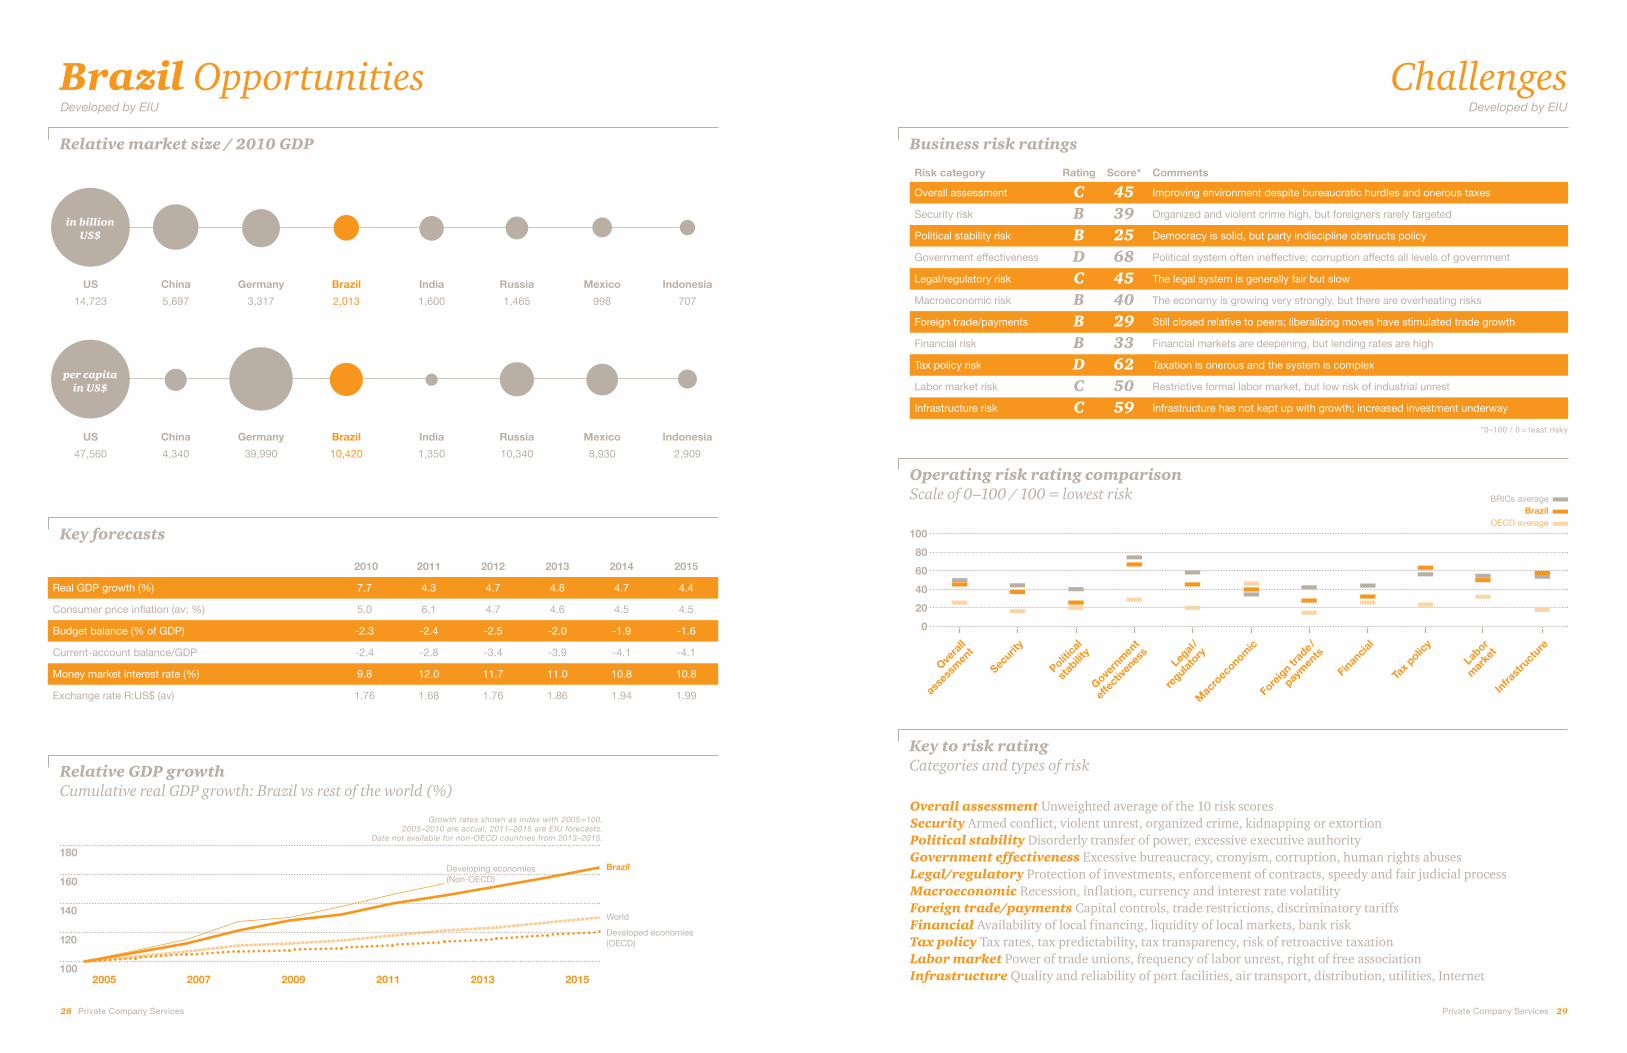
Brazil Opportunities Challenges
Relative market size / 2010 GDP
US China Germany Brazil India Russia Mexico Indonesia
14,723 5,697 3,317 2,013 1,600 1,465 998 707
US China Germany Brazil India Russia Mexico Indonesia
47,560 4,340 39,990 10,420 1,350 10,340 8,930 2,909
per capita in US$
in billion US$
2005 2007 2009 2011 2013 2015
180
160
140
120
100
World
BrazilDeveloping economies (Non-OECD)
Developed economies (OECD)
Key to risk rating Categories and types of risk
Overall assessment Unweighted average of the 10 risk scoresSecurity Armed conf lict, violent unrest, organized crime, kidnapping or extortionPolitical stability Disorderly transfer of power, excessive executive authorityGovernment effectiveness Excessive bureaucracy, cronyism, corruption, human rights abusesLegal/regulatory Protection of investments, enforcement of contracts, speedy and fair judicial processMacroeconomic Recession, inf lation, currency and interest rate volatilityForeign trade/payments Capital controls, trade restrictions, discriminatory tariffsFinancial Availability of local f inancing, liquidity of local markets, bank riskTax policy Tax rates, tax predictability, tax transparency, risk of retroactive taxationLabor market Power of trade unions, frequency of labor unrest, right of free associationInfrastructure Quality and reliability of port facilities, air transport, distribution, utilities, Internet
Business risk ratings
Risk category Rating Score* Comments
Overall assessment C 45 Improving environment despite bureaucratic hurdles and onerous taxes
Security risk B 39 Organized and violent crime high, but foreigners rarely targeted
Political stability risk B 25 Democracy is solid, but party indiscipline obstructs policy
Government effectiveness D 68 Political system often ineffective; corruption affects all levels of government
Legal/regulatory risk C 45 The legal system is generally fair but slow
Macroeconomic risk B 40 The economy is growing very strongly, but there are overheating risks
Foreign trade/payments B 29 Still closed relative to peers; liberalizing moves have stimulated trade growth
Financial risk B 33 Financial markets are deepening, but lending rates are high
Tax policy risk D 62 Taxation is onerous and the system is complex
Labor market risk C 50 Restrictive formal labor market, but low risk of industrial unrest
Infrastructure risk C 59 Infrastructure has not kept up with growth; increased investment underway
Key forecasts
2010 2011 2012 2013 2014 2015
Real GDP growth (%) 7.7 4.3 4.7 4.8 4.7 4.4
Consumer price inflation (av; %) 5.0 6.1 4.7 4.6 4.5 4.5
Budget balance (% of GDP) -2.3 -2.4 -2.5 -2.0 -1.9 -1.6
Current-account balance/GDP -2.4 -2.8 -3.4 -3.9 -4.1 -4.1
Money market interest rate (%) 9.8 12.0 11.7 11.0 10.8 10.8
Exchange rate R:US$ (av) 1.76 1.68 1.76 1.86 1.94 1.99
Relative GDP growth Cumulative real GDP growth: Brazil vs rest of the world (%)
Growth rates shown as index with 2005 = 100.2005–2010 are actual; 2011–2015 are EIU forecasts.
Data not available for non-OECD countries from 2013–2015.
*0–100 / 0 = least risky
Developed by EIU Developed by EIU
Operating risk rating comparison Scale of 0–100 / 100 = lowest risk BRICs average
BrazilOECD average
Overa
ll
asse
ssm
ent
Securit
y
Politica
l
stab
ility
Govern
men
t
effe
ctive
ness
Legal
/
regulat
ory
Mac
roec
onomic
Foreig
n trad
e/
paym
ents
Finan
cial
Tax p
olicy
Labor
mar
ket
Infra
stru
cture
100
80
60
40
20
0
30 Private Company Services Private Company Services 31
There is also considerable new invest-ment opportunity in the production of petroleum — specif ically in the “pre-salt” region off the coast of Brazil, where several years ago sizable oil f ields were discovered beneath a layer of salt under the ocean f loor. Unlike in the past, how- ever, foreign companies that don’t already have pre-existing licenses for oil explora-tion and production in Brazil will have to partner with the state-controlled oil producer Petrobras. Under new legisla- tion passed by Congress, Petrobras will be granted a minimum 30% stake in joint ventures with other oil companies that bid for exploration licenses. Building and maintaining good relationships with government off icials should help foreign companies navigate the new system.
The rapid growth of Brazil’s consumer class is just one development that is presenting new opportunities for foreign investors. There is also Brazil’s success in winning the bid to host the World Cup in 2014 and the Olympic games in 2016. Those two global events should accelerate much-needed investment in Brazil’s infrastructure, including its highways, ports, and railroads.
The state-owned Brazilian National Development Bank (BNDES), which has played a critical role in subsidizing long-term f inancing for infrastructure, estimates that the required investment could total more than $145 billion over the next three years. BNDES f inancing alone, however, will not be enough. Addi- tional investment must come from the private sector. Incentives for such invest- ment include tax credits given by Brazil’s Growth and Acceleration Program (PAC) to companies that invest in national infrastructure, with a focus on energy, transportation, and construction.
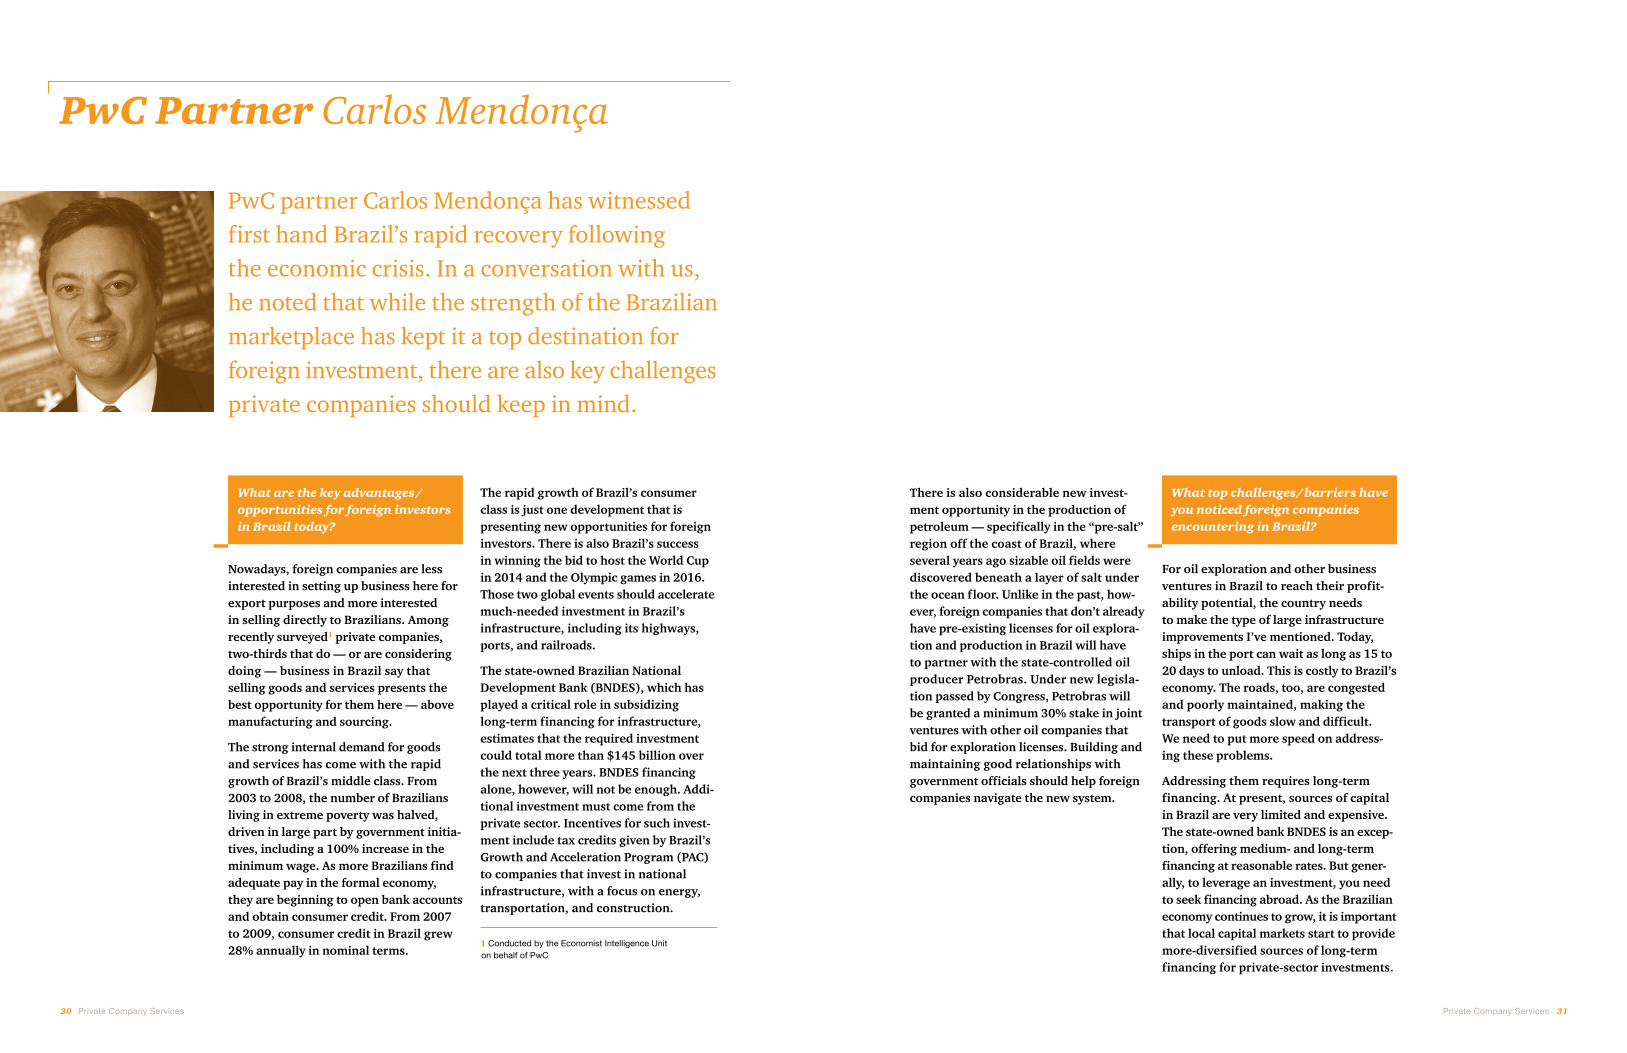
PwC partner Carlos Mendonça has witnessed f irst hand Brazil’s rapid recovery following the economic crisis. In a conversation with us, he noted that while the strength of the Brazilian marketplace has kept it a top destination for foreign investment, there are also key challenges private companies should keep in mind.
PwC Partner Carlos Mendonça
1 Conducted by the Economist Intelligence Unit on behalf of PwC
What are the key advantages / opportunities for foreign investors in Brazil today?
Nowadays, foreign companies are less interested in setting up business here for export purposes and more interested in selling directly to Brazilians. Among recently surveyed1 private companies, two-thirds that do — or are considering doing — business in Brazil say that selling goods and services presents the best opportunity for them here — above manufacturing and sourcing.
The strong internal demand for goods and services has come with the rapid growth of Brazil’s middle class. From 2003 to 2008, the number of Brazilians living in extreme poverty was halved, driven in large part by government initia- tives, including a 100% increase in the minimum wage. As more Brazilians f ind adequate pay in the formal economy, they are beginning to open bank accounts and obtain consumer credit. From 2007 to 2009, consumer credit in Brazil grew 28% annually in nominal terms.
What top challenges/barriers have you noticed foreign companies encountering in Brazil?
For oil exploration and other business ventures in Brazil to reach their prof it-ability potential, the country needs to make the type of large infrastructure improvements I’ve mentioned. Today, ships in the port can wait as long as 15 to 20 days to unload. This is costly to Brazil’s economy. The roads, too, are congested and poorly maintained, making the transport of goods slow and diff icult. We need to put more speed on address-ing these problems.
Addressing them requires long-term f inancing. At present, sources of capital in Brazil are very limited and expensive. The state-owned bank BNDES is an excep- tion, offering medium- and long-term f inancing at reasonable rates. But gener-ally, to leverage an investment, you need to seek f inancing abroad. As the Brazilian economy continues to grow, it is important that local capital markets start to provide more-diversif ied sources of long-term f inancing for private-sector investments.
32 Private Company Services Private Company Services 33
Carlos Mendonça
Leader of Private Company Services at PwC Brazil Tel +55 (11) 3674 3343 [email protected]
Other challenges that inbound compa-nies face generally result from cultural differences, which are encountered anytime you enter a new foreign market. Often, foreign investors in Brazil nego-tiate such differences by forming an alliance with a local company. In many cases it is a family-owned business. Family businesses — which contribute to half of Brazil’s GDP — tend to have greater f lexibility and quicker decision-making procedures than public com-panies. On the other hand, they may also have less-stringent governance controls. Recently surveyed private companies 3 nonetheless say their concern about inad- equate corporate governance is lower vis-à-vis Brazil than with respect to other BRIC countries.
Foreign partners in Brazilian joint ven- tures do, however, need to be aware that if they have a disagreement with their Brazilian counterpart, and the dispute goes to court, the matter can take a very long time to resolve — upwards of f ive or seven years, due to the complexity of Brazil’s judicial system. Most foreign companies are aware of this before com- ing here and draft their business contracts accordingly. Often, though, businesses later discover that they didn’t anticipate the full range of potential scenarios and so end up in court, after all. To reduce the likelihood of such surprises, foreign companies may want to enlist local expertise when drafting contracts.
Since the economic crisis, have you noticed a change in the dynamics of doing business in Brazil?
Brazil is stronger than it was before the global crisis began. Within six to eight months, our economy rebounded. For- tunately, Brazilian companies were already running lean before the crisis started, and so they were in good shape to weather the downturn. Throughout, internal consumer demand remained high, which kept unemployment low. With 60% of Brazil’s GDP driven by domes- tic demand, companies here couldn’t afford to dismiss workers. They needed them to build cars, TVs, refrigerators.
With a tighter f iscal and monetary policy, however, Brazil should expect to see a slowdown over the next year, with GDP growth declining from 9% — which is what it was in the f irst quarter of 2010 — to an anticipated 5% in 2011. Other contributing factors include declining prices for certain Brazilian commodities and an unfavorable exchange rate for exports. Sustainable growth will result only with increased productivity and higher investment levels.
To that end, we’re seeing continual foreign direct investment in Brazil, including the acquisition of local com-panies by private equity f irms. During the f irst half of 2010, private equity investors took part in 41% of the deals here, particularly transactions involving industry consolidation and small and medium-size companies in sectors such as IT and mining. So, yes, there are challenges, but I’d say that generally the dynamics of doing business in Brazil are good for foreign investors.
Taxes in Brazil are another top challenge. They are both high and complex. Out of 183 economies examined in a joint study by PwC and the World Bank Group, Brazil ranked highest in the number of hours it takes companies to comply with tax regulations.2 This is not just a technical issue but also a political one. Brazilian regulators have been postponing tax reform for more than 10 years. The fed- eral government is reluctant to reduce taxes because those are what fund Brazil’s large social benef its.
The government has, however, recently introduced a system that should decrease the lengthiness and complexity of complying with tax regulations. Called the Public System of Digital Bookkeeping (SPED), the new approach eliminates paperwork and unif ies the information required by the federal, state, and munic- ipal tax authorities. Although SPED should make tax compliance easier over the long term, and therefore less costly, its initial adoption is entailing some effort by companies.
2 Paying Taxes 2011: The Global Picture, PwC and the World Bank Group
3 Conducted by the Economist Intelligence Unit on behalf of PwC
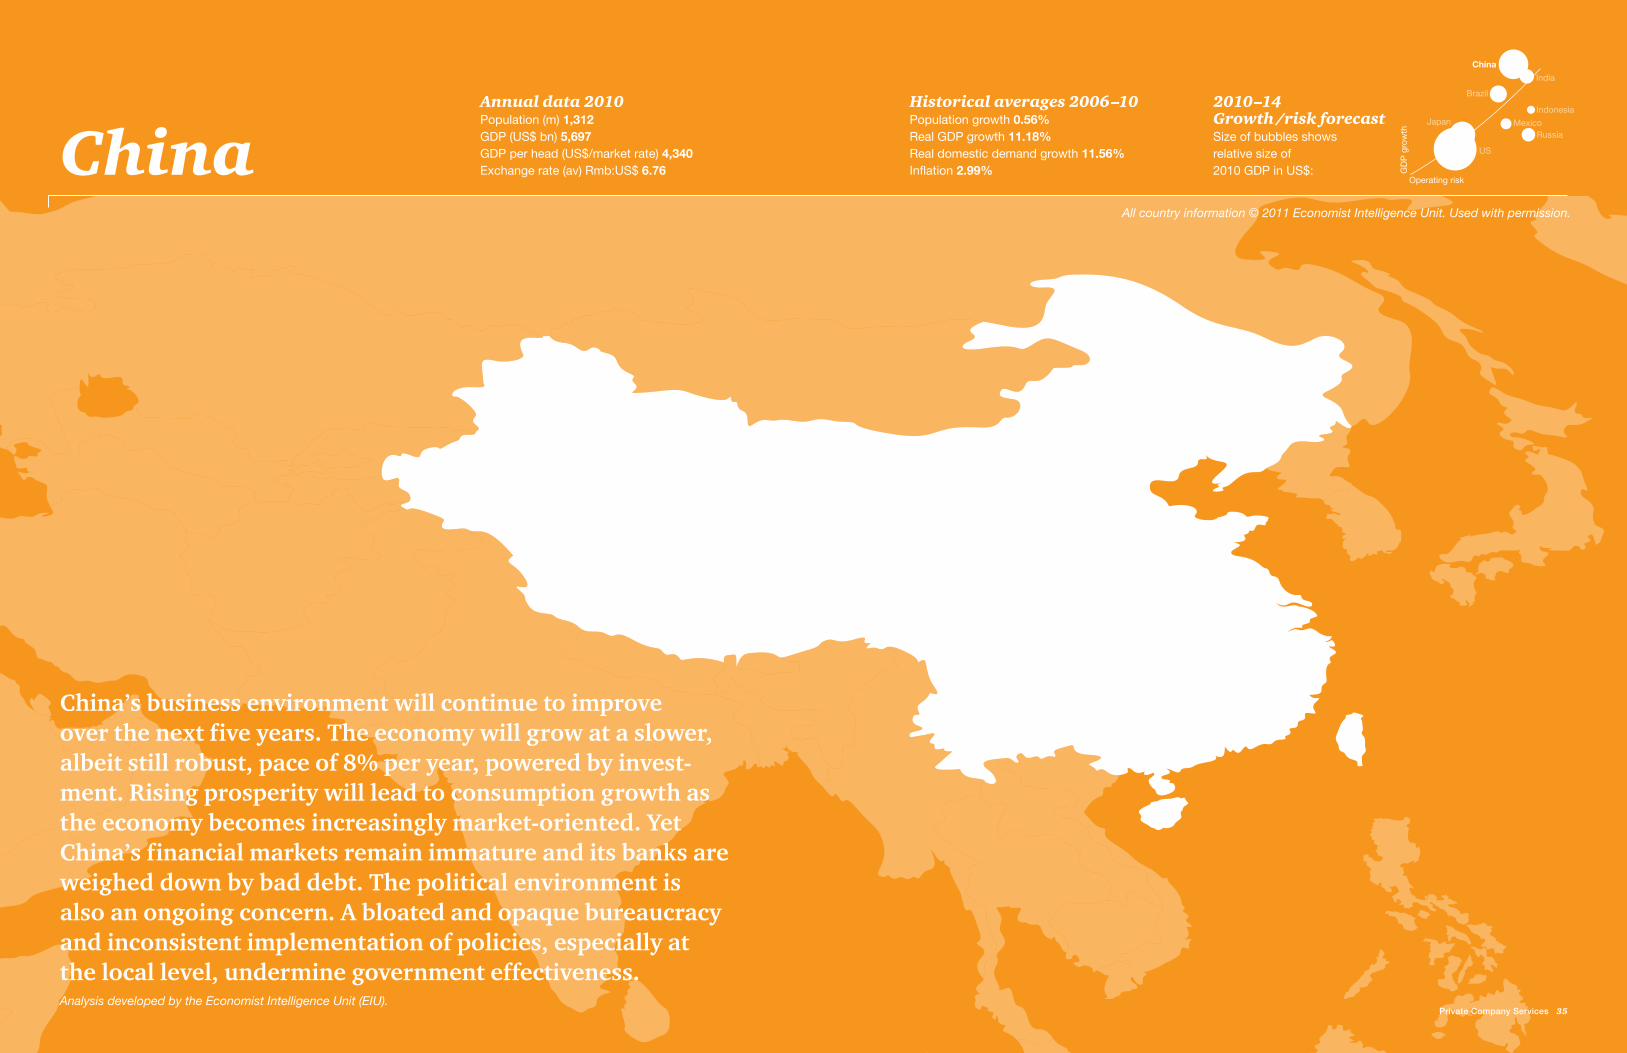
China’s business environment will continue to improve over the next f ive years. The economy will grow at a slower, albeit still robust, pace of 8% per year, powered by invest-ment. Rising prosperity will lead to consumption growth as the economy becomes increasingly market-oriented. Yet China’s f inancial markets remain immature and its banks are weighed down by bad debt. The political environment is also an ongoing concern. A bloated and opaque bureaucracy and inconsistent implementation of policies, especially at the local level, undermine government effectiveness.
All country information © 2011 Economist Intelligence Unit. Used with permission.
Historical averages 2006–10 Population growth 0.56%Real GDP growth 11.18%Real domestic demand growth 11.56%Inflation 2.99%
Annual data 2010Population (m) 1,312GDP (US$ bn) 5,697GDP per head (US$/market rate) 4,340Exchange rate (av) Rmb:US$ 6.76China G
DP
gro
wth
Operating risk
Analysis developed by the Economist Intelligence Unit (EIU).
2010–14 Growth /risk forecast Size of bubbles shows relative size of 2010 GDP in US$:
Private Company Services 35
US
Japan
RussiaMexico
Indonesia
India
China
Brazil

36 Private Company Services Private Company Services 37
Developed by EIU Developed by EIU
160
140
120
100
China Opportunities Challenges
US China Germany Brazil India Russia Mexico Indonesia
14,723 5,697 3,317 2,013 1,600 1,465 998 707
US China Germany Brazil India Russia Mexico Indonesia
47,560 4,340 39,990 10,420 1,350 10,340 8,930 2,909
per capita in US$
in billion US$
2005 2007 2009 2011 2013 2015
World
ChinaDeveloping economies (Non-OECD)
Developed economies (OECD)
Key to risk rating Categories and types of risk
Overall assessment Unweighted average of the 10 risk scoresSecurity Armed conf lict, violent unrest, organized crime, kidnapping or extortionPolitical stability Disorderly transfer of power, excessive executive authorityGovernment effectiveness Excessive bureaucracy, cronyism, corruption, human rights abusesLegal/regulatory Protection of investments, enforcement of contracts, speedy and fair judicial processMacroeconomic Recession, inf lation, currency and interest rate volatilityForeign trade/payments Capital controls, trade restrictions, discriminatory tariffsFinancial Availability of local f inancing, liquidity of local markets, bank riskTax policy Tax rates, tax predictability, tax transparency, risk of retroactive taxationLabor market Power of trade unions, frequency of labor unrest, right of free associationInfrastructure Quality and reliability of port facilities, air transport, distribution, utilities, Internet
Business risk ratings
Risk category Rating Score* Comments
Overall assessment C 46 Improving climate; big social changes and dense bureaucracy pose risks
Security risk B 32 Regime exercises tight control over crime and dissent
Political stability risk C 55 Momentous socio-economic changes pose a threat to stability
Government effectiveness D 79 Bloated and opaque bureaucracy; inconsistent implementation of policies
Legal/regulatory risk C 60 Business law developing fast, but enforcement is poor and courts politicized
Macroeconomic risk B 25 Extraordinarily rapid economic and consumption growth
Foreign trade/payments B 36 Imports are growing, but access to some sectors remains difficult
Financial risk B 33 Immature capital markets; massive bank lending poses risks to stability
Tax policy risk B 38 Tax rates remain high by international standards
Labor market risk D 61 Shortage of skilled labor and of experienced managers; passive trade unions
Infrastructure risk C 47 Speedy improvement, reaching developed world standards in some areas
Key forecasts
2010 2011 2012 2013 2014 2015
Real GDP growth (%) 10.25 9.0 8.7 8.6 8.1 8.0
Consumer price inflation (av; %) 3.2 5.0 3.6 4.1 4.0 3.8
Budget balance (% of GDP) -2.2 -1.7 -1.6 -1.4 -0.8 -0.8
Current-account balance/GDP 5.5 4.3 3.9 3.1 2.5 2.1
Money market interest rate (%) 3.4 4.0 4.2 4.0 4.3 4.1
Exchange rate Rmb:US$ (av) 6.76 6.47 6.30 6.08 5.86 5.70
Relative GDP growth Cumulative real GDP growth: China vs rest of the world (%)
Growth rates shown as index with 2005 = 100.2005–2010 are actual; 2011–2015 are EIU forecasts.
Data not available for non-OECD countries from 2013–2015.
*0–100 / 0 = least risky
Relative market size / 2010 GDP
Operating risk rating comparison Scale of 0–100 / 100 = lowest risk BRICs average
China OECD average
Overa
ll
asse
ssm
ent
Securit
y
Politica
l
stab
ility
Govern
men
t
effe
ctive
ness
Legal
/
regulat
ory
Mac
roec
onomic
Foreig
n trad
e/
paym
ents
Finan
cial
Tax p
olicy
Labor
mar
ket
Infra
stru
cture
100
80
60
40
20
0
38 Private Company Services Private Company Services 39
Indeed, more and more, we’re seeing foreign private companies go straight to China’s inner provinces and elsewhere on the mainland, establishing fully owned subsidiaries there. This is a depar- ture from the common practice of f irst setting up headquarters in Hong Kong or doing a joint venture.
That said, joint ventures are still a fa- vored means of entering the Chinese market. We continue to see a lot of inbound private companies pursuing such arrangements with Chinese private enterprises. Chinese businesses that want to expand outside the country and acquire other companies are especially likely to enter such alliances, particularly with businesses from the United States and Europe. This is a def inite trend. It is mostly large private companies, however, that we’ve seen coming to China, rather than smaller ones.
Inevitably, the higher wages that are turning Chinese workers into consumers are also making it more expensive for multinationals to manufacture here. Which is not to say that manufacturers are turn- ing away from China. On the contrary, over one-quarter of the surveyed private companies with current or contemplated operations in China regard manufactur-ing as their best opportunity here.
China’s extensive manufacturing base has been steadily building since the economy here began opening up several decades ago, spreading from the coastal regions to China’s second- and third-tier cities further inland. There you can still f ind low-cost labor and inexpensive prop- erty. Inland China also has vast supplies of natural resources, such as iron ore, which have been drawing the attention of heavy industries like steel manufacturing.
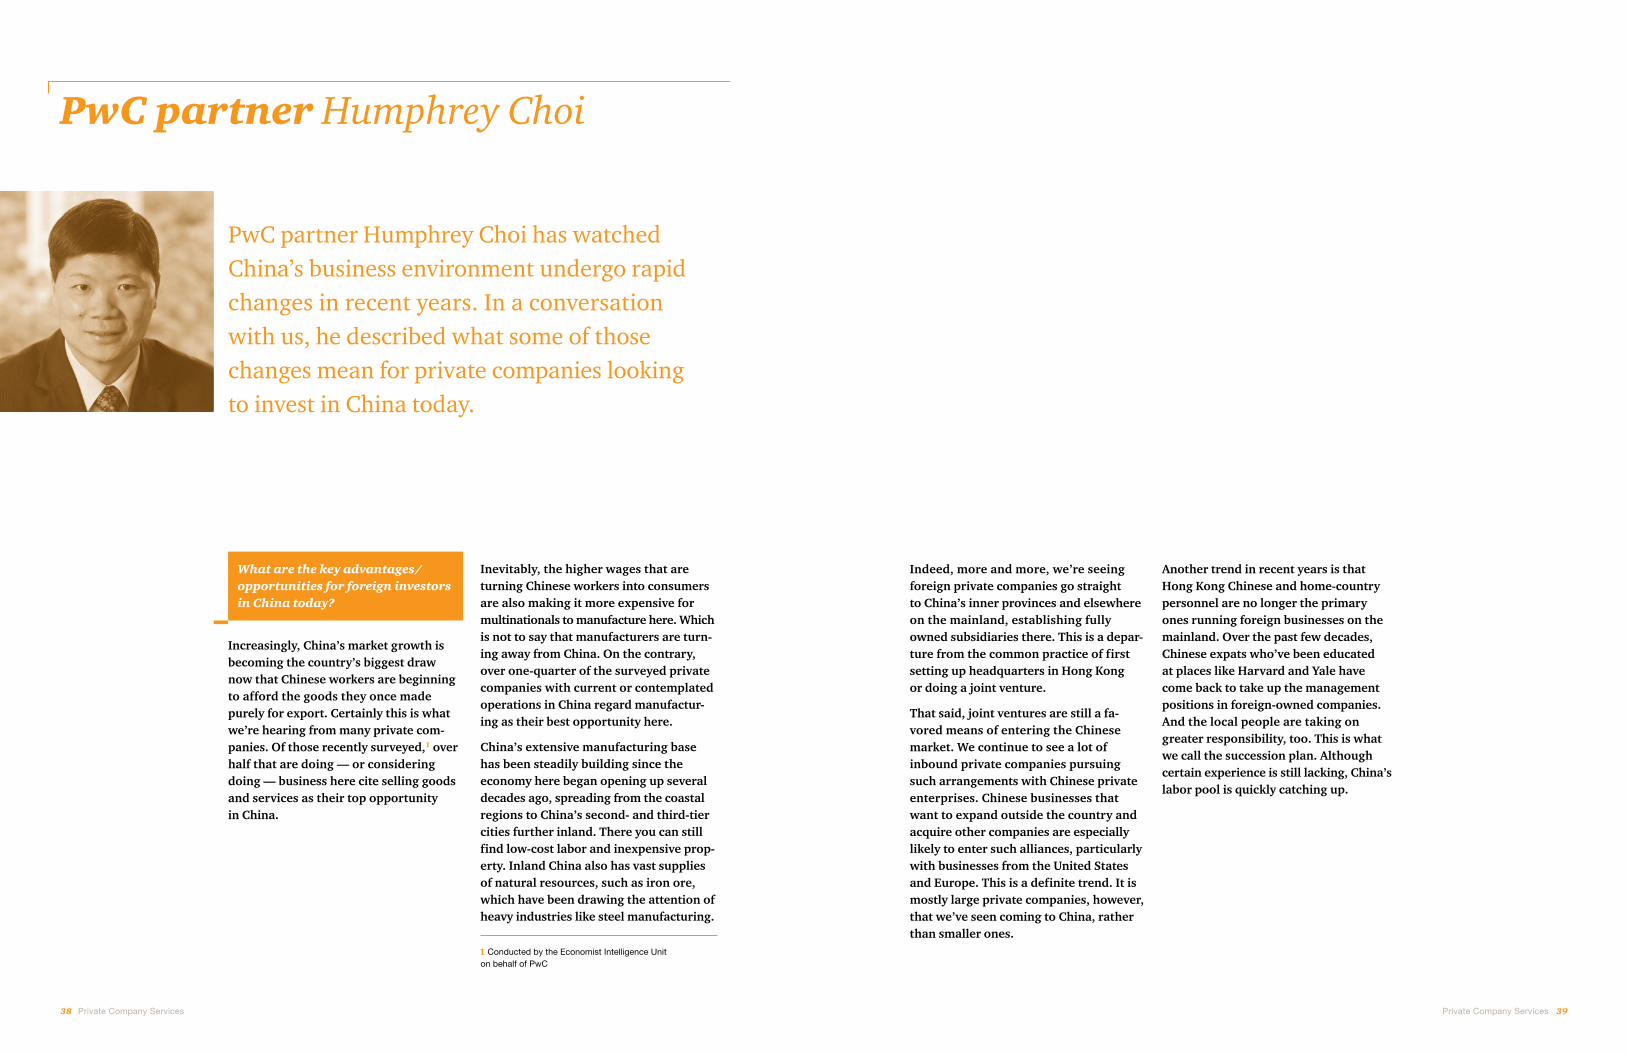
PwC partner Humphrey Choi has watched China’s business environment undergo rapid changes in recent years. In a conversation with us, he described what some of those changes mean for private companies looking to invest in China today.
PwC partner Humphrey Choi
1 Conducted by the Economist Intelligence Unit on behalf of PwC
What are the key advantages/ opportunities for foreign investors in China today?
Increasingly, China’s market growth is becoming the country’s biggest draw now that Chinese workers are beginning to afford the goods they once made purely for export. Certainly this is what we’re hearing from many private com-panies. Of those recently surveyed,1 over half that are doing — or considering doing — business here cite selling goods and services as their top opportunity in China.
Another trend in recent years is that Hong Kong Chinese and home-country personnel are no longer the primary ones running foreign businesses on the mainland. Over the past few decades, Chinese expats who’ve been educated at places like Harvard and Yale have come back to take up the management positions in foreign-owned companies. And the local people are taking on greater responsibility, too. This is what we call the succession plan. Although certain experience is still lacking, China’s labor pool is quickly catching up.
Private Company Services 4140 Private Company Services
Since the economic crisis, have you noticed a change in the dynamics of doing business in China?
The global economic situation has had a big impact on China, making it neces-sary to sustain growth through domestic demand. The Chinese consumer has there- fore become very important to China. So has the Chinese entrepreneur.
You can see this in new governmental policies. For instance, banks used to be restricted by certain lending rates but are now encouraged to lend in a more aggressive manner. One result of this is that Chinese people are able to borrow money to start their own businesses. Tax incentives and lower land costs are among other measures the government is taking to maintain China’s GDP growth.
Another shift is that Chinese businesses are no longer in the shadow of their foreign counterparts. Several of the world’s top dozen companies by market capitalization are from China, including PetroChina, China Mobile, and the Industrial and Commercial Bank of China, which is the world’s largest bank by market value. In fact, in PwC’s 2010 sur- vey of foreign banks in China, respon-dents identif ied Chinese banks as their biggest competitors — this for the f irst time in the f ive years we’ve conducted the study.2 The business landscape is def initely changing.
What top challenges/barriers have you noticed foreign companies encountering in China?
Don’t underestimate cultural differences. They can have a signif icant impact on how you run your business in China. It’s not just differences between China and other parts of the world that you have to consider. Foreign companies also need to be aware of cultural differences throughout China itself.
Each city and local government here has its own way of doing things, with busi-ness practices sometimes varying greatly from one place to the next. For instance, foreign investors who understand how business is done in Shanghai should not assume that they therefore know how business is done in Beijing. Mingle with the people, consider the local business practice in each city where you do busi- ness, but realize that it takes time.
Bridging cultural differences requires establishing and keeping up relation-ships with local off icials. We call this “guanxi.” Cultivate as many of these relationships as possible, since different off icials have different areas of respon-sibility. The importance of maintaining a diversif ied portfolio of relationships, if you will, is one of the reasons it’s advantageous to have local Chinese on the management team.
Humphrey Choi
Leader of Middle Market and Private Company Services at PwC China Tel +(852) 2289 1066 [email protected]
2 Foreign Banks in China, PwC, May 2010
Another top challenge for many foreign companies when they f irst arrive here is dealing with regulatory issues. We have one country but maintain two systems. Hong Kong still runs under British rules, while mainland China is under local Chinese law. And within the mainland itself, interpretation and implementation of laws can vary among the many minis- tries and cities. As China’s business environment continues to undergo rapid transformation, newly issued interpreta-tions of regulations may become frequent. Such changes could have a considerable effect on how you do business. Staying abreast of them and understanding the vagaries of China’s rules, tax policies, and legal frameworks are essential to being successful here.
Other barriers include government restrictions around certain sectors, such as the high-tech industry. There are also restrictions around petroleum and certain mineral resources that are very important to keeping China’s manu- facturing base going. It is diff icult for foreign companies to set up direct subsid- iaries in these industries, and the gov- ernment might want an ownership stake.
Despite these challenges and the risks they pose for foreign companies, over two-thirds of the private businesses that were surveyed have operations in China or are considering establishing them in the next three years. For the majority of those companies, the risk level that China’s business environment poses is commensurate with the level of return.

Private Company Services 43
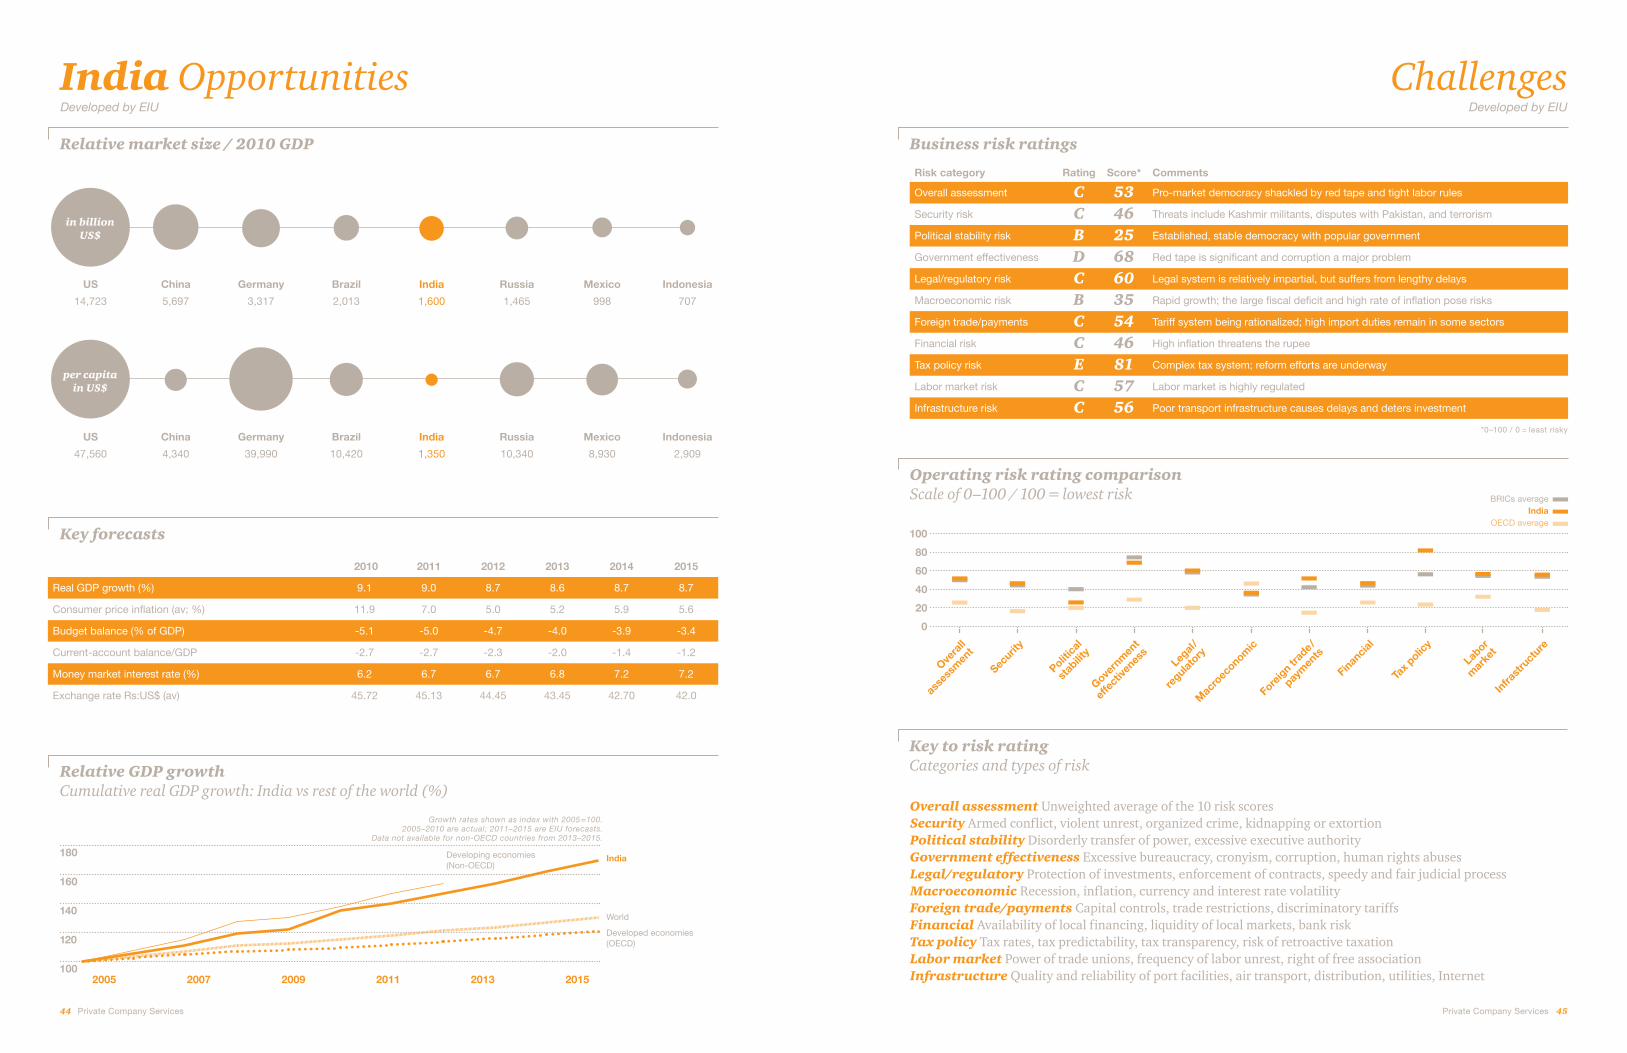
India’s economy, powered mostly by domestic demand, has grown rapidly in the last decade and will continue to do so through 2015. The country’s political system is stable and its legal system is relatively impartial, though slow. Never-theless, businesses face problems with corruption, red tape, and poor transport infrastructure. Government authorization is required to lay off workers in many cases, and no reforms perceived as weakening worker rights are likely to gain traction. Property disputes are common, as are unclear rules and obstructive bureaucrats.
All country information © 2011 Economist Intelligence Unit. Used with permission.
Historical averages 2006–10 Population growth 1.6%Real GDP growth 8.2%Real domestic demand growth 8.5%Inflation 8.7%
Annual data 2010Population (m) 1,184GDP (US$ bn) 1,600GDP per head (US$/market rate) 1,350Exchange rate (av) Rs:US$ 45.72India G
DP
gro
wth
Operating risk
Analysis developed by the Economist Intelligence Unit (EIU).
2010–14 Growth /risk forecast Size of bubbles shows relative size of 2010 GDP in US$:
US
Japan
RussiaMexico
Indonesia
India
China
Brazil
44 Private Company Services Private Company Services 45
India Opportunities Challenges
US China Germany Brazil India Russia Mexico Indonesia
14,723 5,697 3,317 2,013 1,600 1,465 998 707
US China Germany Brazil India Russia Mexico Indonesia
47,560 4,340 39,990 10,420 1,350 10,340 8,930 2,909
per capita in US$
in billion US$
2005 2007 2009 2011 2013 2015
180
160
140
120
100
World
IndiaDeveloping economies (Non-OECD)
Developed economies (OECD)
Key to risk rating Categories and types of risk
Overall assessment Unweighted average of the 10 risk scoresSecurity Armed conf lict, violent unrest, organized crime, kidnapping or extortionPolitical stability Disorderly transfer of power, excessive executive authorityGovernment effectiveness Excessive bureaucracy, cronyism, corruption, human rights abusesLegal/regulatory Protection of investments, enforcement of contracts, speedy and fair judicial processMacroeconomic Recession, inf lation, currency and interest rate volatilityForeign trade/payments Capital controls, trade restrictions, discriminatory tariffsFinancial Availability of local f inancing, liquidity of local markets, bank riskTax policy Tax rates, tax predictability, tax transparency, risk of retroactive taxationLabor market Power of trade unions, frequency of labor unrest, right of free associationInfrastructure Quality and reliability of port facilities, air transport, distribution, utilities, Internet
Business risk ratings
Risk category Rating Score* Comments
Overall assessment C 53 Pro-market democracy shackled by red tape and tight labor rules
Security risk C 46 Threats include Kashmir militants, disputes with Pakistan, and terrorism
Political stability risk B 25 Established, stable democracy with popular government
Government effectiveness D 68 Red tape is significant and corruption a major problem
Legal/regulatory risk C 60 Legal system is relatively impartial, but suffers from lengthy delays
Macroeconomic risk B 35 Rapid growth; the large fiscal deficit and high rate of inflation pose risks
Foreign trade/payments C 54 Tariff system being rationalized; high import duties remain in some sectors
Financial risk C 46 High inflation threatens the rupee
Tax policy risk E 81 Complex tax system; reform efforts are underway
Labor market risk C 57 Labor market is highly regulated
Infrastructure risk C 56 Poor transport infrastructure causes delays and deters investment
Key forecasts
2010 2011 2012 2013 2014 2015
Real GDP growth (%) 9.1 9.0 8.7 8.6 8.7 8.7
Consumer price inflation (av; %) 11.9 7.0 5.0 5.2 5.9 5.6
Budget balance (% of GDP) -5.1 -5.0 -4.7 -4.0 -3.9 -3.4
Current-account balance/GDP -2.7 -2.7 -2.3 -2.0 -1.4 -1.2
Money market interest rate (%) 6.2 6.7 6.7 6.8 7.2 7.2
Exchange rate Rs:US$ (av) 45.72 45.13 44.45 43.45 42.70 42.0
Relative GDP growth Cumulative real GDP growth: India vs rest of the world (%)
Growth rates shown as index with 2005 = 100.2005–2010 are actual; 2011–2015 are EIU forecasts.
Data not available for non-OECD countries from 2013–2015.
*0–100 / 0 = least risky
Developed by EIU Developed by EIU
Relative market size / 2010 GDP
Operating risk rating comparison Scale of 0–100 / 100 = lowest risk BRICs average
India OECD average
Overa
ll
asse
ssm
ent
Securit
y
Politica
l
stab
ility
Govern
men
t
effe
ctive
ness
Legal
/
regulat
ory
Mac
roec
onomic
Foreig
n trad
e/
paym
ents
Finan
cial
Tax p
olicy
Labor
mar
ket
Infra
stru
cture
100
80
60
40
20
0

46 Private Company Services Private Company Services 47
The market potential of rural India is likely to keep growing now that people in those regions are f inding better-paying work in small and medium-scale indus-tries, such as tourism, matchbox-making, and handicrafts, whereas a decade or so ago rural citizens depended primarily on small-scale agriculture for their income. Women are becoming actively involved in these industries as well, contributing to the rise in household incomes.
Because of the Indian market’s size and location, the country is also becoming a key entry point in the region. In our experience, companies will often come here f irst, penetrate and consolidate the Indian market, and then move into other Asian markets. We have seen this, for example, with the automobile-components industry.
One-quarter of private companies say that selling high-margin goods and services, in particular, is where the best opportunities lie for them in India. This ref lects the rise in personal income here and people’s increasing ability to spend earnings on things beyond the basics. Cars are one such item. Mainly it is in the urban centers where you see a growing middle class capable of making this type of purchase. But India’s rural population is seeing a rise in income as well. This is signif icant. Nearly three-quarters of the country’s popula-tion resides in rural areas. There you have what remains a largely untapped consumer base.
PwC partner Rama Krishna shared with us his insights about India’s large and highly varied marketplace, explaining how those two qualities — size and diversity — present opportunities and challenges in equal measure for private companies seeking to invest there.
PwC Partner Rama Krishna
1 Conducted by the Economist Intelligence Unit on behalf of PwC
What are the key advantages/ opportunities for foreign investors in India today?
The greatest attraction for foreign investors who come here these days is India’s market potential. Among private companies recently surveyed,1 52% of those that do — or are con- sidering doing — business in India say that selling goods and services is the best opportunity for them here, as com- pared with 20% of respondents who cited manufacturing and 17% who cited sourcing.
For the most part, foreign companies can set up business in India quite easily. Restrictions apply to only specif ic areas, such as banking, real estate, wireless communications, nuclear power, f ire-arms, and the mining of certain minerals. To operate in those sectors, a foreign company must obtain formal approval from the federal government. In most other cases, companies needn’t obtain such approval.
The preferred way of getting started here is for a foreign company to open a liaison off ice, study the market, understand the local practices, and then start to generate some business for the parent company. Once it f inds a business model that it’s comfortable with, the entity will generally go ahead and incor- porate as a private company — that is to say, as a subsidiary of the parent company.

Private Company Services 4948 Private Company Services
Rama Krishna
Executive Director of Advisory Private Company Services at PwC India Tel +(91) (40) 6624 6666 [email protected]
What top challenges/barriers have you noticed foreign companies encountering in India?
The Indian market is highly diverse. Inbound companies sometimes under- estimate this. For instance, if you test-market in one region, you cannot automatically extrapolate your f indings to other regions. Habits, tastes, cultural preferences, languages, and other regional traits vary widely across India. You need to be f lexible in introducing a bit of differ- entiation to your products and services, and to your marketing strategy, depending on a region’s characteristics.
You also need to be patient. Not only are there wide-ranging cultural varia-tions, but there are also many different regulations across India’s regions and administrative districts. Although India’s regulatory system and tax policies have improved a good deal in the past two decades, complexities remain. These take time to understand.
Maintaining good contacts with govern-ment off icials in the region where you do business can help you work through these challenges. Such relationships are not established overnight. Companies should therefore come here with a long-term strategy. Those that do tend to be more successful than businesses that come to India looking for short-term gains.
For companies looking to tap India’s rural market, a key barrier is poor infrastructure, with many villages being unreachable by motor vehicle. The Indian government says that $500 billion will need to be invested in roads and other infrastructure over the next few years.
For some companies, the next step may be to enlist local partners. Doing so can make it easier for foreign businesses to pursue certain investment opportuni-ties, such as projects for improving India’s infrastructure, much of which is government-regulated and therefore hard to invest in without a local partner.
With a local partner, there are ample opportunities in this area — roads, railroads, ports, and power facilities all need large amounts of investment, although there may be restrictions around ports, due to national security. Water supply is another big infrastruc-ture concern. India will face a signif icant scarcity of water unless large, continual investments are made. Partnerships between foreign investors and local orga- nizations could be a key way to address this problem.
We are also seeing a fair number of joint ventures between foreign companies and Indian businesses in the telecommu-nications sector, with a lot of big players coming here to tap the Indian market. Recent revelations about corrupt licens-ing practices in this sector may put some foreign investors off until the necessary reforms are made. In the meantime, market demand here for telecommunica-tions is unlikely to ebb.
Another obstacle is that a signif icant portion of the rural population does not have access to banking facilities, though banks have slowly begun making inroads. This hasn’t, however, held back the tele- communications sector, which has rapid- ly achieved high penetration of the rural market. In India, talking time on a mobile phone can cost less than one cent per minute, and so usage does not depend as much on easy bank access as many other forms of consumption do.
Other industries are trying to determine how they, too, can reach India’s rural population. For instance, quite a few agricultural-input companies are devel-oping retail outlets in rural areas and, in doing so, are teaming up with banks. This arrangement allows farmers to purchase seeds, fertilizer, and other agri- cultural inputs on the spot by having their accounts debited directly. Such com- panies are also developing call centers to f ield all farm-related queries. Slowly these outlets are starting to serve as chan- nels for other consumer goods as well.
Initiatives like these — which benef it not only the companies behind them, but also the surrounding rural communities — are increasingly becoming an imperative for multinational companies that operate in India. Indeed, nowadays, the moment you say you are part of a global orga-nization, India’s societal expectations increase. This is a departure from the past. Ten years ago, there wasn’t much focus on community issues. Since then, NGOs, environmental groups, and other social activists have established a pres- ence in India, and so now the develop-ment concerns of local communities are openly discussed.
Foreign companies are being engaged in deliberations about these matters — as well as being looked to as a potential part of the solution. We advise our clients to be proactive in this respect. One such client is a ceramic-tile company, which has committed roughly 1.5% of its prof its to community projects near its factory, including the development of drinking-water and road facilities — a gesture that has engendered good relations with both the local governmental agencies and the broader community.
Since the economic crisis, have you noticed a change in the dynamics
of doing business in India?
The level of foreign direct investment in India dipped in late 2008, but a buffer to that was the large investment made here by the telecommunications sector in 2007 and early 2008. In 2009, FDI in India was over $34 billion. Since then, however, the level has dropped to $24 bil- lion. This is nonetheless much higher than FDI was as recently as 2004, when the level was just $6 billion. Meanwhile, the Indian economy has shown it is capa- ble of growing on its own. This is not to say it has decoupled from the global market, but increasingly India’s home market is able to support domestic growth.

Indonesia has experienced 11 consecutive years of positive economic growth and should continue to grow quickly over the next f ive years. Strong domestic demand has encouraged companies to revive projects shelved during the global economic crisis. Yet several categories of operating risks are high. The danger of terrorist attacks remains alive. Corruption is widespread at all levels of government. And although the government has prioritized infrastructure development, port and power facilities remain inadequate due to insuff icient funding.
All country information © 2011 Economist Intelligence Unit. Used with permission.
Historical averages 2006–10 Population growth 1.2%Real GDP growth 5.7%Real domestic demand growth 5.2%Inflation 7.8%
Annual data 2010Population (m) 242.9GDP (US$ bn) 706.7GDP per head (US$/market rate) 2,908.7Exchange rate (av) Rp:US$ 9,088.3Indonesia G
DP
gro
wth
Operating risk
Analysis developed by the Economist Intelligence Unit (EIU).
2010–14 Growth /risk forecast Size of bubbles shows relative size of 2010 GDP in US$:
Private Company Services 51
US
Japan
RussiaMexico
Indonesia
India
China
Brazil
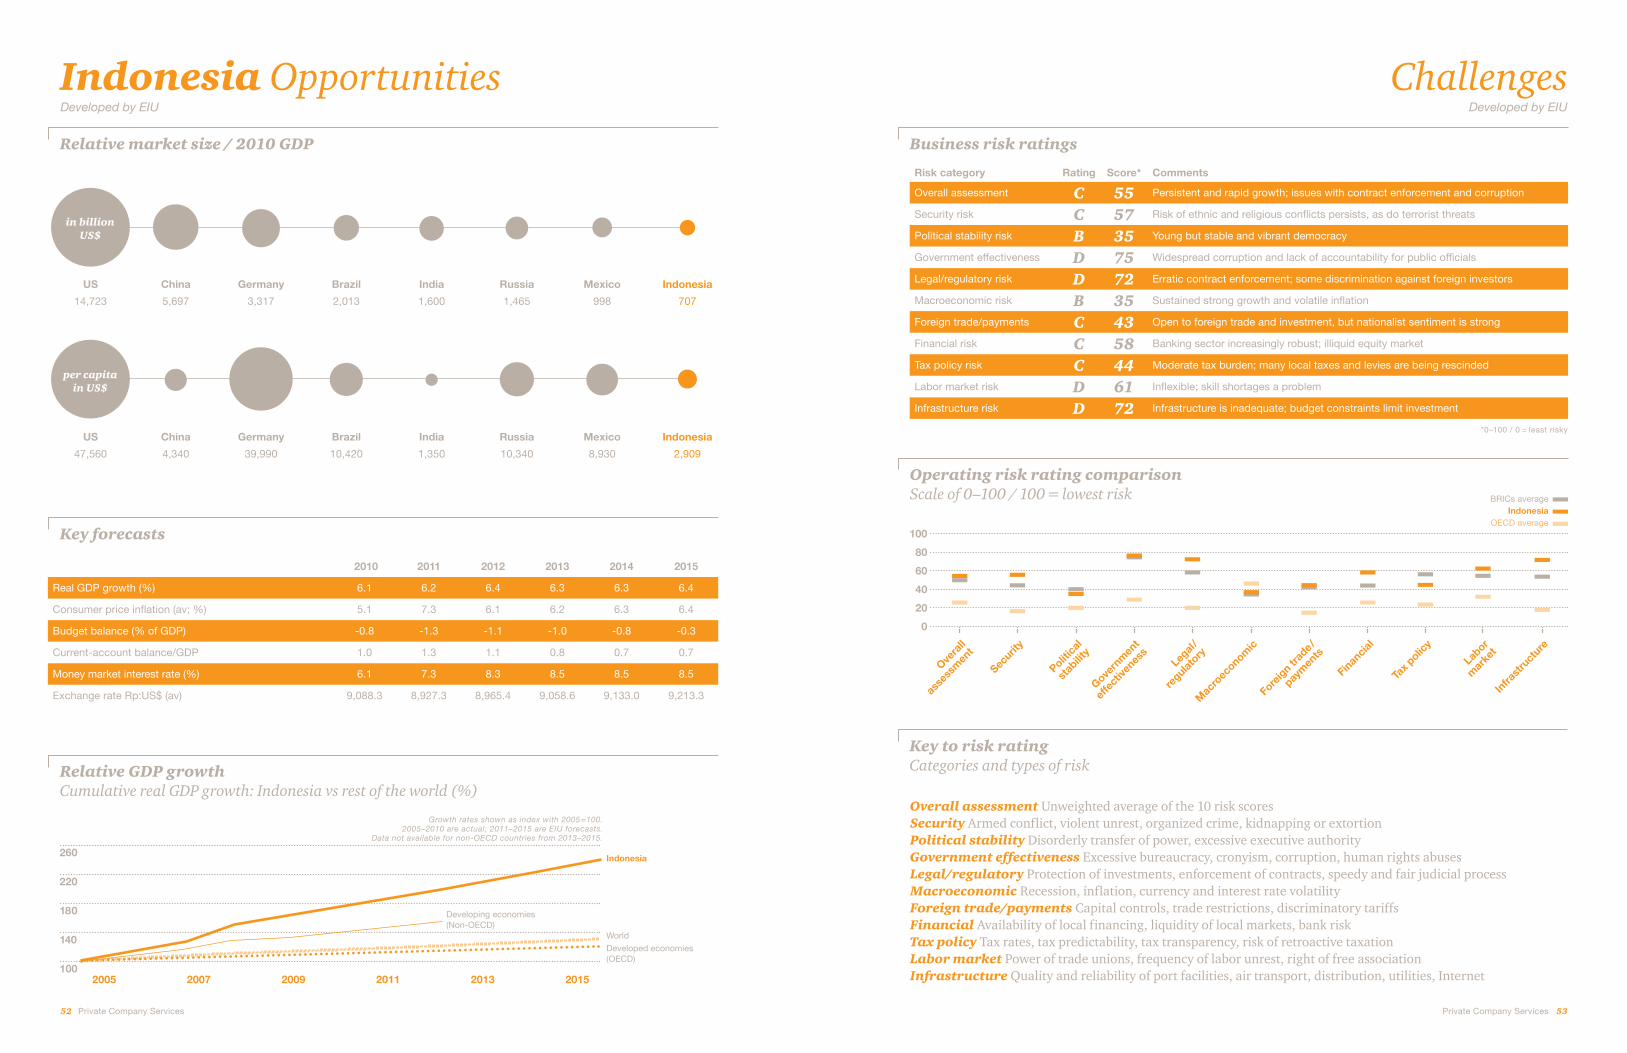
52 Private Company Services Private Company Services 53
Developed by EIU Developed by EIU
Indonesia Opportunities Challenges
US China Germany Brazil India Russia Mexico Indonesia
14,723 5,697 3,317 2,013 1,600 1,465 998 707
US China Germany Brazil India Russia Mexico Indonesia
47,560 4,340 39,990 10,420 1,350 10,340 8,930 2,909
per capita in US$
in billion US$
Relative GDP growth Cumulative real GDP growth: Indonesia vs rest of the world (%)
2005 2007 2009 2011 2013 2015
260
220
180
140
100
World
Indonesia
Developing economies (Non-OECD)
Developed economies (OECD)
Key to risk rating Categories and types of risk
Overall assessment Unweighted average of the 10 risk scoresSecurity Armed conf lict, violent unrest, organized crime, kidnapping or extortionPolitical stability Disorderly transfer of power, excessive executive authorityGovernment effectiveness Excessive bureaucracy, cronyism, corruption, human rights abusesLegal/regulatory Protection of investments, enforcement of contracts, speedy and fair judicial processMacroeconomic Recession, inf lation, currency and interest rate volatilityForeign trade/payments Capital controls, trade restrictions, discriminatory tariffsFinancial Availability of local f inancing, liquidity of local markets, bank riskTax policy Tax rates, tax predictability, tax transparency, risk of retroactive taxationLabor market Power of trade unions, frequency of labor unrest, right of free associationInfrastructure Quality and reliability of port facilities, air transport, distribution, utilities, Internet
Business risk ratings
Risk category Rating Score* Comments
Overall assessment C 55 Persistent and rapid growth; issues with contract enforcement and corruption
Security risk C 57 Risk of ethnic and religious conflicts persists, as do terrorist threats
Political stability risk B 35 Young but stable and vibrant democracy
Government effectiveness D 75 Widespread corruption and lack of accountability for public officials
Legal/regulatory risk D 72 Erratic contract enforcement; some discrimination against foreign investors
Macroeconomic risk B 35 Sustained strong growth and volatile inflation
Foreign trade/payments C 43 Open to foreign trade and investment, but nationalist sentiment is strong
Financial risk C 58 Banking sector increasingly robust; illiquid equity market
Tax policy risk C 44 Moderate tax burden; many local taxes and levies are being rescinded
Labor market risk D 61 Inflexible; skill shortages a problem
Infrastructure risk D 72 Infrastructure is inadequate; budget constraints limit investment
*0–100 / 0 = least risky
Growth rates shown as index with 2005 = 100.2005–2010 are actual; 2011–2015 are EIU forecasts.
Data not available for non-OECD countries from 2013–2015.
Key forecasts
2010 2011 2012 2013 2014 2015
Real GDP growth (%) 6.1 6.2 6.4 6.3 6.3 6.4
Consumer price inflation (av; %) 5.1 7.3 6.1 6.2 6.3 6.4
Budget balance (% of GDP) -0.8 -1.3 -1.1 -1.0 -0.8 -0.3
Current-account balance/GDP 1.0 1.3 1.1 0.8 0.7 0.7
Money market interest rate (%) 6.1 7.3 8.3 8.5 8.5 8.5
Exchange rate Rp:US$ (av) 9,088.3 8,927.3 8,965.4 9,058.6 9,133.0 9,213.3
Relative market size / 2010 GDP
Operating risk rating comparison Scale of 0–100 / 100 = lowest risk BRICs average
Indonesia OECD average
Overa
ll
asse
ssm
ent
Securit
y
Politica
l
stab
ility
Govern
men
t
effe
ctive
ness
Legal
/
regulat
ory
Mac
roec
onomic
Foreig
n trad
e/
paym
ents
Finan
cial
Tax p
olicy
Labor
mar
ket
Infra
stru
cture
100
80
60
40
20
0

54 Private Company Services Private Company Services 55
Sourcing may begin to see an uptick among foreign investors, particularly where Indonesia’s natural resources are concerned. With growing interest in biodiesel as a fuel alternative, Indone-sia’s palm oil plantations are becoming big business. We’ve also witnessed considerable interest in coal mining. Until recently, mining by foreigners was restricted here. A change in the law, however, now allows foreign direct investment in this area, and so there’s been increased attention, particularly from Indian and Chinese investors.
Such consumption looks likely to con- tinue. The government aims to cut the country’s poverty rate by one-third over the next several years, as well as create 10.7 million jobs in that period. If those goals are met, a growing number of Indonesians will have money to spend. It’s no surprise, then, that among private companies recently surveyed,1 56% of those that do — or are considering doing — business in Indonesia say that selling goods and services is their best investment opportunity here. Manufac-turing came in second, at 28%, and sourcing was cited by 12% of respondents.
PwC partner Ray Headifen has spent nearly a decade in Indonesia, during which he’s seen that country become an increasingly attractive investment destination. He recently took time out to discuss with us the opportunities that are drawing private companies to Indonesia and the challenges they may face once they arrive.
PwC partner Ray Headifen
1 Conducted by the Economist Intelligence Unit on behalf of PwC
What are the key advantages/ opportunities for foreign investors in Indonesia today?
As the fourth most populous country in the world, Indonesia is becoming an increasingly attractive market for multi- national companies. The consumer base here is growing rapidly. I’ve witnessed this f irst hand during my nine years in Jakarta. The large increase in motor vehicles on the road during that time is one example of the surge in consumer spending. So is the ever-expanding mobile phone market.
In general, investment from neighboring Asian countries is what we’re seeing at the moment — more so than invest-ment from the United States or Europe. Possibly that’s because Asian investors tend to have a greater risk appetite than Western multinationals. They are used to operating in the region, and so they expect the unexpected. Expecting the unexpected — or, to put it another way, knowing what you don’t know — is a helpful psychology to have when you enter the Indonesian market.
Japanese companies are among the Asian investors pursuing opportunities in Indonesia. They’ve shown a particular interest in teaming with the Indonesian government to build new power plants, which the country greatly needs. Indone-sia’s electricity demand is growing at roughly 8% a year.
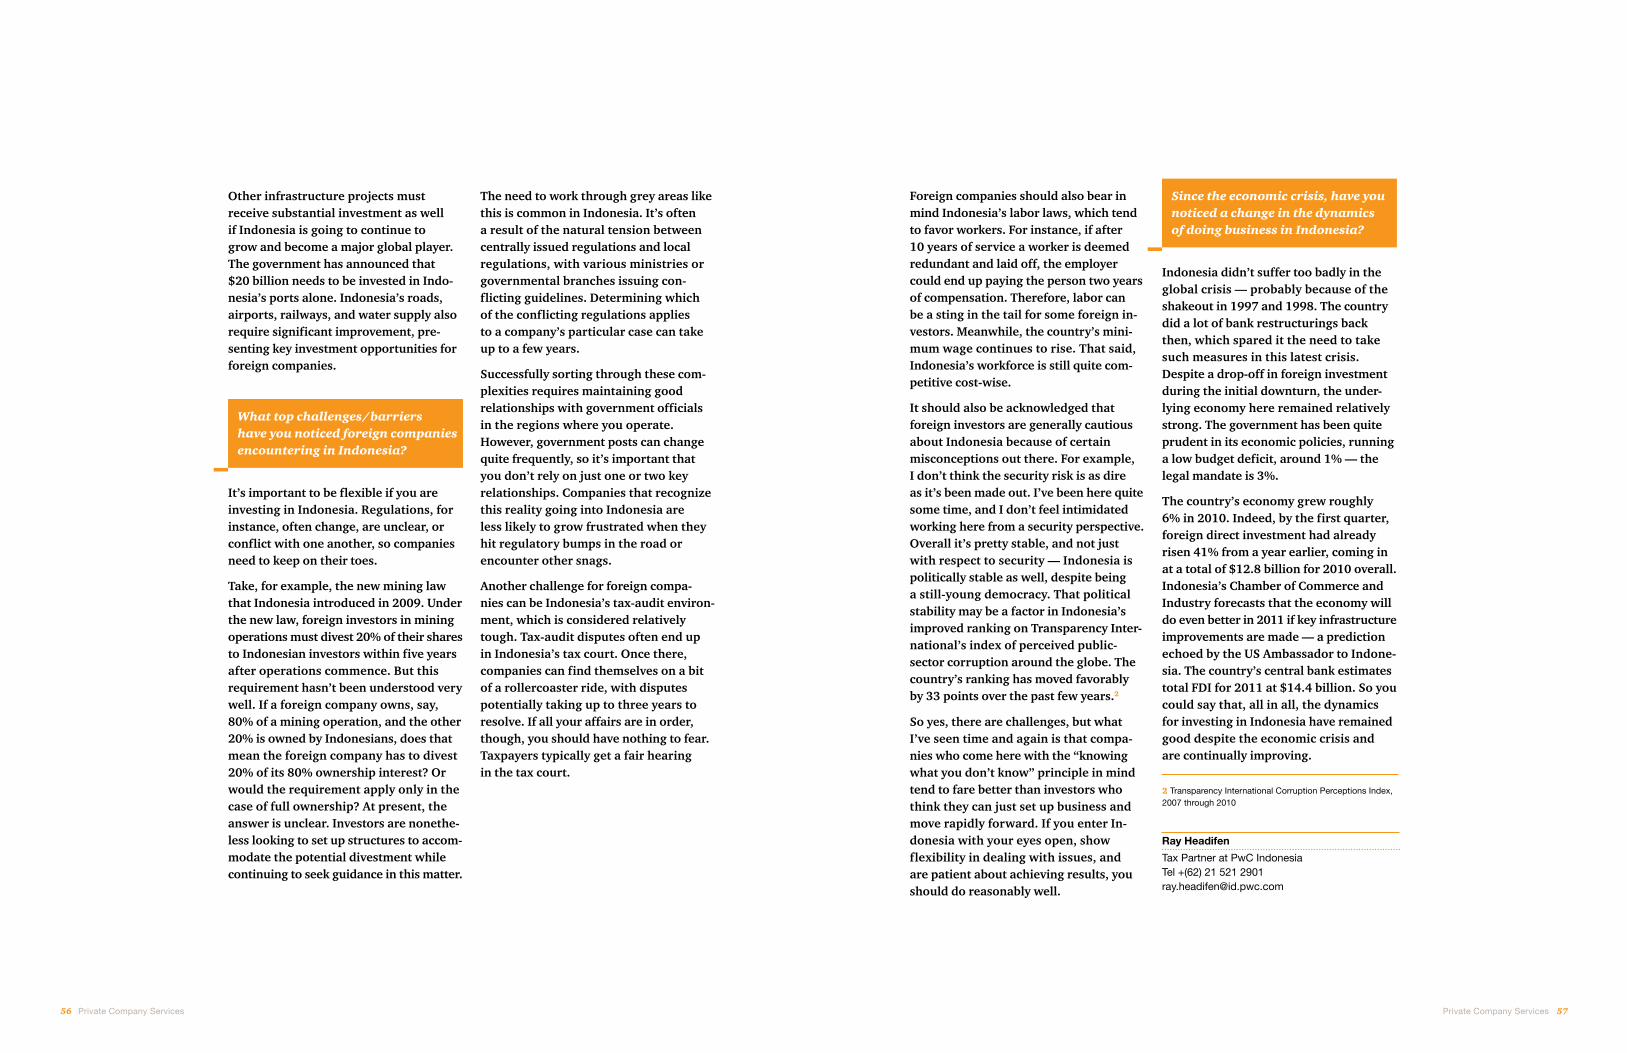
Private Company Services 5756 Private Company Services
Other infrastructure projects must receive substantial investment as well if Indonesia is going to continue to grow and become a major global player. The government has announced that $20 billion needs to be invested in Indo- nesia’s ports alone. Indonesia’s roads, airports, railways, and water supply also require signif icant improvement, pre-senting key investment opportunities for foreign companies.
What top challenges/barriers have you noticed foreign companies encountering in Indonesia?
It’s important to be f lexible if you are investing in Indonesia. Regulations, for instance, often change, are unclear, or conf lict with one another, so companies need to keep on their toes.
Take, for example, the new mining law that Indonesia introduced in 2009. Under the new law, foreign investors in mining operations must divest 20% of their shares to Indonesian investors within f ive years after operations commence. But this requirement hasn’t been understood very well. If a foreign company owns, say, 80% of a mining operation, and the other 20% is owned by Indonesians, does that mean the foreign company has to divest 20% of its 80% ownership interest? Or would the requirement apply only in the case of full ownership? At present, the answer is unclear. Investors are nonethe-less looking to set up structures to accom- modate the potential divestment while continuing to seek guidance in this matter.
Ray Headifen
Tax Partner at PwC Indonesia Tel +(62) 21 521 2901 [email protected]
2 Transparency International Corruption Perceptions Index, 2007 through 2010
The need to work through grey areas like this is common in Indonesia. It’s often a result of the natural tension between centrally issued regulations and local regulations, with various ministries or governmental branches issuing con- f licting guidelines. Determining which of the conf licting regulations applies to a company’s particular case can take up to a few years.
Successfully sorting through these com- plexities requires maintaining good relationships with government off icials in the regions where you operate. However, government posts can change quite frequently, so it’s important that you don’t rely on just one or two key relationships. Companies that recognize this reality going into Indonesia are less likely to grow frustrated when they hit regulatory bumps in the road or encounter other snags.
Another challenge for foreign compa- nies can be Indonesia’s tax-audit environ-ment, which is considered relatively tough. Tax-audit disputes often end up in Indonesia’s tax court. Once there, companies can f ind themselves on a bit of a rollercoaster ride, with disputes potentially taking up to three years to resolve. If all your affairs are in order, though, you should have nothing to fear. Taxpayers typically get a fair hearing in the tax court.
Foreign companies should also bear in mind Indonesia’s labor laws, which tend to favor workers. For instance, if after 10 years of service a worker is deemed redundant and laid off, the employer could end up paying the person two years of compensation. Therefore, labor can be a sting in the tail for some foreign in- vestors. Meanwhile, the country’s mini- mum wage continues to rise. That said, Indonesia’s workforce is still quite com- petitive cost-wise.
It should also be acknowledged that foreign investors are generally cautious about Indonesia because of certain misconceptions out there. For example, I don’t think the security risk is as dire as it’s been made out. I’ve been here quite some time, and I don’t feel intimidated working here from a security perspective. Overall it’s pretty stable, and not just with respect to security — Indonesia is politically stable as well, despite being a still-young democracy. That political stability may be a factor in Indonesia’s improved ranking on Transparency Inter- national’s index of perceived public- sector corruption around the globe. The country’s ranking has moved favorably by 33 points over the past few years.2
So yes, there are challenges, but what I’ve seen time and again is that compa-nies who come here with the “knowing what you don’t know” principle in mind tend to fare better than investors who think they can just set up business and move rapidly forward. If you enter In- donesia with your eyes open, show f lexibility in dealing with issues, and are patient about achieving results, you should do reasonably well.
Since the economic crisis, have you noticed a change in the dynamics of doing business in Indonesia?
Indonesia didn’t suffer too badly in the global crisis — probably because of the shakeout in 1997 and 1998. The country did a lot of bank restructurings back then, which spared it the need to take such measures in this latest crisis. Despite a drop-off in foreign investment during the initial downturn, the under-lying economy here remained relatively strong. The government has been quite prudent in its economic policies, running a low budget def icit, around 1% — the legal mandate is 3%.
The country’s economy grew roughly 6% in 2010. Indeed, by the f irst quarter, foreign direct investment had already risen 41% from a year earlier, coming in at a total of $12.8 billion for 2010 overall. Indonesia’s Chamber of Commerce and Industry forecasts that the economy will do even better in 2011 if key infrastructure improvements are made — a prediction echoed by the US Ambassador to Indone-sia. The country’s central bank estimates total FDI for 2011 at $14.4 billion. So you could say that, all in all, the dynamics for investing in Indonesia have remained good despite the economic crisis and are continually improving.

Mexico is a stable, pro-market democracy that presents a moderate level of operating risk for foreign businesses. Its internal market offers major opportunities, and its role as a low-cost manufacturer for the US market will grow. At the same time, Mexico’s overdependence on the US economy has held back its growth relative to its peers. Uncertainty has been compounded by a steady deterioration of the security situation, which undermines business conf idence. Skilled labor shortages, red tape, and a burdensome tax system also weigh on the business environment.
All country information © 2011 Economist Intelligence Unit. Used with permission.
Historical averages 2006–10 Population growth 1.1%Real GDP growth 1.7%Real domestic demand growth 1.8%Inflation 4.4%
Annual data 2010Population (m) 112.5GDP (US$ bn) 998.3GDP per head (US$/market rate) 8,880Exchange rate (av) Ps:US$ 12.6Mexico G
DP
gro
wth
Operating risk
Analysis developed by the Economist Intelligence Unit (EIU).
2010–14 Growth /risk forecast Size of bubbles shows relative size of 2010 GDP in US$:
Private Company Services 59
US
Japan
RussiaMexico
Indonesia
India
China
Brazil

60 Private Company Services Private Company Services 61
Developed by EIU Developed by EIU
160
140
120
100
Mexico Opportunities Challenges
US China Germany Brazil India Russia Mexico Indonesia
14,723 5,697 3,317 2,013 1,600 1,465 998 707
US China Germany Brazil India Russia Mexico Indonesia
47,560 4,340 39,990 10,420 1,350 10,340 8,930 2,909
per capita in US$
in billion US$
2005 2007 2009 2011 2013 2015
World
Mexico
Developing economies (Non-OECD)
Developed economies (OECD)
Key to risk rating Categories and types of risk
Overall assessment Unweighted average of the 10 risk scoresSecurity Armed conf lict, violent unrest, organized crime, kidnapping or extortionPolitical stability Disorderly transfer of power, excessive executive authorityGovernment effectiveness Excessive bureaucracy, cronyism, corruption, human rights abusesLegal/regulatory Protection of investments, enforcement of contracts, speedy and fair judicial processMacroeconomic Recession, inf lation, currency and interest rate volatilityForeign trade/payments Capital controls, trade restrictions, discriminatory tariffsFinancial Availability of local f inancing, liquidity of local markets, bank riskTax policy Tax rates, tax predictability, tax transparency, risk of retroactive taxationLabor market Power of trade unions, frequency of labor unrest, right of free associationInfrastructure Quality and reliability of port facilities, air transport, distribution, utilities, Internet
Business risk ratings
Risk category Rating Score* Comments
Overall assessment C 44 Stable, pro-market democracy; problems with government effectiveness
Security risk D 64 Violent crime is widespread, though perception may be worse than reality
Political stability risk B 40 Political system is stable, but government’s position is weak
Government effectiveness C 54 Shift to more parliamentary system has exposed institutional weakness
Legal/regulatory risk B 40 Vested interests thwart enforcement of competition policy
Macroeconomic risk C 45 Return to growth in 2010; dependence on US market a concern
Foreign trade/payments B 25 Tariff and non-tariff barriers will continue to fall
Financial risk C 42 Shallow financial markets, volatile exchange rate
Tax policy risk B 25 Widespread tax evasion; large companies disproportionately burdened
Labor market risk D 61 Widespread skills shortages and regulatory rigidities
Infrastructure risk C 41 Infrastructure is in need of fresh investment
Key forecasts
2010 2011 2012 2013 2014 2015
Real GDP growth (%) 5.0 3.5 3.3 3.7 3.7 3.5
Consumer price inflation (av; %) 4.1 4.0 3.6 3.6 3.4 3.5
Budget balance (% of GDP) -2.6 -2.2 -1.1 0.0 0.0 0.0
Current-account balance/GDP -0.9 -1.5 -1.9 -2.2 -2.9 -3.3
Money market interest rate (%) 4.5 4.5 5.8 6.0 6.8 7.0
Exchange rate Ps:US$ (av) 12.6 12.3 12.4 12.6 13.3 14.1
Relative GDP growth Cumulative real GDP growth: Mexico vs rest of the world (%)
Growth rates shown as index with 2005 = 100.2005–2010 are actual; 2011–2015 are EIU forecasts.
Data not available for non-OECD countries from 2013–2015.
*0–100 / 0 = least risky
Relative market size / 2010 GDP
Operating risk rating comparison Scale of 0–100 / 100 = lowest risk BRICs average
Mexico OECD average
100
80
60
40
20
0
Overa
ll
asse
ssm
ent
Securit
y
Politica
l
stab
ility
Govern
men
t
effe
ctive
ness
Legal
/
regulat
ory
Mac
roec
onomic
Foreig
n trad
e/
paym
ents
Finan
cial
Tax p
olicy
Labor
mar
ket
Infra
stru
cture
62 Private Company Services Private Company Services 63
Our proximity also helps them control their shipping costs. This keeps Mexico competitive with manufacturing hubs like China, where labor expenses may still be lower than ours in some cases but the cost of transporting goods to countries in the Western hemisphere is considerably higher. Once here, multi-national companies can benef it not only from the narrowing gap between Mexi-can wages and those of China and other low-cost manufacturing bases, but also from Mexico’s pool of qualif ied execu-tives, a number of whom are Ivy League-educated — a fact that foreign investors are often unaware of before coming here.
These are among the reasons that many companies consider Mexico a good place to set up manufacturing activities. Indeed, 31% of recently surveyed1 private compa- nies that do — or are considering doing — business in Mexico say that manufacturing offers the best business opportunities for them in Mexico, which is slightly more than the percentage of companies making the same claim about China.2 This assessment of Mexico tends to be especially prevalent among companies operating in the United States and Latin America, as our proximity allows those businesses to receive just-in-time deliver-ies from their Mexican suppliers. That, in turn, helps them better manage their inventory levels and expenses.
PwC partner Abelardo Macotela talked to us about the risks and opportunities that private companies face when doing business in his country. Here’s what he had to say regarding the top considerations that foreign businesses should keep in mind when coming to Mexico.
PwC Partner Abelardo Macotela
1 Conducted by the Economist Intelligence Unit on behalf of PwC
2 Among those companies doing or considering doing business in China
What are the key advantages/ opportunities for foreign investors in Mexico today?
Mexico’s economy is one that foreign businesses can enter relatively easily. Ease of entry is due, in part, to Mexico’s numerous free trade treaties, which grant preferential access to key trading partners, including North America and the European Union. Mexico has also been streamlining its approval procedures. An entrepreneur can com-plete the necessary procedures within just 13 days. It takes longer to obtain a construction permit — 138 days — but that is faster than in many other emerging markets.
An even greater draw than Mexico’s manufacturing capacity is its market potential, according to the private companies surveyed. Two-thirds of them that do business in this country or are considering it say that selling goods and services presents the best opportunity for them in Mexico. Which isn’t surprising when you consider that Mexico is Latin America’s second biggest economy. We gained over 730,000 jobs in 2010, with the average salary rising from what it was a year earlier. As Mexico’s middle class grows, so does its consumption.

64 Private Company Services Private Company Services 65
What top challenges/barriers have you noticed foreign companies encountering in Mexico?
A key challenge for companies doing business in this country is the f luidity of Mexican tax laws. A company that thoroughly studies Mexico’s tax code before setting up business here may discover that rules have changed by the time it arrives.
One such change in recent years has been the restructuring of the so-called f lat tax, in 2008. This means that two corporate taxes — an income tax and a f lat tax — coexist in Mexico, with companies paying the higher of the two. The tax calculations are quite complex and time-consuming, particularly as both tax amounts must be determined. The f lat tax, which has to be determined on a cash basis, can be especially challenging to calculate. Companies new to Mexico should take note of this and plan accordingly, making sure they have suff icient expertise on hand to make the calculations in a timely manner. Using local tax advisors is generally advisable.
Abelardo Macotela
Leader of Middle Market and Private Company Services at PwC Mexico Tel +52 (0) 55 5263 6090 [email protected]
The government — which has signif i-cantly reduced the number of required tax payments in recent years — says that in 2011 it will start to apply just one of the two corporate taxes, eliminating the other. It is also trying to decide, in conjunction with Mexico’s congress, whether the value-added tax should be extended to all sales transactions — or, alternatively, whether the government should simply raise the tax rate.
These potential measures could reduce the time it takes to comply with tax regu- lations and, in turn, help to prevent late payment. This is important for companies, since the Mexican tax authority’s f irst question of a business tends to be, “Did you f ile your return on time?” If the business answers no, the tax authority may say that none of the company’s disbursements can be deducted — a con- sequence that’s in addition to paying a late f ine.
Newly arrived companies also need to have a basic understanding of Mexico’s legal system. Take, for instance, the courts’ handling of labor disputes. Judges generally favor employees in those disputes. While in some countries it might be permissible to dismiss an employee for being unproductive or aggressive, those are insuff icient grounds for laying off a worker in Mexico. Doing so can result in heavy penalties for employers. One way an inbound company may avoid labor disputes is to partner with a local business, which can help the company f ind workers who are well-matched to its operational needs and long-term plans.
3 To learn about Mexico’s tax-reform efforts, see Paying Taxes 2010: The Global Picture, PwC and the World Bank Group.
4 American Chamber of Commerce of Mexico.
5 The A.T. Kearney 2010 FDI Confidence Index ranks the top 25 destinations for foreign direct investment.
Since the economic crisis, have you noticed a change in the dynamics of doing business in Mexico?
In 2009 there was a signif icant slowdown of business in Mexico. That year we saw only $14.4 billion in foreign direct invest- ment, down 51% from the previous year. Much of the decline was due to the economic downturn in the United States, which is Mexico’s largest source of for- eign direct investment. Other contributing factors may have been foreign investors’ concern about security in certain Mexican provinces, which receives a great deal of attention in the press, and the challenges posed by frequent changes in tax laws.
There is nonetheless good reason to believe that Mexico’s economy will improve as global conditions get better and the Mexican government works on advancing key projects, including the reduction of tax-related red tape.3 Indeed, moderate recovery was already evident within the f irst half of 2010, with foreign direct investment in Mexico increasing 28% over what it had been a year earlier.
For 2010 overall, FDI was $19 billion, with FDI for 2011 estimated at between $18 billion and $20 billion.4 Meanwhile, Mexico’s ranking on the Foreign Direct Investment Conf idence Index rose to 8 in 2010 (up from 19 in 2009), putting it above countries such as the UK, Canada, and Russia5 — this despite Mexico’s heavy reliance on the fortunes of the US economy, which is recovering at a slow rate. Our many free trade agreements with fast-growing economies such as Chi- na, Turkey, South Korea, and Indonesia may help reduce that reliance.

AcknowledgementsA core team at PwC worked diligently with the EIU to produce this publication. We’d like to acknowledge the contributions of Cristina Ampil, Cecily Dixon, Amy O’Brien, Eric Parnes, Dean Pontius, Deepali Sussman, Tenaya Taylor, and Reena Vadehra.
Moving beyond tomorrow’s uncertainty and growing your business matters to you, and to us. Experience what it is like to work with professionals dedicated to serving private companies and their owners. Working with you on both day-to-day and more-complex issues such as compliance, controls, cash f low, expansion, succession, and personal f inancial matters — this is PwC’s Private Company Services.
You talk, we listen and share insight. We are proud to serve as advisors to more than 60% of America’s Largest Private Companies,1 collaborating to help you achieve long-term success.
Experience the difference. Visit us online at pwc.com/us/pcs, email us at [email protected], or call us at 800-844-4PCS to start the conversation.
1 2010 Forbes America’s Largest Private Companies List

© 2011 PwC. All rights reserved. “PwC” and “PwC US” refer to PricewaterhouseCoopers LLP, a Delaware limited liability partnership, which is a member firm of PricewaterhouseCoopers International Limited, each member firm of which is a separate legal entity. This document is for general information purposes only, and should not be used as a substitute for consultation with professional advisors.
www.pwc.com/us/pcs
To have a deeper conversation about how opportunities and challenges in the BRICs and beyond may affect your business, please contact:
Rich Stovsky US Private Company Services leader Tel (216) 875 3111 [email protected]
Dean Pontius International Tax Services partnerTel (216) 875 [email protected]
Amy O’BrienUS Private Company Services marketing directorTel (312) 298 [email protected]