building affordable housing in cities after...
TRANSCRIPT

CLOSUP Working Paper Series Number 31
June 2011
Building Affordable Housing in Cities after Abandonment:
The Case of Low-Income Housing Tax Credit Developments in Detroit
Lan Deng University of Michigan
This paper is available online at http://closup.umich.edu
Any opinions, findings, conclusions, or recommendations expressed in this material are those of the author(s) and do not necessarily reflect the view of the Center for Local, State, and Urban Policy or any sponsoring agency
Center for Local, State, and Urban Policy Gerald R. Ford School of Public Policy
University of Michigan

1
Building Affordable Housing in Cities after Abandonment:
The Case of Low-Income Housing Tax Credit Developments in Detroit
Lan Deng
University of Michigan, Ann Arbor
Acknowledgement: The author thanks Qingyun Shen, Thomas Skuzinski, and Peter
Winch for their excellent research assistance. The author also thanks Margi Dewar and
June Thomas for their valuable comments. This research was supported by the Center for
Local, State, and Urban Policy at the University of Michigan. The author takes sole
responsibility for any errors in this paper.

2
Abstract
This paper examines affordable housing developments supported by the Low Income
Housing Tax Credit (LIHTC) program and how they have contributed to neighborhood
redevelopment in the city of Detroit. For cities like Detroit that have long suffered from
disinvestment and abandonment, building subsidized affordable housing offers one of
few opportunities to channel resources into neighborhoods. In Detroit, the LIHTC
funding supported the rehabilitation of over 6,000 housing units and produced over 5,000
new housing units from 1990 to 2007, about half of the new housing stock the city added.
In examining the possible neighborhood impacts generated by the LIHTC projects, the
study finds that half of the LIHTC neighborhoods experienced more improvement in their
socioeconomic status than their comparison groups, while the other half lagged behind.
An examination of the spatial distribution of these neighborhoods reveals a strong
relationship between the concentration of the LIHTC investment and the types of changes
experienced by their neighborhoods.

3
Introduction
A consensus exists that housing policy should reflect local market conditions. In cities
that are growing rapidly, promoting affordable housing production is necessary to
accommodate the rising demand. Yet in cities like Detroit where continuous population
loss has created an oversupply of housing units, the rationale for subsidizing affordable
housing production may not be self-evident. For example, in discussing the guiding
principles for housing policy in the new millennium, Schill and Wachter argue that
production subsidies are appropriate only where special circumstances, such as barriers to
supply or the desire to promote neighborhood redevelopment, justify their use.1 Given
this view, we can justify affordable housing production in cities like Detroit on the
grounds that they promote neighborhood redevelopment. Mallach echoes this point,
arguing that housing strategy in weak market cities should focus on building
neighborhoods, not just houses.2 Particularly in cities with extensive abandonment, where
many neighborhoods have long suffered from disinvestment and abandonment, building
subsidized affordable housing often represents a rare opportunity to channel resources
into these neighborhoods. Using Detroit as an example, this study will examine how
these resources have been distributed and whether they have contributed to neighborhood
redevelopment. In particular, by examining affordable housing developments funded by
the Low-income Housing Tax Credit (LIHTC) program, this study also adds to the
existing body of literature on how subsidized housing developments might affect
surrounding neighborhoods.
The Low-Income Housing Tax Credit Program

4
Enacted as part of the Tax Reform Act of 1986, the Low-Income Housing Tax
Credit (LIHTC) program provides tax credits for low-income rental housing owners and
investors.3 It now gives states the equivalent of nearly $8 billion in annual budget
authority to issue tax credits for the acquisition, rehabilitation, or new construction of
rental housing targeted to lower-income households. According to the U.S. Department
of Housing and Urban Development (HUD), as of 2007, this program has placed in
service over 31,000 projects comprising 1.8 million housing units.4
Unlike other production programs such as public housing, the LIHTC takes a
different approach to subsidizing affordable housing development. Instead of providing
direct development subsidies, it provides federal income tax credits for owners and
investors in low-income rental housing. Developers who wish to build such housing have
to apply for a tax credit allocation from their state housing finance agencies. Developers
then sell the tax credits to private investors who, in turn, contribute equity to the
development in exchange for an ownership position that allows them to use the tax
credits and other possible economic benefits from the project. The equity contribution is
critical, since the amount of debt that affordable housing projects can support is never
adequate to cover their development costs.
The Internal Revenue Service (IRS) and state housing finance agencies jointly
administer the LIHTC program. As long as the aggregate tax credits allocated do not
exceed the cap amount, each state may set specific allocation criteria under very general
guidelines promulgated by the IRS. Initially the cap was $1.25 per state resident, but in
2002 it was raised to $1.75 per state resident and indexed for inflation. In allocating the
tax credits, many state housing finance agencies have given preference to projects that

5
could help promote neighborhood revitalization.5 As a result, LIHTC is not only the
largest federal affordable housing production program but also a critical resource for
community redevelopment, especially for cities that suffer from disinvestment.
When LIHTC first took effect, investors were concerned about the risks associated
with affordable housing development. As a result, the price for tax credits was quite low,
only about 30 or 40 cents per tax credit dollar. Moreover, in places with weak housing
markets, developers who wished to build affordable housing often had difficulty finding
investors to purchase their tax credits. However, after the LIHTC program became
“permanent” in 1993, investors grew more confident. The price for tax credits has
steadily increased, reaching 80 to 90 cents per dollar in the last decade.6 Even distressed
places like Detroit can easily find investors for their affordable housing projects. The
LIHTC has thus become a very effective means of raising development funds for such
places.
The LIHTC program’s ability to raise development funds has faced serious
challenges in recent years. Due to the housing crisis, many financial institutions that were
formerly major buyers of tax credits have withdrawn from this market. With a
significantly shrinking demand, many developers who received tax credit allocation
could not find buyers or could not get the price they needed to raise enough equity. As
part of the economic recovery effort, the federal government has provided some
temporary assistance to this industry by allowing investors to trade in unsold tax credits
for direct development subsidies.7 But the long-term impacts of these changes on the
LIHTC industry remain to be seen. For example, an economic recovery might not bring
back much of the LIHTC demand as investors become more cautious in investing real

6
estate deals. If not, distressed places like Detroit or Cleveland will continue to have
difficulty selling their tax credits. Anecdotal evidence seems to suggest that the
remaining investors who are still purchasing tax credits have been shying away from
these places due to the concerns about the risks in investing in those places.
A simple example illustrates the importance of this program to Detroit before the
housing crisis. The Michigan State Housing Development Authority (MSHDA) is the
agency in charge of allocating tax credits in the State of Michigan. In 2006, the tax credit
cap was $1.90 per state resident. With a population of about 10 million, Michigan was
allowed to allocate about $19 million tax credits. The LIHTC program authorizes two
types of tax credits, the “9%”credits and the “4%” credits. The 9% credits apply to both
rehabilitation and new construction. The applicable rate is reduced to 4% if the project
receives other federal subsidies or uses tax-exempt bond financing. The 4% tax credits
awarded for bond-financing projects, however, are not subject to the tax credit cap. Thus,
in addition to the $19 million allocation limit, MSHDA also awarded about $ 5 million
tax credits to bond-financing projects. According to the report released by MSHDA, the
total tax credit allocation in Michigan reached about $24 million in 2006.8
MSHDA allocates tax credits through a statewide competition. How much goes to
Detroit varies from year to year. In 2006, MSHDA allocated about $8 million tax credits
to projects in Detroit, of which about $1.5 million went to tax-exempt bond financing
projects.9 Since investors can claim the tax credits in equal installments over ten years
and only the first-year tax credits are counted in the allocation, the total amount of tax
credits committed from the Treasury is effectively 10 times the allocation. This means
that in 2006 Detroit received about $80 million tax credits. If we assume a tax credit price

7
of 85 cents per dollar, such allocation would generate $68 million in development funds,
larger than the amount of CDBG money Detroit received. Given the magnitude of this
program, surprisingly little has been written on how the LIHTC has supported urban
redevelopment in Detroit.
LIHTC Development Activities in Detroit
According to HUD’s most recent LIHTC database, developers carried out 255
LIHTC projects (12,297 units) in Detroit from 1987 to 2007. Table 1 presents the
characteristics of the LIHTC development portfolio in Detroit. As Table 1 shows,
developers did far more rehabilitation projects than new developments, a phenomenon
common in many older central cities with deteriorating housing stock.10 Only 76 projects
are new construction. Together, they have produced 5,156 units. Since the first new
construction project finished in 1990, we can compare the number of units produced by
the LIHTC new construction projects with the total housing units the city has built during
the period of 1990 to 2007. According to the 2007 American Community Survey data,
the city added 11,051 new housing units during this period, with a margin of error about
2,612 units.11 The LIHTC new developments thus accounted for a significant share of the
new housing units the city added, ranging from 38% to 61%. This is striking if one
compares Detroit with other large cities. Table 2 shows the contribution of LIHTC
developments to citywide new housing construction in the country’s ten largest cities.
Clearly, LIHTC developments are most dominant in Detroit. In the other cities, they
represented only a small share of new housing development. The significance of LIHTC
developments in Detroit is not surprising considering the severe population decline the

8
city has experienced in the last several decades. Without public subsidies like the LIHTC,
private developers did not have much interest in carrying out new development in
Detroit.12
Focusing on new construction projects alone understates the importance of LIHTC
developments to Detroit, given that most of the LIHTC funding has supported
rehabilitation activities. Table 1 lists the total number of units and the number of low-
income units produced by both new construction and rehabilitation projects. Low-income
units are affordable to families that make less than 50 or 60% of the Area Median Income
(AMI) and thus qualify for the tax credits. The two numbers differ due to the existence of
mixed-income developments that contain “unqualified” units for higher-income families.
As Table 1 shows, almost all the rehabilitation units are low-income units, while only
70% of the new construction units are low-income, showing that new development was
more likely to contain units for middle- or upper-income families. However, most of
these mixed-income projects were built in the early 1990s. Since 1995, such
developments have become rare in Detroit. Two possible reasons can explain this. First,
given the continuous population loss in Detroit, conducting mixed-income development
may have become more difficult. Second, since developers can only claim tax credits for
qualified low-income units, they may have chosen to designate all their units as low-
income units so as to maximize the tax credit subsidies. Such action was financially
attractive given the rising sales price of the tax credits after 1995. As a result, it has
become common for developers to build projects that are 100% affordable. In fact,
HUD’s LIHTC database also shows that nationwide only a small share of the LIHTC
projects are mixed-income developments.13

9
Table 1 also presents the distribution of the LIHTC projects and units by developer
type. Despite Detroit’s weak housing market, for-profit developers have dominated the
area’s LIHTC developments. For-profit developers built over 70% of the LIHTC projects
and units in Detroit; nonprofits built only about 20%. The nonprofits’ share of LIHTC
housing production in Detroit is even lower than the national average. According to
HUD’s LIHTC database, nationwide nonprofit developers account for 29% of LIHTC
production.14 Several reasons may explain this. First, as noted above, the ease of selling
the tax credits before the housing crisis made the program popular among for-profit
developers. With the generous tax credit subsidies, developers can quickly put together
the necessary financing and get the projects built. In return, they earn the developer fees
as well as property management fees if they also manage these properties by themselves.
While nonprofits may also find such opportunities attractive, many nonprofit
organizations in Detroit were fairly small and often could not compete with for-profits in
the LIHTC allocation process. For example, studies have found that in places where
large-scale regional nonprofits operate, the nonprofit sector has produced a large share of
the LIHTC housing production.15 Yet such regional nonprofits do not exist in Detroit.
According to a survey conducted by Community Legal Resources in Detroit, the median
number of employees for Detroit CDCs was about three.16 In addition to capacity
constraints, many Detroit nonprofits also face practical barriers that may thwart their
housing development efforts. Land assembly is one example. Despite the vast amount of
land owned by the city government, getting such land for affordable housing
development can be very challenging in Detroit.17 The limited participation in LIHTC
developments is also a lost opportunity for Detroit’s nonprofits. According to Freeman,

10
the funds and experience acquired from developing LIHTC projects have often
contributed to the growth of the nonprofit sector in many other places.18
Table 1 also categorizes the LIHTC projects by their project size. About two-thirds
of the LIHTC projects fall into the category of small projects, with fewer than 50 units
per project. More specifically, 96 of these projects were single-unit rehabilitations carried
out by a few local landlords, who often used the LIHTC to renovate single-family
housing units and rent them out to Section 8 tenants. All these single-unit rehabilitation
projects were funded before 1996. After 1996, the LIHTC database listed no such
projects. According to the developer who conducted most of these single-unit
rehabilitation projects, this was partly due to a change in IRS inspection rules.19 On the
other hand, while no longer supporting single-unit rehabilitation, MSHDA favored
scattered-site, new construction projects. Developers build such projects with single-
family housing units close to each other to facilitate construction and operating
efficiencies and, one hopes, to create the synergy for neighborhood improvement. LIHTC
projects’ size distribution may also reflect MSHDA’s allocation preferences. Throughout
the program history, MSHDA has discouraged large-scale developments by setting
maximum project sizes or limiting developer fees. Still, as Table 1 shows, while
developers built only 37 large-scale projects with over 100 units per project, together
these account for over half of the LIHTC units in Detroit.
One program feature has made LIHTC developments particularly popular in Detroit:
the program’s broad income targeting. Under the LIHTC program, units targeting
households with income below 50% or 60% Area Median Income (AMI) qualify for the
tax credits. AMI is defined metropolitan wide. The presence of affluent suburbs north and
11
west of the city means that the AMI for Detroit metropolitan area is high. As a result, the
maximum rents allowed for LIHTC units, calculated at 30% of targeted household
income, exceed the prevailing market rents in many of Detroit’s neighborhoods. A quick
example illustrates this. In 1999, HUD specified the area median income for the Detroit
MSA as $60,500. With a 50% AMI target, the maximum rent allowed for LIHTC units
would be about $756 per month. Yet, according to the 2000 census data, the median gross
rent citywide was only about $486 per month in the same year.20 This has three
implications. First, LIHTC’s rent limits are fairly high in Detroit. Since developers can
easily meet this requirement, LIHTC is accessible to many developments in Detroit.
Second, as the rent comparison shows, not much difference exists between market
housing and the LIHTC housing in Detroit. Thus the relationships between LIHTC
projects and their surrounding neighborhoods in Detroit may be quite different from those
in other places. The NIMBY(Not-In-My-Backyard) attitude, for example, may not be a
big concern for such developments. In fact, in many of Detroit’s neighborhoods that are
struggling with property disinvestment and abandonment, newly built or renovated
LIHTC projects may provide a move-up opportunity for residents who lived in
deteriorated housing units.
Not only can the new housing units be attractive to their neighbors, but their
relatively broad income targeting also means that the program has the potential to help
the city retain working-class families. For example, census data have shown that in the
1990s, the median family income in the city of Detroit was only about half of the metro’s
AMI. Thus, targeting households making 50 or 60% of AMI is essentially targeting the
city’s median-income population, assuming that such a population would live in these

12
LIHTC projects. However, the syndicator who has underwritten most of the LIHTC
projects in Detroit argues that, except for projects located at prime locations such as
downtown or riverfront areas, LIHTC projects would take risks in only targeting
households making 50 or 60% AMI, since these households have plenty of other options
on the market. Thus, in the syndicator’s view, LIHTC projects targeting households with
lower income would be more solid in achieving occupancy. But these projects would
have very restricted rent flows. As a result, the syndicator would prefer projects that also
combine other types of government subsidies such as project-based housing vouchers to
ensure financial stability.21
In summary, MSHDA has used the LIHTC to subsidize a variety of projects in
Detroit that differ by development type, sponsor status, and project size. Since these
projects have constituted a significant portion of the city’s new housing development
activities, how they are sited could have significant impacts on the city’s neighborhoods,
an issue the next section addresses.
Examining the Neighborhood Impacts of LIHTC Projects in Detroit
Existing literature suggests that affordable housing developments can generate
significant impacts on the surrounding neighborhoods. According to Schill and Wachter,
housing has the potential to replace disamenities with amenities and help create
neighborhood stability.22 This was confirmed in New York City, where studies have
found that the city’s ten-year housing development efforts, which began in the mid
1980s, have made significant contributions to neighborhood revitalization, for example,
by transforming once abandoned neighborhoods into thriving, low- and moderate-income

13
communities.23 Researchers who have studied HOPE VI developments report similar
findings. Created to redevelop the nation’s most distressed public housing properties,
HOPE VI projects have sought not only to improve the properties’ physical quality, but
also to promote social and economic transformation in public housing complexes and
their surrounding communities. Many of those projects have generated positive impacts
on their surrounding neighborhoods such as a reduction in crime rate and a boost in
nearby property value.24 However, as these studies often point out, affordable housing
developments are only one necessary component of revitalization efforts—not an
independently sufficient one. Other factors such as changing market forces and strong,
visionary local institutions are equally important.25 When these factors are not present,
evidence suggests that affordable housing development can increase poverty
concentration and accelerate neighborhood decline.26 Next I will examine which scenario
best characterizes the effects of Detroit’s LIHTC developments.
To examine the neighborhood impacts of the LIHTC projects in Detroit, this analysis
will consider LIHTC projects built between by 1999.27 In this study, I use census block
groups to represent neighborhoods. By comparing the 1990 and 2000 census data, I can
see how neighborhoods hosting the LIHTC projects have changed after these
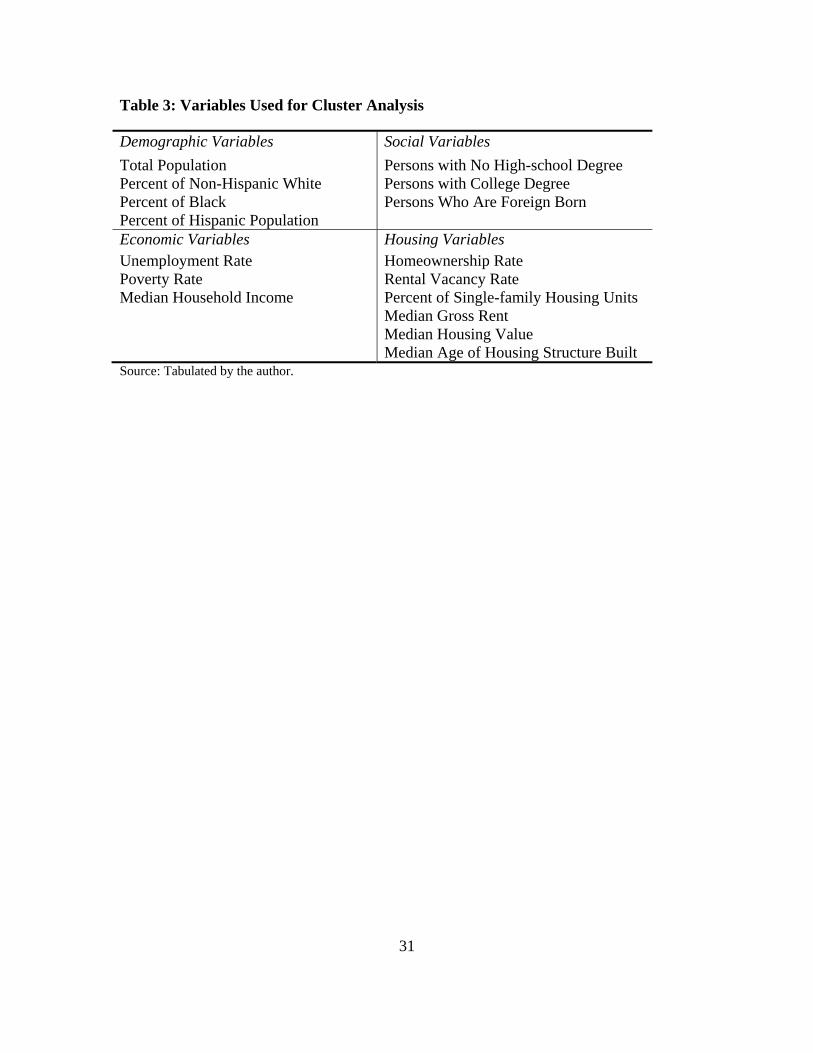
developments. Specifically, I conduct analysis in two steps. First, using the 1990 census
data, I apply a hierarchical cluster analysis to sort all census block groups into different
neighborhood clusters. Table 3 lists the 16 variables used for the cluster analysis. The
hierarchical cluster analysis maximizes the similarity of block groups within each cluster
on these sixteen variables. Since neighborhoods in the same cluster have a stronger
similarity than neighborhoods between clusters, this analysis helps identify the

14
comparison groups for LIHTC neighborhoods. Second, for each LIHTC neighborhood, I
identify a comparison group that includes all the non-LIHTC neighborhoods in the same
cluster and also within the same zip code area. I then compare changes in this LIHTC
neighborhood with the mean changes experienced by the comparison group, which would
allow me to see how LIHTC neighborhoods have evolved differently from similar
neighborhoods in nearby areas.
Identifying Neighborhood Types Using Cluster Analysis
This section briefly discusses the results of the cluster analysis. According to their
demographic, social, economic, and housing characteristics as revealed by the 1990
census data, six clusters of neighborhoods exist in Detroit. Figure 1 presents the spatial
distribution of the six clusters of neighborhoods. In defining these clusters, I have used
the metropolitan median household income as a benchmark to evaluate the neighborhood
economic status. Consequently, all neighborhoods in Detroit are labeled either as low
income or moderate income. These labels reflect my interpretation of the similarities and
differences among those clusters. As Figure 1 shows, two neighborhood types dominated
in Detroit in 1990: neighborhoods occupied by black low-income renters and
neighborhoods occupied by black moderate-income homeowners. About 80% of the
city’s census block groups fell into these two categories. The strong homogeneity among
Detroit’s neighborhoods is not surprising given that the city has long been subject to
white flight and economic decline. The analysis also shows that in identifying the
comparison group for the LIHTC neighborhoods, controlling for their socioeconomic
characteristics is not enough in Detroit, since neighborhoods with similar characteristics
spread across a large area. I thus limit the comparison group to neighborhoods in the
15
same cluster and also in the same zip code area to control for location. Finally, Figure 1
also shows that the city had a small number of other types of neighborhoods.
Neighborhoods that had a large share of non-Hispanic white population, for example,
were mostly located along the city’s eastern and western borders, while some racially
mixed, low-income rental neighborhoods existed in southwest Detroit.28
Location Pattern of LIHTC Projects Built by 1999
Figure 2 maps the location of the LIHTC projects by project size. All of the 151
LIHTC projects built by 1999 (5,021 units) are located across 104 census block groups. A
majority of these block groups were either black low-income rental neighborhoods or
black moderate-income owner-occupied neighborhoods, the two largest clusters
discussed above. While on average an LIHTC block group accommodates about 48 units,
some block groups accommodate hundreds of units, while others have only a few. This is
largely due to the variation in project size, ranging from one unit to over 500 units per
project. Figure 2 shows that projects of different sizes have distinctly different location
patterns, with smaller projects being more dispersed than larger projects. Single-unit
rehabilitation projects, for example, have spread across the city’s west and northeast side
and are mainly located in neighborhoods with a large single-family housing stock. By
contrast, larger projects, including all of the new construction projects, are mostly located
either close to the city’s central corridor or in the lower eastside, especially next to the
riverfront. In fact, as Figure 2 shows, LIHTC projects and units are most concentrated in
three places: the Midtown area, the Elmwood Park neighborhood, and Jefferson-
Chalmers. Together, these three places contain almost half of the housing units produced

16
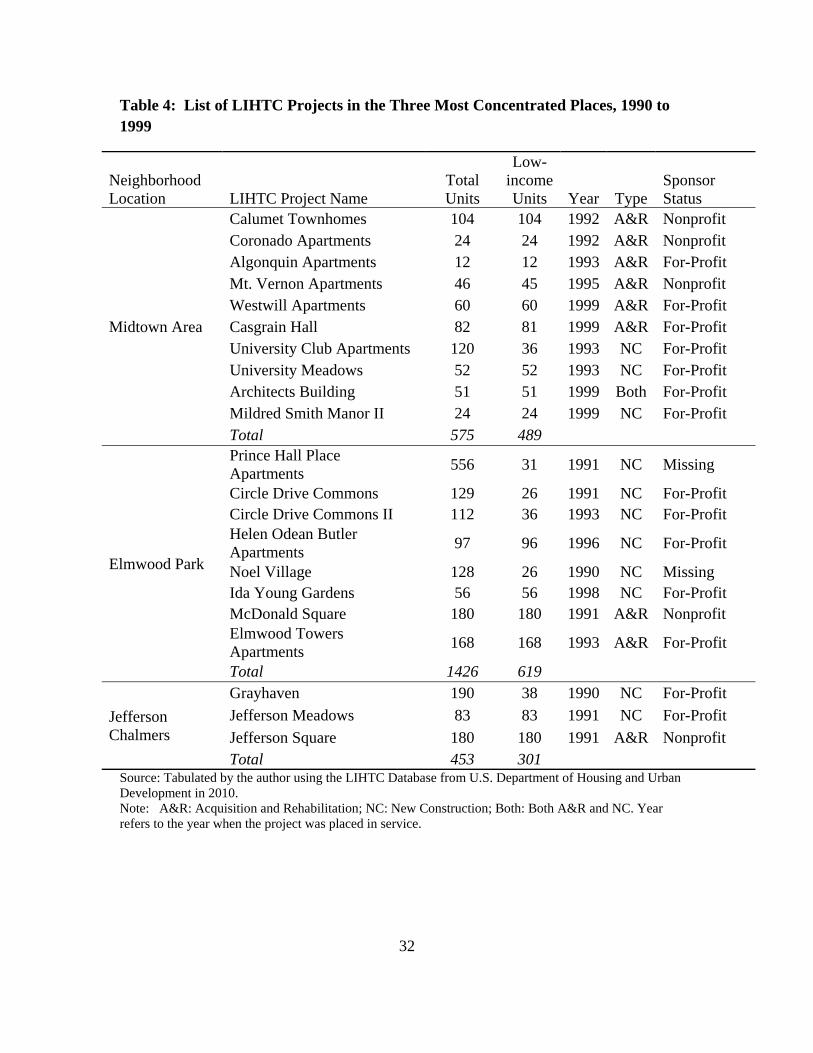
by the LIHTC projects. The three places are circled in Figure 2. Table 4 presents a list of
the LIHTC projects built in the three places.
Midtown surrounds Wayne State University and runs south toward downtown. The
area is also proximate to the city’s cultural center and medical center. With major
institutions and hospitals nearby, Midtown is now one of the most vibrant places in the
city and has a large number of apartments and condo developments. The cluster analysis
identifies all block groups in this area as black, low-income rental neighborhoods. A total
of 10 LIHTC projects and 575 units were built by 1999. Except for one mixed-income
development, all of the LIHTC projects were 100% affordable. Units produced by these
projects were almost equally split between rehabilitation and new construction.
The second area with a large concentration of LIHTC projects is Elmwood Park
neighborhood, located to the east of downtown. Federally funded urban renewal projects
created both the Elmwood Park and the adjacent Lafayette Park neighborhoods. Both
were well-planned, middle-class communities with an impressive mix of income groups
and housing styles.29 Elmwood Park was, in particular, known for its success in
integrating federally assisted low-income housing with middle-class housing.30
According to the cluster analysis of the 1990 census data, both neighborhoods were
moderate-income communities with predominantly black homeowners. Eight LIHTC
projects, with a total of 1,426 units, were built in two adjacent block groups in the
Elmwood Park neighborhood. Two were rehabilitation projects, and the other six were
new construction, adding over 1,000 units to the neighborhoods. While both
rehabilitation projects were 100% affordable, four out of the six new construction
projects were mixed-income developments. Only about 20% of the new construction

17
units were low-income housing, consistent with the neighborhood’s historically mixed-
income character.
The third place, Jefferson-Chalmers, is located along the Detroit River on the far
eastside of the city. Since the area is next to the wealthy suburb of Grosse Pointe Park, it
has a mixed housing and demographic profile with a significant non-Hispanic white
population. The cluster analysis shows that neighborhoods in this area fell into three
categories: black low-income rental neighborhoods, black moderate-income owner-
occupied neighborhoods, and white moderate-income owner-occupied neighborhoods.
Because of its location, the area has long been part of the city’s riverfront development
strategy.31 One notable development in this area is Victoria Park, the city’s first new
single-family subdivision in thirty years.32 The area also saw several large-scale
multifamily housing developments, including three LIHTC projects. Two of them were
new construction and the third was a rehabilitation project. During our study period they
produced 453 units, with 301 low-income units.
Anyone who is familiar with Detroit would probably not be surprised to learn that
the three places discussed above have a large concentration of LIHTC developments. As
Thomas has documented, all three places have a long history of neighborhood
redevelopment that dates back to the urban renewal era of the 1950s and 1960s.33 For
several decades, the city of Detroit has pursued a downtown/riverfront development
strategy and has channeled many of its resources to the central business district, the
riverfront on either side of the CBD, and the corridor between the CBD and the Wayne
State University/Medical Center area.34 All three places described above fall into these
targeted areas. Each was a designated urban renewal area, and for many years each had

18
an advisory citizen district council (CDC) to address redevelopment in the area.35 For
example, in the 1980s, under Coleman Young’s administration, these citizen district
council areas received a large amount of CDBG funds for neighborhood redevelopment.36
The recent concentration of LIHTC investment in these places is thus one part of
cumulative efforts to redevelop these areas. This investment pattern may also reflect
MSHDA’s allocation preferences. An examination of MSHDA’s LIHTC Qualified
Allocation Plans (QAP) shows that MSHDA has rewarded projects located in areas that
have a neighborhood revitalization plan or are the targeted investment areas of other
public programs, hoping to generate synergy for revitalization. Given their
redevelopment history and MSHDA’s application scoring system, MSHDA may have
favored such places over other parts of the city.
Despite the state’s allocation preferences, private developers generally initiate
LIHTC projects. Since for-profit developers conducted most of the LIHTC projects in
these places, the concentration of LIHTC projects in the three places also reflected the
private sector’s efforts to capture market opportunities at these prime locations. As Table
4 shows, several LIHTC mixed-income developments have produced a large number of
unsubsidized units for middle- and higher-income families. Even most of the subsidized
housing units targeted households making 50 or 60% AMI. Together these projects may
help retain the city’s working-class population.
Concentrating resources at these core locations is not without controversy. As
Detroit’s redevelopment history shows, critics have long worried that doing so would
sacrifice the needs of the truly disadvantaged and the neighborhoods where they live.37
The allocation of LIHTC has to some degree addressed this concern. As Figure 2 shows,

19
developers built a number of LIHTC projects throughout the city, in places other than the
three core locations discussed above. Some projects were fairly large, but in general no
clear pattern of clustering emerges. Moreover, projects outside the core areas were also
more likely to be nonprofit developments. The nature of nonprofits may have motivated
them to undertake difficult projects in resource-poor environments.38 A critical issue this
study addresses is whether these efforts have generated positive effects on
neighborhoods.
Measuring Changes in LIHTC Neighborhoods
In this section I examine how each LIHTC neighborhood has changed between 1990
and 2000 censuses. As noted above, each LIHTC neighborhood has a comparison group
consisting of all the non-LIHTC neighborhoods in the same cluster that are also within
the same zip code. I examine neighborhood changes on four indicators: change in
poverty rate, change in neighborhood median household income, change in median gross
rent, and change in median housing values. I use the Geolytics Neighborhood Change
database to measure changes on these four indicators since this database normalizes 1990
census data by the 2000 census boundary, thus allowing me to measure neighborhood
changes for the same geographic area. I choose the four indicators to describe the
characteristics that a LIHTC development most likely would affect, given that such a
development would build or rehabilitate housing units and bring additional residents to
the neighborhood. Together, these indicators can offer useful information on how a
LIHTC neighborhood’s socioeconomic status has changed relative to its comparison
group’s. Yet neighborhood changes often have numerous dimensions and these changes

20
may also affect different groups in different ways. As a result, the four indicators
considered in this study do not capture the complexity of neighborhood changes nor their
impacts on neighborhood residents.
With this caveat in mind, for each LIHTC neighborhood, I compare changes in this
neighborhood with the distribution of changes experienced by its comparison group and
calculate a Z-score of change for each indicator. I use Z-scores because they provide
standardized measurements and thus can be summarized across the different indicators.39
For example, an LIHTC neighborhood with a Z score of 1 on median household income
experienced an increase in median household income that is one standard deviation above
the mean change experienced by non-LIHTC neighborhoods in the comparison group. I
then summarize the Z-score across all four indicators and calculate an average Z score
per indicator.40 If the average Z score is positive, it shows that the LIHTC neighborhood,
on average, experienced more improvement in its socioeconomic status than its
comparison group. On the other hand, if the average Z score is negative, it shows that the
LIHTC neighborhood experienced a decline in its socioeconomic status; that is, it lagged
behind the comparison group.
Table 5 tabulates the distribution of LIHTC projects and units according to the type
of changes their neighborhoods experienced. As Table 5 shows, among the 104 census
block groups hosting the LIHTC projects, 46 experienced more improvement in
socioeconomic status than their comparison groups, and 49 lagged behind their
comparison groups. The distribution of LIHTC projects splits half and half between the
two types of neighborhoods. However, more units were built in neighborhoods
experiencing socioeconomic improvement than in neighborhoods that fell behind (56%
21
versus only 21%). Table 5 also reveals a large difference between total units and the
number of low-income units in LIHTC neighborhoods experiencing an improvement,
indicating the existence of mixed-income developments in those neighborhoods. Since
mixed-income developments often added higher-income families and more expensive
housing units to the neighborhoods, they may have contributed to the improvement in
neighborhood socioeconomic status.
Did the LIHTC projects cause the observed neighborhood changes? This analysis,
while controlling for initial neighborhood conditions and neighborhood location, cannot
establish causality. For example, a neighborhood might be experiencing development
activities or events other than the LIHTC developments, especially since the study period
spans over a decade. As a result, observed neighborhood changes may not result solely
from the LIHTC developments. On the other hand, examining the general pattern of the
changes in LIHTC neighborhoods can provide some useful lessons about the most
effective ways to invest limited resources.
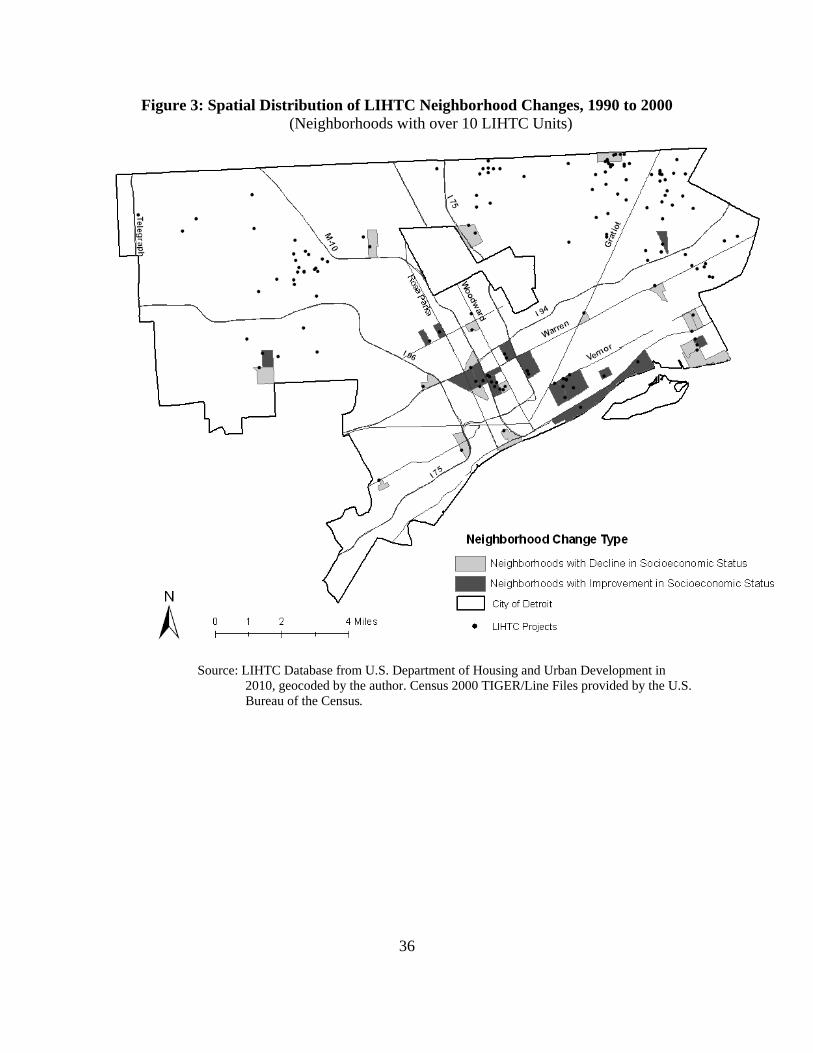
Figure 3 presents the spatial distribution of LIHTC neighborhoods experiencing the
two types of changes. To highlight the role of the LIHTC projects, Figure 3 includes only
the 34 block groups with over 10 LIHTC units. 41 It excludes many of the neighborhoods
containing single-unit rehabilitation projects, since these very small projects likely did
not play a significant role in shaping neighborhood changes. Figure 3 reveals a striking
contrast in the spatial pattern of LIHTC neighborhoods experiencing the different types
of neighborhood changes. LIHTC neighborhoods experiencing a decline in their
socioeconomic status were largely dispersed in the city, while LIHTC neighborhoods
experiencing improvement were located along the city’s central corridor and riverfront

22
areas. Neighborhoods in the two places that have the largest concentration of LIHTC
projects, Midtown and Elmwood Park, all experienced more improvement than similar
neighborhoods in the surrounding areas. Other LIHTC neighborhoods that improved
include three census block groups in the Rivertown area to the south of Elmwood Park,
which host several LIHTC rehabilitation projects.42 This pattern is not a coincidence. As
discussed above, all these neighborhoods, including the Rivertown area, have been at the
center of the city’s redevelopment efforts for several decades and have received a
significant amount of public and private investment, of which LIHTC is only part. As our
analysis shows, the infusion of resources facilitated some notable improvement in these
areas, at least during our study period.
Unlike Midtown or Elmwood Park, the third place with a large concentration of
LIHTC projects, Jefferson Chalmers, had a mixed pattern of neighborhood changes.
Three census block groups in this area contain LIHTC developments. One of them,
located along the riverfront, was identified as a white, moderate-income owner-occupied
neighborhood. Since it was the only neighborhood of this type, no comparison group
existed in its zip code area. As a result, neighborhood change in this block group was not
measured. The other two block groups that are adjacent to each other were identified as
black low-income rental neighborhoods. However, while the block group on the east side
experienced more improvement than its comparison group, the other one declined in
socioeconomic status. The first block group improved so dramatically that it had the
highest Z score (3.78), which shows that it far outperformed other neighborhoods in the
nearby area. For example, according to the 1990 and 2000 census data, the poverty rate in

23
this block group declined from 38% to 4%, while median household income jumped from
$351 to $69,844.
How did this dramatic transformation happen? An examination of the development
activities in this neighborhood shows that the changes were largely due to the
development of Victoria Park, an expensive single-family housing subdivision mentioned
above. Since 1992 when homes built in the first phase were sold, the Victoria Park
project has produced 157 detached single-family housing units for this neighborhood.
The units initially sold at about $160,000 and more, but the demand was so high that it
drove the price up to $300,000, far higher than the prevailing market price in Detroit.43
By bringing in middle- and upper-income families, Victoria Park has significantly
changed the neighborhood’s socioeconomic profile. In contrast, the LIHTC project
located in this block group, Jefferson Meadows, was an 83-unit rental housing
development targeting senior households making less than 60% AMI. Thus, while
Jefferson Meadows may have also contributed to the observed neighborhood changes,
Victoria Park drove much of the dramatic transformation.
Despite its dramatic impacts on its own neighborhood, Victoria Park did not appear
to generate many spillover effects. As Ryan documented, because the surrounding
housing is still severely decayed, builders of Victoria Park homes have physically
isolated their units from the surroundings, with very limited access from the outside.44
The other LIHTC block group adjacent to this development experienced a decline in its
socioeconomic status compared to its comparison group. Measured in absolute terms, this
other block group--which contains a 180-unit rehabilitation LIHTC project--saw a decline
in poverty rate and an increase in median household income over the ten-year period. But

24
these changes were more modest than those of the comparison group.45 Thus, this LIHTC
block group, historically the poorest neighborhood in the Jefferson-Chalmers area,
continued to lag behind other neighborhoods in the area. For example, according to the
1990 and 2000 census data, although the block group’s poverty rate fell from 53% to
30%, it remained a high-poverty neighborhood as of 2000. On the other hand, the
differences in neighborhood changes experienced by the two adjacent block groups may
also reflect the incompatibility of efforts to build middle-class, single-family homes and
efforts to provide affordable housing for low-income families. Due to their differences in
both physical characteristics and socioeconomic profiles, these projects were largely
isolated from each other, which may have limited their potential to generate synergy
effects. The development of Victoria Park, heavily subsidized, perhaps even more so than
the LIHTC development, might have had more positive effects on the surrounding area if
it was integrated with other redevelopment efforts.
Finally, as previously mentioned, Figure 3 also shows that most LIHTC
neighborhoods experiencing a relative decline in their socioeconomic status were located
outside the core areas and tended to be dispersed. Moreover, these neighborhoods often
contain only one or two LIHTC projects. A review of the city’s redevelopment history
also shows that these neighborhoods were rarely among the city’s focused redevelopment
areas.46 The lack of improvement in these neighborhoods may reflect the ineffectiveness
of the LIHTC investment; however, it also reflects the historic lack of public investment
in these areas, as well as a weak demand for housing in these neighborhoods as the city’s
population continued to decline. As a result, these LIHTC projects could not have single-
handedly turned around their neighborhoods.47

25
Conclusion
This paper examines LIHTC development activities in the city of Detroit and how
they have contributed to neighborhood redevelopment. For cities like Detroit that have
long suffered from disinvestment and abandonment, building subsidized affordable
housing offers one of few opportunities to channel resources into neighborhoods. In
Detroit, for example, the LIHTC funding supported the rehabilitation of over 6,000
housing units from 1990 to 2007. Moreover, the program also helped produce over 5,000
new housing units, about half of the new housing stock the city added during the same
period. The significance of the LIHTC program in Detroit illustrates the importance of
government subsidies in inducing development activities in cities suffering from
abandonment. Yet, for-profit developers built a majority of the LIHTC projects in
Detroit. Detroit’s nonprofits, on the other hand, have faced both capacity constraints and
practical barriers that have limited their participation in LIHTC developments.
The second half of this paper examines the possible neighborhood impacts generated
by the LIHTC projects. Due to data constraints, the analysis considers only LIHTC
projects built by 1999 and examines how their neighborhood conditions have changed
between the 1990 and 2000 censuses. Half of the LIHTC neighborhoods experienced
more improvement in their socioeconomic status than their comparison groups, while the
other half lagged behind. Moreover, an examination of the spatial distribution of these
neighborhoods reveals a strong relationship between the concentration of the LIHTC
investment and the types of changes experienced by their neighborhoods. For example,
while LIHTC projects are most concentrated in the city’s central corridors and riverfront

26
areas, most of the neighborhood improvement also occurred there. As our discussion
shows, these neighborhoods have long been at the center of the city’s redevelopment
efforts. While the LIHTC developments may not necessarily cause the observed
neighborhood changes, this finding suggests the importance of resource concentration
and long-term commitment in neighborhood revitalization, especially in a city that has
lost over half its population. On the other hand, the mixed pattern of neighborhood
changes in the Jefferson-Chalmers area also shows that merely concentrating resources
may not be enough to promote neighborhood redevelopment. Instead, the different types
of redevelopment efforts should be integrated so that their effects could reinforce each
other.
What lessons do LIHTC neighborhoods provide whose socioeconomic status
declined from 1990 to 2000? The LIHTC developments cannot take all of the blame for
such changes, given the existence of other (often more powerful) factors such as a weak
housing market and the historic neglect of public investment. Nevertheless, the decline in
these neighborhoods raises questions about the effectiveness of the LIHTC investment,
given that such investment is often spatially isolated. Considering the limited resources
the city has, could the LIHTC might be better invested somewhere else if the goal is to
promote neighborhood redevelopment? This is a challenge facing MSHDA, the state
housing finance agency. As noted before, state housing finance agencies administer the
LIHTC program and allocate tax credits among individual projects. The program itself
does not involve local governments in the LIHTC allocation decisions. However, in
other places I studied, for example, Santa Clara County in California, local governments
have offered gap financing or other incentives such as density bonus to direct LIHTC

27
projects to strategic locations that fit local development plans. This is not the case in
Detroit. Except for the downtown and riverfront areas, the city of Detroit has neither the
resources nor the planning capacity to influence LIHTC developments, even though these
developments have become an essential part of local redevelopment efforts. Better
coordination between the state and city authorities could help improve LIHTC’s impacts
on neighborhood redevelopment. Currently MSHDA already has some mechanism in
place that would encourage projects to seek for local support, for example, by awarding
extra points for projects that receive tax abatements or other subsidies from local
governments. However, the limited number of extra points has not played a significant
role in shaping the LIHTC development pattern, given the many other criteria MSHDA
also evaluates in the LIHTC allocation decision. Thus, besides strengthening the existing
mechanism, perhaps MSHDA could also consider communicating directly with local
planning and development authorities on how to invest the LIHTC that would better
serve local redevelopment goals. On the other hand, given the large amount of tax credits
Detroit receives each year, the city government should also get more actively involved in
the LIHTC development decisions. While it may not provide much financial support, the
city government can still influence the LIHTC development pattern either through land
use decisions or the process of selling city-owned land. Together these efforts can help
ensure that the affordable housing developments become part of a conscious plan to
promote neighborhood redevelopment, not just build houses.

28
Tables and Figures
Table 1: LIHTC Development Portfolio in Detroit, 1987 to 2007
Table 2: Contribution of LIHTC Projects to Citywide New Housing Construction in Ten Largest Cities, 1990 to 2007
Table 3: Variables Used for Cluster Analysis
Table 4: List of LIHTC Projects in the Three Most Concentrated Places, 1990 to 1999
Table 5: Distribution of LIHTC Projects and Units by Neighborhood Change Types, 1990 to 2000
Figure 1: Six Clusters of Neighborhoods in Detroit from the 1990 Census
Figure 2: Location Pattern of LIHTC Projects Built by 1999 in Detroit
Figure 3: Spatial Distribution of LIHTC Neighborhood Changes, 1990 to 2000

29
Table 1: LIHTC Development Portfolio in Detroit, 1987 to 2007
No. of
Projects
% of Total
Projects No. of Units
% of Total Units
No. of Low-
income Units
% of Low-
income Units
Development Type
Acquisition and Rehabilitation 175 69% 6,788 55% 6,507 62%
New Construction 76 30% 5,156 42% 3,634 35%
Both 4 2% 353 3% 353 3%
Developer Type
For-Profit 190 75% 8,523 69% 7,589 72%
Nonprofit 41 16% 2,507 20% 2,505 24%
Missing 24 9% 1,267 10% 400 4%
Project Size
Less than 50 169 66% 2,044 17% 1,994 19%
50 to 99 49 19% 3,228 26% 3,163 30%
100+ 37 15% 7,025 57% 5,337 51%
Total 255 100% 12,297 100% 10,494 100% Source: LIHTC Database from U.S. Department of Housing and Urban Development in 2010.

30
Table 2: Contribution of LIHTC Projects to Citywide New Housing Construction in Ten Largest Cities, 1990 to 2007
LIHTC Developments ACS Estimate Share of LIHTC NC Units in Total
New Housing Units Built Citywide City
No. of Projects
No. of Units
No. of NC
Units
Total Housing Units Built Citywide
Margin of Error
New York, NY 1,386 72,422 28,794 235,189 13,406 12% ~13%
Los Angeles, CA 352 21,932 10,758 128,652 9,048 8%~9%
Chicago, IL 308 27,575 7,450 110,723 8,484 6%~7%
Houston, TX 136 26,685 15,980 184,049 11,545 8%~9%
Philadelphia, PA 465 10,022 3,807 34,193 5,369 10%~13%
Phoenix, AZ 44 6,250 3,286 167,795 10,368 2%
San Antonio, TX 68 9,613 6,952 144,665 10,481 4% ~5%
San Diego, CA 81 8,153 3,628 100,302 8,323 3%~4%
Dallas, TX 120 20,238 7,968 98,343 8,396 7%~9%
Detroit, MI 255 12,297 5,156 11,051 2,612 38% ~61% Source: Tabulated by the author based on the 2007 American Community Survey (ACS) Data from the U.S. Bureau of the Census and the LIHTC database from U.S. Department of Housing and Urban Development in 2010. Note: 1.NC: new construction. All new construction units were built after 1990.
2. ACS estimate has a wide margin of error. So I added (and also subtracted) the margin of error from the ACS estimate to get the full range of the total housing units built citywide. I then used this range to calculate the share of LIHTC NC units in total housing units built citywide.
3. I identified ten largest cities based on their population size in the 2000 census.
31
Table 3: Variables Used for Cluster Analysis
Demographic Variables Social Variables Total Population Percent of Non-Hispanic White Percent of Black Percent of Hispanic Population
Persons with No High-school Degree Persons with College Degree Persons Who Are Foreign Born
Economic Variables Housing Variables Unemployment Rate Poverty Rate Median Household Income
Homeownership Rate Rental Vacancy Rate Percent of Single-family Housing Units Median Gross Rent Median Housing Value Median Age of Housing Structure Built
Source: Tabulated by the author.
32
Table 4: List of LIHTC Projects in the Three Most Concentrated Places, 1990 to 1999
Neighborhood Location LIHTC Project Name
Total Units
Low-income Units Year Type
Sponsor Status
Midtown Area
Calumet Townhomes 104 104 1992 A&R Nonprofit Coronado Apartments 24 24 1992 A&R Nonprofit Algonquin Apartments 12 12 1993 A&R For-Profit Mt. Vernon Apartments 46 45 1995 A&R Nonprofit Westwill Apartments 60 60 1999 A&R For-Profit Casgrain Hall 82 81 1999 A&R For-Profit University Club Apartments 120 36 1993 NC For-Profit University Meadows 52 52 1993 NC For-Profit Architects Building 51 51 1999 Both For-Profit Mildred Smith Manor II 24 24 1999 NC For-Profit Total 575 489
Elmwood Park
Prince Hall Place Apartments 556 31 1991 NC Missing
Circle Drive Commons 129 26 1991 NC For-Profit Circle Drive Commons II 112 36 1993 NC For-Profit Helen Odean Butler Apartments 97 96 1996 NC For-Profit
Noel Village 128 26 1990 NC Missing Ida Young Gardens 56 56 1998 NC For-Profit McDonald Square 180 180 1991 A&R Nonprofit Elmwood Towers Apartments 168 168 1993 A&R For-Profit
Total 1426 619
Jefferson Chalmers
Grayhaven 190 38 1990 NC For-Profit Jefferson Meadows 83 83 1991 NC For-Profit Jefferson Square 180 180 1991 A&R Nonprofit Total 453 301
Source: Tabulated by the author using the LIHTC Database from U.S. Department of Housing and Urban Development in 2010. Note: A&R: Acquisition and Rehabilitation; NC: New Construction; Both: Both A&R and NC. Year refers to the year when the project was placed in service.

33
Table 5: Distribution of LIHTC Projects and Units by Neighborhood Change Types, 1990 to 2000
Classification No. of LIHTC BKGPs
Total LIHTC Projects
% of LIHTC Projects
Total Units
% of Total Units
Low-income Units
% of Low-income Units
LIHTC Neighborhoods with Improvement in Socioeconomic Status
46 69 46% 2,809 56% 1,645 48%
LIHTC Neighborhoods with Decline in Socioeconomic Status
49 69 46% 1,061 21% 1,060 31%
Neighborhoods Whose Changes Could Not Be Measured
9 13 8% 463 23% 754 22%
Total 104 151 100% 5,021 100% 3,459 100%
Source: Tabulated by the author using the LIHTC Database from U.S. Department of Housing and Urban Development in 2010 and the 1990 and 2000 census data from the U.S. Bureau of the Census. Note: Neighborhoods whose changes could not be measured include five census block groups that did not report owner-occupied housing values and four census block groups for which comparison groups did not exist in the same zip code area.

34
Figure 1: Six Clusters of Neighborhoods in Detroit from the 1990 Census
Source: Census 2000 TIGER/Line Files provided by the U.S. Bureau of the Census.

35
Figure 2: Location Pattern of LIHTC Projects Built by 1999 in Detroit
Source: LIHTC Database from U.S. Department of Housing and Urban Development in
2010, geocoded by the author. Census 2000 TIGER/Line Files provided by the U.S. Bureau of the Census.
36
Figure 3: Spatial Distribution of LIHTC Neighborhood Changes, 1990 to 2000 (Neighborhoods with over 10 LIHTC Units)
Source: LIHTC Database from U.S. Department of Housing and Urban Development in
2010, geocoded by the author. Census 2000 TIGER/Line Files provided by the U.S. Bureau of the Census.

37
Notes:
1 Michael H. Schill and Susan M. Wachter, “Principles To Guide Housing Policy at the Beginning of the Millennium,” Cityscape: A Journal of Policy Development and Research 5, no. 2 (2001), 5-19.
2 Alan Mallach, Building a Better Urban Future: New Directions in Housing Policy for Weak Market Cities (Montclair, NJ: National Housing Institute, 2005).
3 Jean L. Cummings and Denise DiPasquale, “The Low-Income Housing Tax Credit: An Analysis of the First Ten Years,” Housing Policy Debate 10, no. 2 (1999), 251-307.
4 U.S. Department of Housing and Urban Development, About the LIHTC Database, 2010. Last updated Feb. 16, 2010. http://www.huduser.org/datasets/lihtc.html.
5 Lan Deng, “Comparing the Effects of Housing Vouchers and Low-Income Housing Tax Credits on Neighborhood Integration and School Quality,” Journal of Planning Education and Research 27(2007), 20-35.
6 Alex Schwartz, Housing Policy in the United States, 2nd Edition (New York: Routledge, 2009). 7 Ibid. 8 Michigan State Housing Development Authority, Allocation of 2006 Low Income Housing Tax Credit,
2008. Last accessed Feb. 2011. http://www.michigan.gov/documents/mshda/mshda_li_sr_2006_lihtc_allocations_185771_7.pdf.
9 Ibid. 10 Deng. “Comparing the Effects of Housing Vouchers and Low-income Housing Tax Credits”, 20-35. 11 U.S. Bureau of the Census, American Community Survey, 2007.Last accessed Mar 20.2011.
http://factfinder.census.gov. 12 I observe a similar pattern in the city of Flint, another Michigan city that has suffered from massive
industrial decline and abandonment. In Flint, LIHTC projects also accounted for about half of all new housing construction.
13 U.S. Department of Housing and Urban Development, National Low Income Housing Tax Credit (LIHTC) Database: Projects Placed in Service through 2007. Last updated Feb.15, 2010. http://www.huduser.org/Datasets/lihtc/tables9507.pdf.
14 Ibid. 15 Neil S. Mayer and Kenneth Temkin, Housing Partnership: The Work of Large-scale Regional
Nonprofits in Affordable Housing (Washington DC: The Urban Institute, 2007). Lan Deng, “The External Neighborhood Effects of Low-Income Housing Tax Credit Projects Built by Three Sectors,” Journal of Urban Affairs (2011). Forthcoming.
16 Community Legal Resources Detroit, Community Development Advocates of Detroit (CDAD) Survey Summary, 2008.
17 Nandini Bhaskara Rao and Margaret Dewar, Streamlining Acquisition of City-Owned Land for Affordable Housing Development: A Case Study from Detroit. (Urban and Regional Research Collaborative Working Paper Series, University of Michigan, 2004).
18 Lance Freeman, “Comment on Kirk McClure’s ‘The Low-Income Housing Tax Credit Program Goes Mainstream and Moves to the Suburbs’,” Housing Policy Debate 17, no.3 (2006), 447-459.
19 According to this developer, IRS requires all LIHTC projects meet Uniform Physical Conditions Standards (UPCS) that are intended for multi-family projects, rather than the Housing Quality Standards (HQS) that are used for single-family housing. HQS is also the standard used for city inspections and Section 8 inspections. Since he often used the LIHTC to renovate Section 8 properties, the developer had to

38
pay for and accommodate three inspections, which cost him more than the tax credit benefits and discouraged him from continuous participation in the LIHTC program.
20 U.S. Bureau of the Census, Census 2000. Summary File 3: Sample Data. Last Accessed May 1, 2010. http://factfinder.census.gov.
21 Interview with Dennis Quinn, Senior Vice President of Great Lake Capital Fund, July 2007. 22 Schill and Wachter, “Principles To Guide Housing Policy,” 5-19. 23 Michael H., Schill et al., “Revitalizing Inner-City Neighborhoods: New York City’s Ten-Year Plan,”
Housing Policy Debate 13, no 3 (2002): 529-566. Ingrid Gould Ellen et al., “Building Homes, Reviving Neighborhoods: Spillovers from Subsidized Construction of Owner-occupied Housing in New York City,” Journal of Housing Research 12, no. 2 (2002): 185-216. Amy Ellen Schwartz et al., “The External Effects of Place-based Subsidized Housing,” Regional Science and Urban Economics 36(2006): 679-707.
24 Sean Zielenbach, “Assessing Economic Change in HOPE VI Neighborhoods,” Housing Policy Debate 14, no.4 (2003): 621-655. Sean Zielenbach, “Catalyzing Community Development: HOPE VI and Neighborhood Revitalization,” Journal of Affordable Housing and Community Development Law 13, no.2 (2003): 40-80. Sean Zielenbach and Richard Voith, “HOPE VI and Neighborhood Economic Development: The Importance of Local Market Dynamics,” Cityscape: A Journal of Policy Development and Research 12, no.1 (2010): 99-131.
25 Ibid. 26 Michael H. Schill and Susan M. Wachter, “The Spatial Bias of Federal Housing Law and Policy:
Concentrated Poverty in Urban America,” University of Pennsylvania Law Review 143 (1995): 1285-1342. George Galster, Peter Tatian, and Robin Smith, “The Impact of Neighbors Who Use Section 8 Certificates on Property Value,” Housing Policy Debate 10, no. 4 (1999): 879-917.
27 When I conducted this analysis, only the 1990 and 2000 censuses had data available at the census tract or census block group level. So I had to limit the study to the LIHTC projects built by 1999. However, since December 2010, the American Community Survey has released data for these small geographic areas, which would allow me to examine all the LIHTC projects built in Detroit in future research.
28 Note that the cluster analysis was conducted using the 1990 census data. A comparison of 1990 and 2000 census data shows that some of the white neighborhoods continued to lose their white population and became predominantly black by the 2000 census.
29 June Manning Thomas, Redevelopment and Race: Planning a Finer City in Postwar Detroit (Baltimore: The Johns Hopkins University Press, 1997).
30 Joe Darden et al., “Chapter 5: City Redevelopment Policies,” in Detroit: Race and Uneven Development, ed. Joe Darden et al. (Philadelphia: Temple University Press, 1987), 151-200.
31 Ibid. 32 Thomas. Redevelopment and Race. 33 Ibid. 34 Joe Darden et al. “Chapter 5: City Redevelopment Policies,” 151-200. 35 The citizen district council (CDC) in Jefferson-Chalmers still exists today and has been very active in
promoting the area’s redevelopment. 36 Thomas. Redevelopment and Race. 37 Joe Darden et al. “Chapter 5: City Redevelopment Policies,” 151-200. 38 Christopher Walker, “Nonprofit Housing Development: Status, Trends, and Prospects” Housing
Policy Debate 4, no.3 (1993): 369- 414.Rachel Bratt, “Nonprofit and For-Profit Developers of Subsidized

39
Rental Housing: Comparative Attributes and Collaborative Opportunities,” Housing Policy Debate 19, no.2 (2008): 323-365.
39 Specifically, a Z score for indicator A is calculated as follows:
(Change in indicator A experienced by the LIHTC neighborhood – Mean Changes in indicator A experienced by the comparison group)/ (Standard Deviation of the changes in indicator A experienced by the comparison group).
40 For poverty rate, a negative Z score indicates positive change since it reflects a larger decline in poverty rate. For the other three indicators, a positive Z score reflects positive change. I thus take the opposite value of the Z score for poverty rate and add it to the Z scores for the other three indicators. Dividing the sum by four, I get an average Z score per indicator in each LIHTC neighborhood. The higher the Z score is, the more economic improvement an LIHTC neighborhood had.
41I was unable to identify neighborhood change types for five out of the 34 census block groups, either due to lack of census data on some indicators or due to lack of a comparison group in the same zip code area.
42 The Rivertown area, located to the south of Elmwood Park along Detroit river, does not have as many concentration of the LIHTC projects as the three places discussed before, but it has also been at the center of the city’s other redevelopment efforts.
43 Maureen McDonald, “Victoria Park Sparks Growth in City's Once Blighted Areas,” Detroit News, February 12, 2002. Last accessed September 10, 2010, http://www.detnews.com/2002/detroit/0212/24/s04-42402.htm.
44 Brent D. Ryan, “Morphological Change through Residential Redevelopment: Detroit, 1951-2000,” Urban Morphology 10, no.1 (2006): 5-22.
45 In general, neighborhoods in Jefferson-Chalmers area experienced better socioeconomic improvement than many other parts of the city, thanks to the continuous redevelopment efforts of the city government and the active participation of local citizen groups.
46 Joe Darden et al. “Chapter 5: City Redevelopment Policies,” 151-200. 47 More LIHTC projects have been built in some of these neighborhoods since 2000. Since the
American Community Survey has released neighborhood-level data collected from 2005 to 2009, future research will be able to examine whether the increased concentration of these projects has made a difference in these neighborhoods.