building an accountability system
TRANSCRIPT

Building an Accountability System
NYS
Reg
ents

Key Questions for States
• What to Measure?
-- to promote meaningful learning
-- to promote greater equity
• How to Measure?
• How to Use the Data?
• How to Support Improvement?

A Theory of Action Aimed at Continuous Improvement
3

The Accountability and Continuous Improvement system will:
1. Articulate the state’s expectations for districts & schools
2. Foster quality and equity;
3. Provide useful information that helps parents, districts, schools,
and policymakers make important decisions;
4. Build capacity and increase support for districts and schools.
5. Encourage continuous improvement focused on student-level
outcomes, using multiple measures for state and local priorities;
and
6. Promote system-wide integration and innovation.
1/10/2017
4
Theory of Action

Performance
Equity
Improvement

6
WHAT TO MEASURE?
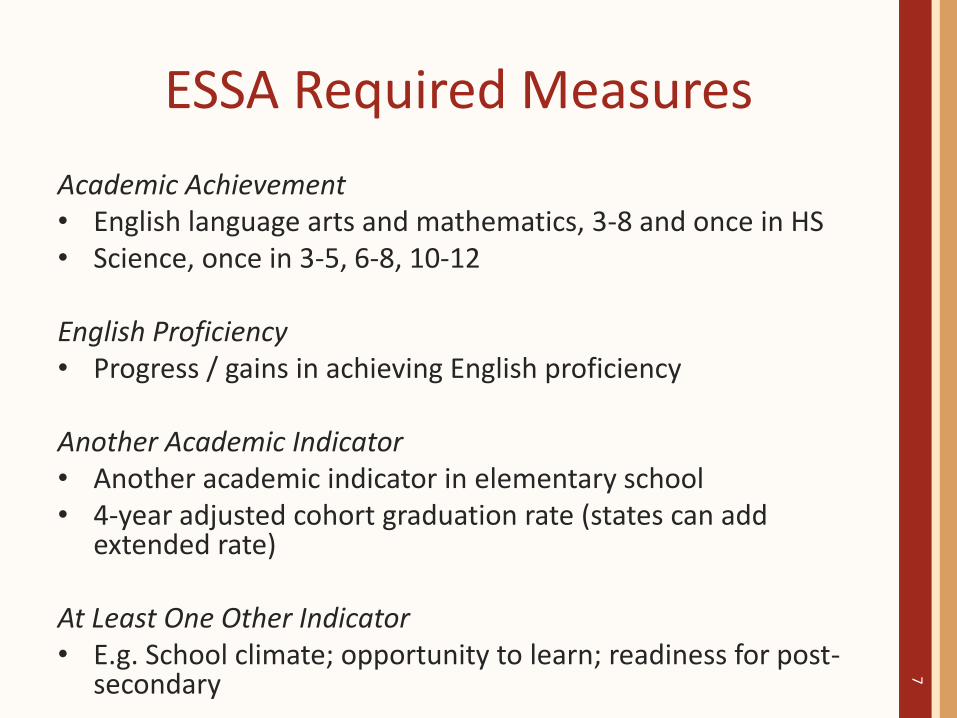
ESSA Required Measures
Academic Achievement • English language arts and mathematics, 3-8 and once in HS• Science, once in 3-5, 6-8, 10-12
English Proficiency• Progress / gains in achieving English proficiency
Another Academic Indicator• Another academic indicator in elementary school• 4-year adjusted cohort graduation rate (states can add
extended rate)
At Least One Other Indicator• E.g. School climate; opportunity to learn; readiness for post-
secondary
7

Federal Accountability Indicators Must:
• Be able to be disaggregated by student subgroup*
*ESSA Sec. 1111(c)(4)(B)(v)(II)(IV) suggests “educator engagement” as a possible measure for the “5th
Indicator,” which seems to be a contradiction. Additional clarification will be needed.
Student surveys about school climate Teacher surveys about school climate
Student enrollment or completion of advanced coursework
School-level course offerings
Chronic absenteeism Average daily attendance (tends to be around 90% for all schools)
Be able to meaningfully differentiate among schools

9ACADEMIC OUTCOMES
Achievement on Assessments
Standardized test results, reported in terms of status and growth for individual students and/or student cohorts
Performance assessment results from common state tasks
• Progress toward English language proficiency / EL reclassification rates Students meeting college standard on AP/IB or other college readiness tests
or dual credit college coursework
Graduation / School Progress
4-, 5-, and/or 6-year adjusted cohort graduation rates
% of 8th graders who are ready for HS (grades, attendance, suspensions)
Promotion rates / Dropout rates
Career and College Readiness
Students completing college preparatory coursework, approved CTE sequence, or both
Students meeting standard on graduation portfolios, or industry-approved certificates, licenses, or badges recognized by post-secondary institutions and businesses

10
OPPORTUNITIES TO LEARN
Curriculum Access
Access to a full curriculum, including science, history, and the arts, as well as reading and math
Availability of and participation in rigorous courses (e.g. college preparatory, Advanced placement), programs, etc.
Availability of standards-based curriculum materials, technology resources
Access to Resources
Ratios of students, counselors, and specialists to students
Teacher qualifications
Safe, adequate facilities
School Climate
Evidence from student and staff surveys about school offerings, instruction, supports, trust, belonging
Teachers’ Opportunities to Learn
Access to and participation in professional development

11
ENGAGEMENT
Student Participation
Attendance / chronic absenteeism
Suspensions / expulsion rates
Student perceptions of belonging, safety, engagement, school climate on student surveys
Social-emotional learning
Student attitudes towards learning (academic mindset)
Indicators of social -emotional skills (from assessments)
Indicators of social-emotional supports (from surveys)
Parent / Community Engagement
Indicators of engagement, school responsiveness from parent surveys
Teacher Engagement
Indicators of participation, engagement from teacher surveys


• Relevance: Measures what matters based on research
• Transparency: Supports public understanding
• Usefulness: Incentivizes productive behaviors
• Solution-Oriented: Offers diagnostics; informs change
• Accountability: Guides support based on what students are getting as well as how they are doing
13
Criteria for Including Indicators

14
Different Types of Indicators
E.G. Science Assessment resultsSchool Climate IndicatorsTeacher QualificationsSchool Facilities Quality
Access to a full curriculum
E.G. ELA / Math AchievementEnglish proficiency gainsGraduation ratesCCR IndicatorChronic absenteeismSuspension rates
Other locally designed indicators used to track progress on local initiatives forLCAP
E.G. Teacher, Parent, Student Surveys: Opportunities to LearnSocial-emotional supportsPerformance assessments / Diagnostic assessment toolsParent involvement measures

Tiers of Indicators
State-required, Used for Federal
Accountability
Measures used for monitoring and identifying schools for intervention as required by ESSA. Data must meet ESSA’s requirements: comparable, differentiates among schools, and reportable by student subgroup
State-reportedMeasures available in a comparable way across districts and schools to inform ongoing evaluation and continuous improvement processes.
State-supported
Tools and measures provided by the state that districts or schools may choose to use to measure and improve teaching and learning.
Locally Developed
Indicators schools and districts may adopt for their own purposes to guide their monitoring and improvement efforts.
15
Source: Adapted from Preparing all students for college, career, life, and leadership in the 21st Century: Superintendent’s Advisory Task Force
on Accountability and Continuous Improvement. (2016). Sacramento: California Department of Education.

16
HOW TO MEASURE?

Key Issues in Use of Assessment Measures
• Emphasize progress for all students
• Focus on gains in scale scores across the entire continuum of achievement (not just hitting a “proficiency” benchmark)
-- for ELA and math tests
-- for EL assessments
• Avoid “Catch 22” for English learner group by including reclassified students for 4 years
• Consider measuring status and growth
• Consider combining some indicators into an index where they measure related constructs 1
7

Graduation Rates and Growth1
8
-6%
-4%
-2%
0%
2%
4%
6%
8%
10%
12%
14%
16%
60 65 70 75 80 85 90 95 100
Gro
wth
inG
rad
uat
ion
Rat
e
Graduation Rate
Big Tree
School District

Looking at Performance and Improvement Together (Career /
College Index)

California Dashboard2
0

College & Career Readiness IndicatorsEmphasize learning outcomes that enhance equity and access
• % of students finishing college prep sequence (California A-G sequence)
• % of students completing a career pathway (CA, CT, GA, KY, MD, MA, NV, NM, NC, SC, TX, VA, WA)
• % reaching college standard on AP / IB/ dual credit courses
• % of students receiving industry-recognized credentials (Kentucky, Virginia)
• % of students in approved work-based learning (South Carolina)

College and Career Indicator Standard ModelPoints are awarded based on a student’s highest
achievement on any one measure*.
WELL PREPARED
3 or More
AP Exams
Score 3 or
Higher
Future IndicatorsIndustry
Certificate
Career
Assessment
Scored “Ready” on both
ELA & Math EAP
ArticulatedCTE Pathway
& a-g
Does the student meet at least one measure above?If yes, the student is WELL PREPARED. If not, does the student meet any measures below?
PREPARED
1 or More
Articulated CTE Pathway Completed
2 AP
Exams
Score 3 or
Higher
Scored “Ready”
&“Conditional Rdy”
on EAP
CTE Pathway& a-g
Does the student meet at least one measure above?If yes, the student is PREPARED. If not, does the student meet any measures below?
APPROACHING PREPARED
1 or More Non- CTE Articulated Concentrator (2
CTE Pathway Courses in theCompleted same Pathway)
1 AP
ExamScore 3
Scored“Conditional Rdy”
on both ELA & Math EAP
Scored “Ready”&
“Not Ready”on EAP
a-g only
Does the student meet at least one measure above?If yes, the student is APPROACHING PREPARED. If not, the student is NOT PREPARED
NOT PREPARED
The Student Did Not Meet Any Measures Above.The Student is NOT YET PREPARED.
* Measure: Each measure identified in this conceptual model may bea college measure, a career measure, or a combination of both.
NOTE: Th e following measures will be added when available:
International Baccalaureate (IB)
Dual Enrollment
State Seal of Biliteracy
Golden State Seal Merit Diploma
IB
Diploma
IB exams/Dual credit
Indicators:
A-G (College prep courses)CTE sequenceAP / IB / Dual CreditCollege readiness exam (SBAC)----------------------------Possible additions:
State Seal of BiliteracyGolden State Merit DiplomaApproved performance assessments/ portfolios

23
HOW TO USE THE DATA?

Next big questions ahead….
• How will the measures be combined to identify schools eligible for support?
• How will the measures be weighted across categories?
• How will the manner of combining indicators impact improvement supports and strategies?

Different logics about how to help schools improve
Focus on identifying and fixing “low performers” and helping them to “measure up”
Goal = finding and improving bottom 5%
Focus on continuous improvement by allschools, belief that the “next level of work” is different in different schools
Goal = providing information for diagnosis and opportunities for focused improvement

Options
• Weighting indicators and combining into an index or single score for ranking schools
• Looking at indicators individually and using decision rules to determine when and where intervention is needed
• Combining both purposes by keeping the dashboard (rather than rankings) front and center, aside from identification each 3 years
26

60% 40%
A Multiple Measure Accountability System in CA
College/ Career Readiness

CORE’S Weighting System: Used for Identification / Dashboard Used for Reporting
28

Choose a District
Ashford School District
No: Indicator TargetPoints
Earned
Max
Points
%
Points
Earned
1a. ELA Performance Index – All Students 75 96.0 100 96.0
1b. ELA Performance Index – High Needs Students 75 83.7 100 83.7
1c. Math Performance Index – All Students 75 82.3 100 82.3
1d. Math Performance Index – High Needs Students 75 71.8 100 71.8
1e. Science Performance Index – All Students 75 72.2 100 72.2
1f. Science Performance Index – High Needs Students 75 62.8 100 62.8
4a. Chronic Absenteeism – All Students <=5% 46.3 50 92.6
4b. Chronic Absenteeism – High Needs Students <=5% 40.0 50 80.0
5 Preparation for CCR – % taking courses 75% 0.0 0 0.0
6 Preparation for CCR – % passing exams 75% 0.0 0 0.0
7 On-track to High School Graduation 94% 45.1 50 90.2
8 4-year Graduation All Students (2014 Cohort) 94% 0.0 0 0.0
9 6-year Graduation - High Needs Students (2012 Cohort) 94% 0.0 0 0.0
10 Postsecondary Entrance (Class of 2014) 75% 0.0 0 0.0
11 Physical Fitness (estimated part rate) and (fitness rate) 98.6% 47.9% 75% 31.9 50 63.8 87.6% #####
12 Arts Access 60% 0.0 0 0.0
Accountability Index 632.1 800 79.0
N/A
N/A
N/A
N/A
72.8%
Next Generation Accountability Report, 2014-15
72.0
Index/ Rate
62.8
61.7
53.9
54.2
47.1
6.8%
10.0%
N/A
N/A
84.8%
45.7%
State Avg
Index/Rate
67.9
56.7
59.3
47.8
56.5
45.9
10.6%
17.3%
66.1%
37.3%
85.6%
87.0%
77.6%
These statistics are the first results from Connecticut's Next Generation Accountability Model for districts and schools. For detailed information and resources about every indicator including the rationale for its inclusion, the methodology used as well as links to resources, research, and evidence-based strategies, please see the document titled Using Accountability Results to Guide Improvement.
This model is the direct result of an extensive consultation process over a two year period. The CSDE sought feedback from district and school leaders, Connecticut educators, state and national experts, CSDE staff, and many others. This model was outlined in Connecticut’s flexibility application to the U.S. Department of Education and formally approved by the USED in August 2015.

Type of Aggregation-Index- Average with Weights
Source: CCSSO Conference, Ryan Reyna and Andrew Rice presenters 6/8/16
School
Rea
din
g/EL
A
Mat
h
Scie
nce
Gra
d. R
ate
PLP
Clim
ate
Staf
fSa
tisf
acti
on
Ret
urn
on
In
vest
men
t
Ave
rage
Jones High School 58 65 61 98 72 64 76 15 63.6
Smith Academy High 35 37 36 76 79 56 39 29 48.4
Frakes Secondary School 24 29 31 59 21 75 35 26 37.5
Madson High School 86 80 85 43 54 96 80 82 75.8
Darwish Secondary High School 32 25 35 72 70 57 58 56 50.6
Icenogle High School 86 84 79 84 61 25 72 78 71.1
Palmquist Secondary School 95 89 82 94 35 68 92 89 80.5
Solina High School 31 26 36 35 63 95 47 16 43.6
Spencer Community School 65 63 70 61 49 64 63 73 63.5
Lindsay High School 23 27 25 57 67 43 50 64 44.5

Type of Aggregation-Index- Counts of Struggling Areas
Source: CCSSO Conference, Ryan Reyna and Andrew Rice presenters 6/8/16
School
Rea
din
g/EL
A
Mat
h
Scie
nce
Gra
d. R
ate
PLP
Clim
ate
Staf
fSa
tisf
acti
on
Ret
urn
on
In
vest
men
t
Co
un
ts
Jones High School 58 65 61 98 72 64 76 15 1
Smith Academy High 35 37 36 76 79 56 39 29 0
Frakes Secondary School 24 29 31 59 21 75 35 26 2
Madson High School 86 80 85 43 54 96 80 82 0
Darwish Secondary High School 32 25 35 72 70 57 58 56 1 (2)
Icenogle High School 86 84 79 84 61 25 72 78 1
Palmquist Secondary School 95 89 82 94 35 68 92 89 0
Solina High School 31 26 36 35 63 95 47 16 1 (2)
Spencer Community School 65 63 70 61 49 64 63 73 0
Lindsay High School 23 27 25 57 67 43 50 64 2 (4)

32
HOW TO SUPPORT IMPROVEMENT?

After identifying schools:
For schools that fall into one of the intervention categories (overall, equity gap, high school graduation), school districts must complete a comprehensive support and improvement plan that:
• is informed by the indicators and long-term goals from the state’s accountability system,
• includes evidence-based interventions,
• is responsive to a school-level needs assessment, &
• identifies resource inequities that will be addressed.
33

Using the Dashboard for Improvement
• School / District annual review in the context of planning and goal-setting
• Regional (e.g. BOCES) or state review to offer learning supports for networks, examine trends (locally and statewide), identify successes for documentation and emulation
• Identify districts / schools for needed intervention
-- Diagnostic review
-- Supports for strategic changes

School Quality Review / Diagnostic Tool for School and District Effectiveness
35

Support for Improvement
• Teams of expert educators trained to work with struggling schools
• School pairs and networks for learning
• Content collaboratives / subject matter projects
• Trained curriculum coaches
• Wraparound services, including extended learning after school and in summer
• School redesign initiatives based on research and best practices
36

1/1
0/2
01
7
37
Multiple Levels of SupportTier/level Type of Support
AllImprovement
and Shared
Learning for
All LEAs
The measures will help recognize success/identify the strengths of LEAs and
schools and therefore will serve as a means to identify which LEAs and schools
are well-positioned to share their successful practices with others through formal
and informal improvement efforts across schools and LEAs. State and County
Offices of Education will also develop tools and supports available to all LEAs
and schools (Planning supports, professional development, vetted best practices,
etc.)
FocusedImprovement
Support
State and County Offices of Education will use the selected accountability
measures to identify schools and LEAs in need of focused intervention, and the
areas in which improvement supports are needed, and help connect them to useful
supports and learning opportunities.
IntensiveImprovement
Support
State and County Offices of Education will use accountability measures to
identify LEAs and schools that need more comprehensive and intensive supports
to make large improvements in performance and/or growth. These measures will
not only help to identify where intensive supports are needed, but what other
similar LEAs might be best positioned to provide them in a partner relationship.

A Tale of Two (Hypothetical) States:

Example: Social-Emotional Learning
In Goodlanda:
SEL is elevated as a desired
outcome
PD trains teachers to foster SEL
Teachers work with students to develop SEL
skills
Achievement and
graduation rates go up
SEL is elevated as a desired
outcome
Teachers receive
insufficient training
Unsure how to foster SEL,
teachers and students game SEL self-reports
Nothing changes
The Moral: (1) Be sure that measures can “stand up” to the pressures of
accountability. (2) Consider bundling SEL measures with information on school
climate and teacher professional learning.
In Badlanda:
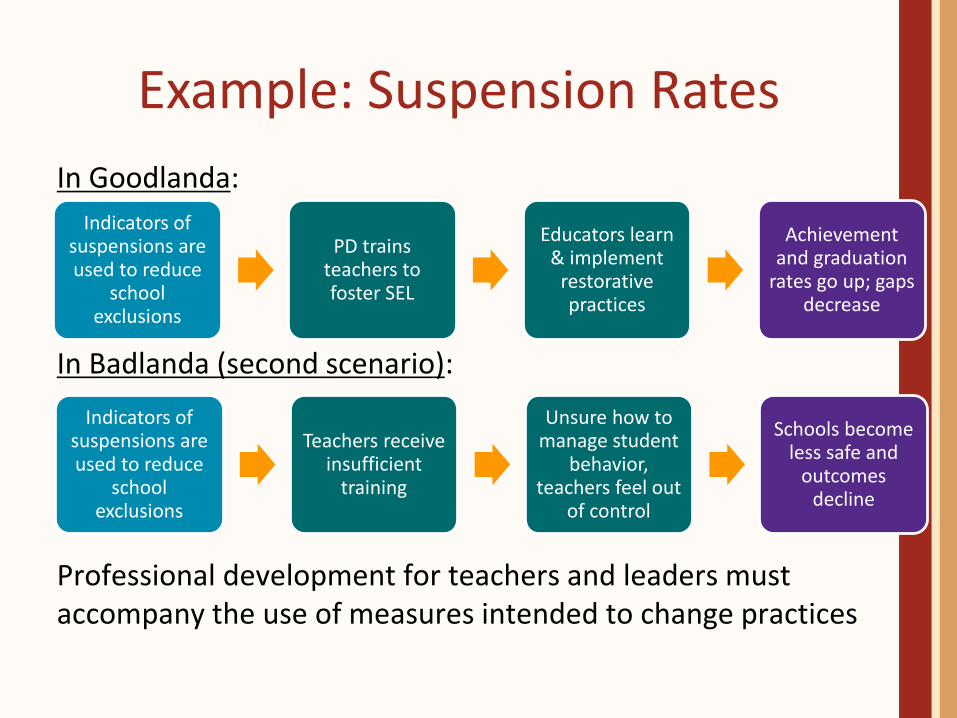
Example: Suspension Rates
In Goodlanda:
Indicators of suspensions are used to reduce
school exclusions
PD trains teachers to foster SEL
Educators learn & implement
restorative practices
Achievement and graduation
rates go up; gaps decrease
Indicators of suspensions are used to reduce
school exclusions
Teachers receive insufficient
training
Unsure how to manage student
behavior, teachers feel out
of control
Schools become less safe and
outcomes decline
Professional development for teachers and leaders must accompany the use of measures intended to change practices
In Badlanda (second scenario):

Example: Rigorous Coursework
In Goodlanda:
Schools incentivized to
increase enrollment and
completion for all subgroups
Schools develop strategies to
increase enrollment and
completion
More students of all subgroups take
and complete rigorous
coursework
College and career readiness increases
Schools incentivized to increase enrollment
for all subgroups
Schools increase enrollment by
watering-down curriculum
College and career readiness decreases
The Moral: (1) Monitor both course access and completion, and disaggregate
both by subgroup. (2) Consider bundling these measures with postsecondary indicators such as placement, enrollment, or completion of credit-bearing college coursework.
Schools incentivized to increase % of
students getting a 3+ on AP tests
Schools raise % passing by limiting access to advanced
coursework
Equity decreases
In Badlanda (second scenario):
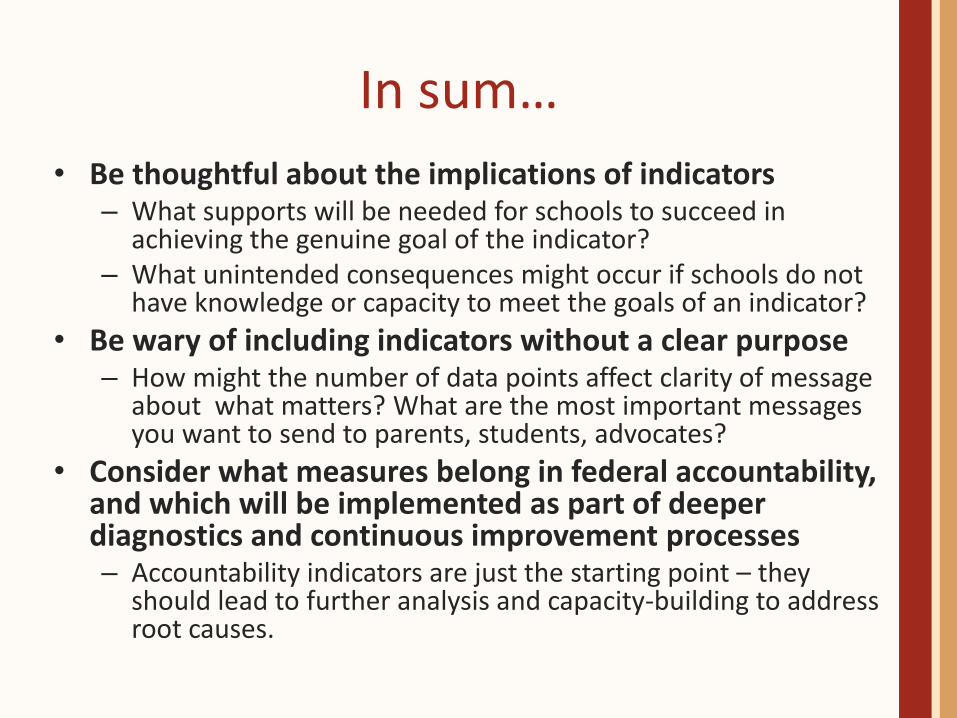
In sum…
• Be thoughtful about the implications of indicators– What supports will be needed for schools to succeed in
achieving the genuine goal of the indicator?– What unintended consequences might occur if schools do not
have knowledge or capacity to meet the goals of an indicator?
• Be wary of including indicators without a clear purpose– How might the number of data points affect clarity of message
about what matters? What are the most important messages you want to send to parents, students, advocates?
• Consider what measures belong in federal accountability, and which will be implemented as part of deeper diagnostics and continuous improvement processes– Accountability indicators are just the starting point – they
should lead to further analysis and capacity-building to address root causes.