building and fire code board of appeals staff report
TRANSCRIPT

,
City of Santa Barbara Community Development
Memorandum
ober 19, 2017
ding & Fire Code Board of Appeals
DATE: Oct
TO: Buil
FROM: Andrew Stuffier, Chief Building Official AJ.b
SUBJECT: Staff Report on Determining the Value of Permitted Construction
The estimated value of construction associated with a building permit effects the extent of mandatory compliance with other laws and regulations in the Santa Barbara Municipal Code and elsewhere. The following specific regulations, as well as others, rely of an accurate estimation of the proposed construction valuation in order to determine if mandatory compliance or fee payment is required:
• Under-grounding of utilities• Improvements to the accessible path of travel• School fees payment• Flood-proofing or building elevation above the base flood elevation• Smoke and CO Detector permanent installations, etc.
Consequently, determining the value of the construction that is permitted by the City must be as consistent and as rational as possible.
Since December 15, 2014, the City's Building & Safety Division has followed the policy direction memorialized in attachment 1 to this report. Today, the December 15, 2014 policy comes into play whenever City plan check staff feel that an artificially low construction valuation has been submitted. Staff recognized that this practice is subjective and could be improved. Attachment 2 to this report is the modified Construction Valuation Policy that provides a basis for determining that an unrealistic construction valuation has been submitted.
Attachments 3, 4 and 5 are examples of the building valuation tables for the cities of San Diego, Berkeley and Los Angeles as a reference.
Staff is requesting that this Board review, comment and give staff direction on the implementation of this modified policy before staff places the modified policy into effect.
Pagel of 1

City of Santa Barbara Community Development
Memorandum of Policy and Procedure
ber 15, 2014
g & Safety Policy File
Stuffier, Chief Building Official
nd Accurate Construction Valuation Estimates
ederal, State Local laws have relied on proposed construc
DATE: Decem
TO: Buildin
FROM: Andrew
SUBJECT: Valid a
For many decades, F tion valuation estimates as a means of prescribing a proportional value of other mandatory improvements to structures and property as part of the building permit process. Undergrounding of utility lines, accessibility improvements, and development standards in flood zones are examples of where valuation methodology is still employed.
The City building permit fees are based on average hours of service provided and not on the proposed construction valuation.
Three common construction valuation estimating systems currently in use are: • RSMeans (www.rsmeans.com )• Marshall & Swift (www.marshallswift.com )• Engineering News & Review (http://enr.construction.com/economics/current costs/)
Effective February 1, 2015, Building & Safety staff may require the project construction valuation to be verified by the project designer/architect via any of the above systems so that a valid and accurate construction valuation is obtained.

City of Santa Barbara Community Development
Memorandum of Policy and Procedure
� �er 19, 2017
ng & Safety Poli:?�
w Stuffier, Chief Building Official
and Accurate Construction Valuation Estimates
DATE: Octob
TO: Buildi
FROM: Andre
SUBJECT: Valid
For many decades, Federal, State Local laws have relied on proposed construction valuation estimates as a means of prescribing a proportional value of other mandatory improvements to structures and property as part of the building permit process. Undergrounding of utility lines, accessibility improvements, and development standards in flood zones are examples of where valuation methodology is still employed.
The City building permit fees are based on average hours of service provided and not on the proposed construction valuation.
Three common construction valuation estimating systems currently in use in the United States are:
• RSMeans (www.rsmeans.com )• Marshall & Swift (www.marshallswift.com )• Engineering News & Review (http://enr.construction.com/economics/current costs/)
When a construction valuation is submitted that is under the most recent International Code Council (ICC) Building Valuation Data estimate, Building & Safety staff will require the project construction valuation to be either:
1. Set at the International Code Council (ICC) Building Valuation Data estimate, or2. Verified by the applicant via any of the estimating systems listed above.
The ICC Building Valuation Data for new buildings shall be adjusted as follows for the following new or alterations to existing buildings:
1. Foundation Replacement = 10%2. Tenant Improvements = 30%3. Structural Frame Only = 50%4. Shell Building= 70%
This policy has been heard at a public meeting and approved by the City Building & Fire Code Board of Appeals prior to implementation.

•· Square Foot Construction Costs b, c
Group (2015 International Building Code) IA IB IIA IIB IIIA 1118 IV VA VB
A-1 Assembly, theaters, with stage 229.26 221.37 216.01 207.16 194.94 189.29 200.61 178.00 171.48
A-1 Assembly, theaters, without stage 210.11 202.22 196.86 188.01 175.94 170.29 181.46 158.99 152.48
A-2 Assembly, nightclubs 179.28 174.08 169.68 162.81 153.48 149.24 157.08 138.97 134.26
A-2 Assembly, restaurants, bars, banquet halls 178.28 173.08 167.68 161.81 151.48 148.24 156.08 136.97 133.26
A-3 Assembly, churches 212.12 204.22 198.87 190.01 178.14 172.49 183.47 161.20 154.68
A-3 Assembly, general, community halls, libraries, 176.94 169.04 162.69 154.83 141.96 137.30 148.28 125.01 119.50 museums
A-4 Assembly, arenas 209.11 201.22 194.86 187.01 173.94 169.29 180.46 156.99 151.48
8 Business 182.98 176.21 170.40 161.91 147.69 142.14 155.55 129.66 123.97
E Educational 194.27 187.38 182.00 173.88 162.37 154.12 167.88 141.89 137.57
F-1 Factory and industrial, moderate hazard 109.64 104.60 98.57 94.77 85.03 81.17 90.78 71.30 66.75
F-2 Factory and industrial, low hazard 108.64 103.60 98.57 93.77 85.03 80.17 89.78 71.30 65.75
H-1 High Hazard, explosives 102.63 97.58 92.55 87.75 79.22 74.36 83.76 65.48 N.P.
H234 High Hazard 102.63 97.58 92.55 87.75 79.22 74.36 83.76 65.48 59.94
H-5 HPM 182.98 176.21 170.40 161.91 147.69 142.14 155.55 129.66 123.97
1-1 Institutional, supervised environment 183.95 177.72 172.57 165.30 152.29 148.15 165.39 136.43 132.19
1-2 Institutional, hospitals 307.93 301.16 295.35 286.86 271.68 N.P. 280.50 253.65 N.P.
1-2 Institutional, nursing homes 213.36 206.59 200.78 192.29 179.07 N.P. 185.93 161.04 N.P.
1-3 Institutional, restrained 208.19 201.43 195.62 187.12 174.39 167.85 180.76 156.37 148.68
1-4 Institutional, day care facilities 183.95 177.72 172.57 165.30 152.29 148.15 165.39 136.43 132.19
M Mercantile 133.57 128.37 122.97 117.10 107.27 104.03 111. 38 92.75 89.05
R-1 Residential, hotels 185.63 179.39 174.24 166.97 153.72 149.58 167.06 137.86 133.61
R-2 Residential, multiple family 155.74 149.50 144.35 137.09 124.57 120.43 137.17 108.71 104.47
R-3 Residential, one- and two-family d 145.23 141.28 137.64 134.18 129.27 125.87 131.94 120.96 113.85
R-4 Residential, care/assisted living facilities 183.95 177.72 172.57 165.30 152.29 148.15 165.39 136.43 132.19
S-1 Storage, moderate hazard 101.63 96.58 90.55 86.75 77.22 73.36 82.76 63.48 58.94
57.94 S-2 Storage, low hazard 100.63 95.58 90.55 85.75 77.22 72.36 81.76 63.48
74.24 69.76 66.20 59.84 55.88 63.23 47.31 45.09 U Utility, miscellaneous 78.63
a. Private Garages use Utility, miscellaneous b. For shell only buildings deduct 20 percentc. N.P. = not permitted d. Unfinished basements (Group R-3) = $21.00 per sq. ft.

LAD8S Valuation Table August 17, 2015
Index# Description Construction/Occupancy Type $/sf. 1 Air Condition Central - Resid 9 2 Air Condition Central - Comm 10 3 Air Condition Central - Tract 9 4 Aoartment - Sr. Citizen I 144 5 Aoartment - Sr. Citizen Ill 123 6 Apartment - Sr. Citizen v 118 7 Apartment - Townhouse Ill 142 8 Apartment - Townhouse v 139 9 Aoartment House II 162
9a Apartment House I 10-stories and less 162 9b Apartment House I 11 to 16-stories 230 9c Apartment House I 17 to 24-stories 315 9d Aoartment House I 25-stories and more 380 11 Apartment House V > 3 floors 127 12 Apartment House V < = 3 floors 99 13 Auditorium - Averaqe I or II 271 14 Auditorium - Averaqe Ill 211 15 Auditorium - Averaqe V or 11-8 202 16 Auditorium - Good I or II 367 17 Audtiorium - Good Ill 275 18 Auto - Car Wash Self Servel Stall ) 60707 19 Auto - Car Wash Automatic (Stall) 162578 20 Auto - Car Wash Full Service (Stall) 206399 21 Auto - Dealership - Averaqe Ill 112 22 Auto - Dealership - Averaqe V or 11-B 105 23 Auto - Dealership - Good Ill 179 24 Auto - Dealership - Good V or 11-8 167 25 Auto - Gas Station I, II or Ill 115 26 Auto - Gas Station V or 11-8 105 27 Auto - Gas Station Metal Canopy 87 28 Auto - Repair V or 11-B 51 29 Auto - Repair - Averaqe Ill 75 30 Auto - Repair - Good Ill 104 31 Awning Metal 18 32 Awnino Fabric 23 33 Bank - Average I or II 218 34 Bank - Average V or 11-B 185 35 Bank - Average Ill 196 36 Bank - Excellent V or 11-B 274 37 Bank - Excellent Ill 228 38 Canopy Metal 20 39 Ceiling Acoustic 10 40 Church - Average I or II 222 41 Church - Average V or 11-B 158 42 Church - Average Ill 177 43 Church - Good I or II 315 44 Church - Good V or 11-B 225 45 Church - Good Ill 234 46 Coach Commercial 30 47 Demolition Structural Steel 6
LADBS Building Permit Valuation Table (rev. 07/10/17) Page 1 of 5 www.LADBS.org

LADBS Valuation Table August 17, 2015
48 Demolition Non-Struc Partition 13 49 Demolition Structural Concrete 7 50 Demolition Structural Masonry 4 51 Demolition Structural Wood 3 52 Dwellinq - Averaqe Ill - Standard 111 53 Dwellinq - Averaqe V - Standard 101 54 Dwelling - Good Ill - Standard 154 55 Dwelling - Good V- Pre Fab 75 56 Dwelling - Good V - Standard 137 57 Dwellinq - Exceptional Home Vor Il l 184 58 Dwelling - Tract V (> 4000 SF) 130 59 Dwellinq - Tract V {> 2000 SF) 111 60 Dwellinq - Tract V {< 2000 SF) 95 61 Equip - Existinq Bank ATM Machine (Unit) 18763 62 Equip - Existing Beautv Shop Chair with lavatory (Unit) 6228 63 Equip - Existing Bldq - Averaae Firepalce - masonry (Openinq) 3013 64 Equip - Existinq Bldq - Averaae Fireplace - pre-fab (Openinq) 1143 65 Equip - Existinq Bldg - Good Fireplace - masonry (Opening) 3427 66 Equip - Existinq Bldq - Good Fireplace - pre-fab (Ooenina) 1512 67 Equip - Existinq Dental Office Dental Chair/Ace (Unit) 5954 68 Equip - Existing Dental Office X-Ray machine (Unit) 8440 69 Equip - Existing Laundry Fixtures (Unit) 13317 70 Equip - Existinq Laundry Coin-oper-Dry Cleaner (Unit) 29904 71 Equip - Existinq Laundry Washer (Unit) 32616 72 Equip - Existinq Laundry Orv Cleaner (Unit) 45734 73 Equip - Existing Laundry Dryer (Unit) 6585 74 Equip - Existinq Market Fixture 271 75 Equip - Existinq Medical Office Treatment Table (Unit) 2072 76 Equip - Existing Repair Garage Accessories (Bay) 6256 77 Equip - Existinq Repair Garaae Spray Booth (Unit) 31962 78 Equip - Existinq Repair Garaqe Frame AliQner (Unit) 29855 79 Equip - Existinq Restaurant Kitchen Accessoreis (Unit) 31341 80 Fireproofing Re-spray 2 81 Grade Beam Concrete (Cutt) 12 82 Greenhouse Glass - Resid 39 83 Greenhouse Glass - Solar 73 84 Hospital - Averaqe I or 11 General 230 85 Hospital I or II Convalescent 189 86 Hospital - Averaqe Ill General 200 87 Hospital - Averaqe Ill Convalescent 155 88 Hospital V or 11-B - General 198 89 Hospital - Averaqe V or 11-B Convalescent 154 90 Hospital - Good I of 11 General 280 91 Hospital - Good Ill General 258 92 Hospital - Good 111 Convalescent 201 93 Hospital - Good V or 11-B Convalescent 190 84 Hotel or Motel - Averaoe I or II 147 95 Hotel or Motel - Average Il l 130 96 Hotel or Motel - Average V > 3 floors 110 97 Hotel or Motel - Averaqe V < = 3 floors 83 98 Hotel or Motel - Good II 185
98a Hotel or Motel - Good I 10-stories and less 185
LADBS Building Permit Valuation Table (rev. 07/10/17) Page 2 of 5 www.LADBS.org

LADBS Valuation Table August 17, 2015
98b Hotel or Motel - Good I 11 to 16-stories 280 98c Hotel or Motel - Good I 17 to 24-stories 355 98d Hotel or Motel - Good I 25-stories and more 400
99 Hotel or Motel - Good Il l 153 100 Hotel or Motel - Good v 106 101 Library I or II 171 102 Library - Average Ill 136 103 Library - Average V or 11-8 130 104 Library - Good Ill 180 105 Librarv - Good V or 11-8 165 106 Manufacturinq V or 11-8 83 107 Manufacturinq - Average I or II 102 108 Manufacturing - Averaqe Ill 89 109 Manufacturing - Good I, II or Il l 108 110 Office - Medical - Good I or II 260
110a Office - Medical - Excellent I or II 330 111 Office - Medical I or II (Tilt-uo) 207 112 Office - Medical Ill 162 113 Office - Medical Ill (Tilt-up) 234 114 Office - Medical V or 11-8 163 115 Office - Average I 10-stories and less 178
115a Office - Average II 178 116 Office - Average V or 11-8 136 117 Office - Average Ill 144
118 Office - Good II 219 118a Office - Good I 10-stories and less 219 118b Office - Good I 11 to 16-stories 295 118c Office - Good I 17 to 24-stories 350 118d Office - Good I 25-stories.and more 385
119 Office - Good V or 11-8 176 120 Office - Good Ill 189 121 Basement Garaqe II less than 3 basement levels 90
121a Basement Garage I less than 3 basement levels 90 121b Basement Garage I more than 2 basement levels 120
122 Parkino Garage I or II - Prkq Struct 60 123 Parkino Garage Ill - Prkq Struct 55 124 Parking Garage V - Prkg Struct 55 125 Parkino Lot Pave/strioe 6 126 Partition Placement 31 127 Patio Cover 16 128 Patio Enclosure 22 129 Pile Concrete (Cuft)) 13 130 Pole 1 O" Round pole (Lnft) 118 131 Pool Concrete 43 132 Re-roofing Built-up 2 Ply 1 133 Re-roofino Compo Shinole 2 134 Re-roofinq Fiber Glass 2 135 Re-roofing Concrete 6 136 Re-roofina Metal 10 137 Re-roofina Clay 11 138 Re-roofina Compo Roll 1
LADBS Building Permit Valuation Table (rev. 07/10/17) Page 3 of 5 www.LADBS.org

LADBS Valuation Table August 17, 2015
139 Re-rooftnq Built-up 3 Plv 2 140 Relocation 2 or more stories bldg 41 141 Relocation Multi-pieces move 41 142 Relocation Attached qaraae 36 143 Relocation Detached qaraqe 41 144 Relocation Sinqle piece move 41 145 Restaurant - Average Ill 145 146 Restaurant - Average V or 11-B 130 147 Restaurant - Good Ill 225 148 Restaurant - Good V or 11-B 202 149 Retail - Average I or II General 104 150 Retail - Average I or II Mall 109 151 Retail - Average I or II Dept. Store 126 152 Retail - Average Ill Market 110 153 Retail - Average V or 11-B Market 95 154 Retail - Average 111 Dept. Store 105 155 Retail - Averaqe Ill General 95 156 Retail - Averaqe V or 11-B General 90
157 Retail - Good I or II General 138
157a Retail - Excellent I or II General 400 158 Retail - Good V or 11-B Market 108 159 Retail - Good Ill Market 109 160 Retail - Good Ill General 119 161 Retail - Good V or 11-B General 118 162 Retail - Good I or II Mall 136 163 Retail - Good 111 Dept. Store 135 164 Retail - Good I or 11 Dept. Store 155 165 Retainina Wall & Fence Concrete (Sqft of wall) 14 166 Retainina Wall & Fence Masonry (Sqft of wall) 10 167 School I or II 219 168 School - Averaqe Ill 142 169 School - Averaqe V or 11-B 139 170 School - Good Ill 176 171 School - Good V or 11-B 170 172 Shorina Excavation Depth 10-15ft 32 173 Shorina Excavation Depth 56-65ft 69 174 Shoring Excavation Depth 16-20ft 36 175 Shorina Excavation Depth 21-25ft 48 176 Shorinq Excavation Depth 26-35ft 54 177 Shorinq Excavation Depth 46-55ft 63 178 Shorinq Excavation Depth 36-45ft 56
179 Sions Ilium sinale Face <20 SF 142 180 Si ans Non-lllum Sinqle Face 50-100sf 41
181 Sians Non-lllum Sinqle Face 20-50sf 46 182 Signs Non-Ilium Double Face>1 OOsf 46
183 Sians Non-Ilium Double Face 50-1 OOs 52
184 Sians Non-Ilium Double Face 20-50sf 59 185 Sians Non-Ilium Double Face<20sf 67 186 Sians Ilium Double Face > 1 OOsf 99
187 Sians Ilium Double Face 50-100sf 126 188 Sians Ilium Double Face 20-50sf 145
189 Signs Ilium Double Face <20sf 201
LAD BS Building Permit Valuation Table (rev. 07/10/17) Page 4 of 5 www.LADBS.org

LADBS Valuation Table August 17, 2015
190 Siqns Plain Neon > 1 OOsf 50
191 Sions Plain Neon 50-1 OOsf 58
192 Signs Plain Neon 20-50sf 65
193 Signs Plain Neon <20sf 76
194 Siqns Ornate Neon >100sf 72
195 Siqns Ornate Neon 50-1 OOsf 84
196 Siqns Ornate Neon 20-50 sf 97
197 Siqns Ornate Neon < 20sf 114
198 Signs Non-Ilium Single Face >100sf 36
199 Signs Ilium Single Face 20-50sf 112
200 Siqns Ilium Single Face 50-100sf 91
201 Siqns Ilium sinqle Face >100sf 72
202 Siqns Non-Ilium sinqle Face <20sf 52
203 Spa Attached (Unit) 10678
204 Spa Detached (Unit) 18840
205 Sprinkler Wet or Dry 3
206 Tennis Court Concrete Slab 6
207 Theater V or 11-B 168
208 Theater - Averaqe I or II 195
209 Theater - Averaqe Ill 176
210 Theater - Good I or II 250
211 Theater - Good Ill 249
212 Warehouse I or II 72
213 Warehouse V or 11-B 60
214 Warehouse Ill 60
215 Tl - Restaurant Various 60
216 Tl - Office - Good Various 65
216a Tl - Office - Excellent Various 85
217 Tl - Medical Office - Good Various 85
217a Tl - Medical Office - Excellent Various 120
218 Tl - Retail - Averaae Various 55
218a Tl - Retail - Good Various 90
218b Tl - Retail - Excellent Various 180
LADBS Building Permit Valuation Table (rev. 07/10/17) Page 5 of 5 www.LADBS.org

so) DEVELOPMENT SERVICES INFORMATION
BULLETIN
Building Valuation Schedule 101 OCTOBER 2016 1222 FIRST AVENUE MS 401 SAN DIEGO CA 92101-4101
This Information Bulletin provides construction valuation amounts used to determine the building valuation for new construction, miscellaneous building projects as well as alterations and additions to existing structures.
Please refer to Information Bulletin 501 for applicable permit and permit application fees. The following Building Valuation Data has been provided by the International Code Council (ICC) dated June 2016 to determine the building valuation and provides average construction costs on a per square foot basis.
Occupancy Group IA IB IIA IIB IIIA IIIB IV VA VB A-1 Assembly, theaters, 226.92 219.10 213.80 205.04 192.95 187.36 198.56 176.18 169.73 with staee A-1 Assembly, theaters, 207.97 200.15 194.85 186.09 174.15 168.55 179.61 157.38 150.92 without stae:e A-2 Assembly, nightclubs 177.89 172.85 168.07 161.49 151.98 147.78 155.80 137.68 132.99 A-2 Assembly, restaurants, 176.89 171.85 166.07 160.49 149.98 146.78 154.80 135.68 131.99 bars. banauet halls A-3 Assembly, churches 209.94 202.13 196.83 188.07 176.32 170.72 181.59 159.54 153.09 A-3 Assembly, general,community halls, libraries, 175.12 167.31 161.01 153.25 140.50 135.90 146.77 123.72 118.27 museums A-4 Assembly, arenas 206.97 199.15 192.85 185 09 172.15 167.55 178.61 155.38 149.92
B Business 181.12 174.43 168.67 160.26 146.18 140.70 153.97 128.34 122.72
E Educational 192.29 185.47 180.15 172.12 160.72 152.55 166.18 140.46 136.18 F-1 Factory and industrial, 108.98 103.99 97.83 94.17 84.37 80.56 90.16 69.50 65.44 moderate hazard F-2 Factory and industrial, 107.98 102.99 97.83 93.17 84.37 79.56 89.16 69.50 64.44 low hazard H-1 High Hazard, 102.01 97.02 91.86 87.20 78.60 73.79 83.19 63.73 N.P. exolosives H-2, H-3, H-4 High Hazard 102.01 97.02 91.86 87.20 78.60 73.79 83.19 63.73 58.67
H-5 HPM 181.12 174.43 168.67 160.26 146.18 140.70 153.97 128.34 122.72 1-2 Institutional, nursing 211.20 204.51 198.75 190.34 177.26 N P. 184.05 159.42 N.P. homes 1-3 Institutional, 206.08 199.38 193.63 185.22 172.62 166.14 178.93 154.78 147.16 restrained 1-4 Institutional, day care 180.72 174.14 169.28 161.12 149.06 145.04 161.12 133.69 129.43 facilities M Mercantile 132.61 127.57 121. 79 116.21 106.35 103.15 110.52 92.05 88.36
R-1 Residential, hotels 182.28 175.70 170.83 162.68 150.87 146.84 162.68 135.49 131.23 R-2 Residential, multiple 152.86 146.27 141.41 133.25 122.04 118.01 133.25 106.66 102.41 familv R-3 Residential, one- and 119.73 112.65 ....
132.83 127.95 124.61 130.57 �.��-;,.,
143.93 139.97 136.51 R-4 Residential, care/ 180.72 174.14 169.28 161.12 149.06 145.04 161.12 133.69 129.43 assisted livine: facilities S-1 Storage, moderate 101.01 96.02 89.86 86.20 76.60 72.79 82.19 61.73 57.67 hazard S-2 Storage, low hazard 100.01 95.02 89.86 85.20 76.60 71.79 81.19 61.73 56.67
U Utility, miscellaneous 77.82 73.48 69.04 65.52 59.23 55.31 62.58 46.83 44.63
a. Partial building permits - use following % of-entire b. For shell only buildings use 80 percent of entire proj-project valuation: ect valuation. 1. Foundation only permits use 10% c. Private Garages use Utility, miscellaneous. 2. Structural frame only permits use 50% d. Unfinished basements, use $15.00 per sq ft.3. Build-out permits (no Tl's) use 20% N.P. Means not permitted
Printed on recycled paper. Visit our web site at www saodiego gov/development-services. Upon request, this information is available in alternative formats for persons with disabilities.
DS-5101 (10-16)
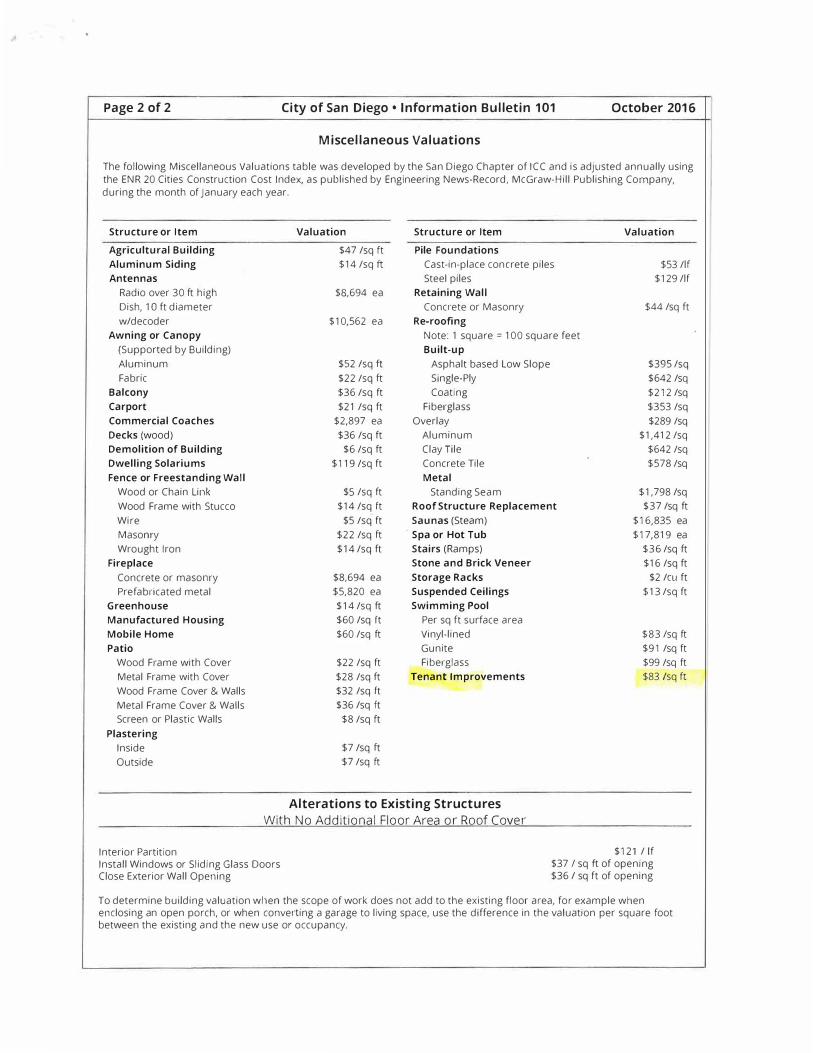
Page 2 of 2 City of San Diego• Information Bulletin 101 October 2016
Miscellaneous Valuations
The following Miscellaneous Valuations table was developed by the San Diego Chapter of ICC and is adjusted annually using the ENR 20 Cities Construction Cost Index, as published by Engineering News-Record, McGraw-Hill Publishing Company, during the month of January each year.
Structure or Item Valuation Structure or Item Valuation
Agricultural Building $47 /sq ft Pile Foundations
Aluminum Siding $14 /sq ft Cast-in-place concrete piles $53 /If
Antennas Steel piles $129 /If
Radio over 30 ft high $8,694 ea Retaining Wall
Dish, 1 Oft diameter Concrete or Masonry $44 /sq ft
w/decoder $10,562 ea Re-roofing
Awning or Canopy Note: 1 square = 1 00 square feet
(Supported by Building) Built-up
Aluminum $52 /sq h Asphalt based Low Slope $395 /sq
Fabric $22 /sq ft Single-Ply $642 /sq
Balcony $36 /sq ft Coating $212 /sq
Carport $21 /sq ft Fiberglass $353 /sq
Commercial Coaches $2,897 ea Overlay $289 /sq
Decks (wood) $36 /sq ft Aluminum $1,412/sq
Demolition of Building $6 /sq ft Clay Tile $642 /sq
Dwelling Solariums $119 /sq ft Concrete Tile $578 /sq
Fence or Freestanding Wall Metal
Wood or Chain Link $5 /sq ft Standing Seam $1,798 /sq
Wood Frame with Stucco $14 /sq ft Roof Structure Replacement $37 /sq ft
Wire $5 /sq ft Saunas (Steam) $16,835 ea
Masonry $22 /sq ft · Spa or Hot Tub $17,819 ea
Wrought Iron $14/sq ft Stairs (Ramps) $36 /sq ft
Fireplace Stone and Brick Veneer $16 /sq ft
Concrete or masonry $8.694 ea Storage Racks $2 /cu ft
Prefabricated metal $5,820 ea Suspended Ceilings $13 /sq ft
Greenhouse $14 /sq ft Swimming Pool
Manufactured Housing $60 /sq ft Per sq ft surface area
Mobile Home $60 /sq ft Vinyl-lined $83 /sq ft
Patio Gunite $91 /sq ft
Wood Frame with Cover $22 /sq ft Fiberglass $99 /sq ft
Metal Frame with Cover $28 /sq ft Tenant Improvements $83 /sq ft
Wood Frame Cover & Walls $32 /sq ft
Metal Frame Cover & Walls $36 /sq ft
Screen or Plastic Walls $8 /sq ft
Plastering
Inside $7 /sq ft
Outside $7 /sq ft
Alterations to Existing Structures
With No Additional Floor Area or Roof Cover
Interior Partition $121 / If Install Windows or Sliding Glass Doors $37 I sq ft of opening Close Exterior Wall Opening $36 / sq ft of opening
To determine building valuation when the scope of work does not add to the existing floor area, for example when enclosing an open porch. or when converting a garage to living space, use the difference in the valuation per square foot between the existing and the new use or occupancy.

Office of the City Manager
PUBLIC HEARINGMay 26, 2015
To: Honorable Mayor and Members of the City Council
From: � Christine Daniel, City Manager
Submitted by: Eric Angstadt, Director, Planning Department
Subject: Building Valuation and Permit Fees
RECOMMENDATION Conduct a public hearing and upon conclusion adopt a Resolution 1) establishing the most recent Building Valuation Data (BVD) published by the International Code Council(ICC) as the basis for verifying building valuations for new construction in the city of Berkeley, to be updated annually after the Building Valuation Data is published each February; 2) establishing a policy of valuing remodeling or renovation projects at up tosixty percent of the value of new construction subject to the approval of the buildingofficial; and 3) rescinding Resolution No. 61,942-N.S.
SUMMARY Using professional, independent valuations for building projects, which are updated regularly, is a practice commonly used by jurisdictions in the Bay Area and across thecountry. Most construction projects are submitted to the City with accurate selfvaluations, and for those this action would have no effect. For projects which the building official believes are underestimated at submittal, this action would allow the useof current, industry accepted baselines instead of the outdated 2003 tables currentlyused. Additionally, while the City's current policy is to value remodel or renovation projects at 75% of the cost of new construction, this action would provide flexibility to staff and some fee relief to homeowners by setting the remodel or renovation valuationrange at "up to sixty percent" of the ICC table rates, subject to the approval of the building official based on certain professional criteria. Finally, the proposed action wouldaddress a finding from the City Auditor's Construction Permit audit of 2014.
FISCAL IMPACTS OF RECOMMENDATION Restructuring the current valuation table to use the most recently published ICC BVDdata, as updated annually, will lead to an incremental increase in revenue from new construction projects to the Permit Service Center Enterprise Fund (833). Staff estimatethe annual revenue increase from this change to the valuation of new construction projects at approximately $300,000. Changing the valuation of remodeling projects fromthe current rate of exactly "seventy five percent" to the proposed flexible level of "up tosixty percent" of the value of new construction will lead to an incremental decrease in annual revenues, which staff estimate at $300,000. The result is expected to be no net
2180 Milvia Street, Berkeley, CA 94704 • Tel: (510) 981-7000 • TDD: (510) 981-6903 • Fax: (510) 981-7099 E-Mail: [email protected] Website: http://www.CityofBerkeley.info/Manager
31j

Building Valuation and Permit Fees PUBLIC HEARING May 26, 2015
change in fee revenues from this action. The valuation costs are used only as an aid for the building official to determine if the permit valuation is underestimated and, if necessary, to adjust the valuation.
CURRENT SITUATION AND ITS EFFECTS The City Auditor issued a finding in a March 2014 report on the methods by which building project values are determined. The Auditor identified that project valuations are derived from an outdated 2001 Building Valuation Table by the International Conference of Building Officials (ICBO) that the City Council adopted in 2003 as the City's building valuation basis. The Auditor recommended that staff "Submit a proposed resolution to the City Council authorizing Planning to always use a current building valuation table from a recognized industry expert, such as the International Code Council. .. ", "Update the costs whenever the industry expert publishes updates" and select a valuation table "that allows adjustment for factors that would affect costs in Berkeley, such as regional cost adjustments." The resolution proposed with this report addresses this audit finding, adopting the most current ICC Building Valuation Data for Berkeley use, and authorizing staff to update those values as subsequent ICC valuation tables are published.
BACKGROUND Building permit fees are calculated based on the project valuation stated by applicants. Section 109.3 of the California Building Code requires the applicant to provide this figure on their permit application, which is to include the total of all the work, including materials and labor, for which the permit is sought. If, in the opinion of the building official, the permit valuation has been underestimated, the permit can be denied unless this issue is resolved. The Building Code charges the building official with the responsibility to set the final value. To assist in obtaining uniformity, the ICC periodically publishes Building Valuation Data, which can be used as a common base in the verification of construction valuations.
Current Resolution No. 61,942 - N.S., adopted on February 18, 2003, provides that for purposes of calculating building permit fees, the cost per square foot schedule as established by the International Conference of Building Officials (ICBO) in October 2001 shall be used by the City of Berkeley to calculate building valuations. Using building valuation data from 2001 at times results in artificially low and inaccurate construction valuations. Furthermore, the 2001 valuation data was based on the Uniform Building Code construction types that no longer exist. They have been replaced by construction types based on the International Building Code.
In 2003 the International Conference of Building Officials (ICBO) merged into the International Code Council (ICC), which now publishes the building valuation tables. It is a national average of construction costs per square foot and is widely used by other jurisdictions in the Bay Area and throughout the country.
Since the building valuation used to calculate building permit fees is based on the higher of the estimated permit valuation provided by the applicant or the permit
Page 2

Building Valuation and Permit Fees PUBLIC HEARING May 26, 2015
valuation based on the adopted building valuation unit costs per square foot, the proposed resolution will provide staff with updated tools to determine if the valuation stated in the application is underestimated. This is consistent with the recommendation in the Construction Permit Audit that staff shall "verify permit applicants' stated project valuations and always use the higher valuation to calculate fees, unless the Building official provides a reasonable basis for exceptions, such as when the permit applicant can show detailed estimates."
Applicants who are constructing custom buildings with upgraded materials and advanced building components, which require more extensive services, often declare a valuation higher than the simplified average valuation unit costs per square foot, thereby consenting to a higher permit fee. The resolution proposed with this report does not prevent this. Building permit valuations can be adjusted as appropriate based on the characteristics of the project.
With respect to remodeling and renovation projects, current Resolution No. 61,942 -N.S. provides that the building valuation for remodeling and renovation projects shall be seventy-five percent of the value of new construction, subject to the approval of the building official. This provision implies that services required by remodeling and renovation projects are 75% of those required for new construction, which is hardly ever the case. The current Resolution fails to recognize that the scope of remodeling or renovations to existing buildings varies greatly from minor interior alterations to major alterations impacting building structural and fire/life safety systems. The flat value based on seventy-five percent of the value of new construction does not reflect accurate values for that purpose and does not provide staff with the necessary discretion to establish the value based on the actual scope of remodeling or renovation work. As a result, the policy is seldom used by staff due to its lack of flexibility.
Changing Berkeley's policy of valuing remodeling or renovation projects to "up to sixty percent of the value of new construction, subject to the approval of the Building Official" will lead to more accurate and reasonable valuations for renovations, alterations, tenant improvements, and similar projects. The new policy provides flexibility for the Building and Safety Division to evaluate the scope of work in the submitted plans to determine or verify a building permit valuation. Minor interior renovations could be valued in the 20% range of the value of new construction, tenant improvement build-outs in the 40% range, while major alterations which impact building structural and fire/life safety systems could be valued as high as 60% of the value of new construction. In addition to the scope of work, criteria including but not limited to the types of finishes, the type and quality of the materials, and the amount of customized versus standard work all have a large impact on the cost of a particular renovation or repair project.
In the past, the ICBO included a regional modifier, to be used with the valuation tables. The ICC does not include a regional modifier and leaves the selection of regional modifier to local jurisdictions. The last regional modifier published by ICBO in 2002
Page 3

Building Valuation and Permit Fees PUBLIC HEARING May 26, 2015
indicated a modifier for the San Francisco Bay area of 1.16. RSMeans, a well known cost estimating organization used by construction companies, shows a 2015 regional modifier of 16.8 for Berkeley in their Masterformat City Cost Indexes. The 2015 Blue Book Guide to Construction Costs, which is commonly used by architects, engineers, and contractors, indicates a regional modifier of 1.24. The Building and Safety Division proposes to continue using a regional modifier of 1.16.
ENVIRONMENTAL SUSTAINABILITY There are no identifiable environmental opportunities or effects associated with the subject of this report.
RATIONALE FOR RECOMMENDATION The values used as the basis for calculating permit fees have not been updated since 2003. To avoid the need to return to Council to update these fees in the future, this resolution enables the Building and Safety Division to update the values annually using the ICC Building Valuation Data, as recommended by the City Auditor. This resolution is not a change in the building permit rates or the methodology for calculating permit fees. Rather, it is a correction of a reference that has become outdated.
Changing Berkeley's policy of valuing remodel or renovation projects from seventy-five percent to "up to sixty percent of the value" will lead to more accurate valuations for renovations, alterations, tenant improvements, and similar projects.
ALTERNATIVE ACTIONS CONSIDERED Staff considered different ways to calculate a regional modifier and whether or not to use one.
CONTACT PERSON Alex Roshal, Building Official, Planning Department, 981-7445
Attachments: 1: Resolution
Exhibit A: ICC Building Validation Data - February 2015 2: Public Hearing Notice
Page 4
..

. '
RESOLUTION NO. l#f.,tt##-N.S.
ESTABLISHING THE MOST RECENT BUILDING VALUATION DATA PUBLISHED BY THE INTERNATIONAL CODE COUNCIL AS THE BASIS FOR VERIFYING BUILDING VALUATIONS FOR NEW CONSTRUCTION IN THE CITY OF BERKELEY, TO BE UPDATED ANNUALLY AFTER THE BUILDING VALUATION DATA IS PUBLISHED EACH FEBRUARY; ESTABLISHING A POLICY OF VALUING REMODELING OR RENOVATION PROJECTS AT UP TO SIXTY PERCENT OF THE VALUE OF NEW CONSTRUCTION SUBJECT TO THE APPROVAL OF THE BUILDING OFFICIAL
WHEREAS, construction costs in the Bay Area have increased since the City of Berkeley established the 2003 International Conference of Building Officials (ICBO) cost per square foot schedule as the basis for calculating building valuation and permit fees for new construction; and
WHEREAS, the building valuation data (BVD) published by the International Code Council (ICC) is widely used and accepted by other jurisdictions in the Bay Area and has superseded data formerly published by the International Conference of Building Officials (ICBO) for determining value-based permit fees; and
WHEREAS, it is more accurate to value remodel or renovation projects up to 60% of the value of new construction and not at 75% of the value, as established by a 2003 City of Berkeley resolution.
NOW THEREFORE, BE IT RESOLVED by the Council of the City of Berkeley that the most recent building valuation data, as published by the International Code Council and attached hereto as Exhibit A, will be used by the City of Berkeley to verify building valuations, with the costs updated annually after the ICC publishes new Building Valuation Data every February.
BE IT FURTHER RESOLVED that a regional modifier of 1.16 is adopted for use with the ICC Building Valuation Data, which may be modified on an annual basis by the Building and Safety Division, if recognized industry sources indicate this is warranted.
BE IT FURTHER RESOLVED that the building valuation for construction projects determined to be a remodel, or renovation shall be up to sixty percent of the value of new construction, subject to the approval of the building official based on factors including but not limited to scope and scale of the project, quality of finishes, type and quality of materials, and amount of customized work included.
BE IT FURTHER RESOVLED that Resolution No. 61,942-N.S. is hereby rescinded.

Exhibit A: ICC Building Validation Data - February 2015
The following building valuation data represents average valuations for most buildings. In conjunction with International Building Code Section 109.3, this data is offered as an aid for the building official to determine if the permit valuation is underestimated. These are "average" costs based on typical construction methods for each occupancy group and type of construction. The average costs include foundation work, structural and nonstructural building components, electrical, plumbing, mechanical and interior finish material. The data is a national average and does not take into account any regional cost differences. The use of Regional Cost Modifiers is subject to the authority having jurisdiction.
a, b, c, d, eSquare Foot Construction Costs
Group (2012 International IA IB IIA 118 IIIA 1118 IV VA VB
Building Code)
A-1 Assembly, theaters, with stage 229.03 221.51 216.10 207.06 194.68 189.07 200.10 177.95 171.21
A-1 Assembly, theaters, without stage 209.87 202.35 196.94 187.90 175.62 170.01 180.94 158.89 152.15
A-2 Assembly, nightclubs 177.89 172.85 168.07 161.49 151.98 147.78 155.80 137.68 132.99
A-2 Assembly, restaurants, bars, 176.89 171.85 166.07 160.49 149.98 146.78 154.80 135.68 131.99 banquet halls
A-3 Assembly, churches 211.95 204.43 199.02 189.98 177.95 172.34 183.02 161.22 154.48 A-3 Assembly, general, community halls, libraries, museums 176.88 169.36 162.95 154.91 141.73 137.12 147.95 125.00 119.26
A-4 Assembly, arenas 208.87 201.35 194.94 186.90 173.62 169.01 179.94 156.89 151.15
B Business 182.89 176.17 170.32 161.88 147.55 142.00 155.49 129.49 123.76
E Educational 195.85 189.10 183.56 175.25 163.21 154.58 169.21 142.63 137.99
F-1 Factory and industrial, moderate 108.98 103.99 97.83 94.17 84.37 80.56 90.16 69.50 65.44 hazard
F-2 Factory and industrial, low hazard 107.98 102.99 97.83 93.17 84.37 79.56 89.16 69.50 64.44
H-1 High Hazard, explosives 102.01 97.02 91.86 87.20 78.60 73.79 83.19 63.73 N.P.
H-2/3/4 High Hazard 102.01 97.02 91.86 87.20 78.60 73.79 83.19 63.73 58.67
H-5 HPM 182.89 176.17 170.32 161.88 147.55 142.00 155.49 129.49 123.76
1-1 Institutional, supervised 180.72 174.14 169.28 161.12 149.06 145.04 161.12 133.69 129.43 environment
1-2 lnstttutional, hospitals 308.50 301.79 295.93 287.50 272.14 N.P. 281.10 254.09 N.P.
1-2 Institutional, nursing homes 213.56 206.85 200.99 192.56 179.22 N.P. 186.16 161.17 N.P.
1-3 Institutional, restrained 208.37 201.66 195.80 187.37 174.54 167.98 180.97 156.48 148.74
1-4 Institutional, day care facilities 180.72 174.14 169.28 161.12 149.06 145.04 161.12 133.69 129.43
M Mercantile 132.61 127.57 121.79 116.21 106.35 103.15 110.52 92.05 88.36
R-1 Residential, hotels 182.28 175.70 170.83 162.68 150.87 146.84 162.68 135.49 131.23
R-2 Residential, multiple family 152.86 146.27 141.41 133.25 122.04 118.01 133.25 106.66 102.41
R-3 Residential, one- and two-family 143.93 139.97 136.51 132.83 127.95 124.61 130.57 119.73 112.65
R-4 Residential, care/assisted living 180.72 174.14 169.28 161.12 149.06 145.04 161.12 133.69 129.43 facilities
S-1 Storage, moderate hazard 101.01 96.02 89.86 86.20 76.60 72.79 82.19 61.73 57.67
S-2 Storage, low hazard 100.01 95.02 89.86 85.20 76.60 71.79 81.19 61.73 56.67
U Utility, miscellaneous 77.10 72.64 68.12 64.64 58.13 54.28 61.62 45.49 43.33
a. Private Garages use Utility, miscellaneousb. Unfinished basements (all use group)= $15.00 per sq. ft. c. For shell only buildings deduct 20 percentd. N.P. = not permitted e. Cases not listed in the table shall be considered separately by the building official

Regional Modifier
Building Valuations shall be derived from the building valuation data published by the International Code Council and adjusted by the California regional modifier for the San Francisco Bay Area (1.16).
REGIONAL MODIFIERS The following modifiers are recommended tor use in conjunction with the building valuation data. Additionally. certain local conditions may require further
modifications. To use these modifiers, merely multii:ly the listed cost per square foot by the appropriate regional modifier For example, to adjl.lst the cost of a Type Ill One-hour hotel building of average construction for the Iowa area, select Rcg,orol Modifier 0.80 and unit cost from valuation data, $87.50:
0.80 x 87 .50 a! S70.00(adjusted cost per square foot)
Eastern U.S. Modifier Eastern U.S. (cont.) Modifier Central U.S. (cont.)Modlfler Western U.S. Modlfler Connecticut........................ 1.00 Pennsylvania K,:nsas............................... 0.87 Alaska................................ 1.20 Delaware............................ 0.93 Philadelphia.:.................. 1.05 Kentucky............................ 0.83 Ar.zona .... ... ...... .... .... ....... ... 0.87 District of Columbia............. 0.90 Other............................. 0.88 Louisiana............................ 0.78 California Florida............................... 0.80 Rhode Island ...................... 0.97 Michigan............................ 0.91 Los Angeles.................... 1.00 Georgia.............................. 0. 77 South Carolina.................... 0. 77 Minnesota.......................... 0.91 San Francisco Bay Area... 1.16 M2lr,e ....... .......... ........... .... 0.86 Vermont............................. 0.88 Mississippi.......................... 0. 7 4 Other............................. 0.97 Maryland............................ 0.86 Virginia............................... 0.83 Mssoun............................. 0.87 Colorado............................ 0.92 Massachusetts.................... 0.97 West Virgi1iil..... ......... ......... 0.91 Nebraska............................ 0.83 Hawaii. ....................... .. . :.. 1.24 New Hampshire .................. 0.86 North Dakota ...................... 0.86 Idaho................................. 0.87 New Jersey......................... 1.03 Central Otio ................................ 0.87
i
U.S. Montana ...... ... ... ............ .... 0.84 NewYor'< Alabama............................. 0.76 . Oklahomn........................... 0. 78 Nevada.............................. 0.93
New York City.................. 1.20 Arkansas............................ 0. 75 Scuth Dakota ................. .... 0.84 New Mexico........................ O. 79 Other............................. 0.90 Illinois................................ 0.97 Tennessee.......................... o. 79 Oregon............................... 0.94
Nor.h Carolina .................... 0. 78 Indiana .. .. ... ..... .. .. ..... ......... 0.91 Texas................................. o. Tl Utah ................................ 0.84 Iowa ................................ 0.87 Wisconsin........................... 0.92 Wastiington .................... .... 0.97
Wyoming............................ 0.84
7 56 • buildingstandards July-August 2002

Attachment 2
NOTICE OF PUBLIC HEARING
BERKELEY CITY COUNCIL
BUILDING VALUATION AND PERMIT FEES
The Department of Planning and Development is proposing that the City:
1. Establish the most recent Building Valuation Data (BVD) published by theInternational Code Council (ICC) as the basis for verifying building valuations fornew construction in the city of Berkeley, to be updated annually after the BuildingValuation Data is published each February; and
2. Establish a policy of valuing remodeling or renovation projects at up to sixtypercent of the value of new construction subject to the approval of the buildingofficial.
The most current ICC BVD table is:
ICC Building Validation Data - February 2015
The following building valuation data represents average valuations for most buildings. In conjunction with International Building Code Section 109.3, this data is offered as an aid for the building official to determine if the permit valuation is underestimated. These are "average" costs based on typical construction methods for each occupancy group and type of construction. The average costs include foundation work, structural and nonstructural building components, electrical, plumbing, mechanical and interior finish material. The data is a national average and does not take into account any regional cost differences. The use of Regional Cost Modifiers is subject to the authority having jurisdiction.
a, b, c, d, eSquare Foot Construction Costs
Group (2012 International IA 18 IIA 118 IIIA IIIB IV VA VB
Building Code)
A-1 Assembly, theaters, with stage 229.03 221.51 216.10 207.06 194.68 189.07 200.10 177.95 171.21
A-1 Assembly, theaters, without stage 209.87 202.35 196.94 187.90 175.62 170.01 180.94 158.89 152.15
A-2 Assembly, nightclubs 177.89 172.85 168.07 161.49 151.98 147.78 155.80 137.68 132.99
A-2 Assembly, restaurants, bars, 176.89 171.85 166.07 160.49 149.98 146.78 154.80 135.68 131.99 banquet halls
A-3 Assembly, churches 211.95 204.43 199.02 189.98 177.95 172.34 183.02 161.22 154.48
A-3 Assembly, general, community halls, libraries, museums 176.88 169.36 162.95 154.91 141.73 137.12 147.95 125.00 119.26
A-4 Assembly, arenas 208.87 201.35 194.94 186.90 173.62 169.01 179.94 156.89 151.15
B Business 182.89 176.17 170.32 161.88 147.55 142.00 155.49 129.49 123.76
E Educational 195.85 189.10 183.56 175.25 163.21 154.58 169.21 142.63 137.99
F-1 Factory and industrial, moderate 108.98 103.99 97.83 94.17 84.37 80.56 90.16 69.50 65.44 hazard
F-2 Factory and industrial, low hazard 107.98 102.99 97.83 93.17 84.37 79.56 89.16 69.50 64.44
H-1 High Hazard. explosives 102.01 97.02 91.86 87.20 78.60 73.79 83.19 63.73 N.P.
H-21314 High Hazard 102.01 97.02 91.86 87.20 78.60 73.79 83.19 63.73 58.67

H-5 HPM 182.89 176.17 170.32 161.88 147.55 142.00 155.49 129.49 123.76
1-1 Institutional, supervised 180.72 174.14 169.28 161.12 149.06 145.04 161.12 133.69 129.43 environment1-2 Institutional, hospitals 308.50 301.79 295.93 287.50 272.14 N.P. 281.10 254.09 N.P.
1-2 Institutional, nursing homes 213.56 206.85 200.99 192.56 179.22 N.P. 186.16 161.17 N.P.
1-3 Institutional, restrained 208.37 201.66 195.80 187.37 174.54 167.98 180.97 156.48 148.74
1-4 Institutional, day care facilities 180.72 174.14 169.28 161.12 149.06 145.04 161.12 133.69 129.43
M Mercantile 132.61 127.57 121.79 116.21 106.35 103.15 110.52 92.05 88.36
R-1 Residential, hotels 182.28 175.70 170.83 162.68 150.87 146.84 162.68 135.49 131.23
R-2 Residential, multiple family 152.86 146.27 141.41 133.25 122.04 118.01 133.25 106.66 102.41
R-3 Residential, one- and two-family 143.93 139.97 136.51 132.83 127.95 124.61 130.57 119. 73 112.65
R-4 Residential, care/assisted living 180.72 174.14 169.28 161.12 149.06 145.04 161.12 133.69 129.43 ·��,l;t;A�
S-1 Storage, moderate hazard 101.01 96.02 89.86 86.20 76.60 72.79 82.19 61.73 57.67
S-2 Storage, low hazard 100.01 95.02 89.86 85.20 76.60 71.79 81.19 61.73 56.67
U Utility, miscellaneous 77.10 72.64 68.12 64.64 58.13 54.28 61.62 45.49 43.33
a. Private Garages use Utility, miscellaneousb. Unfinished basements (all use group)= $15.00 per sq. ft.c. For shell only buildings deduct 20 percentd. N.P. = not permittede. Cases not listed in the table shall be considered separately by the building official
Regional Modifier
Building Valuations shall be derived from the building valuation data published by the International Code Council and adjusted by the California regional modifier for the San Francisco Bay Area (1.16).
REGIONAL MODIFIERS The folfowing modifiers arc recommended f or use in conjunction with the building valuation data. Additionally, certain local conditions may reQuire furcher
ffiO'Jifications. To use these mooitiers, merel y multiply the listed cost per square foot by the appropriate regional modrfier. For example. to adjust the cost of a T}'Pe Ill One··hour hotel building of a'leragc construction for the Iowa area, select Regional Modifier 0.80 and unit cost from valuation data, $87.50:
0.80 x 87.50 = 570.00(adjusted cost per squi.\l'e foot)
Eastern U.S. Modifier Eastern U.S. (cont.) Modifier Central U.S. (cont.)Modlfler Western U.S. Modifier Connecticut........................ 1.00 Pennsylvania Kansas............................... 0.87 Alaska................................ 1.20 Delaware............................ 0.93 Philadelphia .. ·.................. 1.05 Ken t�cky ............................ 0.83 Arizona............................... 0.87 .District of Columbia............. 0.90 Other............................. 0.88 Lou1s1ana............................ 0. 78 California Florida ............................... 0.80 Rhode Island ...................... 0.97 Michigan............................ 0.91 Los Angeles.................... 1.00 Georgia.............................. 0.17 South Carolina.................... 0.7 7 Minnesota.......................... 0.91 San Francisco Bay Area... 1.16 Maine................................ 0.86 Vermont ............................. 0.88 Mississippi.......................... 0.74 Other............................. 0.97 Maryl and............................ 0.86 Virginia............................... 0.83 Missouri............................. 0.87 Colorndo ............................ 0.92 Massachusetts.................... 0.97 West Virginin....................... 0.91 Nebraska........ .................... 0.83 Hawaii........................ ....... 1.24 New l�ompshire ....... ........... 0.86 North Dakota...................... 0.86 Idaho................................. 0.87 New Jersey......................... 1.03 Central U.S. Otio ................................ 0.87 Montana ............................ 0.84 New York Alabama............................. 0.76 Oklahomo........................... 0. 78 Nevada.............................. 0.93
New YOO< City.................. 1.20 Ar'o<ansas............................ 0. 75 South Dakota..................... 0.84 New Mexico........................ O. 79 Other............................. 0.90 Illinois................................ 0.97 Ten�ee .................. .... .... o. 79 Oregon ............................... 0.94
North Caroli na .................... 0. 78 Indiana.............................. 0.91 Texas................................. 0. 77 Utah ................................ 0.84 IOW"cl ................................ 0.87 Wisconsin........................... 0.92 Washington ........................ 0.97
Wyoming............................ 0.84
I 56 • buildingstandards July-August 2002

The hearing will be held on May 26, 2015 at 7:00 p.m. in the City Council Chambers, 2134 Martin Luther King, Jr. Way.
A copy of the agenda material for this hearing will be available on the City's website at www.CityofBerkeley.info as of May 14, 2015.
For further information, please contact Alex Roshal, Building Official, Planning and Development Department, at 510-981-7445.
Written comments should be mailed or delivered directly to the City Clerk, 2180 Milvia Street. Berkeley, CA 94704, in order to ensure delivery to all Councilmembers and inclusion in the agenda packet.
Communications to the Berkeley City Council are public record and will become part of the City's electronic records, which are accessible through the City's website. Please note: e-mail addresses, names, addresses, and other contact information are not required, but if included in any communication to the City Council, will become part of the public record. If you do not want your e-mail address or any other contact information to be made public, you may deliver communications via U.S. Postal Service or in person to the City Clerk. If you do not want your contact information included in the public record, please do not include that information in your communication. Please contact the City Clerk at 981-6900 or [email protected] for further information.
If you challenge the above in court, you may be limited to raising only those issues you or someone else raised at the public hearing described in this notice, or in written correspondence delivered to the City of Berkeley at, or prior to, the public hearing. Background information concerning this proposal will be available at the City Clerk Department and posted on the City of Berkeley webpage at least 12 days prior to the public hearing.
Published: May 15 and May 22, 2015 - The Berkeley Voice Per Government Code 6062A
----------------------------------------------------------------
I hereby certify that the Notice for this Public Hearing of the Berkeley City Council was posted at the display case located near the walkway in front of Council Chambers, 2134 Martin Luther King Jr. Way, as well as on the City's website, on May 14, 2015.
Mark Numainville, City Clerk