building approvals australia - australian …. october 2017 30 november 2017 september 2017 -...
TRANSCRIPT
— nil or rounded to zero (including null cells)
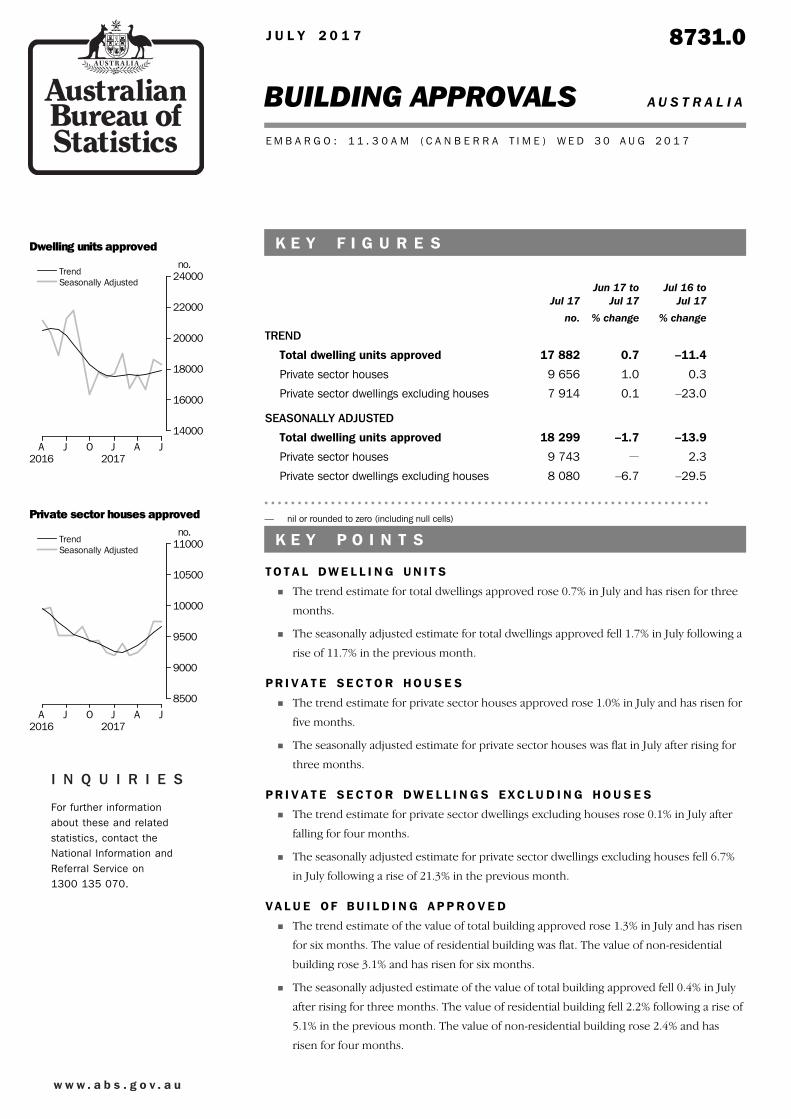
–29.5–6.78 080Private sector dwellings excluding houses
2.3—9 743Private sector houses
–13.9–1.718 299Total dwelling units approved
SEASONALLY ADJUSTED
–23.00.17 914Private sector dwellings excluding houses
0.31.09 656Private sector houses
–11.40.717 882Total dwelling units approved
TREND
% change% changeno.
Jul 16 toJul 17
Jun 17 toJul 17Jul 17
K E Y F I G U R E S
T O T A L D W E L L I N G U N I T S
! The trend estimate for total dwellings approved rose 0.7% in July and has risen for three
months.
! The seasonally adjusted estimate for total dwellings approved fell 1.7% in July following a
rise of 11.7% in the previous month.
P R I V A T E S E C T O R H O U S E S
! The trend estimate for private sector houses approved rose 1.0% in July and has risen for
five months.
! The seasonally adjusted estimate for private sector houses was flat in July after rising for
three months.
P R I V A T E S E C T O R D W E L L I N G S E X C L U D I N G H O U S E S
! The trend estimate for private sector dwellings excluding houses rose 0.1% in July after
falling for four months.
! The seasonally adjusted estimate for private sector dwellings excluding houses fell 6.7%
in July following a rise of 21.3% in the previous month.
V A L U E O F B U I L D I N G A P P R O V E D
! The trend estimate of the value of total building approved rose 1.3% in July and has risen
for six months. The value of residential building was flat. The value of non-residential
building rose 3.1% and has risen for six months.
! The seasonally adjusted estimate of the value of total building approved fell 0.4% in July
after rising for three months. The value of residential building fell 2.2% following a rise of
5.1% in the previous month. The value of non-residential building rose 2.4% and has
risen for four months.
K E Y P O I N T S
E M B A R G O : 1 1 . 3 0 A M ( C A N B E R R A T I M E ) W E D 3 0 A U G 2 0 1 7
BUILDING APPROVALS A U S T R A L I A
8731.0J U L Y 2 0 1 7
For further informationabout these and relatedstatistics, contact theNational Information andReferral Service on1300 135 070.
Dwelling units approved
A2016
J O J2017
A J
no.
14000
16000
18000
20000
22000
24000TrendSeasonally Adjusted
Private sector houses approved
A2016
J O J2017
A J
no.
8500
9000
9500
10000
10500
11000TrendSeasonally Adjusted
I N Q U I R I E S
w w w . a b s . g o v . a u

30 November 2017October 2017
9 November 2017September 2017 - Additional
2 November 2017September 2017
10 October 2017Augiust 2017 - Additional
3 October 2017August 2017
6 September 2017July 2017 - Additional
RELEASE DATEISSUEFO R T H C O M I N G I S S U E S
Da v i d W . Ka l i s c h
Au s t r a l i a n S t a t i s t i c i a n
497–497Total
26–26ACT2–2NT4–4Tas.5–5WA
–1––1SA46–46Qld
7–7Vic.408–408NSW
TOTAL2017–182016–17Dwe l l i n g s
Revisions to the total number of dwelling units approved in this issue are:RE V I S I O N S TH I S MO N T H
In this release, revisions are provided for the time period from July 2016 to June 2017
and include revisions resulting from the Building Approvals Annual Review. Further
information about the Annual Review and other potential sources of revisions can be
found in the feature article released with the January 2016 8731.0 publication - "Revisions
to Building Approval Statistics".
Small area data cubes will be made available in an “Additional Information” release five
business days after the main publication. The data cubes will be for Statistical Area Level
2 and Local Government Areas. Release dates are published under the “Forthcoming
Issues” section of the publication and in ABS Release Advice.
A number of time series spreadsheets contain ‘np’ (not available for publication)
annotations. This is due to confidential data being contained in these series.
DA T A NO T E S
2 A B S • B U I L D I N G A P P R O V A L S • 8 7 3 1 . 0 • J U L Y 2 0 1 7
N O T E S
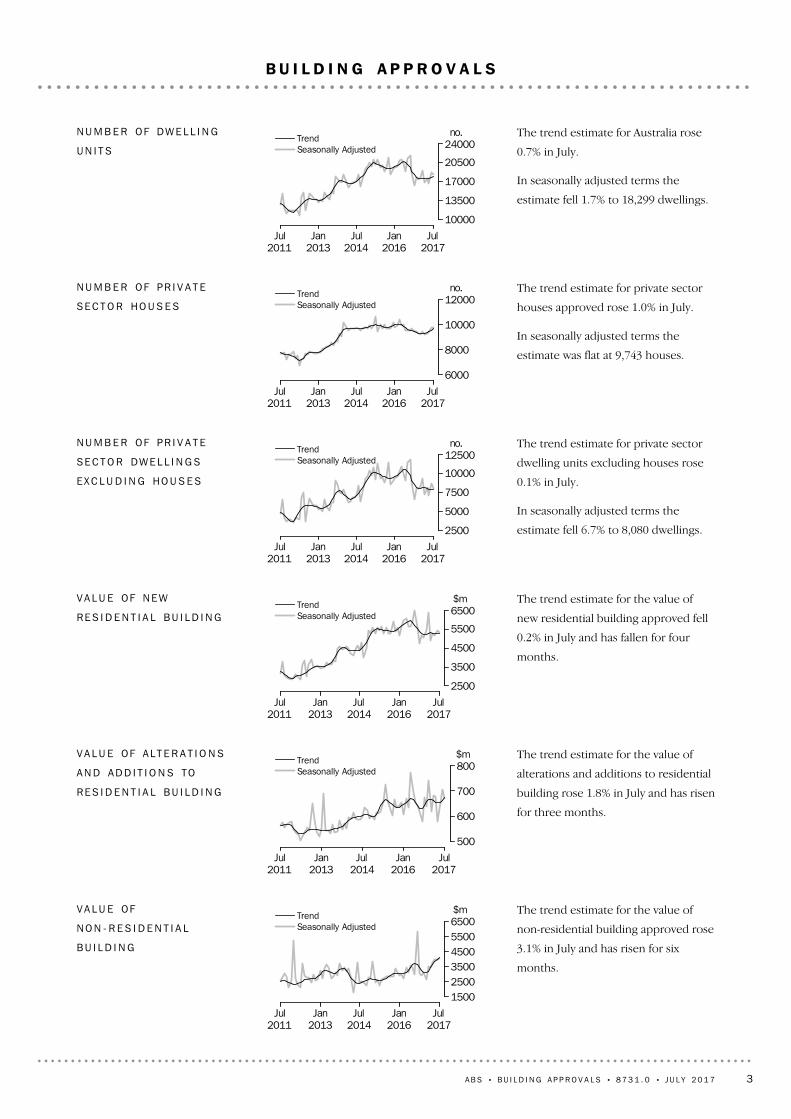
The trend estimate for the value of
non-residential building approved rose
3.1% in July and has risen for six
months.
Jul2011
Jan2013
Jul2014
Jan2016
Jul2017
$m
150025003500450055006500
TrendSeasonally Adjusted
VA L U E OF
NO N - R E S I D E N T I A L
BU I L D I N G
The trend estimate for the value of
alterations and additions to residential
building rose 1.8% in July and has risen
for three months.
Jul2011
Jan2013
Jul2014
Jan2016
Jul2017
$m
500
600
700
800TrendSeasonally Adjusted
VA L U E OF A L T E R A T I O N S
AN D AD D I T I O N S TO
RE S I D E N T I A L BU I L D I N G
The trend estimate for the value of
new residential building approved fell
0.2% in July and has fallen for four
months.
Jul2011
Jan2013
Jul2014
Jan2016
Jul2017
$m
2500
3500
4500
5500
6500TrendSeasonally Adjusted
VA L U E OF NE W
RE S I D E N T I A L BU I L D I N G
The trend estimate for private sector
dwelling units excluding houses rose
0.1% in July.
In seasonally adjusted terms the
estimate fell 6.7% to 8,080 dwellings.Jul
2011Jan
2013Jul
2014Jan
2016Jul
2017
no.
2500
5000
7500
10000
12500TrendSeasonally Adjusted
NU M B E R OF PR I V A T E
SE C T O R DW E L L I N G S
EX C L U D I N G HO U S E S
The trend estimate for private sector
houses approved rose 1.0% in July.
In seasonally adjusted terms the
estimate was flat at 9,743 houses.
Jul2011
Jan2013
Jul2014
Jan2016
Jul2017
no.
6000
8000
10000
12000TrendSeasonally Adjusted
NU M B E R OF PR I V A T E
SE C T O R HO U S E S
The trend estimate for Australia rose
0.7% in July.
In seasonally adjusted terms the
estimate fell 1.7% to 18,299 dwellings.
Jul2011
Jan2013
Jul2014
Jan2016
Jul2017
no.
10000
13500
17000
20500
24000TrendSeasonally Adjusted
NU M B E R OF DW E L L I N G
UN I T S
A B S • B U I L D I N G A P P R O V A L S • 8 7 3 1 . 0 • J U L Y 2 0 1 7 3
B U I L D I N G A P P R O V A L S

The trend estimate for total number of
dwelling units approved in Western
Australia rose 0.8% in July and has
risen for three months. The trend
estimate for the number of private
sector houses fell 0.1% in July after
being flat in the previous month.Jul
2011Jan
2013Jul
2014Jan
2016Jul
2017
no.
0
1000
2000
3000
4000Total dwelling unitsPrivate sector Houses
WE S T E R N AU S T R A L I A
The trend estimate for total number of
dwelling units approved in South
Australia rose 0.8% in July and has
risen for nine months. The trend
estimate for the number of private
sector houses rose 0.9% in July and has
risen for six months.Jul
2011Jan
2013Jul
2014Jan
2016Jul
2017
no.
0
500
1000
1500Total dwelling unitsPrivate sector Houses
SO U T H AU S T R A L I A
The trend estimate for total number of
dwelling units approved in Queensland
rose 0.2% in July and has risen for
seven months. The trend estimate for
the number of private sector houses
rose 1.5% in July and has risen for four
months.Jul
2011Jan
2013Jul
2014Jan
2016Jul
2017
no.
0
2000
4000
6000Total dwelling unitsPrivate sector Houses
QU E E NS LA N D
The trend estimate for total number of
dwelling units approved in Victoria
rose 1.0% in July after falling for five
months. The trend estimate for the
number of private sector houses rose
1.1% in July and has risen for seven
months.Jul
2011Jan
2013Jul
2014Jan
2016Jul
2017
no.
0
2000
4000
6000
8000Total dwelling unitsPrivate sector Houses
V I C T O R I A
The trend estimate for total number of
dwelling units approved in New South
Wales rose 0.4% in July and has risen
for seven months. The trend estimate
for the number of private sector
houses rose 0.8% in July and has risen
for six months.Jul
2011Jan
2013Jul
2014Jan
2016Jul
2017
no.
0
2000
4000
6000
8000Total dwelling unitsPrivate sector Houses
NE W SO U T H WA L E S
4 A B S • B U I L D I N G A P P R O V A L S • 8 7 3 1 . 0 • J U L Y 2 0 1 7
D W E L L I N G U N I T S A P P R O V E D S T A T E TR E N D S

24
Value of building approved, states and territories, chain volume
measures, original
19. . . . . . . . . . . . . . . . . . . . . . . . . . . . . . . . . . . .
23Value of building approved, chain volume measures18 . . . . . . . . . . . . . . .CH A I N VO L U M E ME A S U R E S
22Value of building approved, by sector, original17 . . . . . . . . . . . . . . . . . . .21Value of non-residential building approved, states and territories16 . . . . . . .20Value of residential buildings approved, state and territories15 . . . . . . . . . .19
Value of total building approved, states and territories, percentage
change
14. . . . . . . . . . . . . . . . . . . . . . . . . . . . . . . . . . . . . . . . . . .
18Value of total building approved, states and territories13 . . . . . . . . . . . . . .17Value of building approved, percentage change12 . . . . . . . . . . . . . . . . . .16Value of building approved11 . . . . . . . . . . . . . . . . . . . . . . . . . . . . . . .
VA L U E
15
Dwelling units approved in new residential buildings, number and
value, original
10. . . . . . . . . . . . . . . . . . . . . . . . . . . . . . . . . . . . . . .
14Dwelling units approved, by sector, original9 . . . . . . . . . . . . . . . . . . . .13
Dwelling units approved, by Greater Capital City Statistical Area,
original
8. . . . . . . . . . . . . . . . . . . . . . . . . . . . . . . . . . . . . . . . . . .
12Dwelling units approved, states and territories, original7 . . . . . . . . . . . . .11
Private sector houses approved, states and territories, percentage
change
6. . . . . . . . . . . . . . . . . . . . . . . . . . . . . . . . . . . . . . . . . . .
10Private sector houses approved, states and territories5 . . . . . . . . . . . . . .9
Total dwelling units approved, states and territories, percentage
change
4. . . . . . . . . . . . . . . . . . . . . . . . . . . . . . . . . . . . . . . . . . . .
8Total dwelling units approved, states and territories3 . . . . . . . . . . . . . . . .7Dwelling units approved, percentage change2 . . . . . . . . . . . . . . . . . . . .6Dwelling units approved1 . . . . . . . . . . . . . . . . . . . . . . . . . . . . . . . . .
DW E L L I N G UN I T S
page
A B S • B U I L D I N G A P P R O V A L S • 8 7 3 1 . 0 • J U L Y 2 0 1 7 5
L I S T O F T A B L E S

17 88231217 5708 0657 9149 8179 656July17 75328517 4698 0327 9089 7219 560June17 63325617 3778 0197 9199 6149 457May17 59123517 3568 0767 9949 5159 363April17 61822217 3968 1838 1099 4359 287March17 57721817 3598 1848 1109 3939 249February17 49322217 2718 0888 0079 4059 264January
201717 55923317 3268 0978 0049 4629 322December17 82024517 5768 2958 1919 5259 385November18 27326018 0138 6948 5769 5799 437October18 90027718 6239 2759 1439 6259 480September19 58228419 2989 8969 7619 6869 538August
2016
TR E N D
18 29947517 8238 4018 0809 8989 743July18 61921718 4028 6928 6579 9279 745June16 67616716 5087 1667 1409 5109 368May17 66922617 4438 2758 1989 3949 245April16 74025516 4867 3977 2819 3439 204March19 00727618 7319 4279 3369 5809 395February17 72221517 5078 3948 3059 3299 203January
201717 43114317 2888 0868 0459 3469 243December17 76525317 5138 1768 0769 5899 436November16 32033315 9876 7266 5739 5949 414October18 80418118 6239 0368 9659 7689 658September21 74240021 34212 07111 8319 6719 511August
2016
SE A S O N A L L Y AD J U S T E D
18 92449418 4308 7498 42810 17510 002July18 70525418 4518 1578 12210 54810 329June18 00120717 7947 1357 10910 86610 685May16 06520015 8658 2108 1337 8557 732April17 43524417 1917 2817 16510 15410 026March17 63829017 3488 3898 2989 2499 050February14 01718013 8377 0606 9716 9576 866January
201717 03113016 9019 1049 0637 9277 838December19 08925618 8338 6558 55510 43410 278November16 87331316 5607 2237 0709 6509 490October20 01816119 8579 6359 56410 38310 293September22 72043522 28511 79711 55710 92310 728August
2016
219 7812 949216 832104 845103 686114 936113 1462016–17238 2563 484234 772118 063116 002120 193118 7702015–16230 8493 522227 327111 503109 785119 346117 5422014–15
OR I G I N A L
no.no.no.no.no.no.no.
TotalPublicPrivateTotalPrivateTotalPrivate
TOTALDWELLINGS EXCLUDINGHOUSESHOUSES
Per i od
DWELL ING UNITS APPROVED1
6 A B S • B U I L D I N G A P P R O V A L S • 8 7 3 1 . 0 • J U L Y 2 0 1 7
— nil or rounded to zero (including null cells)
0.79.70.60.40.11.01.0July0.711.00.50.2–0.11.11.1June0.29.00.1–0.7–0.91.01.0May
–0.25.9–0.2–1.3–1.40.90.8April0.21.80.2——0.50.4March0.5–1.70.51.21.3–0.1–0.2February
–0.4–4.9–0.3–0.1—–0.6–0.6January2017
–1.5–4.6–1.4–2.4–2.3–0.7–0.7December–2.5–6.1–2.4–4.6–4.5–0.6–0.6November–3.3–6.0–3.3–6.3–6.2–0.5–0.5October–3.5–2.2–3.5–6.3–6.3–0.6–0.6September–3.01.5–3.0–4.9–5.0–0.9–0.9August
2016
TR E N D
–1.7118.9–3.1–3.4–6.7–0.3—July11.729.711.521.321.34.44.0June–5.6–25.8–5.4–13.4–12.91.21.3May5.5–11.45.811.912.60.50.4April
–11.9–7.8–12.0–21.5–22.0–2.5–2.0March7.328.47.012.312.42.72.1February1.750.21.33.83.2–0.2–0.4January
2017–1.9–43.3–1.3–1.1–0.4–2.5–2.0December8.9–24.19.521.622.9–0.10.2November
–13.283.8–14.2–25.6–26.7–1.8–2.5October–13.5–54.7–12.7–25.1–24.21.01.5September
2.353.41.74.23.20.1–0.1August2016
SE A S O N A L L Y AD J U S T E D
1.294.5–0.17.33.8–3.5–3.2July3.922.73.714.314.2–2.9–3.3June
12.13.512.2–13.1–12.638.338.2May–7.9–18.0–7.712.813.5–22.6–22.9April–1.2–15.9–0.9–13.2–13.79.810.8March25.861.125.418.819.032.931.8February
–17.738.5–18.1–22.5–23.1–12.2–12.4January2017
–10.8–49.2–10.35.25.9–24.0–23.7December13.1–18.213.719.821.08.18.3November
–15.794.4–16.6–25.0–26.1–7.1–7.8October–11.9–63.0–10.9–18.3–17.2–4.9–4.1September
2.455.91.7–3.3–4.39.39.1August2016
–7.8–15.4–7.6–11.2–10.6–4.4–4.72016–173.2–1.13.35.95.70.71.02015–16
15.68.115.727.327.56.56.62014–15
OR I G I N A L
%%%%%%%
TotalPublicPrivateTotalPrivateTotalPrivate
TOTAL DWELLING UNITS
DWELLINGSEXCLUDINGHOUSESHOUSES
Per i od
DWELL ING UNITS APPROVED, Percentage change2
A B S • B U I L D I N G A P P R O V A L S • 8 7 3 1 . 0 • J U L Y 2 0 1 7 7
na not available
17 882426501931 6091 0293 4965 2185 861July17 753391551951 5971 0223 4905 1645 838June17 633364591971 5821 0013 4735 1825 775May17 591342621981 5779773 4345 2515 751April17 618326641971 5919533 3625 3985 727March17 577322681931 6239353 2525 5535 630February17 493353751871 6579253 1535 6345 509January
201717 559421841801 6879183 1485 6155 506December17 820495891731 7109173 2655 5275 644November18 273556921671 7149163 4645 4455 919October18 900587971621 7109173 6885 4446 293September19 5825701041611 7129313 8965 5586 649August
2016
TR E N D
18 299nana1761 5821 0003 3885 4066 266July18 619nana1981 7809973 4795 4206 171June16 676nana2191 4831 2573 3995 0874 940May17 669nana1801 5161 0373 8014 8305 916April16 740nana2091 5879293 0565 3915 114March19 007nana1851 6018763 5775 3946 962February17 722nana1881 6849122 9705 9195 741January
201717 431nana1971 6418513 1326 4234 681December17 765nana1601 9521 1233 1045 3355 498November16 320nana1591 5398403 2494 8355 198October18 804nana1661 6879203 6965 0116 289September21 742nana1651 6228564 4025 9048 121August
2016
SE A S O N A L L Y AD J U S T E D
18 924447521521 5749893 3965 6296 685July18 705522612141 8371 0523 8465 1556 018June18 001258592661 6631 4323 6855 4415 197May16 065300751711 2359163 6244 4075 337April17 435409592311 6519803 2355 5615 309March17 638345511841 5667573 2785 5905 867February14 017168991421 3557512 3224 4164 764January
201717 031442431911 5767912 8326 2034 953December19 089536701722 1321 1493 2555 8605 915November16 8733461311511 5678713 2294 7365 842October20 0189121261611 7679984 1275 3996 528September22 720627731841 7719224 4866 4808 177August
2016
219 7815 3979132 21620 15811 52742 21965 53371 8182016–17238 2564 7391 7032 42524 63112 56750 73468 09973 3582015–16230 8494 2611 8142 87232 70711 40046 70467 67263 4192014–15
OR I G I N A L
no.no.no.no.no.no.no.no.no.
Aust.ACTNTTas.WASAQldVic.NSW
Per i od
TOTAL DWELL ING UNITS APPROVED, States and ter r i to r ies3
8 A B S • B U I L D I N G A P P R O V A L S • 8 7 3 1 . 0 • J U L Y 2 0 1 7

— nil or rounded to zero (including null cells)na not available
0.78.8–9.7–1.00.80.80.21.00.4July0.77.5–6.2–1.01.02.00.5–0.31.1June0.26.6–5.3–0.40.32.41.1–1.30.4May
–0.24.8–2.90.5–0.92.52.1–2.70.4April0.21.1–5.11.9–2.01.93.4–2.81.7March0.5–8.6–9.93.4–2.11.13.1–1.42.2February
–0.4–16.2–10.74.0–1.80.70.20.30.1January2017
–1.5–15.0–5.43.9–1.30.2–3.61.6–2.5December–2.5–11.0–3.53.8–0.2—–5.71.5–4.7November–3.3–5.3–5.42.60.2—–6.1—–5.9October–3.53.0–6.70.8–0.1–1.6–5.3–2.0–5.3September–3.08.0–8.2–1.4–1.0–3.7–3.9–3.0–3.6August
2016
TR E N D
–1.7nana–11.4–11.20.3–2.6–0.31.5July11.7nana–9.620.0–20.72.36.524.9June–5.6nana21.6–2.121.2–10.65.3–16.5May5.5nana–13.8–4.511.724.4–10.415.7April
–11.9nana12.8–0.96.0–14.6—–26.6March7.3nana–1.5–5.0–3.920.4–8.921.3February1.7nana–4.52.67.2–5.2–7.922.6January
2017–1.9nana23.2–15.9–24.20.920.4–14.9December8.9nana0.726.933.7–4.510.35.8November
–13.2nana–4.2–8.8–8.7–12.1–3.5–17.4October–13.5nana0.44.07.5–16.0–15.1–22.6September
2.3nana–1.6–19.0–9.03.90.78.9August2016
SE A S O N A L L Y AD J U S T E D
1.2–14.4–14.8–29.0–14.3–6.0–11.79.211.1July3.9102.33.4–19.510.5–26.54.4–5.315.8June
12.1–14.0–21.355.634.756.31.723.5–2.6May–7.9–26.727.1–26.0–25.2–6.512.0–20.80.5April–1.218.615.725.55.429.5–1.3–0.5–9.5March25.8105.4–48.529.615.60.841.226.623.2February
–17.7–62.0130.2–25.7–14.0–5.1–18.0–28.8–3.8January2017
–10.8–17.5–38.611.0–26.1–31.2–13.05.9–16.3December13.154.9–46.613.936.131.90.823.71.2November
–15.7–62.14.0–6.2–11.3–12.7–21.8–12.3–10.5October–11.945.572.6–12.5–0.28.2–8.0–16.7–20.2September
2.417.910.623.5–13.11.54.33.13.4August2016
–7.813.9–46.4–8.6–18.2–8.3–16.8–3.8–2.12016–173.211.2–6.1–15.6–24.710.28.60.615.72015–16
15.6–8.1–15.231.55.9–2.218.923.417.22014–15
OR I G I N A L
%%%%%%%%%
Aust.ACTNTTas.WASAQldVic.NSW
Per i od
TOTAL DWELL ING UNITS APPROVED, States and ter r i to r ies —Percentage change4
A B S • B U I L D I N G A P P R O V A L S • 8 7 3 1 . 0 • J U L Y 2 0 1 7 9

na not available
9 656nanana1 1496732 0403 0882 438July9 560nanana1 1516672 0093 0552 418June9 457nanana1 1516591 9743 0222 398May9 363nanana1 1536501 9462 9902 375April9 287nanana1 1556401 9312 9662 350March9 249nanana1 1596301 9382 9492 326February9 264nanana1 1646251 9612 9402 317January
20179 322nanana1 1706251 9842 9392 331December9 385nanana1 1796291 9932 9442 348November9 437nanana1 1866351 9862 9582 366October9 480nanana1 1946451 9742 9702 383September9 538nanana1 2016581 9692 9842 408August
2016
TR E N D
9 743nanana1 1906931 9993 1512 438July9 745nanana1 1306382 2183 0442 454June9 368nanana1 1086511 9862 9882 371May9 245nanana1 1526781 7733 0252 361April9 204nanana1 2156561 8352 9552 315March9 395nanana1 1416042 0462 8912 487February9 203nanana1 1656232 0142 9712 174January
20179 243nanana1 1186151 9442 9642 315December9 436nanana1 2126341 9892 9622 340November9 414nanana1 2006222 0342 9082 366October9 658nanana1 1926872 0052 9452 479September9 511nanana1 1946501 8433 0382 472August
2016
SE A S O N A L L Y AD J U S T E D
10 002102441201 2287342 1173 2102 447July10 32971401731 1636672 4653 1002 650June10 68579492071 2317622 2213 4062 730May7 73262471289226191 4322 6021 920April
10 02673311411 2756701 9523 2542 630March9 05062221141 0865631 9202 8972 386February6 86648411009344661 6092 1031 565January
20177 83865361651 0245651 5512 4411 991December
10 278121411621 3256732 1243 2512 581November9 49073571251 2396112 0152 9412 429October
10 293121921431 2837402 1983 1202 596September10 728138461691 3397122 1223 4272 775August
2016
113 1461 0315521 76414 0897 67723 67435 74228 6172016–17118 7701 0937451 97917 3358 26124 38535 90229 0702015–16117 5421 2757612 40322 9897 76022 85132 93826 5652014–15
OR I G I N A L
no.no.no.no.no.no.no.no.no.
Aust.ACTNTTas.WASAQldVic.NSW
Per i od
PRIVATE SECTOR HOUSES APPROVED, States and ter r i to r ies5
10 A B S • B U I L D I N G A P P R O V A L S • 8 7 3 1 . 0 • J U L Y 2 0 1 7

— nil or rounded to zero (including null cells)na not available
1.0nanana–0.10.91.51.10.8July1.1nanana—1.21.71.10.9June1.0nanana–0.21.31.41.10.9May0.8nanana–0.21.60.80.81.1April0.4nanana–0.31.6–0.30.61.0March
–0.2nanana–0.40.9–1.20.30.4February–0.6nanana–0.6—–1.1—–0.6January
2017–0.7nanana–0.7–0.6–0.5–0.2–0.8December–0.6nanana–0.6–1.00.4–0.5–0.8November–0.5nanana–0.7–1.50.6–0.4–0.7October–0.6nanana–0.6–2.00.2–0.5–1.0September–0.9nanana–0.8–2.4–0.4–0.8–1.3August
2016
TR E N D
—nanana5.48.6–9.93.5–0.7July4.0nanana2.0–2.011.71.93.5June1.3nanana–3.8–3.912.0–1.20.4May0.4nanana–5.23.3–3.42.42.0April
–2.0nanana6.58.6–10.32.2–6.9March2.1nanana–2.1–3.01.6–2.714.4February
–0.4nanana4.21.33.60.2–6.1January2017
–2.0nanana–7.8–2.9–2.30.1–1.1December0.2nanana1.01.8–2.21.9–1.1November
–2.5nanana0.7–9.41.5–1.3–4.6October1.5nanana–0.25.78.8–3.10.3September
–0.1nanana–4.92.2–7.50.76.7August2016
SE A S O N A L L Y AD J U S T E D
–3.243.710.0–30.65.610.0–14.13.5–7.7July–3.3–10.1–18.4–16.4–5.5–12.511.0–9.0–2.9June38.227.44.361.733.523.155.130.942.2May
–22.9–15.151.6–9.2–27.7–7.6–26.6–20.0–27.0April10.817.740.923.717.419.01.712.310.2March31.829.2–46.314.016.320.819.337.852.5February
–12.4–26.213.9–39.4–8.8–17.53.7–13.8–21.4January2017
–23.7–46.3–12.21.9–22.7–16.0–27.0–24.9–22.9December8.365.8–28.129.66.910.15.410.56.3November
–7.8–39.7–38.0–12.6–3.4–17.4–8.3–5.7–6.4October–4.1–12.3100.0–15.4–4.23.93.6–9.0–6.5September9.116.9–8.023.45.613.22.87.117.4August
2016
–4.7–5.7–25.9–10.9–18.7–7.1–2.9–0.4–1.62016–171.0–14.3–2.1–17.6–24.66.56.79.09.42015–166.6–25.61.233.5–2.8–7.48.210.015.72014–15
OR I G I N A L
%%%%%%%%%
Aust.ACTNTTas.WASAQldVic.NSW
Per i od
PRIVATE SECTOR HOUSES APPROVED, States and ter r i to r ies —Percentage change6
A B S • B U I L D I N G A P P R O V A L S • 8 7 3 1 . 0 • J U L Y 2 0 1 7 11

— nil or rounded to zero (including null cells)
18 924447521521 5749893 3965 6296 685July18 705522612141 8371 0523 8465 1556 018June18 001258592661 6631 4323 6855 4415 197May16 065300751711 2359163 6244 4075 337April17 435409592311 6519803 2355 5615 309March17 638345511841 5667573 2785 5905 867February14 017168991421 3557512 3224 4164 764January
201717 031442431911 5767912 8326 2034 953December19 089536701722 1321 1493 2555 8605 915November16 8733461311511 5678713 2294 7365 842October20 0189121261611 7679984 1275 3996 528September22 720627731841 7719224 4866 4808 177August
2016
219 7815 3979132 21620 15811 52742 21965 53371 8182016–17238 2564 7391 7032 42524 63112 56750 73468 09973 3582015–16230 8494 2611 8142 87232 70711 40046 70467 67263 4192014–15
TO T A L DW E L L I N G UN I T S
8 7493454303202381 2352 3734 204July8 1574515396233631 2772 0543 345June7 1351792574086521 3781 9982 461May8 210238—382822702 1801 7853 417April7 28133614892923031 2782 2992 670March8 38928117694381831 3132 6443 444February7 06012040423832777072 3083 183January
20179 1043774264972261 2643 7512 959December8 6554138107404601 1032 6023 319November7 22327354252632501 1681 7803 410October9 63579121184262541 9212 2763 928September
11 7974859153311932 3583 0395 367August2016
104 8454 3431854405 3643 70018 16429 61943 0302016–17118 0633 6428024386 8844 13326 14032 10343 9212015–16111 5032 9549074609 0393 44223 53834 45136 7122014–15
DW E L L I N G S EX C L U D I N G HO U S E S
10 175102481221 2547512 1613 2562 481July10 54871561751 2146892 5693 1012 673June10 86679572091 2557802 3073 4432 736May7 85562751339536461 4442 6221 920April
10 15473451421 3596771 9573 2622 639March9 24964341151 1285741 9652 9462 423February6 95748591009724741 6152 1081 581January
20177 92765391651 0795651 5682 4521 994December
10 434123621621 3926892 1523 2582 596November9 65073771261 3046212 0612 9562 432October
10 3831211051431 3417442 2063 1232 600September10 923142641691 4407292 1283 4412 810August
2016
114 9361 0547281 77614 7947 82724 05535 91428 7882016–17120 1931 0979011 98717 7478 43424 59435 99629 4372015–16119 3461 3079072 41223 6687 95823 16633 22126 7072014–15
HO U S E S
no.no.no.no.no.no.no.no.no.
Aust.ACTNTTas.WASAQldVic.NSW
Per i od
DWELL ING UNITS APPROVED, States and ter r i to r ies : Or ig ina l7
12 A B S • B U I L D I N G A P P R O V A L S • 8 7 3 1 . 0 • J U L Y 2 0 1 7

— nil or rounded to zero (including null cells)(a) For further information about the geographic classification refer to the Explanatory Notes.
44742611 3268122 0704 6265 284July52236931 5528712 2914 3094 539June258481331 4141 2672 1554 3823 505May30046661 0647922 0733 6544 260April409241301 4208311 9124 5694 036March34532981 3926421 4494 7064 741February16879861 1716301 2023 8593 814January
201744235781 3876691 5585 5024 000December53645851 8671 0231 6334 8944 565November34696511 3347291 9623 9654 613October912119691 5448162 6624 4775 192September62753861 5437762 5585 5586 705August
2016
5 3976681 03117 5169 79224 04455 34956 6532016–174 7391 4261 00221 32610 53431 02557 24556 5782015–164 2611 6601 26728 5099 15629 62556 70248 1962014–15
TO T A L
345—172992349132 2903 719July451—216213519111 9862 914June1792303946481 0441 8371 869May238—102722631 4521 7193 117April3363582803039052 2152 319March28111484301744762 5643 243February12040333792754312 2942 970January
20173774224852227793 7242 806December4138—7174605062 5652 956November2734262432508891 7453 084October7912194052441 6322 2193 593September485—53121891 5042 9895 036August
2016
4 3431402435 2133 64512 15128 91039 1622016–173 6427162036 6104 06119 19131 31938 9672015–162 9548302118 6553 37218 34533 49632 5632014–15
DW E L L I N G S EX C L U D I N G HO U S E S
10242441 0275781 1572 3361 565July7136729315201 3802 3231 625June79461031 0206191 1112 5451 636May6246567925296211 9351 143April7321721 1405281 0072 3541 717March6421509624689732 1421 498February4839537923557711 565844January
20176531569024477791 7781 194December
12337851 1505631 1272 3291 609November7354451 0914791 0732 2201 529October
12198601 1395721 0302 2581 599September14253811 2315871 0542 5691 669August
2016
1 05452878812 3036 14711 89326 43917 4912016–171 09771079914 7166 47311 83425 92617 6112015–161 3078301 05619 8545 78411 28023 20615 6332014–15
HO U S E S
no.no.no.no.no.no.no.no.
Australian
Capital
Territory
Greater
Darwin
Greater
Hobart
Greater
Perth
Greater
Adelaide
Greater
Brisbane
Greater
Melbourne
Greater
Sydney
DWELL ING UNITS APPROVED, By Greate r Cap i ta l Ci t y Stat i s t i ca l Area(a) : Or ig ina l8
A B S • B U I L D I N G A P P R O V A L S • 8 7 3 1 . 0 • J U L Y 2 0 1 7 13

— nil or rounded to zero (including null cells)
18 924228558 68710 152July18 7058301817 97310 513June18 001828427 09510 828May16 065617798 1347 829April17 4357143657 09210 128March17 6381851698 2699 231February14 017410377 0286 938January
201717 0318221738 8417 888December19 0891743828 54110 406November16 87314111367 0729 640October20 018722799 55410 356September22 720151410011 68510 906August
2016
219 7811308141 026103 178114 6332016–17238 2561011 0121 649115 561119 9332015–16230 8491641 0811 266109 168119 1702014–15
TO T A L
494—167298173July254——530219June207———26181May200———77123April2441——115128March290———91199February180——18891January
2017130——23989December2561——99156November313———153160October161———7190September435—1—240194August
2016
2 9492181 1491 7892016–173 4843442 0501 4232015–163 5221020171 6711 8042014–15
PU B L I C SE C T O R
18 430212488 3899 979July18 4518301767 94310 294June17 794828427 06910 647May15 865617798 0577 706April17 1916143656 97710 000March17 3481851698 1789 032February13 837410366 9406 847January
201716 9018221718 8027 799December18 8331643828 44210 250November16 56014111366 9199 480October19 857722799 48310 266September22 285151310011 44510 712August
2016
216 8321288131 018102 029112 8442016–17234 772981 0081 645113 511118 5102015–16227 3271541 0611 249107 497117 3662014–15
PR I V A T E SE C T O R
no.no.no.no.no.no.
Totaldwelling
unitsNon-residential
buildingConversions
Alterations and
additions to
residential
building creating
dwellings
New other
residential
building
New
houses
Pe r i od
DWELL ING UNITS APPROVED, By secto r : Or ig ina l9
14 A B S • B U I L D I N G A P P R O V A L S • 8 7 3 1 . 0 • J U L Y 2 0 1 7
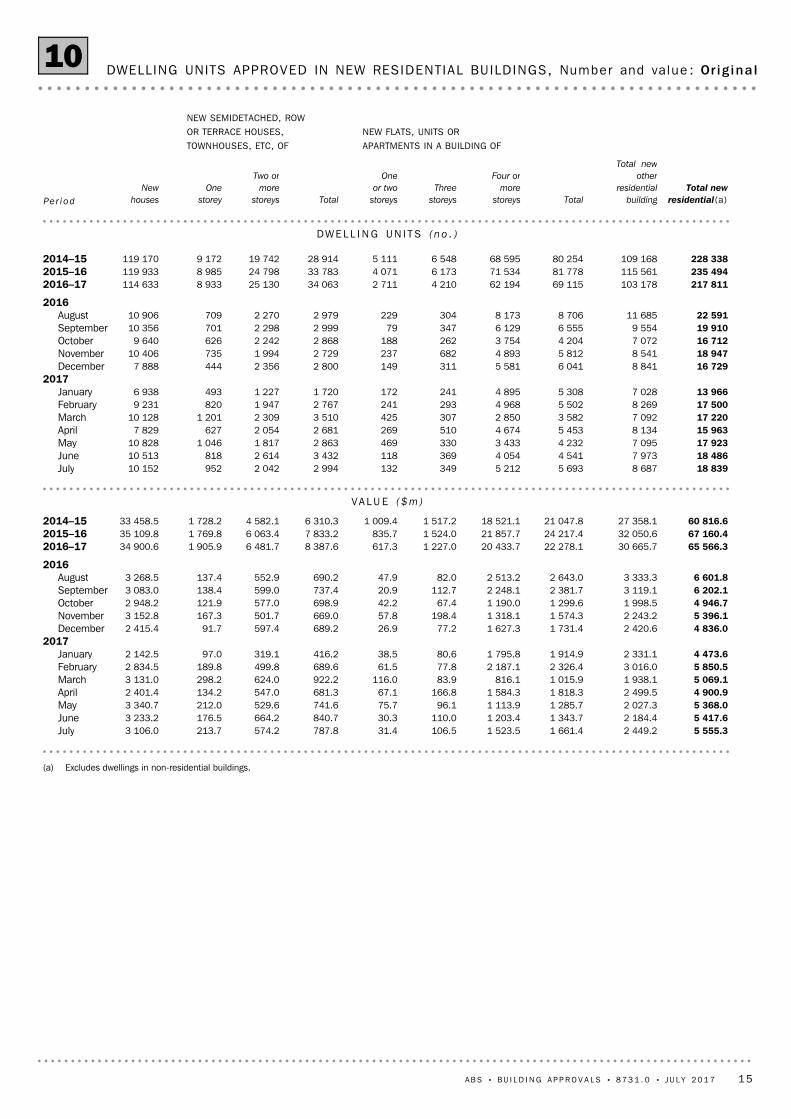
(a) Excludes dwellings in non-residential buildings.
5 555.32 449.21 661.41 523.5106.531.4787.8574.2213.73 106.0July5 417.62 184.41 343.71 203.4110.030.3840.7664.2176.53 233.2June5 368.02 027.31 285.71 113.996.175.7741.6529.6212.03 340.7May4 900.92 499.51 818.31 584.3166.867.1681.3547.0134.22 401.4April5 069.11 938.11 015.9816.183.9116.0922.2624.0298.23 131.0March5 850.53 016.02 326.42 187.177.861.5689.6499.8189.82 834.5February4 473.62 331.11 914.91 795.880.638.5416.2319.197.02 142.5January
20174 836.02 420.61 731.41 627.377.226.9689.2597.491.72 415.4December5 396.12 243.21 574.31 318.1198.457.8669.0501.7167.33 152.8November4 946.71 998.51 299.61 190.067.442.2698.9577.0121.92 948.2October6 202.13 119.12 381.72 248.1112.720.9737.4599.0138.43 083.0September6 601.83 333.32 643.02 513.282.047.9690.2552.9137.43 268.5August
2016
65 566.330 665.722 278.120 433.71 227.0617.38 387.66 481.71 905.934 900.62016–1767 160.432 050.624 217.421 857.71 524.0835.77 833.26 063.41 769.835 109.82015–1660 816.627 358.121 047.818 521.11 517.21 009.46 310.34 582.11 728.233 458.52014–15
VA L U E ( $ m )
18 8398 6875 6935 2123491322 9942 04295210 152July18 4867 9734 5414 0543691183 4322 61481810 513June17 9237 0954 2323 4333304692 8631 8171 04610 828May15 9638 1345 4534 6745102692 6812 0546277 829April17 2207 0923 5822 8503074253 5102 3091 20110 128March17 5008 2695 5024 9682932412 7671 9478209 231February13 9667 0285 3084 8952411721 7201 2274936 938January
201716 7298 8416 0415 5813111492 8002 3564447 888December18 9478 5415 8124 8936822372 7291 99473510 406November16 7127 0724 2043 7542621882 8682 2426269 640October19 9109 5546 5556 129347792 9992 29870110 356September22 59111 6858 7068 1733042292 9792 27070910 906August
2016
217 811103 17869 11562 1944 2102 71134 06325 1308 933114 6332016–17235 494115 56181 77871 5346 1734 07133 78324 7988 985119 9332015–16228 338109 16880 25468 5956 5485 11128 91419 7429 172119 1702014–15
DW E L L I N G UN I T S ( n o . )
Total
Four or
more
storeys
Three
storeys
One
or two
storeysTotal
Two or
more
storeys
One
storey
Total newresidential(a)
Total new
other
residential
building
NEW FLATS, UNITS ORAPARTMENTS IN A BUILDING OF
NEW SEMIDETACHED, ROWOR TERRACE HOUSES,TOWNHOUSES, ETC, OF
New
housesPe r i od
DWELL ING UNITS APPROVED IN NEW RESIDENT IAL BUILDINGS, Number and value : Or ig ina l10
A B S • B U I L D I N G A P P R O V A L S • 8 7 3 1 . 0 • J U L Y 2 0 1 7 15

10 060.14 120.25 939.9673.45 266.4July9 934.43 995.95 938.5661.55 277.0June9 784.93 850.45 934.5655.95 278.6May9 620.53 671.65 948.9652.35 296.6April9 412.73 441.95 970.8653.95 316.9March9 152.83 204.55 948.3660.95 287.3February8 983.53 089.75 893.9666.85 227.1January
20178 992.33 123.35 869.0666.15 202.8December9 183.13 277.45 905.7656.75 249.0November9 475.93 471.06 005.0641.95 363.0October9 789.03 629.16 159.9631.85 528.1September
10 025.43 684.36 341.1631.85 709.3August2016
TR E N D
10 051.64 064.75 986.9670.25 316.6July10 090.93 970.86 120.1707.75 412.4June9 761.33 935.65 825.8655.45 170.3May9 632.83 760.65 872.3580.55 291.8April9 002.93 442.75 560.1678.24 882.0March
10 551.63 496.97 054.7682.06 372.7February8 694.02 675.26 018.7616.95 401.8January
20178 893.03 091.05 802.0741.25 060.8December8 746.82 954.55 792.3639.65 152.7November8 433.13 030.25 402.9673.34 729.6October
11 983.15 813.16 170.0580.65 589.4September10 077.93 005.47 072.5618.16 454.4August
2016
SE A S O N A L L Y AD J U S T E D
10 267.64 032.96 234.7679.55 555.3July10 071.53 890.36 181.2763.65 417.6June10 795.74 706.06 089.8721.85 368.0May8 656.83 238.75 418.1517.24 900.9April9 229.73 402.05 827.7758.65 069.1March9 835.13 318.76 516.4665.95 850.5February7 414.72 499.64 915.1441.54 473.6January
20178 463.32 993.25 470.1634.14 836.0December9 301.13 247.96 053.1657.15 396.1November8 557.62 929.25 628.4681.74 946.7October
12 360.55 500.06 860.5658.46 202.1September10 563.83 288.57 275.4673.66 601.8August
2016
115 975.742 575.073 400.67 834.365 566.32016–17112 029.436 947.075 082.57 922.067 160.42015–16100 227.931 882.168 345.87 529.260 816.62014–15
OR I G I N A L
$m$m$m$m$m
Totalbuilding
Non-
residential
building
Total
residential
building
Alterations
and additions
including
conversions
to residential
buildings
New
residential
building
Pe r i od
VALUE OF BUILD ING APPROVED11
16 A B S • B U I L D I N G A P P R O V A L S • 8 7 3 1 . 0 • J U L Y 2 0 1 7

— nil or rounded to zero (including null cells)
1.33.1—1.8–0.2July1.53.80.10.8—June1.74.9–0.20.6–0.3May2.26.7–0.4–0.3–0.4April2.87.40.4–1.10.6March1.93.70.9–0.91.2February
–0.1–1.10.40.10.5January2017
–2.1–4.7–0.61.4–0.9December–3.1–5.6–1.72.3–2.1November–3.2–4.4–2.51.6–3.0October–2.4–1.5–2.9—–3.2September–1.01.9–2.6–1.4–2.7August
2016
TR E N D
–0.42.4–2.2–5.3–1.8July3.40.95.18.04.7June1.34.7–0.812.9–2.3May7.09.25.6–14.48.4April
–14.7–1.5–21.2–0.6–23.4March21.430.717.210.618.0February–2.2–13.53.7–16.86.7January
20171.74.60.215.9–1.8December3.7–2.57.2–5.08.9November
–29.6–47.9–12.416.0–15.4October18.993.4–12.8–6.1–13.4September1.0–12.07.8–3.89.0August
2016
SE A S O N A L L Y AD J U S T E D
1.93.70.9–11.02.5July–6.7–17.31.55.80.9June24.745.312.439.69.5May–6.2–4.8–7.0–31.8–3.3April–6.22.5–10.613.9–13.4March32.632.832.650.830.8February
–12.4–16.5–10.1–30.4–7.5January2017
–9.0–7.8–9.6–3.5–10.4December8.710.97.5–3.69.1November
–30.8–46.7–18.03.5–20.2October17.067.3–5.7–2.3–6.1September–1.5–7.71.51.91.5August
20163.515.2–2.2–1.1–2.42016–17
11.815.99.95.210.42015–164.8–13.816.59.417.42014–15
OR I G I N A L
%%%%%
Totalbuilding
Non-residential
building
Total
residential
building
Alterations
and additions
including
conversions
to residential
buildings
New
residential
building
Pe r i od
VALUE OF BUILD ING APPROVED, Percentage change12
A B S • B U I L D I N G A P P R O V A L S • 8 7 3 1 . 0 • J U L Y 2 0 1 7 17
na not available
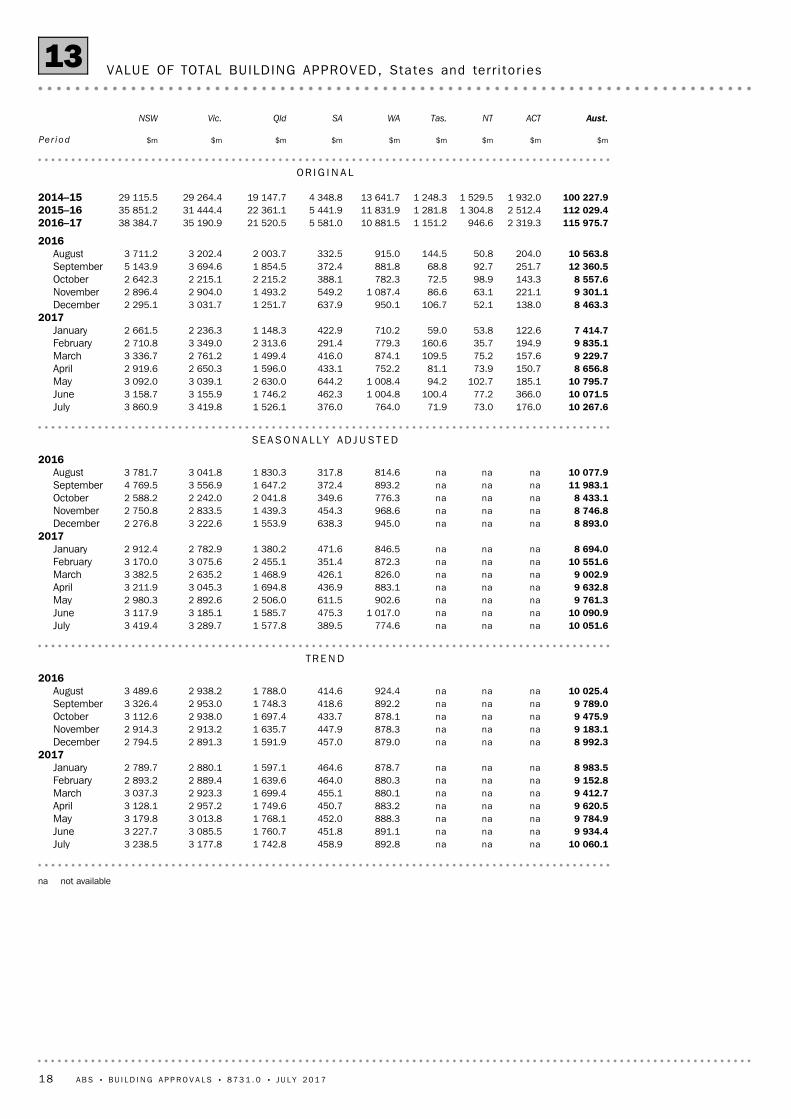
10 060.1nanana892.8458.91 742.83 177.83 238.5July9 934.4nanana891.1451.81 760.73 085.53 227.7June9 784.9nanana888.3452.01 768.13 013.83 179.8May9 620.5nanana883.2450.71 749.62 957.23 128.1April9 412.7nanana880.1455.11 699.42 923.33 037.3March9 152.8nanana880.3464.01 639.62 889.42 893.2February8 983.5nanana878.7464.61 597.12 880.12 789.7January
20178 992.3nanana879.0457.01 591.92 891.32 794.5December9 183.1nanana878.3447.91 635.72 913.22 914.3November9 475.9nanana878.1433.71 697.42 938.03 112.6October9 789.0nanana892.2418.61 748.32 953.03 326.4September
10 025.4nanana924.4414.61 788.02 938.23 489.6August2016
TR E N D
10 051.6nanana774.6389.51 577.83 289.73 419.4July10 090.9nanana1 017.0475.31 585.73 185.13 117.9June9 761.3nanana902.6611.52 506.02 892.62 980.3May9 632.8nanana883.1436.91 694.83 045.33 211.9April9 002.9nanana826.0426.11 468.92 635.23 382.5March
10 551.6nanana872.3351.42 455.13 075.63 170.0February8 694.0nanana846.5471.61 380.22 782.92 912.4January
20178 893.0nanana945.0638.31 553.93 222.62 276.8December8 746.8nanana968.6454.31 439.32 833.52 750.8November8 433.1nanana776.3349.62 041.82 242.02 588.2October
11 983.1nanana893.2372.41 647.23 556.94 769.5September10 077.9nanana814.6317.81 830.33 041.83 781.7August
2016
SE A S O N A L L Y AD J U S T E D
10 267.6176.073.071.9764.0376.01 526.13 419.83 860.9July10 071.5366.077.2100.41 004.8462.31 746.23 155.93 158.7June10 795.7185.1102.794.21 008.4644.22 630.03 039.13 092.0May8 656.8150.773.981.1752.2433.11 596.02 650.32 919.6April9 229.7157.675.2109.5874.1416.01 499.42 761.23 336.7March9 835.1194.935.7160.6779.3291.42 313.63 349.02 710.8February7 414.7122.653.859.0710.2422.91 148.32 236.32 661.5January
20178 463.3138.052.1106.7950.1637.91 251.73 031.72 295.1December9 301.1221.163.186.61 087.4549.21 493.22 904.02 896.4November8 557.6143.398.972.5782.3388.12 215.22 215.12 642.3October
12 360.5251.792.768.8881.8372.41 854.53 694.65 143.9September10 563.8204.050.8144.5915.0332.52 003.73 202.43 711.2August
2016
115 975.72 319.3946.61 151.210 881.55 581.021 520.535 190.938 384.72016–17112 029.42 512.41 304.81 281.811 831.95 441.922 361.131 444.435 851.22015–16100 227.91 932.01 529.51 248.313 641.74 348.819 147.729 264.429 115.52014–15
OR I G I N A L
$m$m$m$m$m$m$m$m$m
Aust.ACTNTTas.WASAQldVic.NSW
Per i od
VALUE OF TOTAL BUILD ING APPROVED, States and ter r i to r ies13
18 A B S • B U I L D I N G A P P R O V A L S • 8 7 3 1 . 0 • J U L Y 2 0 1 7

— nil or rounded to zero (including null cells)na not available
1.3nanana0.21.6–1.03.00.3July1.5nanana0.3–0.1–0.42.41.5June1.7nanana0.60.31.11.91.7May2.2nanana0.3–1.03.01.23.0April2.8nanana—–1.93.61.25.0March1.9nanana0.2–0.12.70.33.7February
–0.1nanana—1.70.3–0.4–0.2January2017
–2.1nanana0.12.0–2.7–0.8–4.1December–3.1nanana—3.3–3.6–0.8–6.4November–3.2nanana–1.63.6–2.9–0.5–6.4October–2.4nanana–3.51.0–2.20.5–4.7September–1.0nanana–4.6–3.3–1.51.5–1.8August
2016
TR E N D
–0.4nanana–23.8–18.1–0.53.39.7July3.4nanana12.7–22.3–36.710.14.6June1.3nanana2.240.047.9–5.0–7.2May7.0nanana6.92.515.415.6–5.0April
–14.7nanana–5.321.3–40.2–14.36.7March21.4nanana3.0–25.577.910.58.8February–2.2nanana–10.4–26.1–11.2–13.627.9January
20171.7nanana–2.440.58.013.7–17.2December3.7nanana24.830.0–29.526.46.3November
–29.6nanana–13.1–6.124.0–37.0–45.7October18.9nanana9.617.2–10.016.926.1September1.0nanana–25.4–50.24.611.315.2August
2016
SE A S O N A L L Y AD J U S T E D
1.9–51.9–5.4–28.4–24.0–18.7–12.68.422.2July–6.797.7–24.86.6–0.4–28.2–33.63.82.2June24.722.839.016.234.148.864.814.75.9May–6.2–4.4–1.8–25.9–13.94.16.4–4.0–12.5April–6.2–19.1110.9–31.812.242.8–35.2–17.623.1March32.659.0–33.7172.09.7–31.1101.549.81.8February
–12.4–11.23.3–44.7–25.2–33.7–8.3–26.216.0January2017
–9.0–37.6–17.523.2–12.616.1–16.24.4–20.8December8.754.3–36.219.439.041.5–32.631.19.6November
–30.8–43.16.65.4–11.34.219.4–40.0–48.6October17.023.482.6–52.4–3.612.0–7.415.438.6September–1.510.6–70.2114.9–19.5–47.313.38.5–2.8August
20163.5–7.7–27.4–10.2–8.02.6–3.811.97.12016–17
11.830.0–14.72.7–13.325.116.87.423.12015–164.8–4.311.3–2.9–4.70.59.313.30.52014–15
OR I G I N A L
%%%%%%%%%
Aust.ACTNTTas.WASAQldVic.NSW
Per i od
VALUE OF TOTAL BUILDING APPROVED, States and ter r i to r ies —Percentage change14
A B S • B U I L D I N G A P P R O V A L S • 8 7 3 1 . 0 • J U L Y 2 0 1 7 19

na not available
5 939.9nanana516.6291.91 117.71 833.81 956.1July5 938.5nanana503.2286.01 123.71 821.81 980.7June5 934.5nanana490.9278.51 126.71 830.51 985.5May5 948.9nanana479.9270.01 122.81 861.61 993.8April5 970.8nanana475.2261.81 105.81 922.41 987.0March5 948.3nanana479.4255.51 069.91 981.41 944.8February5 893.9nanana488.9251.31 027.22 010.91 896.7January
20175 869.0nanana503.1248.31 002.01 998.81 893.1December5 905.7nanana519.4246.81 009.41 955.51 948.7November6 005.0nanana530.7245.71 041.21 909.22 051.9October6 159.9nanana536.7243.71 084.51 886.12 182.6September6 341.1nanana538.5244.71 133.11 899.32 299.4August
2016
TR E N D
5 986.9nanana482.4286.31 088.61 934.11 993.9July6 120.1nanana590.6280.11 074.01 866.62 071.2June5 825.8nanana468.9368.61 189.11 835.71 787.3May5 872.3nanana454.7268.61 148.91 764.02 024.8April5 560.1nanana466.7254.1992.71 781.81 857.1March7 054.7nanana477.2242.21 796.81 929.62 381.2February6 018.7nanana455.0247.8916.62 265.91 931.3January
20175 802.0nanana538.4255.3996.02 237.91 547.4December5 792.3nanana569.1268.3945.71 863.81 909.6November5 402.9nanana498.0232.0995.51 582.11 873.1October6 170.0nanana493.9246.81 074.91 890.62 207.4September7 072.5nanana534.9230.51 292.71 978.62 820.1August
2016
SE A S O N A L L Y AD J U S T E D
6 234.7131.826.745.7477.3276.01 079.91 974.62 222.6July6 181.2152.229.967.3583.0282.41 226.21 790.32 049.9June6 089.875.430.374.5496.9415.41 254.01 952.51 790.8May5 418.193.236.754.4390.0250.61 119.21 590.81 883.0April5 827.7130.229.963.9506.8257.91 066.31 956.11 816.6March6 516.4149.518.556.5468.2199.41 601.61 997.02 025.7February4 915.156.932.643.8367.4215.1757.41 743.01 698.9January
20175 470.1120.719.756.9507.8218.5810.32 078.41 657.7December6 053.1146.243.753.6658.9314.1988.01 928.61 920.2November5 628.4104.554.049.6519.8253.01 015.21 610.92 021.3October6 860.5224.852.149.0520.3263.61 246.72 011.92 492.1September7 275.4167.635.459.2539.6247.61 361.32 137.72 727.0August
201673 400.61 575.9409.5675.76 221.73 155.613 698.322 918.724 745.42016–1775 082.51 372.3632.6721.47 270.63 247.815 026.922 249.724 561.32015–1668 345.81 240.5645.6769.69 469.62 883.313 074.920 524.519 737.92014–15
OR I G I N A L
$m$m$m$m$m$m$m$m$m
Aust. ACT NT Tas. WA SA Qld Vic. NSW
VALUE OF RESIDENT IAL BUILD ING APPROVED, States and ter r i to r ies15
20 A B S • B U I L D I N G A P P R O V A L S • 8 7 3 1 . 0 • J U L Y 2 0 1 7

na not available
4 120.2nanana376.1167.0625.01 344.01 282.4July3 995.9nanana387.9165.8637.01 263.71 247.0June3 850.4nanana397.4173.5641.41 183.41 194.3May3 671.6nanana403.2180.7626.81 095.61 134.3April3 441.9nanana405.0193.3593.61 000.81 050.3March3 204.5nanana400.9208.6569.6908.0948.4February3 089.7nanana389.7213.3569.9869.2892.9January
20173 123.3nanana375.9208.7589.9892.4901.5December3 277.4nanana358.9201.1626.3957.7965.7November3 471.0nanana347.4188.0656.21 028.81 060.7October3 629.1nanana355.5174.9663.81 066.91 143.8September3 684.3nanana385.9169.8654.91 038.91 190.1August
2016
TR E N D
4 064.7nanana292.2103.2489.21 355.61 425.5July3 970.8nanana426.3195.2511.71 318.61 046.6June3 935.6nanana433.8242.91 317.01 056.91 193.0May3 760.6nanana428.4168.3545.91 281.41 187.1April3 442.7nanana359.3172.0476.1853.31 525.3March3 496.9nanana395.2109.2658.31 146.0788.8February2 675.2nanana391.5223.9463.7517.0981.1January
20173 091.0nanana406.6383.1557.9984.8729.3December2 954.5nanana399.4186.1493.6969.7841.3November3 030.2nanana278.3117.51 046.3659.9715.1October5 813.1nanana399.3125.6572.31 666.32 562.1September3 005.4nanana279.887.3537.71 063.2961.6August
2016
SE A S O N A L L Y AD J U S T E D
4 032.944.246.326.2286.799.9446.11 445.11 638.3July3 890.3213.847.333.2421.8179.9520.01 365.61 108.8June4 706.0109.772.419.7511.6228.81 376.01 086.61 301.2May3 238.757.437.126.6362.2182.5476.81 059.41 036.6April3 402.027.445.345.6367.4158.1433.0805.11 520.0March3 318.745.417.2104.1311.191.9712.01 352.0685.1February2 499.665.721.215.2342.8207.9390.9493.3962.6January
20172 993.217.332.349.8442.2419.4441.4953.3637.4December3 247.975.019.433.0428.4235.2505.2975.4976.2November2 929.238.844.822.9262.5135.11 200.1604.1621.0October5 500.027.040.619.8361.5108.7607.81 682.72 651.8September3 288.536.415.385.3375.484.9642.41 064.7984.1August
2016
42 575.0743.4537.1475.54 659.82 425.47 822.312 272.213 639.32016–1736 947.01 140.1672.1560.44 561.32 194.27 334.39 194.711 289.92015–1631 882.1691.5883.9478.74 172.11 465.56 072.98 739.99 377.72014–15
OR I G I N A L
$m$m$m$m$m$m$m$m$m
Aust.ACTNTTas.WASAQldVic.NSW
Per i od
VALUE OF NON- RESIDENT IAL BUILD ING APPROVED, States and ter r i to r ies16
A B S • B U I L D I N G A P P R O V A L S • 8 7 3 1 . 0 • J U L Y 2 0 1 7 21

— nil or rounded to zero (including null cells)
10 267.64 032.96 234.77.3666.35.92 449.23 106.0July10 071.53 890.36 181.25.9704.653.12 184.43 233.2June10 795.74 706.06 089.84.1713.64.02 027.33 340.7May8 656.83 238.75 418.13.9499.813.42 499.52 401.4April9 229.73 402.05 827.710.4734.713.61 938.13 131.0March9 835.13 318.76 516.415.9637.712.33 016.02 834.5February7 414.72 499.64 915.11.3437.23.02 331.12 142.5January
20178 463.32 993.25 470.174.8535.523.82 420.62 415.4December9 301.13 247.96 053.15.7640.011.42 243.23 152.8November8 557.62 929.25 628.41.0639.241.51 998.52 948.2October
12 360.55 500.06 860.51.1646.211.13 119.13 083.0September10 563.83 288.57 275.41.8655.616.23 333.33 268.5August
2016
115 975.742 575.073 400.6168.47 450.6215.430 665.734 900.62016–17112 029.436 947.075 082.5296.07 312.6313.532 050.635 109.82015–16100 227.931 882.168 345.8274.77 034.7219.927 358.133 458.52014–15
TO T A L
1 143.21 019.1124.02.76.10.479.235.5July736.2645.790.6—8.00.210.871.6June
1 196.21 107.888.4—24.9—6.856.8May647.3587.260.2—12.3—18.629.3April
1 131.91 042.389.6—26.3—29.733.6March950.2857.293.0—19.0—21.952.1February729.4665.364.1—18.0—19.127.0January
2017832.1773.658.6—27.10.17.424.0December642.1551.091.1—18.3—27.145.7November612.8521.791.1—13.0—35.542.6October944.3891.852.5—14.3—14.623.7September931.6804.9126.70.25.9—69.551.1August
2016
10 416.09 441.5974.50.2191.20.2287.7495.22016–1710 820.19 759.31 060.80.5128.80.4531.0400.22015–167 816.36 775.51 040.82.1123.87.5420.7486.72014–15
PU B L I C SE C T O R
9 124.53 013.86 110.74.6660.25.42 370.03 070.5July9 335.23 244.66 090.65.9696.652.92 173.63 161.6June9 599.53 598.26 001.34.1688.74.02 020.53 283.9May8 009.52 651.65 357.93.9487.613.42 481.02 372.0April8 097.82 359.75 738.110.4708.413.61 908.53 097.3March8 884.92 461.56 423.415.9618.712.32 994.12 782.4February6 685.31 834.34 851.01.3419.23.02 311.92 115.5January
20177 631.22 219.65 411.574.8508.423.82 413.22 391.4December8 658.92 696.95 962.05.7621.611.42 216.23 107.1November7 944.82 407.55 537.31.0626.241.51 962.92 905.7October
11 416.24 608.26 808.01.1632.011.13 104.53 059.3September9 632.22 483.57 148.71.6649.716.23 263.73 217.5August
2016
105 559.633 133.572 426.1168.27 259.4215.130 378.034 405.42016–17101 209.327 187.774 021.6295.57 183.8313.131 519.734 709.62015–1692 411.625 106.667 305.0272.66 910.8212.426 937.432 971.82014–15
PR I V A T E SE C T O R
$m$m$m$m$m$m$m$m
Totalbuilding
Non-residential
building
Total
residential
buildingConversions
Alterations
and additions
not creating
dwellings
Alterations
and additions
creating
dwellings
New other
residential
New
houses
Pe r i od
VALUE OF BUILD ING APPROVED, By secto r : Or ig ina l17
22 A B S • B U I L D I N G A P P R O V A L S • 8 7 3 1 . 0 • J U L Y 2 0 1 7

(a) Reference year for chain volume measures is 2014-15.
0.24.0–2.3–0.1–2.5–4.2–0.1June Qtr–1.9–0.1–2.9–0.8–3.2–6.1–0.7March Qtr
2017–3.5–2.4–4.0–1.1–4.4–7.5–1.6December Qtr–1.70.6–2.9–0.9–3.1–4.5–1.8September Qtr2.56.40.50.40.51.4–0.5June Qtr4.17.02.70.73.06.00.3March Qtr
2016
TR E N D (% ch a n g e f r o m p r e v i o u s qu a r t e r )
26 792.810 215.016 544.71 864.714 679.26 580.48 180.5June Qtr26 747.39 821.516 928.31 866.415 061.86 866.48 192.5March Qtr
201727 266.59 831.417 442.81 880.615 562.17 309.78 246.7December Qtr28 252.710 074.118 178.61 901.116 277.57 899.68 377.9September Qtr28 735.510 014.218 721.31 918.916 802.58 275.48 527.1June Qtr28 046.19 409.318 636.81 910.716 726.08 157.88 569.0March Qtr
2016
TR E N D ($ m )
27 969.211 402.516 566.71 807.014 759.76 511.68 248.1June Qtr26 931.19 190.317 740.81 906.815 834.07 686.88 147.2March Qtr
201724 565.28 707.515 857.81 922.013 935.85 721.28 214.6December Qtr31 128.511 758.819 369.71 762.317 607.39 229.98 377.5September Qtr28 001.89 577.118 424.82 059.816 365.07 843.58 521.5June Qtr27 709.68 886.018 823.61 866.116 957.58 291.68 666.0March Qtr
2016
SE A S O N A L L Y AD J U S T E D ($ m )
27 856.311 340.016 516.21 854.014 662.26 311.48 350.8June Qtr25 194.68 891.516 303.11 742.114 560.96 942.37 618.7March Qtr
201725 274.38 877.216 397.11 870.514 526.66 410.78 116.0December Qtr32 547.912 076.820 471.11 900.318 570.89 655.18 915.7September Qtr29 064.29 961.119 103.02 110.716 992.48 085.08 907.4June Qtr24 595.18 156.616 438.51 712.114 726.56 891.27 835.2March Qtr
2016110 873.041 185.669 687.57 366.962 320.529 319.433 001.22016–17109 384.436 369.173 015.27 662.365 353.031 262.834 090.22015–16100 227.931 882.168 345.87 529.260 816.627 358.133 458.52014–15
OR I G I N A L ($ m )
Totalbuilding
Non-residential
building
Total
residential
building
Alterations
and additions
including
conversions
to residential
buildings
New
residential
building
New other
residential
building
New
housesPe r i od
VALUE OF BUILD ING APPROVED, Cha in vo lume measures (a )18
A B S • B U I L D I N G A P P R O V A L S • 8 7 3 1 . 0 • J U L Y 2 0 1 7 23
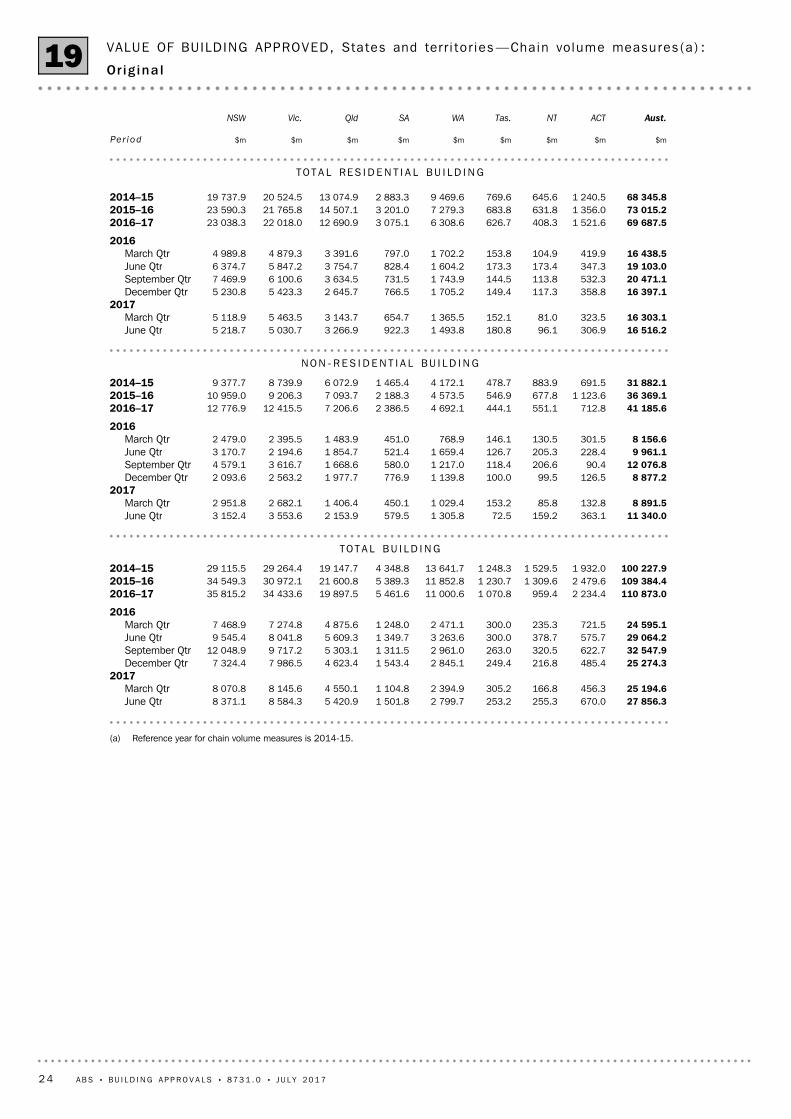
(a) Reference year for chain volume measures is 2014-15.
27 856.3670.0255.3253.22 799.71 501.85 420.98 584.38 371.1June Qtr25 194.6456.3166.8305.22 394.91 104.84 550.18 145.68 070.8March Qtr
201725 274.3485.4216.8249.42 845.11 543.44 623.47 986.57 324.4December Qtr32 547.9622.7320.5263.02 961.01 311.55 303.19 717.212 048.9September Qtr29 064.2575.7378.7300.03 263.61 349.75 609.38 041.89 545.4June Qtr24 595.1721.5235.3300.02 471.11 248.04 875.67 274.87 468.9March Qtr
2016
110 873.02 234.4959.41 070.811 000.65 461.619 897.534 433.635 815.22016–17109 384.42 479.61 309.61 230.711 852.85 389.321 600.830 972.134 549.32015–16100 227.91 932.01 529.51 248.313 641.74 348.819 147.729 264.429 115.52014–15
TO T A L BU I L D I N G
11 340.0363.1159.272.51 305.8579.52 153.93 553.63 152.4June Qtr8 891.5132.885.8153.21 029.4450.11 406.42 682.12 951.8March Qtr
20178 877.2126.599.5100.01 139.8776.91 977.72 563.22 093.6December Qtr
12 076.890.4206.6118.41 217.0580.01 668.63 616.74 579.1September Qtr9 961.1228.4205.3126.71 659.4521.41 854.72 194.63 170.7June Qtr8 156.6301.5130.5146.1768.9451.01 483.92 395.52 479.0March Qtr
2016
41 185.6712.8551.1444.14 692.12 386.57 206.612 415.512 776.92016–1736 369.11 123.6677.8546.94 573.52 188.37 093.79 206.310 959.02015–1631 882.1691.5883.9478.74 172.11 465.46 072.98 739.99 377.72014–15
NO N - R E S I D E N T I A L BU I L D I N G
16 516.2306.996.1180.81 493.8922.33 266.95 030.75 218.7June Qtr16 303.1323.581.0152.11 365.5654.73 143.75 463.55 118.9March Qtr
201716 397.1358.8117.3149.41 705.2766.52 645.75 423.35 230.8December Qtr20 471.1532.3113.8144.51 743.9731.53 634.56 100.67 469.9September Qtr19 103.0347.3173.4173.31 604.2828.43 754.75 847.26 374.7June Qtr16 438.5419.9104.9153.81 702.2797.03 391.64 879.34 989.8March Qtr
2016
69 687.51 521.6408.3626.76 308.63 075.112 690.922 018.023 038.32016–1773 015.21 356.0631.8683.87 279.33 201.014 507.121 765.823 590.32015–1668 345.81 240.5645.6769.69 469.62 883.313 074.920 524.519 737.92014–15
TO T A L RE S I D E N T I A L BU I L D I N G
$m$m$m$m$m$m$m$m$m
Aust.ACTNTTas.WASAQldVic.NSW
Per i od
VALUE OF BUILDING APPROVED, States and ter r i to r ies —Chain volume measures (a ) :
Or ig ina l19
24 A B S • B U I L D I N G A P P R O V A L S • 8 7 3 1 . 0 • J U L Y 2 0 1 7

EF F E C T OF NE W SE A S O N A L L Y AD J U S T E D ES T I M A T E S ON TR E N D ES T I M A T E S
— nil or rounded to zero (including null cells)
–1.47 6602.48 2910.17 914July–1.47 7651.68 100–0.17 908June–1.87 874—7 976–0.97 919May–1.68 015–1.17 977–1.47 994April0.38 146–0.18 069—8 109March1.48 1200.98 0761.38 110February
2017% changeno.% changeno.% changeno.
(2) falls by 14.6%on Jul 2017
(1) rises by 14.6%on Jul 2017
WHAT IF NEXT MONTH'S SEASONALLYADJUSTED ESTIMATE:
Trend as published
Nov2016
Jan2017
Mar May Jul
no.
6000
7000
8000
9000
10000
110001Published trend2
AP P R O V E D PR I V A T E SE C T O R DW E L L I N G S EX C L U D I N G HO U S E S
0.79 5981.49 7501.09 656July0.99 5321.49 6131.19 560June0.99 4511.39 4761.09 457May0.89 3640.99 3550.89 363April0.49 2880.39 2700.49 287March
–0.29 249–0.39 238–0.29 249February
2017% changeno.% changeno.% changeno.
(2) falls by 2.6%on Jul 2017
(1) rises by 2.6%on Jul 2017
WHAT IF NEXT MONTH'S SEASONALLYADJUSTED ESTIMATE:
Trend as published
Nov2016
Jan2017
Mar May Jul
no.
8500
9000
9500
10000
105001Published trend2
AP P R O V E D PR I V A T E SE C T O R HO U S E S
Recent seasonally adjusted and trend estimates are likely to be revised when original
estimates for subsequent months become available. The approximate effect of possible
scenarios on trend estimates are presented below. Generally, the greater the volatility of
the original series, the larger the size of the revisions to trend estimates. Analysis of the
building approval original series has shown that they can be revised substantially. As a
result, some months can elapse before turning points in the trend series are reliably
identified.
The graphs and tables which follow present the effect of two possible scenarios on the
previous trend estimates: that the August seasonally adjusted estimate is higher than the
July estimate by 2.6% for the number of private sector houses approved and 14.6% for
private sector dwellings excluding houses approved; and that the August seasonally
adjusted estimate is lower than the July estimate by 2.6% for the number of private
sector houses approved and 14.6% for private sector dwellings excluding houses
approved. These percentages represent the average absolute monthly percentage
change for these series over the last ten years.
TR E N D RE V I S I O N S
A B S • B U I L D I N G A P P R O V A L S • 8 7 3 1 . 0 • J U L Y 2 0 1 7 25
W H A T I F . . . ? RE V I S I O N S TO TR E N D ES T I M A T E S
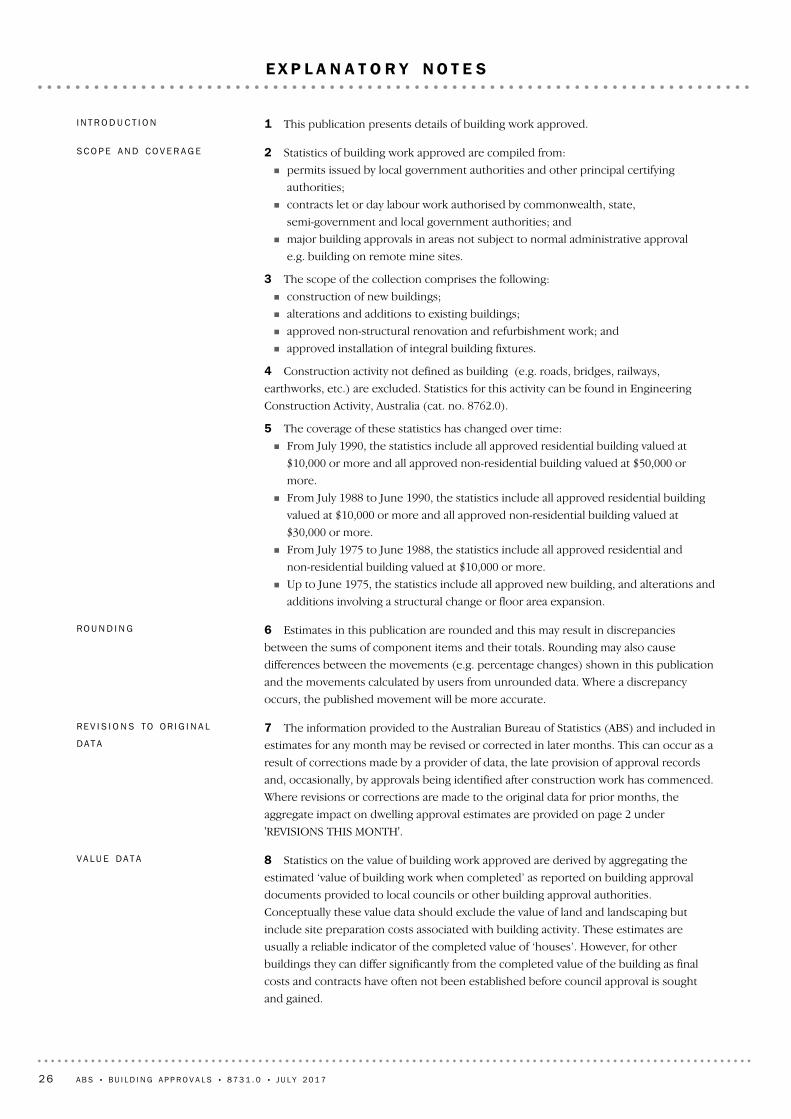
8 Statistics on the value of building work approved are derived by aggregating the
estimated ‘value of building work when completed’ as reported on building approval
documents provided to local councils or other building approval authorities.
Conceptually these value data should exclude the value of land and landscaping but
include site preparation costs associated with building activity. These estimates are
usually a reliable indicator of the completed value of ‘houses’. However, for other
buildings they can differ significantly from the completed value of the building as final
costs and contracts have often not been established before council approval is sought
and gained.
VA L U E DA T A
7 The information provided to the Australian Bureau of Statistics (ABS) and included in
estimates for any month may be revised or corrected in later months. This can occur as a
result of corrections made by a provider of data, the late provision of approval records
and, occasionally, by approvals being identified after construction work has commenced.
Where revisions or corrections are made to the original data for prior months, the
aggregate impact on dwelling approval estimates are provided on page 2 under
'REVISIONS THIS MONTH'.
RE V I S I O N S TO OR I G I N A L
DA T A
6 Estimates in this publication are rounded and this may result in discrepancies
between the sums of component items and their totals. Rounding may also cause
differences between the movements (e.g. percentage changes) shown in this publication
and the movements calculated by users from unrounded data. Where a discrepancy
occurs, the published movement will be more accurate.
RO U N D I N G
2 Statistics of building work approved are compiled from:
! permits issued by local government authorities and other principal certifying
authorities;
! contracts let or day labour work authorised by commonwealth, state,
semi-government and local government authorities; and
! major building approvals in areas not subject to normal administrative approval
e.g. building on remote mine sites.
3 The scope of the collection comprises the following:
! construction of new buildings;
! alterations and additions to existing buildings;
! approved non-structural renovation and refurbishment work; and
! approved installation of integral building fixtures.
4 Construction activity not defined as building (e.g. roads, bridges, railways,
earthworks, etc.) are excluded. Statistics for this activity can be found in Engineering
Construction Activity, Australia (cat. no. 8762.0).
5 The coverage of these statistics has changed over time:
! From July 1990, the statistics include all approved residential building valued at
$10,000 or more and all approved non-residential building valued at $50,000 or
more.
! From July 1988 to June 1990, the statistics include all approved residential building
valued at $10,000 or more and all approved non-residential building valued at
$30,000 or more.
! From July 1975 to June 1988, the statistics include all approved residential and
non-residential building valued at $10,000 or more.
! Up to June 1975, the statistics include all approved new building, and alterations and
additions involving a structural change or floor area expansion.
SC O P E AN D CO V E R A G E
1 This publication presents details of building work approved.I N T R O D U C T I O N
26 A B S • B U I L D I N G A P P R O V A L S • 8 7 3 1 . 0 • J U L Y 2 0 1 7
E X P L A N A T O R Y N O T E S

16 Seasonal adjustment is a means of removing the estimated effects of seasonal and
calendar related variation from a series so that the effects of other influences can be
more clearly recognised. It does not remove the effect of irregular or other influences
(e.g. the approval of large projects or a change in the administrative arrangements of
approving authorities).
SE A S O N A L AD J U S T M E N T AN D
TR E N D ES T I M A T E S
13 Building approvals are classified by Type of Building (e.g. 'residential',
'non-residential') and by Type of Work.
14 Type of Building is the building's intended predominant function according to the
ABS Functional Classification of Buildings 1999 (Revision 2011) (cat. no. 1268.0.55.001).
! Except where specified in the Functional Classification of Buildings, a building which
is ancillary to other buildings, or forms a part of a group of related buildings, is
classified to the function of the building and not to the function of the group as a
whole. For example, in the case of a factory complex, a detached administration
building would be classified to Offices, a detached cafeteria building to
Retail/wholesale trade, while factory buildings would be classified to Factories. An
exception to this rule is the treatment of group accommodation buildings where, for
example, a student accommodation building on a university campus would be
classified to Educational.
! For a significant multi-function building which at the time of approval is intended to
have more than one purpose (e.g. a hotel/shops/casino project), the ABS
endeavours to split the approval details according to each main function. Where this
is not possible because separate details cannot be obtained, the building is classified
to the predominant function of the building.
15 Type of Work consists of 'new', 'alterations and additions', and 'conversions'.
Conversions are considered to be a special type of alteration, and these jobs have been
separately identified as such from the July 1996 reference month, though they have only
appeared separately in this publication from the January 1998 issue. Prior to that issue,
conversions were published as part of the 'Conversions, etc.' category or included
elsewhere within a table.
BU I L D I N G CL A S S I F I C A T I O N S
12 Building ownership is classified as either public or private sector and is based on
the sector of the intended owner of the completed building at the time of approval.
Residential buildings constructed by private sector builders under government housing
authority schemes are classified as public sector when the authority has contracted, or
intends to contract, to purchase the building on or before completion.
OW N E R S H I P
11 In these statistics a 'building job' is a construction project comprising work to one
or more buildings. Building jobs data are based on the building approval records within
the scope of the collection received each month.
BU I L D I N G JO B DA T A
9 The ABS generally accepts values provided by approving bodies. Every effort is made
to ensure data are provided on a consistent basis, however, there may be instances
where value reported does not reflect the building completion value. For example, the
reported value for most project homes is the contract price, which may include the cost
of site preparation and landscaping. In other cases where a builder is contracted to
construct a dwelling based on the owner’s plans, the value may only be the builder’s
costs. Some data providers do not use the value on approval documents, instead
deriving a value based on floor area and type of structure.
10 From July 2000, value data includes the Goods and Services Tax (GST) for
residential and non-residential building approvals.
VA L U E DA T A continued
A B S • B U I L D I N G A P P R O V A L S • 8 7 3 1 . 0 • J U L Y 2 0 1 7 27
E X P L A N A T O R Y N O T E S continued

26 Building approvals are classified to the Australian Statistical Geography Standard
(ASGS), 2016 Edition (cat. no. 1270.0.55.001), effective from July 2011. Data from July
2001 to June 2011 is classified according to the 2011 edition of the ASGS.
27 From 1 July 2002, approvals in the Territories of Jervis Bay, Christmas Island and
Cocos (Keeling) Islands are included in these statistics. Jervis Bay is included in New
South Wales, while Christmas Island and Cocos (Keeling) Islands are included in Western
Australia. This differs to their treatment in the ASGS, where these Territories are
included in 'Other Territories'.
GE O G R A P H I C
CL A S S I F I C A T I O N
23 Chain volume estimates reflect changes in the volume of building work approved
after the direct effects of price changes have been eliminated. The chain volume
measures appearing in this publication are annually reweighted chain Laspeyres indexes
referenced to current price values in a chosen reference year.
24 Chain volume measures are released quarterly in the April, July, October and
January issues. The reference year is updated annually in the October issue.
25 Chain volume measures do not, in general, sum exactly to the extrapolated total
value of the components. Further information on the nature and concepts of chain
volume measures is contained in the ABS Information Paper Australian National
Accounts, Introduction of Chain Volume Measures and Price Indexes, September 1997
(cat. no. 5248.0).
CH A I N VO L U M E ME A S U R E S
17 State/territory series are seasonally adjusted independently of the Australian series.
In general, the sum of the state/territory estimates are reconciled to equal the Australian
total estimates.
18 Seasonally adjusted estimates are produced by a seasonal adjustment method
which takes account of the latest available original estimates. A detailed review of
seasonal factors is conducted annually, generally prior to the release of data for May. The
timing of this review may vary and when appropriate will be notified in the 'Data Notes'
section of this publication.
19 The ABS produces trend estimates to best represent the underlying behaviour in a
series. Trend estimates are created by smoothing seasonally adjusted series to reduce
the impact of the irregular component of the seasonally adjusted series. Abnormally high
or low values (outliers) are discounted or excluded from the trend estimates.
20 Seasonally adjusted and trend estimates may be revised as new periods of data
become available. Generally, revisions become smaller over time. Revisions to original
data may also lead to revisions to seasonally adjusted and trend estimates.
21 Care should be exercised when using the seasonally adjusted value of
non-residential building jobs at the state level, due to the difficulties in estimating the
seasonal pattern for these data series.
22 Further information on seasonally adjusted and trend estimates can be found in the
ABS Information papers An Introductory Course on Time Series Analysis - Electronic
Delivery, January 2005 (cat. no. 1346.0.55.001) and A Guide to Interpreting Time Series -
Monitoring Trends, 2003 (cat. no. 1349.0).
SE A S O N A L AD J U S T M E N T AN D
TR E N D ES T I M A T E S continued
28 A B S • B U I L D I N G A P P R O V A L S • 8 7 3 1 . 0 • J U L Y 2 0 1 7
E X P L A N A T O R Y N O T E S continued
29 As well as the statistics included in this and related publications, the ABS may have
other relevant data available on request. Inquiries should be made to the National
Information and Referral Service on 1300 135 070. The ABS Privacy Policy outlines how
the ABS will handle any personal information that you provide to us.
AB S DA T A AV A I L A B L E ON
RE Q U E S T
28 Users may also wish to refer to the following publications:
Building Activity, Australia (cat. No. 8752.0)
Construction Work Done, Australia, Preliminary (cat. no. 8755.0)
Engineering Construction Activity, Australia (cat. no. 8762.0)
Residential Property Price Indexes: Eight Capital Cities (cat. no. 6416.0)
Housing Finance, Australia (cat. no. 5609.0)
Producer Price Indexes, Australia (cat. no. 6427.0)
Construction Activity: Chain Volume Measures, Australia (cat. no. 8782.0.65.001)
RE L A T E D PU B L I C A T I O N S
Western AustraliaWA
VictoriaVic.
TasmaniaTas.
South AustraliaSA
QueenslandQld
Northern TerritoryNT
New South WalesNSW
numberno.
not elsewhere classifiedn.e.c.
goods and services taxGST
Financial Year to DateFYTD
AustraliaAust.
Australian Statistical Geography StandardASGS
Australian Standard Geographical ClassificationASGC
Australian Capital TerritoryACT
Australian Bureau of StatisticsABS
million dollars$mAB B R E V I A T I O N S
A B S • B U I L D I N G A P P R O V A L S • 8 7 3 1 . 0 • J U L Y 2 0 1 7 29
E X P L A N A T O R Y N O T E S continued

January 196529naDwelling units approved in new residential buildings, number and value, Australian Capital TerritoryJanuary 195628naDwelling units approved in new residential buildings, number and value, Northern TerritoryJanuary 195627naDwelling units approved in new residential buildings, number and value, TasmaniaJanuary 195626naDwelling units approved in new residential buildings, number and value, Western AustraliaJanuary 195625naDwelling units approved in new residential buildings, number and value, South AustraliaJanuary 195624naDwelling units approved in new residential buildings, number and value, QueenslandJanuary 195623naDwelling units approved in new residential buildings, number and value, VictoriaJanuary 196522naDwelling units approved in new residential buildings, number and value, New South WalesJanuary 19562110Value of dwelling units approved in new residential buildings, originalJanuary 19562010Dwelling units approved in new residential buildings, original
July 197019naDwelling units approved, by sector, Australian Capital TerritoryJuly 197018naDwelling units approved, by sector, Northern TerritoryJuly 197017naDwelling units approved, by sector, TasmaniaJuly 197016naDwelling units approved, by sector, Western AustraliaJuly 197015naDwelling units approved, by sector, South AustraliaJuly 197014naDwelling units approved, by sector, QueenslandJuly 197013naDwelling units approved, by sector, VictoriaJuly 197012naDwelling units approved, by sector, New South Wales
January 1956119Dwelling units approved, by sector, original, AustraliaJuly 2001108Dwelling units approved, by Greater Capital City Statistical Areas,OriginalJuly 198397Dwelling units approved, states and territories, by type
..na6Private sector houses approved, states and territories, percentage changeJuly 198385Private sector houses approved, states and territories
..na4Total dwelling units approved, states and territories, percentage changeJuly 198373Total dwelling units approved, state and territories, number
..na2Dwelling units approved, percentage change, AustraliaJuly 198361Dwelling units approved, all series, AustraliaJuly 19835naDwelling units approved, Western AustraliaJuly 19834naDwelling units approved, South AustraliaJuly 19833naDwelling units approved, QueenslandJuly 19832naDwelling units approved, VictoriaJuly 19831naDwelling units approved, New South Wales
Start
date
Electronic
table no.
Publication
table no.Co lumns f r om shee t
DWELL ING UNITS
The following tables are available electronically via the ABS web site.
Note: not all series in the table go back to the earliest start date.
EL E C T R O N I C TA B L E S
30 A B S • B U I L D I N G A P P R O V A L S • 8 7 3 1 . 0 • J U L Y 2 0 1 7
A P P E N D I X L I S T O F E L E C T R O N I C T A B L E S

(b) .. not applicable(a) na not available
July 200177naValue of non-residential building approved, by value range, AustraliaJuly 200176naValue of non-residential building approved, by value range, Australian Capital TerritoryJuly 200175naValue of non-residential building approved, by value range, Northern TerritoryJuly 200174naValue of non-residential building approved, by value range, TasmaniaJuly 200173naValue of non-residential building approved, by value range, Western AustraliaJuly 200172naValue of non-residential building approved, by value range, South AustraliaJuly 200171naValue of non-residential building approved, by value range, QueenslandJuly 200170naValue of non-residential building approved, by value range, VictoriaJuly 200169naValue of non-residential building approved, by value range, New South WalesJuly 200168naNumber of non-residential building jobs approved, by value range, AustraliaJuly 200167naNumber of non-residential building jobs approved, by value range, Australian Capital TerritoryJuly 200166naNumber of non-residential building jobs approved, by value range, Northern TerritoryJuly 200165naNumber of non-residential building jobs approved, by value range, TasmaniaJuly 200164naNumber of non-residential building jobs approved, by value range, Western AustraliaJuly 200163naNumber of non-residential building jobs approved, by value range, South AustraliaJuly 200162naNumber of non-residential building jobs approved, by value range, QueenslandJuly 200161naNumber of non-residential building jobs approved, by value range, VictoriaJuly 200160naNumber of non-residential building jobs approved, by value range, New South WalesJuly 200059naValue of non-residential building approved, by sector, Australian Capital TerritoryJuly 200058naValue of non-residential building approved, by sector, Northern TerritoryJuly 200057naValue of non-residential building approved, by sector, TasmaniaJuly 200056naValue of non-residential building approved, by sector, Western AustraliaJuly 200055naValue of non-residential building approved, by sector, South AustraliaJuly 200054naValue of non-residential building approved, by sector, QueenslandJuly 200053naValue of non-residential building approved, by sector, VictoriaJuly 200052naValue of non-residential building approved, by sector, New South WalesJuly 200051naValue of non-residential building approved, by sector, AustraliaJuly 197050naValue of building approved, by sector, Australian Capital TerritoryJuly 197049naValue of building approved, by sector, Northern TerritoryJuly 197048naValue of building approved, by sector, TasmaniaJuly 197047naValue of building approved, by sector, Western AustraliaJuly 197046naValue of building approved, by sector, South AustraliaJuly 197045naValue of building approved, by sector, QueenslandJuly 197044naValue of building approved, by sector, VictoriaJuly 197043naValue of building approved, by sector, New South Wales
January 19614217Value of building approved, by sectorJuly 19704116Value of non-residential building approved, states and territoriesJuly 19734015Value of total residential building approved, states and territories
..na14Value of total building approved, states and territories, percentage changeJuly 19733913Value of total building approved, states and territories
..na12Value of building approved, Australia, percentage changeJanuary 19563811Value of building approved, Australia
July 197037naValue of building approved, Australian Capital TerritoryJuly 197036naValue of building approved, Northern TerritoryJuly 197035naValue of building approved, TasmaniaJuly 197034naValue of building approved, Western AustraliaJuly 197033naValue of building approved, South AustraliaJuly 197032naValue of building approved, QueenslandJuly 197031naValue of building approved, VictoriaJuly 197030naValue of building approved, New South Wales
Start
date(b)
Electronic
table
no.(a)
Publication
table
no.(a)
VALUE
A B S • B U I L D I N G A P P R O V A L S • 8 7 3 1 . 0 • J U L Y 2 0 1 7 31
A P P E N D I X L I S T O F E L E C T R O N I C T A B L E S continued

available not available Building Approvals, Data Items Available by Australian Statistical Geography Standard (ASGS)not available available Number and value ($m) of approvals, states and territories
available available Local Government Area, Australian Capital Territory, 2016–2017 to 2017–2018 FYTDavailable available Statistical Area 2, Australian Capital Territory, 2016–2017 to 2017–2018 FYTDavailable available Local Government Area, Northern Territory, 2016–2017 to 2017–2018 FYTDavailable available Statistical Area 2, Northern Territory, 2016–2017 to 2017–2018 FYTDavailable available Local Government Area, Tasmania, 2016–2017 to 2017–2018 FYTDavailable available Statistical Area 2, Tasmania, 2016–2017 to 2017–2018 FYTDavailable available Local Government Area, Western Australia, 2016–2017 to 2017–2018 FYTDavailable available Statistical Area 2, Western Australia, 2016–2017 to 2017–2018 FYTDavailable available Local Government Area, South Australia, 2016–2017 to 2017–2018 FYTDavailable available Statistical Area 2, South Australia, 2016–2017 to 2017–2018 FYTDavailable available Local Government Area, Queensland, 2016–2017 to 2017–2018 FYTDavailable available Statistical Area 2, Queensland, 2016–2017 to 2017–2018 FYTDavailable available Local Government Area, Victoria, 2016–2017 to 2017–2018 FYTDavailable available Statistical Area 2, Victoria, 2016–2017 to 2017–2018 FYTDavailable available Local Government Area, New South Wales, 2016–2017 to 2017–2018 FYTDavailable available Statistical Area 2, New South Wales, 2016–2017 to 2017–2018 FYTD
Excel
Format
SuperTABLE
format
DATA CUBES
September 19858619Value of building approved, chain volume measures, Australian Capital TerritorySeptember 19858519Value of building approved, chain volume measures, Northern TerritorySeptember 19858419Value of building approved, chain volume measures, TasmaniaSeptember 19858319Value of building approved, chain volume measures, Western AustraliaSeptember 19858219Value of building approved, chain volume measures, South AustraliaSeptember 19858119Value of building approved, chain volume measures, QueenslandSeptember 19858019Value of building approved, chain volume measures, VictoriaSeptember 19857919Value of building approved, chain volume measures, New South WalesSeptember 19707818Value of building approved, chain volume measures, Australia
Start
date
Electronic
table no.
Publication
table no.
CHAIN VOLUME MEASURES
32 A B S • B U I L D I N G A P P R O V A L S • 8 7 3 1 . 0 • J U L Y 2 0 1 7
A P P E N D I X L I S T O F E L E C T R O N I C T A B L E S continued

A detached building primarily used for long term residential purposes consisting of onedwelling unit. Includes detached residences associated with a non-residential building,and kit and transportable homes.
House
Buildings used in the provision of non-aged care medical services (e.g. nursing quarters,laboratories, clinics).
Health
Dwellings not having their own private grounds and usually sharing a common entrance,foyer or stairwell.
Flats, units or apartments
Buildings housing, or associated with, production and assembly processes ofintermediate and final goods.
Factories
Buildings used in the provision of entertainment and recreational facilities or services(e.g. libraries, museums, casinos, sporting facilities).
Entertainment and recreation
Buildings used in the provision or support of educational services, including groupaccommodation buildings (e.g. classrooms, school canteens, dormitories).
Educational
Dwellings in other residential buildings and dwellings created in non-residentialbuildings.
Dwellings excluding houses
A dwelling is a self-contained suite of rooms, including cooking and bathing facilities,intended for long-term residential use. A dwelling may comprise part of a building or thewhole of a building. Regardless of whether they are self-contained or not, rooms withinbuildings offering institutional care (e.g. hospitals) or temporary accommodation (e.g.motels, hostels and holiday apartments) are not defined as dwellings. Such rooms areincluded in the appropriate category of non-residential building approvals. Dwellings canbe created in one of four ways: through new work to create a residential building;through alteration/addition work to an existing residential building; through either newor alteration/addition work on non-residential building; or through conversion of anon-residential building to a residential building.
Dwelling
Building activity which converts a non-residential building to a residential building (e.g.conversion of a warehouse to residential apartments).
Conversion
Buildings primarily occupied with or engaged in commercial trade or work intended forcommercial trade, including buildings used primarily in wholesale and retail trades, officeand transport activities.
Commercial
A building job is a construction project comprising work to one or more buildings.Building job
A building is a rigid, fixed and permanent structure which has a roof. Its intendedpurpose is primarily to house people, plant, machinery, vehicles, goods or livestock. Anintegral feature of a building’s design is the provision for regular access by persons inorder to satisfy its intended use.
Building
Building activity carried out on existing buildings. Includes alterations and additions tofloor area, the structural design of a building, and affixing rigid components which areintegral to the functioning of the building.
Alterations and additions
Buildings associated with agriculture and aquaculture activities, including bulk storage ofproduce (e.g. shearing shed, hay shed, shearers’ quarters).
Agriculture/aquaculture
Building used in the provision or support of aged care facilities, excluding dwellings(e.g. retirement villages). Includes aged care facilities with and without medical care.
Aged care facilities
Buildings primarily providing short-term or temporary accommodation on a commercialbasis. Includes:! Self-contained, short-term apartments (e.g. serviced apartments);! Hotels (predominantly accommodation), motels, boarding houses, cabins; and! Other short-term accommodation n.e.c. (e.g. migrant hostels, youth hostels, lodges).
Accommodation
A B S • B U I L D I N G A P P R O V A L S • 8 7 3 1 . 0 • J U L Y 2 0 1 7 33
G L O S S A R Y

Buildings primarily used for storage of goods, excluding produce storage.Warehouses
Buildings primarily used in the provision of transport services. Includes:! Passenger transport buildings (e.g. passenger terminals);! Non-passenger transport buildings (e.g. freight terminals);! Commercial car parks (excluded are those built as part of, and intended to service,
other distinct building developments); and! Other transport buildings n.e.c.
Transport
Total residential building is comprised of houses and other residential building. It doesnot include dwellings in non-residential buildings.
Total residential building
Dwellings having their own private grounds with no other dwellings above or below.Semidetached, row or terracehouses, townhouses
Buildings primarily used in the sale of goods to intermediate and end users.Retail/wholesale trade
Buildings primarily used for long-term residential purposes. Residential buildings arecategorised as houses or other residential buildings.
Residential building
Buildings used for or associated with worship or in support of programs sponsored byreligious bodies (e.g. church, temple, church hall, religious dormitories).
Religious
Buildings other than houses which are primarily used for long-term residential purposes.Other residential buildings includes: semidetached, row or terrace houses ortownhouses; and flats, units or apartments.
Other residential building
Buildings primarily used in the provision of professional services or public administration(e.g. offices, insurance or finance buildings).
Offices
Buildings primarily intended for purposes other than long term residence.Non-residential building
Building activity which will result in the creation of a building which previously did notexist.
New
Buildings used for warehousing and the production and assembly activities of industrialestablishments, including factories and plants.
Industrial
34 A B S • B U I L D I N G A P P R O V A L S • 8 7 3 1 . 0 • J U L Y 2 0 1 7
G L O S S A R Y continued


www.abs.gov.auWEB ADDRESS
All statistics on the ABS website can be downloaded freeof charge.
F R E E A C C E S S T O S T A T I S T I C S
Client Services, ABS, GPO Box 796, Sydney NSW 2001POST
1300 135 211FAX
1300 135 070PHONE
Our consultants can help you access the full range ofinformation published by the ABS that is available free ofcharge from our website. Information tailored to yourneeds can also be requested as a 'user pays' service.Specialists are on hand to help you with analytical ormethodological advice.
I N F O R M A T I O N A N D R E F E R R A L S E R V I C E
www.abs.gov.au the ABS website is the best place fordata from our publications and information about the ABS.
INTERNET
F O R M O R E I N F O R M A T I O N . . .
© Commonwealth of Australia 2017Produced by the Australian Bureau of Statistics
87
31
.0
•
BU
IL
DI
NG
A
PP
RO
VA
LS
, A
US
TR
AL
IA
•
Ju
ly 2
01
7
ISSN 1031–0177