building case study1
TRANSCRIPT
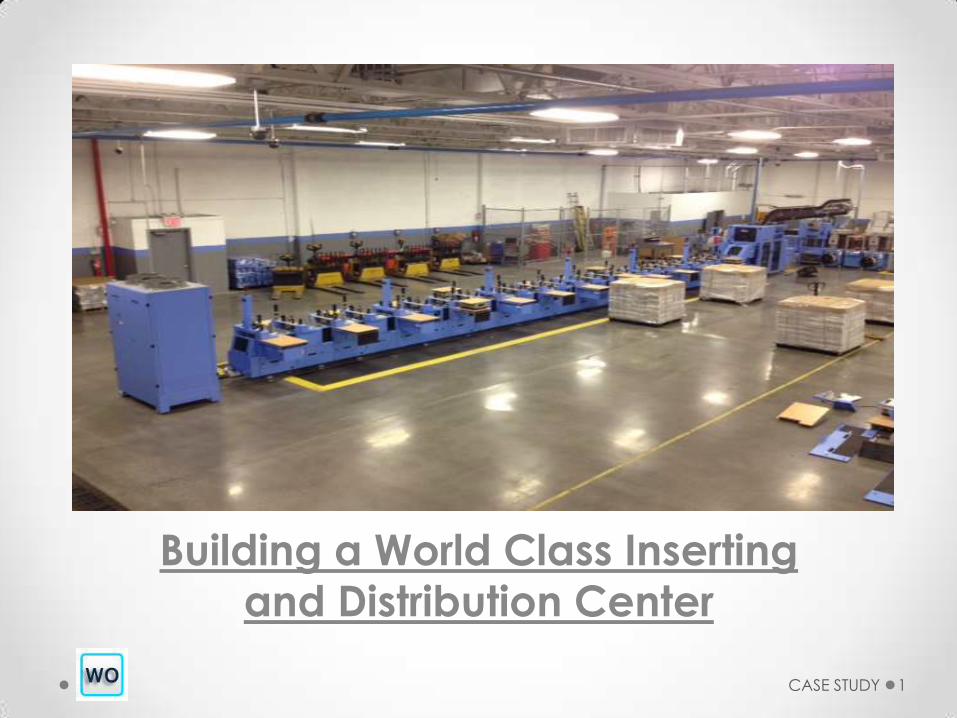
Building a World Class Inserting
and Distribution Center
CASE STUDY 1

“First Start With Good People”
Need good people and great leadership with project management expertise
CASE STUDY 2
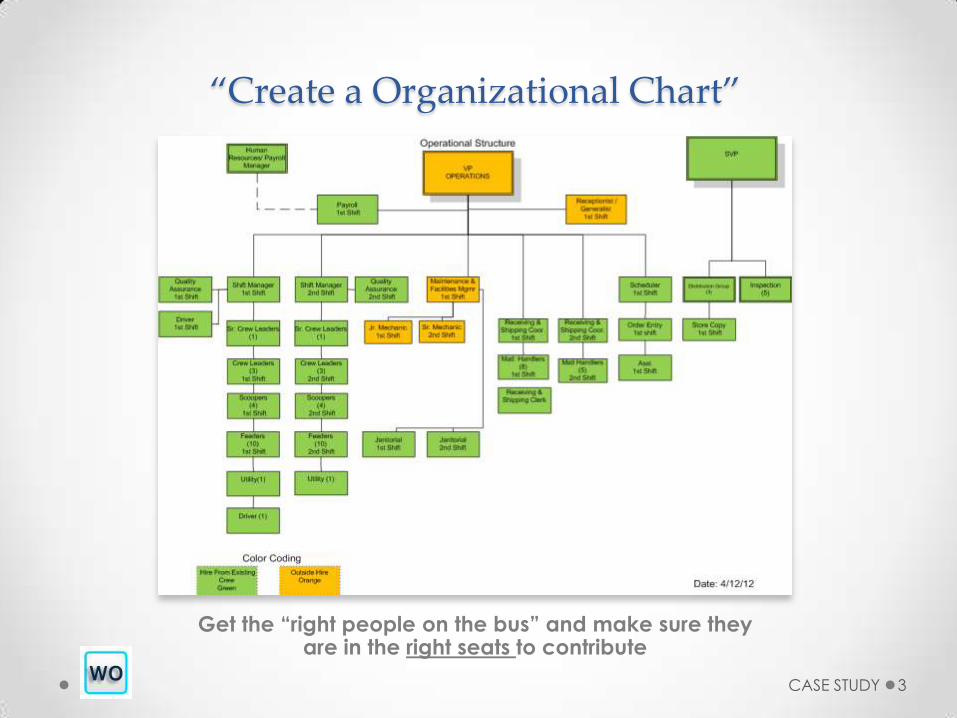
“Create a Organizational Chart”
Get the “right people on the bus” and make sure they are in the right seats to contribute
CASE STUDY 3

“Create…” Selection Matrix for consistent selection of associates
Conduct Associates Evaluation's with staff input
Outplacement Provided for those not selected
New Job Descriptions for each position
Competitive Wage Scale providing a progression
Standard Operational Procedures (Mimic - ISO 9001)
Work Rules & Policies
Project Plan with Weekly Updates (MS Project)
Contingency Planning (PMBOK)
Layouts (Auto CAD, PDF’s)
CASE STUDY 4
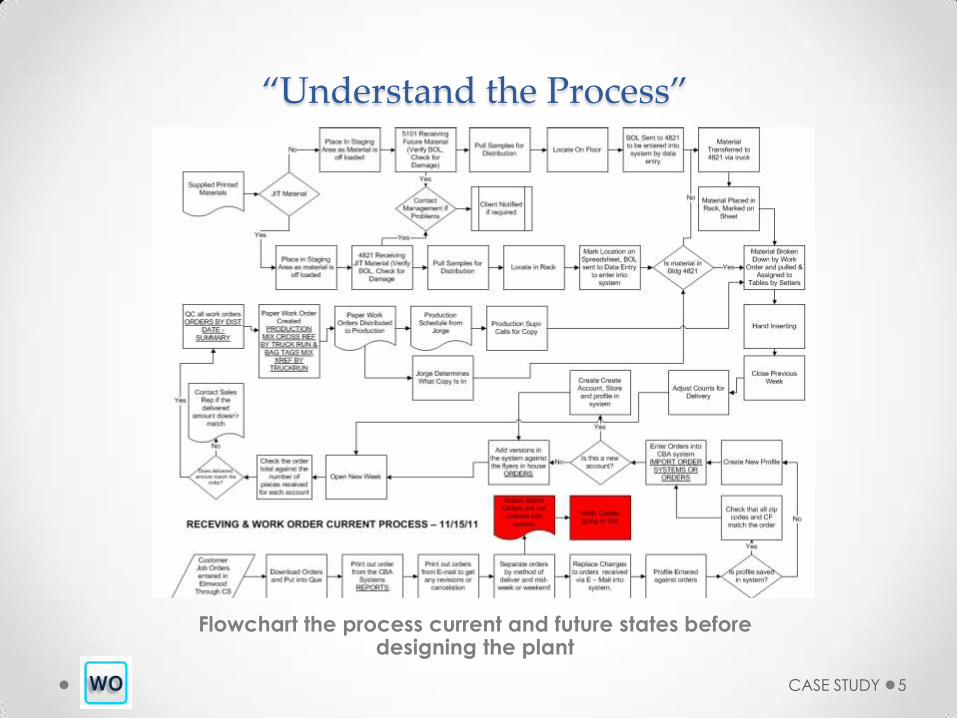
“Understand the Process”
Flowchart the process current and future states before designing the plant
CASE STUDY 5
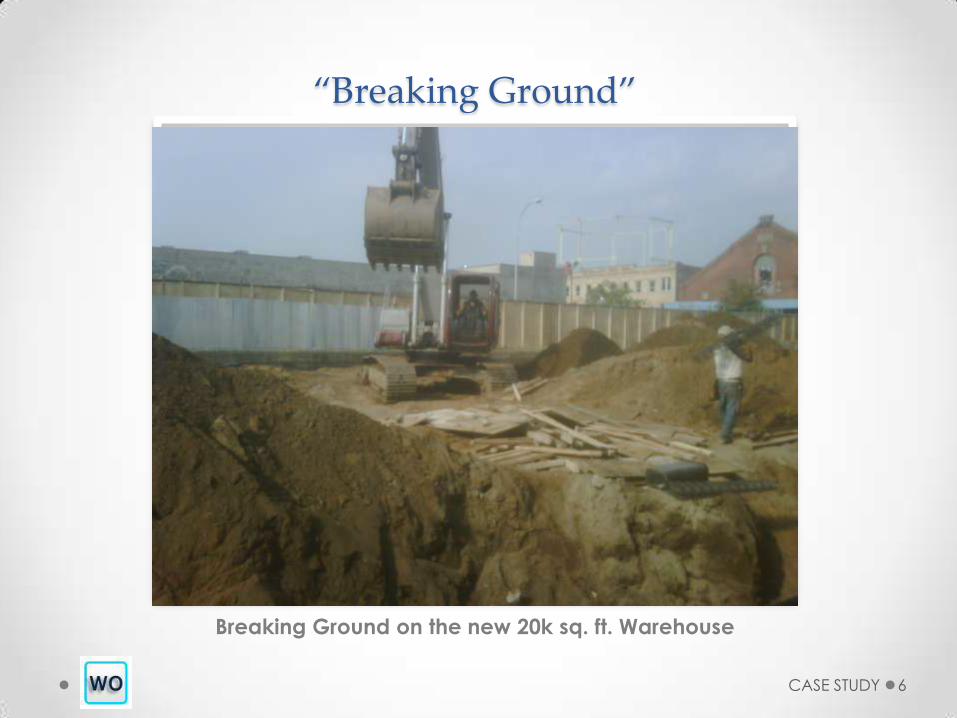
“Breaking Ground”
Breaking Ground on the new 20k sq. ft. Warehouse
CASE STUDY 6
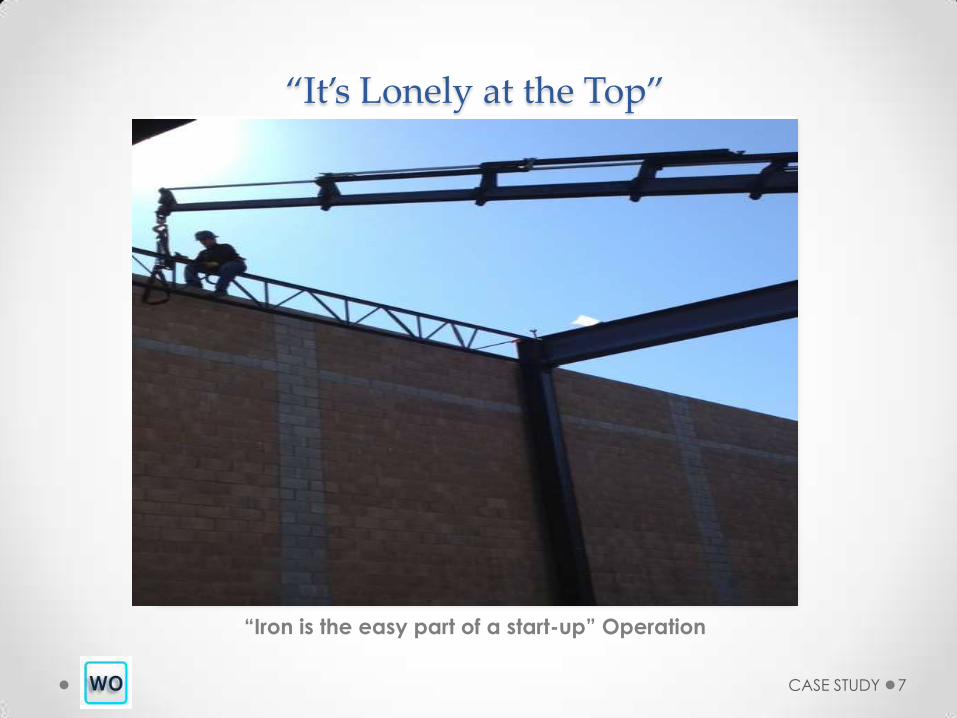
“It’s Lonely at the Top”
“Iron is the easy part of a start-up” Operation
CASE STUDY 7
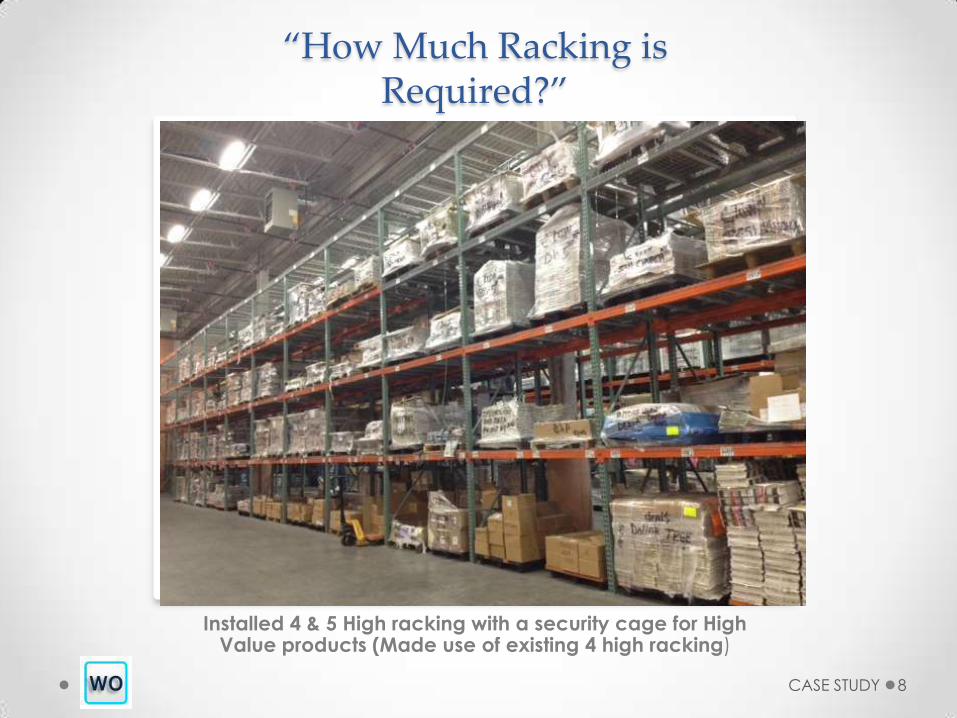
“How Much Racking is Required?”
Installed 4 & 5 High racking with a security cage for High Value products (Made use of existing 4 high racking)
CASE STUDY 8
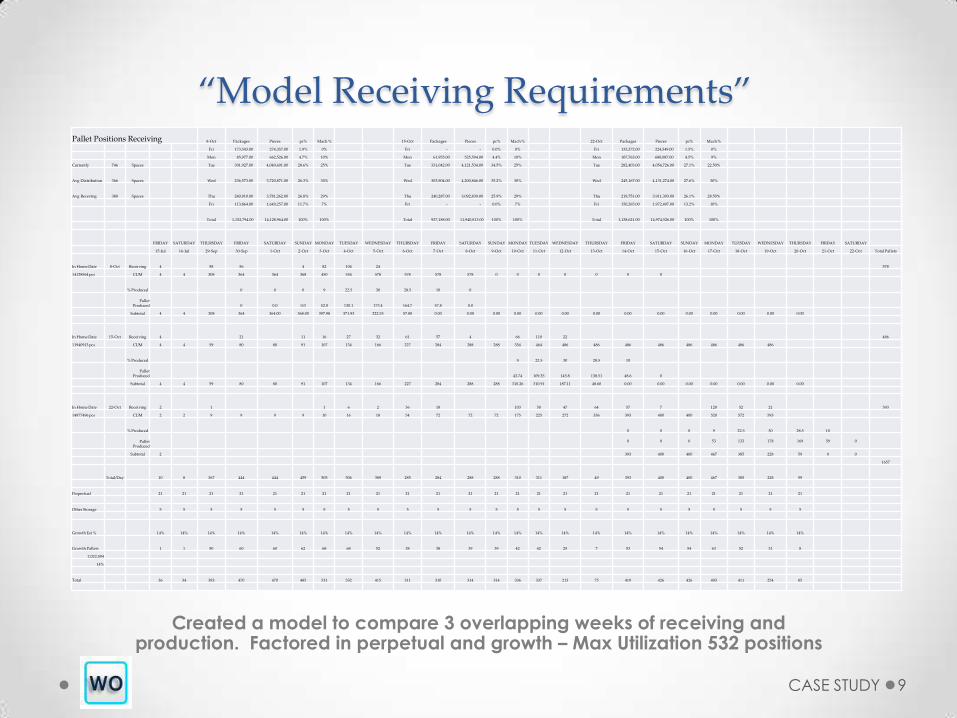
“Model Receiving Requirements” Pallet Positions Receiving 8-Oct Packages Pieces pc% Mach % 15-Oct Packages Pieces pc% Mach % 22-Oct Packages Pieces pc% Mach %
Fri 173,543.00 274,357.00 1.9% 0% Fri - - 0.0% 0% Fri 133,272.00 224,549.00 1.5% 0%
Mon 85,977.00 662,526.00 4.7% 10% Mon 61,955.00 525,594.00 4.4% 10% Mon 107,763.00 680,087.00 4.5% 9%
Currently 746 Spaces Tue 301,927.00 4,040,691.00 28.6% 25% Tue 331,042.00 4,121,534.00 34.5% 25% Tue 282,403.00 4,054,726.00 27.1% 22.50%
Avg Distribution 366 Spaces Wed 236,573.00 3,720,871.00 26.3% 30% Wed 303,904.00 4,200,846.00 35.2% 30% Wed 245,167.00 4,131,274.00 27.6% 30%
Avg Receving 380 Spaces Thu 240,910.00 3,781,262.00 26.8% 29% Thu 240,287.00 3,092,839.00 25.9% 29% Thu 219,751.00 3,911,393.00 26.1% 28.50%
Fri 113,864.00 1,649,257.00 11.7% 7% Fri - - 0.0% 7% Fri 150,265.00 1,972,497.00 13.2% 10%
Total 1,152,794.00 14,128,964.00 100% 100% Total 937,188.00 11,940,813.00 100% 100% Total 1,138,621.00 14,974,526.00 100% 100%
FRIDAY SATURDAY THURSDAY FRIDAY SATURDAY SUNDAY MONDAY TUESDAY WEDNESDAY THURSDAY FRIDAY SATURDAY SUNDAY MONDAY TUESDAY WEDNESDAY THURSDAY FRIDAY SATURDAY SUNDAY MONDAY TUESDAY WEDNESDAY THURSDAY FRIDAY SATURDAY
15-Jul 16-Jul 29-Sep 30-Sep 1-Oct 2-Oct 3-Oct 4-Oct 5-Oct 6-Oct 7-Oct 8-Oct 9-Oct 10-Oct 11-Oct 12-Oct 13-Oct 14-Oct 15-Oct 16-Oct 17-Oct 18-Oct 19-Oct 20-Oct 21-Oct 22-Oct Total Pallets
In Home Date 8-Oct Receiving 4 58 56 4 82 104 24 578
14128964 pcs CUM 4 4 308 364 364 368 450 554 578 578 578 578 0 0 0 0 0 0 0
% Produced 0 0 0 9 22.5 30 28.5 10 0
Pallet Produced 0 0.0 0.0 52.0 130.1 173.4 164.7 57.8 0.0
Subtotal 4 4 308 364 364.00 368.00 397.98 371.93 222.53 57.80 0.00 0.00 0.00 0.00 0.00 0.00 0.00 0.00 0.00 0.00 0.00 0.00 0.00 0.00
In Home Date 15-Oct Receiving 4 21 11 16 27 32 61 57 4 66 110 22 486
11940913 pcs CUM 4 4 59 80 80 91 107 134 166 227 284 288 288 354 464 486 486 486 486 486 486 486 486
% Produced 9 22.5 30 28.5 10
Pallet Produced 43.74 109.35 145.8 138.51 48.6 0
Subtotal 4 4 59 80 80 91 107 134 166 227 284 288 288 310.26 310.91 187.11 48.60 0.00 0.00 0.00 0.00 0.00 0.00 0.00
In Home Date 22-Oct Receiving 2 1 1 6 2 36 18 103 50 47 64 57 7 120 52 21 593
14977496 pcs CUM 2 2 9 9 9 9 10 16 18 54 72 72 72 175 225 272 336 393 400 400 520 572 593
% Produced 0 0 0 9 22.5 30 28.5 10
Pallet Produced
0 0 0 53 133 178 169 59 0
Subtotal 2 393 400 400 467 385 228 59 0 0
1657
Total/Day 10 8 367 444 444 459 505 506 389 285 284 288 288 310 311 187 49 393 400 400 467 385 228 59
Perpectual 21 21 21 21 21 21 21 21 21 21 21 21 21 21 21 21 21 21 21 21 21 21 21 21
Other Storage 5 5 5 5 5 5 5 5 5 5 5 5 5 5 5 5 5 5 5 5 5 5 5 5
Growth Est % 14% 14% 14% 14% 14% 14% 14% 14% 14% 14% 14% 14% 14% 14% 14% 14% 14% 14% 14% 14% 14% 14% 14% 14%
Growth Pallets 1 1 50 60 60 62 68 68 52 38 38 39 39 42 42 25 7 53 54 54 63 52 31 8
2,022,504
14%
Total 36 34 393 470 470 485 531 532 415 311 310 314 314 336 337 213 75 419 426 426 493 411 254 85
Created a model to compare 3 overlapping weeks of receiving and production. Factored in perpetual and growth – Max Utilization 532 positions
CASE STUDY 9
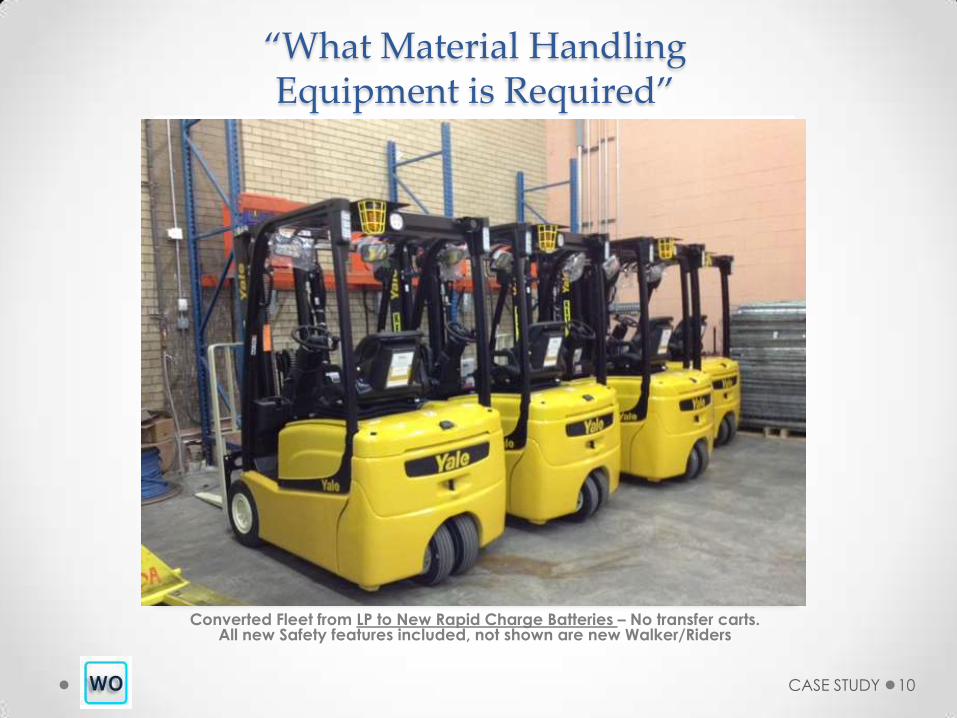
“What Material Handling Equipment is Required”
Converted Fleet from LP to New Rapid Charge Batteries – No transfer carts. All new Safety features included, not shown are new Walker/Riders
CASE STUDY 10
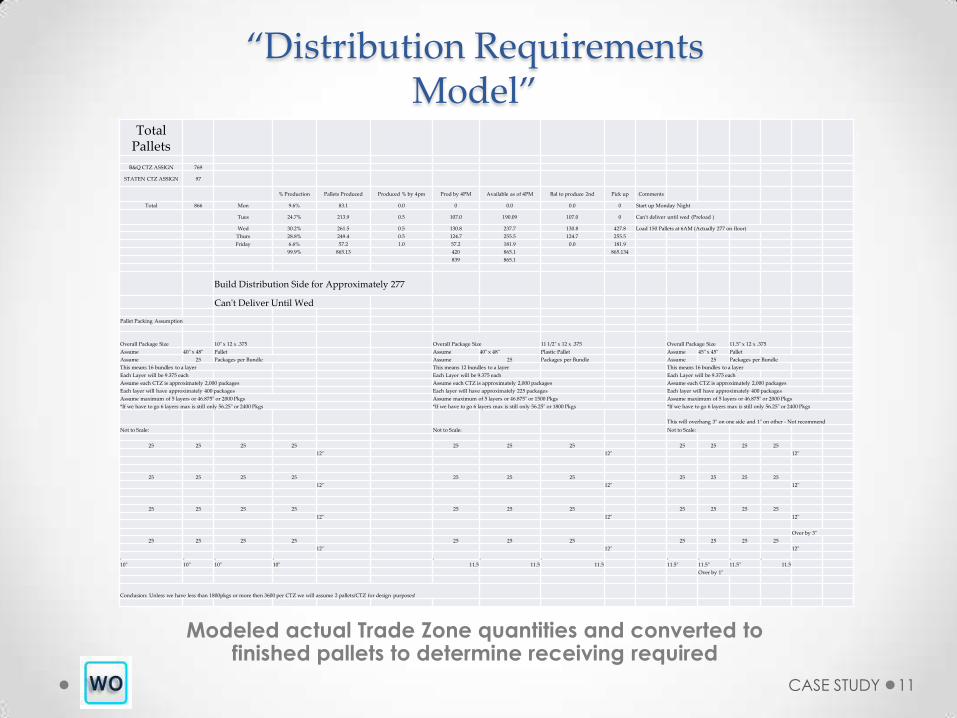
“Distribution Requirements Model”
Total Pallets
B&Q CTZ ASSIGN 769
STATEN CTZ ASSIGN 97
% Production Pallets Produced Produced % by 4pm Prod by 4PM Available as of 4PM Bal to produce 2nd Pick up Comments
Total 866 Mon 9.6% 83.1 0.0 0 0.0 0.0 0 Start up Monday Night
Tues 24.7% 213.9 0.5 107.0 190.09 107.0 0 Can't deliver until wed (Preload )
Wed 30.2% 261.5 0.5 130.8 237.7 130.8 427.8 Load 150 Pallets at 6AM (Actually 277 on floor)
Thurs 28.8% 249.4 0.5 124.7 255.5 124.7 255.5
Friday 6.6% 57.2 1.0 57.2 181.9 0.0 181.9
99.9% 865.13 420 865.1 865.134
839 865.1
Build Distribution Side for Approximately 277
Can't Deliver Until Wed
Pallet Packing Assumption
Overall Package Size 10" x 12 x .375 Overall Package Size 11 1/2" x 12 x .375 Overall Package Size 11.5" x 12 x .375
Assume 40" x 48" Pallet Assume 40" x 48" Plastic Pallet Assume 45" x 45" Pallet
Assume 25 Packages per Bundle Assume 25 Packages per Bundle Assume 25 Packages per Bundle
This means 16 bundles to a layer This means 12 bundles to a layer This means 16 bundles to a layer
Each Layer will be 9.375 each Each Layer will be 9.375 each Each Layer will be 9.375 each
Assume each CTZ is approximately 2,000 packages Assume each CTZ is approximately 2,000 packages Assume each CTZ is approximately 2,000 packages
Each layer will have approximately 400 packages Each layer will have approximately 225 packages Each layer will have approximately 400 packages
Assume maximum of 5 layers or 46.875" or 2000 Pkgs Assume maximum of 5 layers or 46.875" or 1500 Pkgs Assume maximum of 5 layers or 46.875" or 2000 Pkgs
*If we have to go 6 layers max is still only 56.25" or 2400 Pkgs *If we have to go 6 layers max is still only 56.25" or 1800 Pkgs *If we have to go 6 layers max is still only 56.25" or 2400 Pkgs
This will overhang 3" on one side and 1" on other - Not recommend
Not to Scale: Not to Scale: Not to Scale:
25 25 25 25 25 25 25 25 25 25 25
12" 12" 12"
25 25 25 25 25 25 25 25 25 25 25
12" 12" 12"
25 25 25 25 25 25 25 25 25 25 25
12" 12" 12"
Over by 3"
25 25 25 25 25 25 25 25 25 25 25
12" 12" 12"
10" 10" 10" 10" 11.5 11.5 11.5 11.5" 11.5" 11.5" 11.5
Over by 1"
Conclusion: Unless we have less than 1800pkgs or more then 3600 per CTZ we will assume 2 pallets/CTZ for design purposes!
Modeled actual Trade Zone quantities and converted to finished pallets to determine receiving required
CASE STUDY 11
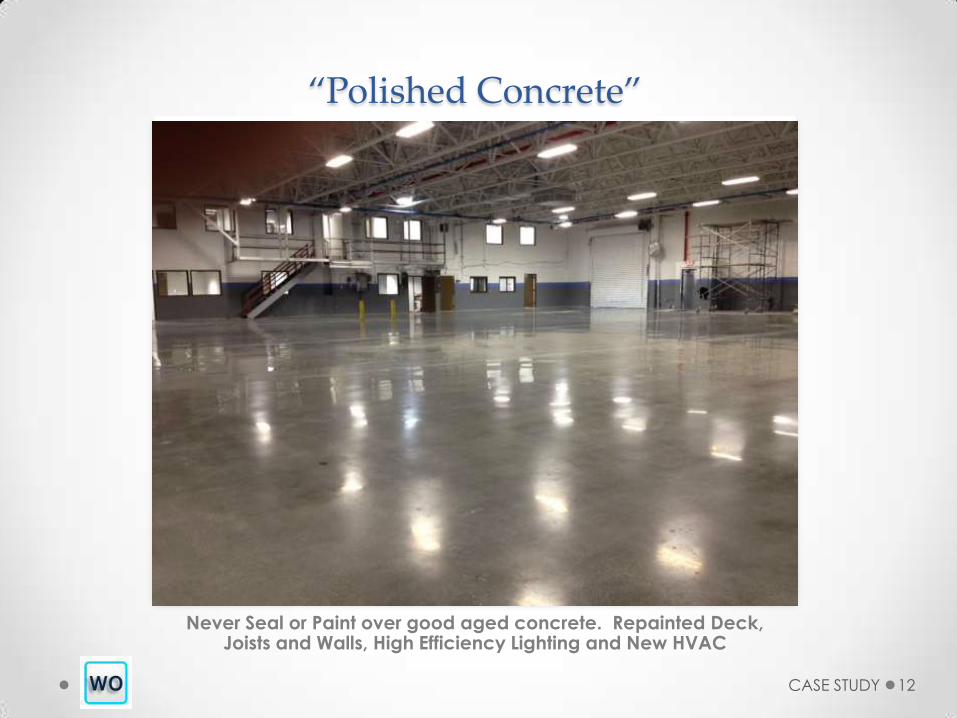
“Polished Concrete”
Never Seal or Paint over good aged concrete. Repainted Deck, Joists and Walls, High Efficiency Lighting and New HVAC
CASE STUDY 12
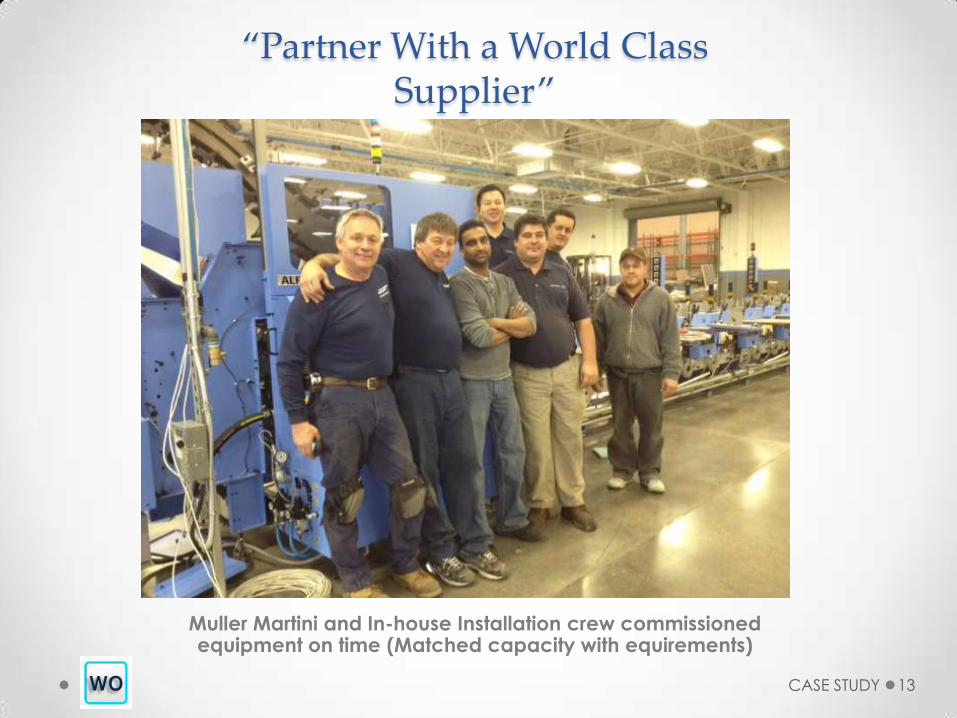
“Partner With a World Class Supplier”
Muller Martini and In-house Installation crew commissioned equipment on time (Matched capacity with equirements)
CASE STUDY 13
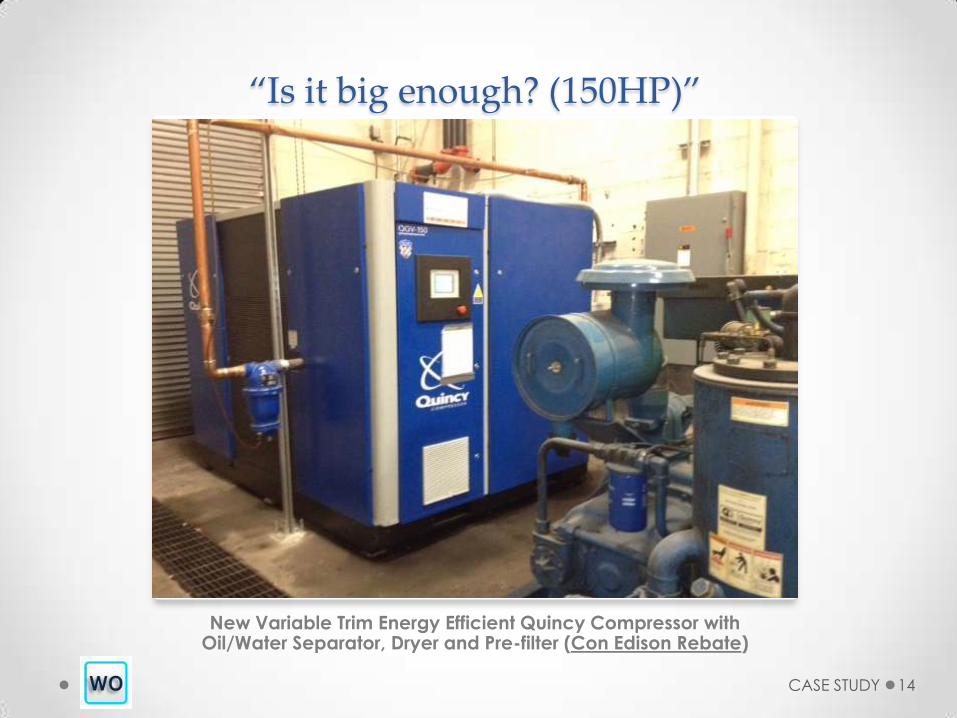
“Is it big enough? (150HP)”
New Variable Trim Energy Efficient Quincy Compressor with Oil/Water Separator, Dryer and Pre-filter (Con Edison Rebate)
CASE STUDY 14

“Never Forget Your Training”
One of the many classes we had with Muller Martini –Key to success is process improvement!
CASE STUDY 15
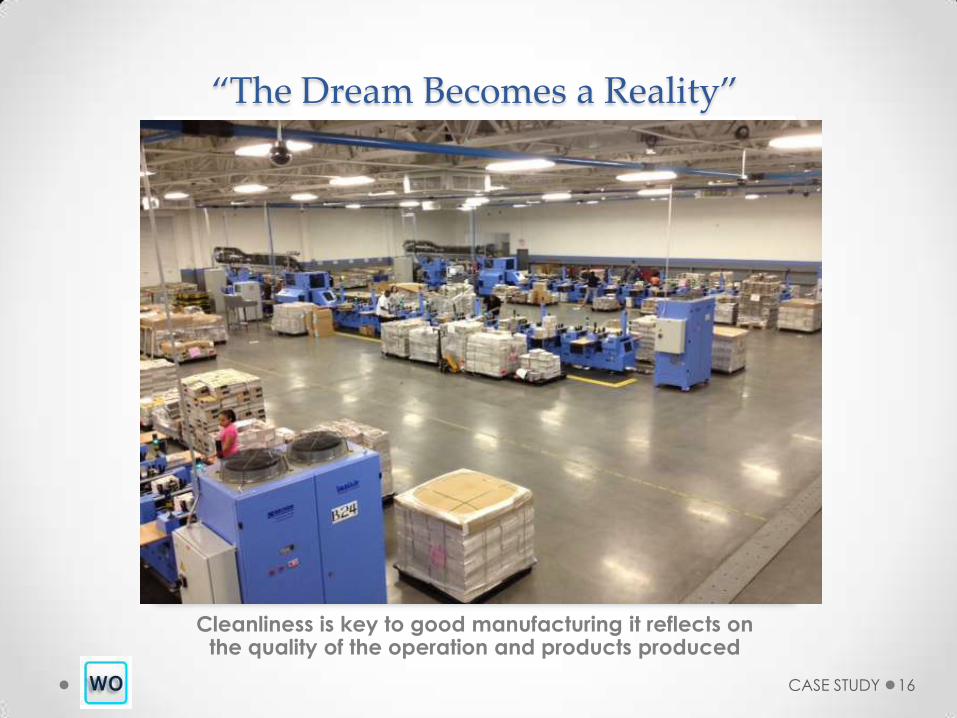
“The Dream Becomes a Reality”
Cleanliness is key to good manufacturing it reflects on the quality of the operation and products produced
CASE STUDY 16
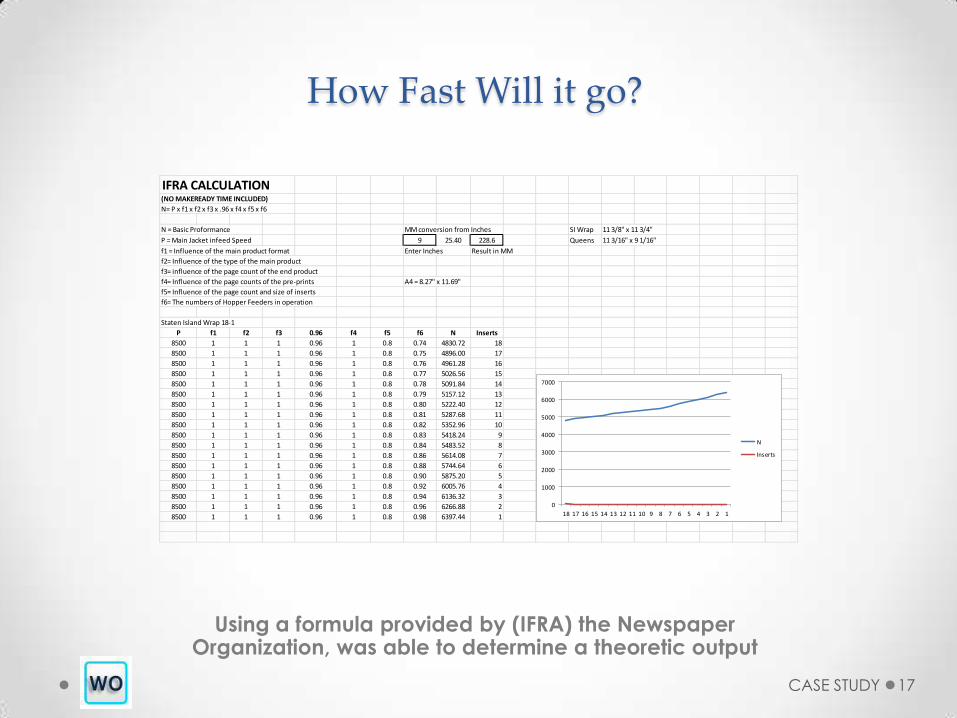
How Fast Will it go?
Using a formula provided by (IFRA) the Newspaper Organization, was able to determine a theoretic output
CASE STUDY 17
IFRA CALCULATION(NO MAKEREADY TIME INCLUDED)
N= P x f1 x f2 x f3 x .96 x f4 x f5 x f6
N = Basic Proformance MM conversion from Inches SI Wrap 11 3/8" x 11 3/4"
P = Main Jacket infeed Speed 9 25.40 228.6 Queens 11 3/16" x 9 1/16"
f1 = Influence of the main product format Enter Inches Result in MM
f2= Influence of the type of the main product
f3= influence of the page count of the end product
f4= Influence of the page counts of the pre-prints A4 = 8.27" x 11.69"
f5= Influence of the page count and size of inserts
f6= The numbers of Hopper Feeders in operation
Staten Island Wrap 18-1
P f1 f2 f3 0.96 f4 f5 f6 N Inserts
8500 1 1 1 0.96 1 0.8 0.74 4830.72 18
8500 1 1 1 0.96 1 0.8 0.75 4896.00 17
8500 1 1 1 0.96 1 0.8 0.76 4961.28 16
8500 1 1 1 0.96 1 0.8 0.77 5026.56 15
8500 1 1 1 0.96 1 0.8 0.78 5091.84 14
8500 1 1 1 0.96 1 0.8 0.79 5157.12 13
8500 1 1 1 0.96 1 0.8 0.80 5222.40 12
8500 1 1 1 0.96 1 0.8 0.81 5287.68 11
8500 1 1 1 0.96 1 0.8 0.82 5352.96 10
8500 1 1 1 0.96 1 0.8 0.83 5418.24 9
8500 1 1 1 0.96 1 0.8 0.84 5483.52 8
8500 1 1 1 0.96 1 0.8 0.86 5614.08 7
8500 1 1 1 0.96 1 0.8 0.88 5744.64 6
8500 1 1 1 0.96 1 0.8 0.90 5875.20 5
8500 1 1 1 0.96 1 0.8 0.92 6005.76 4
8500 1 1 1 0.96 1 0.8 0.94 6136.32 3
8500 1 1 1 0.96 1 0.8 0.96 6266.88 2
8500 1 1 1 0.96 1 0.8 0.98 6397.44 1
0
1000
2000
3000
4000
5000
6000
7000
18 17 16 15 14 13 12 11 10 9 8 7 6 5 4 3 2 1
N
Inserts

Return on Investment – Less than one year!
“If we are to achieve results never before accomplished, we must expect to employ
methods never before attempted” – Sir Francis Bacon
CASE STUDY 18