building quÉbec’s first diamond...
TRANSCRIPT
BUILDING QUÉBEC’S FIRST DIAMOND MINEAnnual General Meeting, October 19th 2015, Montreal
Matt Manson Patrick GodinPresident, CEO & Director COO & Director

2
Forward-Looking Information
This presentation contains "forward-looking information" within the meaning of Canadian securities legislation. This information and these statements, referred to herein as“forward-looking statements”, are made as of the date of this presentation and the Corporation does not intend, and does not assume any obligation, to update these forward-looking statements, except as required by law. These forward-looking statements include, among others, statements with respect to our beliefs, plans, objectives, expectations,anticipations, estimates and intentions. Although management considers these assumptions to be reasonable based on information currently available to it, they may prove tobe incorrect.
Forward-looking statements relate to future events or future performance and reflect current expectations or beliefs regarding future events and include, but are not limited to,statements with respect to: (i) the amount of Mineral Resources and exploration targets; (ii) the amount of future production over any period; (iii) net present value and internalrates of return of the mining operation; (iv) assumptions relating to recovered grade, average ore recovery, internal dilution, mining dilution and other mining parameters set outin the 2011 Feasibility Study or the Optimization Study; (v) assumptions relating to gross revenues, operating cash flow and other revenue metrics set out in the 2011Feasibility Study or the Optimization Study; (vi) mine expansion potential and expected mine life; (vii) expected time frames for completion of permitting and regulatoryapprovals related to construction activities at the Renard Diamond Project; (viii) the expected time frames for the completion of the open pit and underground mine at theRenard Diamond Project; (ix) the expected time frames for the completion of construction, start of mining and commercial production at the Renard Diamond Project and thefinancial obligations or costs incurred by Stornoway in connection with such mine development; (x) future exploration plans; (xi) future market prices for rough diamonds; (xii)the economic benefits of using liquefied natural gas rather than diesel for power generation; (xiii) sources of and anticipated financing requirements; (xiv) the effectiveness,funding or availability, as the case may require, of the Stream, the Senior Secured Loan, the COF and the Equipment Facility and the use of proceeds therefrom; (xv) theCorporation’s expectations regarding receipt of the remaining deposits under the Stream and its ability to meet its delivery obligations thereunder; (xvi) the impact of theFinancing Transactions on the Corporation’s operations, infrastructure, opportunities, financial condition, access to capital and overall strategy; (xvii) the foreign exchange ratebetween the US dollar and the Canadian dollar; and (xviii) the availability of excess funding for the construction and operation of the Renard Diamond Project. Any statementsthat express or involve discussions with respect to predictions, expectations, beliefs, plans, projections, objectives, assumptions or future events or performance (often, but notalways, using words or phrases such as “expects”, “anticipates”, “plans”, “projects”, “estimates”, “assumes”, “intends”, “strategy”, “goals”, “objectives”, “schedule” or variationsthereof or stating that certain actions, events or results “may”, “could”, “would”, “might” or “will” be taken, occur or be achieved, or the negative of any of these terms and similarexpressions) are not statements of historical fact and may be forward-looking statements.
Forward-looking statements are made based upon certain assumptions by Stornoway or its consultants and other important factors that, if untrue, could cause the actualresults, performances or achievements of Stornoway to be materially different from future results, performances or achievements expressed or implied by such statements.Such statements and information are based on numerous assumptions regarding present and future business prospects and strategies and the environment in whichStornoway will operate in the future, including the price of diamonds, anticipated costs and Stornoway’s ability to achieve its goals, anticipated financial performance, regulatorydevelopments, development plans, exploration, development and mining activities and commitments, and the foreign exchange rate between the US and Canadian dollars.Although management considers its assumptions on such matters to be reasonable based on information currently available to it, they may prove to be incorrect. Certainimportant assumptions by Stornoway or its consultants in making forward-looking statements include, but are not limited to: (i) required capital investment and estimatedworkforce requirements; (ii) estimates of net present value and internal rates of return; (iii) anticipated timelines for completion of construction, commencement of mineproduction and development of an open pit and underground mine at the Renard Diamond Project, which heavily depend, among other things, on adequate availability andperformance of skilled labour, engineering and construction personnel, performance of mining and construction equipment and timely delivery of components; (iv) anticipatedgeological formations; (v) market prices for rough diamonds and the potential impact on the Renard Diamond Project; (vi) the satisfaction or waiver of all conditions under eachof the Stream, the Senior Secured Loan, the COF and the Equipment Facility to allow the Corporation to draw on the funding available under those financing elements for thecompletion of the development and construction of the Renard Diamond Project; (vii) Stornoway’s interpretation of the geological drill data collected and its potential impact onstated Mineral Resources and mine life; (viii) future exploration plans and objectives; (ix) the receipt of the remaining deposits under the Stream and the Corporation’s ability tomeet its delivery obligations thereunder; and (x) the continued strength of the US dollar against the Canadian dollar. Additional risks are described in Stornoway's most recentlyfiled Annual Information Form, annual and interim MD&A, and other disclosure documents available under the Corporation’s profile at: www.sedar.com.
3
Forward-Looking Information (contd)
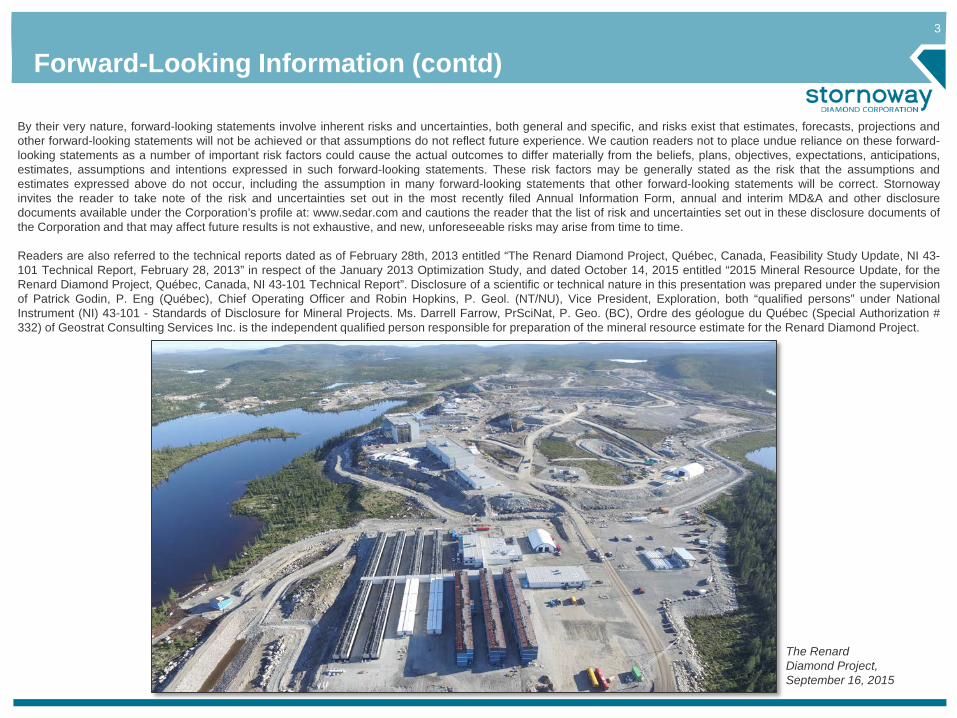
The RenardDiamond Project, September 16, 2015
By their very nature, forward-looking statements involve inherent risks and uncertainties, both general and specific, and risks exist that estimates, forecasts, projections andother forward-looking statements will not be achieved or that assumptions do not reflect future experience. We caution readers not to place undue reliance on these forward-looking statements as a number of important risk factors could cause the actual outcomes to differ materially from the beliefs, plans, objectives, expectations, anticipations,estimates, assumptions and intentions expressed in such forward-looking statements. These risk factors may be generally stated as the risk that the assumptions andestimates expressed above do not occur, including the assumption in many forward-looking statements that other forward-looking statements will be correct. Stornowayinvites the reader to take note of the risk and uncertainties set out in the most recently filed Annual Information Form, annual and interim MD&A and other disclosuredocuments available under the Corporation’s profile at: www.sedar.com and cautions the reader that the list of risk and uncertainties set out in these disclosure documents ofthe Corporation and that may affect future results is not exhaustive, and new, unforeseeable risks may arise from time to time.
Readers are also referred to the technical reports dated as of February 28th, 2013 entitled “The Renard Diamond Project, Québec, Canada, Feasibility Study Update, NI 43-101 Technical Report, February 28, 2013” in respect of the January 2013 Optimization Study, and dated October 14, 2015 entitled “2015 Mineral Resource Update, for theRenard Diamond Project, Québec, Canada, NI 43-101 Technical Report”. Disclosure of a scientific or technical nature in this presentation was prepared under the supervisionof Patrick Godin, P. Eng (Québec), Chief Operating Officer and Robin Hopkins, P. Geol. (NT/NU), Vice President, Exploration, both “qualified persons” under NationalInstrument (NI) 43-101 - Standards of Disclosure for Mineral Projects. Ms. Darrell Farrow, PrSciNat, P. Geo. (BC), Ordre des géologue du Québec (Special Authorization #332) of Geostrat Consulting Services Inc. is the independent qualified person responsible for preparation of the mineral resource estimate for the Renard Diamond Project.

4
Stornoway Diamond Corporation TSX:SWY
On Budget, On ScheduleConstruction 47.4% complete compared to 42.9% planned by end September 2015.
Forecast cost to complete within C$811m budget.Plant Commissioning 2H 2016. Commercial Production 2Q 2017.
Building the Renard Diamond Project, Québec’s First Diamond Mine
Site Overview Sep 16, 2015The RenardDiamond Project, September 16, 2015
5
From the 2014 AGM…
43
Québec’s First Diamond Mine is Ready to Build
Project Green-lighted: Authorizations Issued
Community Agreements in Place
Stornoway Operating Team in Place
Access Road Opened
Resource Growing
Project Design Fully Optimized
Favourable Cost Environment
Stornoway is Fully Focused on the Timely Completion of Final Project
Financing
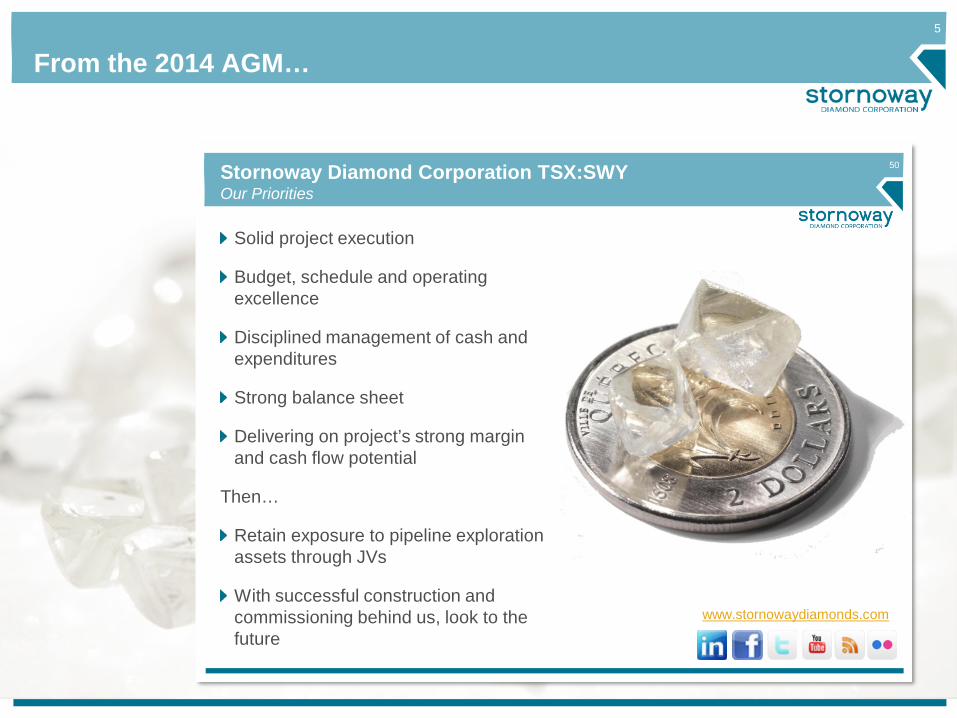
50Stornoway Diamond Corporation TSX:SWYOur Priorities
www.stornowaydiamonds.com
Solid project execution
Budget, schedule and operating excellence
Disciplined management of cash and expenditures
Strong balance sheet
Delivering on project’s strong margin and cash flow potential
Then…
Retain exposure to pipeline exploration assets through JVs
With successful construction and commissioning behind us, look to the future

6Good TimingThe Renard Project Financing, Closed July 8th, 2014
Type Amount (% of Total) Description
Common Equity C$374M (40%)• C$132M marketed public equity offering of subscription receipts• C$242M private placement to Orion (US$110M), RQ (C$100M) and Caisse (C$22M)
Diamond Stream US$250M (29%) • 20% diamond stream (Orion 16%, Caisse 4%) with ~US$56/ct(1) ongoing payment
Convertible Debentures US$81M (9%) • Provided by Orion; 7 year, 6.25% coupon, 35% conversion premium to equity issue price
Senior Debt C$120M (11%) • Provided by IQ; 7 year amortizing payment, Fixed (QC Bond)+5.75% or Prime +4.75%
Equipment Financing US$35M (4%) • Provided by Caterpillar
Cost Overrun Facility C$48M (5%) • C$20M provided by IQ (same terms as senior debt)• C$28M provided by Caisse (unsecured, 7 year term, 10% coupon)
Total C$946M (100%)
Assumes US$1.00 = C$1.101. Includes reimbursement of marketing expenses
Counter-Party Amount (% of Total)
Orion Mine Finance C$367M (39%)
Investissement Québec/ Ressources Québec C$240M (25%)
Caisse de dépôt et placement du Québec C$105M (11%)
Caterpillar Financial C$39M (4%)
Public C$195M (21%)
Total C$946M (100%)
In April 2015 Blackstone Tactical Opportunities, an affiliate of Blackstone (NYSE-BX), acquired a c.5% equity position in Stornoway and a minority 4% ownership interest in the Renarddiamond stream by way of a secondary market transaction with Orion Mine Finance (“Orion”).
The first two of three tranches of the Renard Diamond stream funded in March and September 2015, on schedule. The third and final tranche is scheduled for March 2016.
Subsequent to Transaction Closing

7Good Timing: Sources and Uses of Funds to July 31, 2015On Current C$:US$ Exchange Rates, Unaudited unless noted
(all amounts in millions of C$) Assumed
Actual use of Proceeds to July 31,
2015
Renard Diamond Project
Capital Expenditures 811 311
Route 167 Extension (1) 70 70
Financing Costs, Interest during Construction 58 24
Mine Closure Guarantee 16 2
Pre-production Net Revenue (26) -
Total Project Costs 929 407
General Corporate Purposes
Equity fees and transaction costs 18 29
General working capital, administrative and salary expenses 14 6
Total Uses 961 442
Costs
Notes1. The total amount borrowed pursuant to the Renard Mine Road loan was $77 million, of which $70 million was used for construction of the Renard Mine Road and $7 million was used
for civil works related to the airstrip. Costs related to the airstrip were included in the $811 million capital expenditures line in the table above.2. On September 30, 2015, Stornoway received the second tranche of US$80m of stream funding, which was subsequently converted to C$ at an exchange rate of $1.336, representing
a cash gain of C$18.9 million compared to the July 2014 funding plan, which assumed a C$:US$ exchange rate of $1.10. 3. Cost Overrun Facility includes the $20 million Senior Loan Facility, Tranche B and the $28 million Cost Overrun Facility with the CDPQ4. Assuming a C$:US$ conversion rate of C$1.255. This forecast assumes a project cost of $811 million (which includes assumed levels of escalation and contingencies), the satisfaction of all covenants and conditions precedent for
future funding, and a CAD$:US$ exchange rate of $1.25 for unfunded US dollar denominated financing commitments.
(all amounts in millions of C$)
Sources of Funds
Stream Deposits not yet received(2) 213
Senior Loan Facility, Tranche A 100
Cost Overrun Facility(3) 48
Equipment Financing Facility(4) 17
Undrawn Sources of Funds
As of July 31, 2015, Stornoway forecasts excessfinancing capacity available to complete the projectof approximately $101 million comprised of $53million of cash, receivables and expected minetax credits and $48 million of undrawn costoverrun facilities(5).
8Good Timing: Capital MarketsRecent Equity Issue Activity in the Mining Sector
Total Mining Issuance
Mining Issuance: 2014 and 2015 YTD
Sub-Sector # Deals C$MM
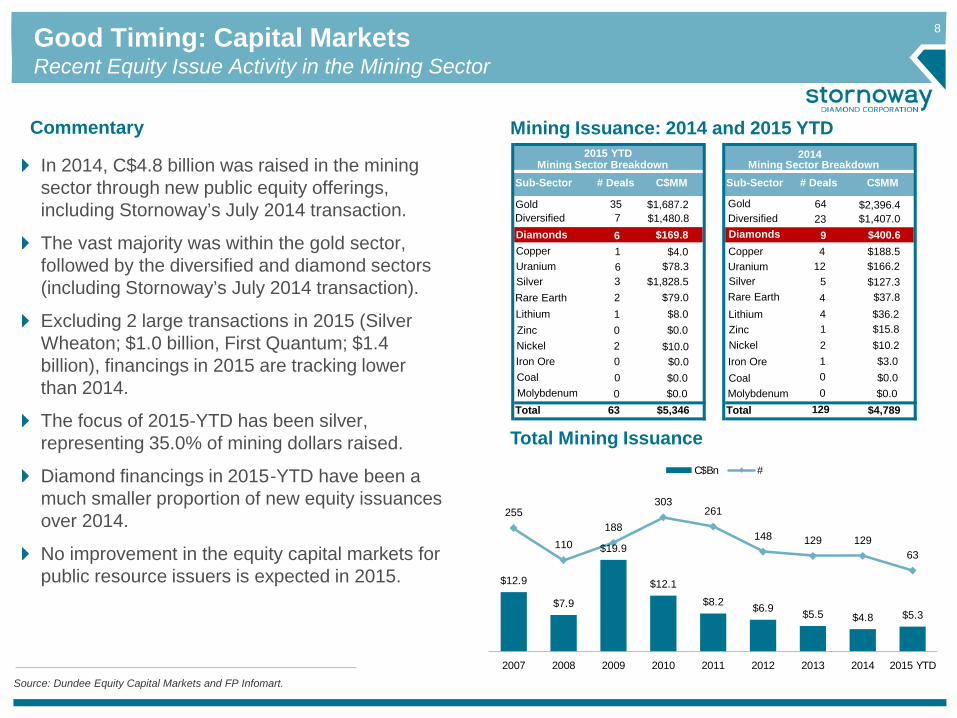
Gold 35 $1,687.2
Uranium 6 $78.3Silver 3 $1,828.5Rare Earth 2 $79.0
Zinc 0 $0.0
Coal 0 $0.0Molybdenum 0 $0.0
Nickel 2 $10.0
Total 63 $5,346
2015 YTDMining Sector Breakdown
Diamonds 6 $169.8Diversified 7 $1,480.8
Lithium 1 $8.0
Iron Ore 0 $0.0
Sub-Sector # Deals C$MM
Gold 64 $2,396.4Diversified 23 $1,407.0
Uranium 12 $166.2Copper 4 $188.5
Lithium1 $15.8
Silver 5 $127.3Rare Earth
4$37.8
Coal1
$0.0Molybdenum
0$0.0
Nickel
0
$10.2
Total 129 $4,789
2014Mining Sector Breakdown
Zinc
4$36.2
Iron Ore2
$3.0
Diamonds 9 $400.6
In 2014, C$4.8 billion was raised in the mining sector through new public equity offerings, including Stornoway’s July 2014 transaction.
The vast majority was within the gold sector, followed by the diversified and diamond sectors (including Stornoway’s July 2014 transaction).
Excluding 2 large transactions in 2015 (Silver Wheaton; $1.0 billion, First Quantum; $1.4 billion), financings in 2015 are tracking lower than 2014.
The focus of 2015-YTD has been silver, representing 35.0% of mining dollars raised.
Diamond financings in 2015-YTD have been a much smaller proportion of new equity issuances over 2014.
No improvement in the equity capital markets for public resource issuers is expected in 2015.
Commentary
$12.9
$7.9
$19.9
$12.1
$8.2 $6.9 $5.5 $4.8 $5.3
255
110
188
303261
148 129 12963
2007 2008 2009 2010 2011 2012 2013 2014 2015 YTD
C$Bn #
Copper 1 $4.0
Source: Dundee Equity Capital Markets and FP Infomart.
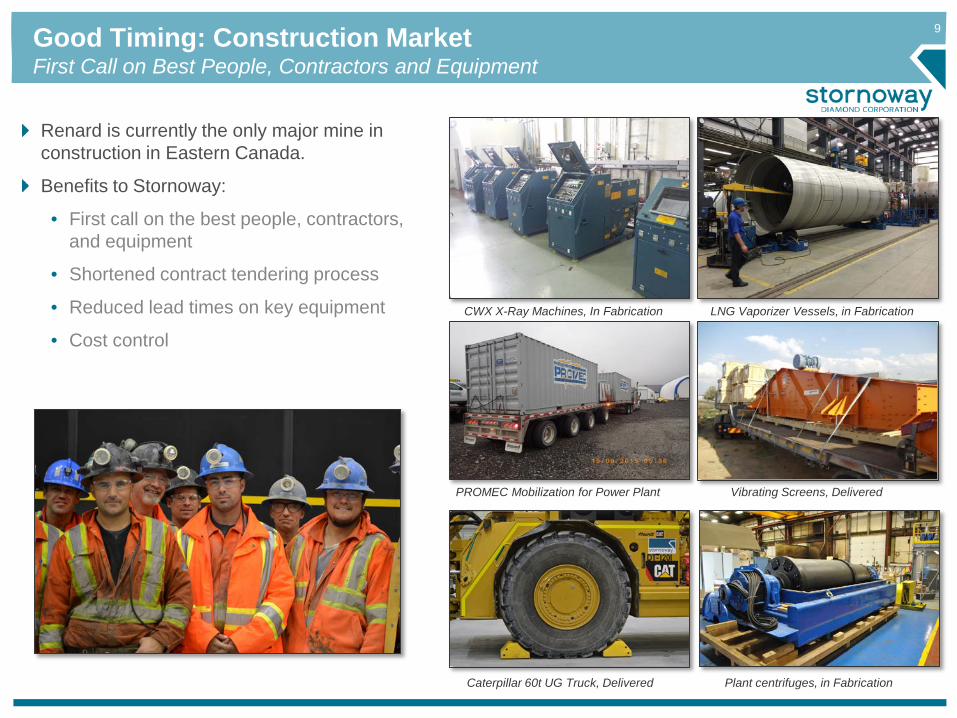
9Good Timing: Construction MarketFirst Call on Best People, Contractors and Equipment
CWX X-Ray Machines, In Fabrication LNG Vaporizer Vessels, in Fabrication
PROMEC Mobilization for Power Plant Vibrating Screens, Delivered
Caterpillar 60t UG Truck, Delivered Plant centrifuges, in Fabrication
Renard is currently the only major mine in construction in Eastern Canada.
Benefits to Stornoway:
• First call on the best people, contractors, and equipment
• Shortened contract tendering process
• Reduced lead times on key equipment
• Cost control

10Good Timing: Diamond Market and Canadian DollarRough Diamond Pricing 2009-2015
May 2011 FS Diamond Valuation
50
100
150
200
250
300
350
1-Jan-09 1-Jan-10 1-Jan-11 1-Jan-12 1-Jan-13 1-Jan-14 1-Jan-15
Inde
x to
200
9=10
0
WWW Rough Index, Renard Model Price Growth, Real Terms
CAD
USD
FS 2.5% Price Model (Nominal, adjusted
for CPI) with +/- 10% Sensitivity
WWW Rough Diamond Price Index

11Publicly Listed Diamond Producers, Developers and ExplorersConsensus Analyst Views on Value
Ticker Price(16/10/15)
Shares O/S
(mm)
MarketCap
($mm)NAV/sh(1) Current
P/NAV(1) Target (1) % Return to Target
AnnualDividend
Diamond ProducersALROSA ALRS:M ₽56.06 7,365.0 ₽412,880 (n/a) (n/a) ₽77.17 40% ₽1.47/sh
Dominion Diamonds DDC:T $13.95 85.1 $1,187.6 $29.88 0.5x $24.80 81% US$0.40/sh
Gem GEMD:LN £1.08 138.3 £149.7 £2.16 0.5x £1.84 73% US$0.05/sh
Lucara LUC:T $1.73 379.6 $656.6 $2.48 0.7x $2.50 47% $0.04/sh
Petra PDL:LN £0.94 512.1 £478.8 £1.85 0.5x £1.78 93% £0.02/sh
Diamond DevelopersFirestone FDI:LN £0.22 309.0 £67.6 £0.51 0.4x £0.45 104% (n/a)
Mountain Province MPV:T $4.16 159.7 $664.2 $7.15 0.6x $6.69 61% (n/a)
Stornoway SWY:T $0.74 732.3 $541.9 $1.47 0.5x $1.21 64% (n/a)
Diamond ExplorersKennady Diamonds KDI:LN $2.95 46.3 $136.4 (n/a) (n/a) (n/a) (n/a) (n/a)
North Arrow Minerals NAR:V $0.25 54.0 $13.5 (n/a) (n/a) (n/a) (n/a) (n/a)
Peregrine Diamonds PGD:T $0.175 282.7 $49.5 (n/a) (n/a) (n/a) (n/a) (n/a)
Shore Gold SGF:T $0.17 248.7 $42.3 (n/a) (n/a) (n/a) (n/a) (n/a)
Notes:
1. Bloomberg and Thomson One Analyst Consensus
All Currencies in C$ unless specified

12
ShareholdingShare Price (TSX-SWY):Oct 16, 2015 C$ $0.74
52 week High-Low C$ $0.46–$0.85
Average Daily Volume:Last 12 Months 374,593
Market Capitalization: C$ 542 million
Total Shares Outstanding: 732 million
Total Options & Warrants Outstanding:(28.2m Options $0.59-$5.36; 123.8m warrants $0.90-$1.21)
152 million
Consolidated Cash1,2: (as of July 31, 2015) C$ 270 million
Consolidated Debt1: (as of July 31, 2015) C$ 220 million
Undrawn Financing Commitments2,3: (Subject to Financing Agreement CPs) C$ 352 million
Balance Sheet
Balance Sheet and Capital Structure
Notes1. Unaudited2. Does not include funds received from second tranche of the Stream on
September 30th
3. Assuming a C$:US$ conversion rate of C$1.10
Investissement Québec 28.6% 22.7%
Orion Mine Finance 19.5% 17.5%
CDPQ 6.1% 6.2%
Float 45.8% 53.6%
DilutedBasic
-100.0%
-50.0%
0.0%
50.0%
100.0%
150.0%
One Year Equity Performance of Selected Diamond Companies
SWY DDC GEMD LUCPDL FDI MPV KDINAR PGD SGF

1313
Renard Mineral Resources and Exploration Upside

800m
900m
1100m
1200m
1000m
Renard Mine Plan and Key Operating AssumptionsA Combined Open Pit and Underground Operation
Notes1. Key Assumptions:C$1=US$1, Oil US$95/barrel, 2.5% real terms diamond
price growth, 82.9% ore recovery, 23.8% mining and internal dilution, 0cpht dilution grade.
2. Expressed in May 2011 terms. Average price US$190/carat in March 2014 terms.
3. Expressed in October 2012 terms, as adjusted in October 2013 LNG FS. Includes C$754m of costs and contingencies and C$57m of escalation allowance.
4. Expressed in October 2012 terms. Operating costs C$54/tonne in October 2013 LNG FS terms. Excludes capitalized preproduction costs.
5. Before stream
Reserve and Resource categories are compliant with the "CIM Definition Standards on Mineral Resources and Reserves". Mineral resources that are not mineral reserves do not have demonstrated economic viability. The potential quantity and grade of any Exploration Target is conceptual in nature, and it is uncertain if further exploration will result in the target being delineated as a mineral resource.
Reserve Based Mine Plan1
(Jan 2013 FS Optimization and October 2013 LNG Option FS)
Mine Life 11 yearsMineral Reserve 17.9 mcaratsAve. Diamond Price2 $180/caratProduction Rate 2.2 mtonnes/yrAve. Diamond Production 1.6 mcarats/yrGross Revenue (C$M)2 $4,268Initial Capital Costs3 $811mOperating Cost4 $58/t ($76/carat)Operating Margin5 67%Payback 4.8 years
0m
100m
200m
400m
600m
700m
500m
300m
Renard 4
Renard 9
Renard 65Renard 2 Renard 3
Mineral Resource Estimate Effective September 24, 2015 (NI 43-101)
13 mcarats Inferred Mineral Resources33 to 71 mcarats TFFE
30 mcarats Indicated Mineral Resources
An Updated Renard Mine Plan, scheduled for Q22016, is expected to include additional mineproduction from new Indicated Mineral Resourcesin Renard 2 and Renard 65, deepening of theRenard 2-3 open pit, extension of the undergroundmine infrastructure to 700m, and an optimizedschedule for plant commissioning and ramp-up.
14

15Renard 2 Mineral Resource ClassificationEffective September 24, 2015. Changes to Previous Estimate Shown in Italics
Pipe shape at surface (1.89ha)
High TFFE at 1,250m (1.38ha)
Notes1 Reserve and Resource categories were completed in accordance with the "CIM Definition Standardson Mineral Resources and Reserves". Mineral resources that are not mineral reserves do not havedemonstrated economic viability.2 Totals may not add due to rounding.3 Carats per hundred tonnes. Estimated at a +1 DTC sieve size cut-off.4 Diamond valuation data utilized for the test of prospects of reasonable economic extraction arederived from a diamond valuation exercise undertaken in March 2014 (see Stornoway AnnualInformation Form dated July 2015).
0m
700m
850m
1250m
INDICATED
INFERRED
TFFE
600m: Base of Previous Indicated Mineral Resources
Depth Below
SurfaceKimberlite
outlineat surface (0.75ha)
Low TFFE at 1,250m (0.62ha)
Base of New Indicated
Resources (1.55ha)
Indicated Mineral Resources(1,2,4)
Contained Carats (millions) Tonnes (millions) Grade (cpht)(3)
Renard 2, All Units 21.58 +15.6% 25.70 +38.3% 84 -16.4%Renard 2, w/o CRB-2A, CRB 20.39 +11.0% 20.52 +15.9% 99 -4.3%
CRB-2A 0.29 +2.6% 0.90 +2.6% 32 --CRB 0.90 n/a 4.28 n/a 21 n/a
Inferred Mineral Resources(1,2)
Contained Carats (millions) Tonnes (millions) Grade (cpht)(3)
Renard 2, All Units 3.88 -48.0% 6.59 -44.0% 59 -7.2%Renard 2, w/o CRB 3.36 -46.1% 4.08 -22.0% 82 -30.9%CRB 0.53 -57.6% 2.51 -61.6% 21 +10.5%
Target for Further Exploration(1)
Contained Carats (millions)
Tonnes (millions) Grade (cpht)(2)
Renard 2, All Units 3.7 to 15.5 6.1 to 15.5 60 to 100
North View Renard 2 NI 43-101 Mineral Resource Estimate
Renard 2 Targets for Further Exploration
Notes1 Represents potential upside that can be reasonably assumed given the nature and grade of materialwithin the current 2015 Mineral Resource. The potential quantity and grade of any Exploration Target isconceptual in nature, there has been insufficient information to define a mineral resource, and it isuncertain if further exploration will result in the target being delineated as a mineral resource.2 Carats per hundred tonnes. Potential at a +1 DTC sieve size cut-off.
Pinch in model in area lacking drill
coverage

16Renard 2 Geological Model and Unit GradesEffective September 24, 2015. Changes to Previous Estimate Shown in Italics
Within the Indicated Mineral Resources
Average Grade (cpht)(1)
Average Dilution (%)(2)
Kimb 2a (“Blue”) 76 +3.0% 52 -0.9%Kimb 2b (“Brown”) 145 +1.0% 30 -0.9%Kimb 2c (HK)3 229 +0.5% 12 -3.1%CRB-2a 32 -- 93 --CRB 21 n/a 96 n/a
Within the Inferred Mineral Resources
Average Grade (cpht)(1)
Average Dilution (%)(2)
Kimb 2a (“Blue”) 67 -2.4% 65 +9.2%Kimb 2b (“Brown”) 145 +0.3% 30 +1.5%Kimb 2c (HK)3 229 +0.5% 12 -3.1%CRB 21 +10.5% 96 --
Notes1 Carats per hundred tonnes. Estimated at a +1 DTC sieve size cut-off.2 Represents the average amount of non-diamond bearing country rockestimated within each geological unit.3 The Kimb 2c (Hypabyssal Kimberlite, or “HK”) unit is a constituent componentof each of the Kimb2a, Kimb2b, CRB and CRB-2a units.
Renard 2 Average Mineral Resource Grades, by Geological Unit
Kimb2b (“Brown”)
Kimb2a (“Blue”) CRB CRB-2a Kimb2c (HK)
West View
Contact
Pinch in model in area lacking drill coverage
0m
700m
850m
1250m
INDICATED
INFERRED
TFFE
600m: Base of Previous Indicated Mineral Resources
Depth Below
Surface
North View
Photographs of geological units from
the 2007 Renardunderground bulk
sample program

17Renard 2 Geological Model and Renard 2-Renard 3 ConvergenceEffective September 24, 2015
Pipe shape at surface (1.89ha)
Kimberlite outlineat surface (0.75ha)
Kimb2b (“Brown”)
Kimb2a (“Blue”)
CRBCRB-2a
Surface View, Looking Down
Surface View, Looking Down
0m
700m
850m
1250m
R2 INDICATED
R2 INFERRED
R2 TFFE
Depth Below
Surface
R3 INDICATED
R3 INFERRED
R3 TFFE
North East View
Resource categories were completed in accordance with the "CIM Definition Standardson Mineral Resources and Reserves". Mineral resources that are not mineral reserves donot have demonstrated economic viability. The potential quantity and grade of anyExploration Target is conceptual in nature, there has been insufficient information todefine a mineral resource and it is uncertain if further exploration will result in the targetbeing delineated as a mineral resource.
Renard 2 Renard 3
Renard 2
Renard 3
126.6m R3 intersection in DDH R2-81J (in red) starting 942.2m downhole: 47m true width.
R3 TFFE: >500m potential between drill intersections
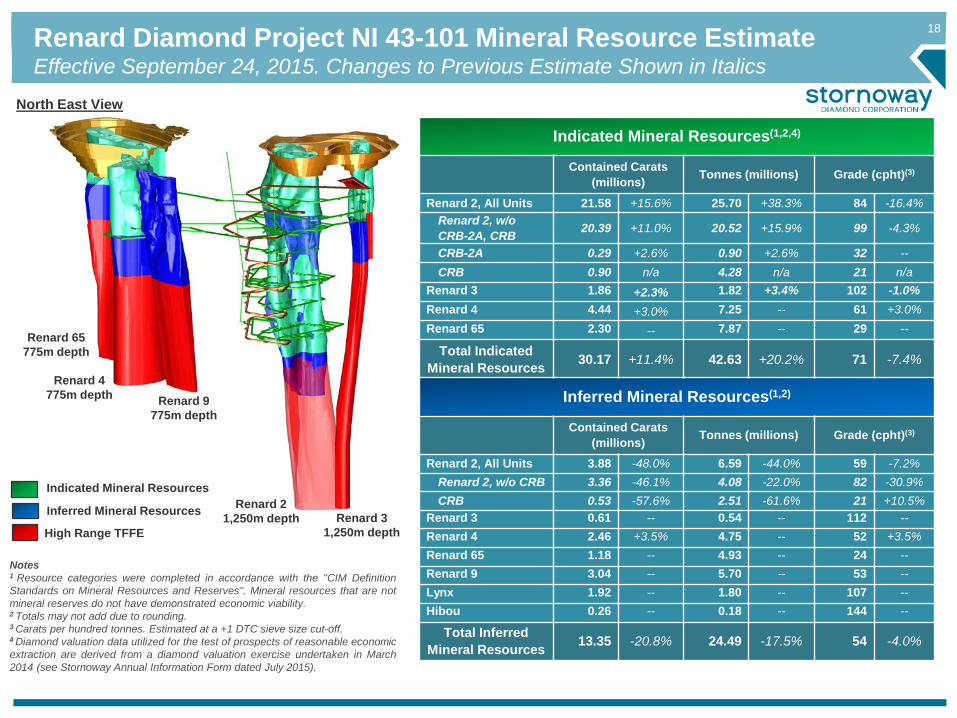
18Renard Diamond Project NI 43-101 Mineral Resource EstimateEffective September 24, 2015. Changes to Previous Estimate Shown in Italics
Notes1 Resource categories were completed in accordance with the "CIM DefinitionStandards on Mineral Resources and Reserves". Mineral resources that are notmineral reserves do not have demonstrated economic viability.2 Totals may not add due to rounding.3 Carats per hundred tonnes. Estimated at a +1 DTC sieve size cut-off.4 Diamond valuation data utilized for the test of prospects of reasonable economicextraction are derived from a diamond valuation exercise undertaken in March2014 (see Stornoway Annual Information Form dated July 2015).
Indicated Mineral Resources(1,2,4)
Contained Carats (millions) Tonnes (millions) Grade (cpht)(3)
Renard 2, All Units 21.58 +15.6% 25.70 +38.3% 84 -16.4%Renard 2, w/o CRB-2A, CRB 20.39 +11.0% 20.52 +15.9% 99 -4.3%
CRB-2A 0.29 +2.6% 0.90 +2.6% 32 --CRB 0.90 n/a 4.28 n/a 21 n/a
Renard 3 1.86 +2.3% 1.82 +3.4% 102 -1.0%Renard 4 4.44 +3.0% 7.25 -- 61 +3.0%Renard 65 2.30 -- 7.87 -- 29 --
Total Indicated Mineral Resources 30.17 +11.4% 42.63 +20.2% 71 -7.4%
Inferred Mineral Resources(1,2)
Contained Carats (millions) Tonnes (millions) Grade (cpht)(3)
Renard 2, All Units 3.88 -48.0% 6.59 -44.0% 59 -7.2%Renard 2, w/o CRB 3.36 -46.1% 4.08 -22.0% 82 -30.9%CRB 0.53 -57.6% 2.51 -61.6% 21 +10.5%
Renard 3 0.61 -- 0.54 -- 112 --Renard 4 2.46 +3.5% 4.75 -- 52 +3.5%Renard 65 1.18 -- 4.93 -- 24 --Renard 9 3.04 -- 5.70 -- 53 --Lynx 1.92 -- 1.80 -- 107 --Hibou 0.26 -- 0.18 -- 144 --
Total Inferred Mineral Resources 13.35 -20.8% 24.49 -17.5% 54 -4.0%
Inferred Mineral Resources
Indicated Mineral Resources
High Range TFFE
Renard 65775m depth
Renard 4775m depth Renard 9
775m depth
Renard 21,250m depth Renard 3
1,250m depth
North East View

19Renard Diamond Project Exploration PotentialEffective September 24, 2015. Changes to Previous Potential Shown in Italics
Notes1 Target for Further Exploration: representspotential upside that can be reasonablyassumed given the nature and grade of materialwithin the current 2015 Mineral Resource. TheRenard 2 shape has been projected 250mbelow the deepest kimberlite intersection at1,000m depth. Tonnage and grade ranges arenot directly applicable to potential totalcarats.The potential quantity and grade of anyExploration Target is conceptual in nature, therehas been insufficient information to define amineral resource, and it is uncertain if furtherexploration will result in the target beingdelineated as a mineral resource.2 Carats per hundred tonnes. Potential at a +1DTC sieve size cut-off.
NotesResource categories were completed in accordance with the "CIM DefinitionStandards on Mineral Resources and Reserves". Mineral resources that are notmineral reserves do not have demonstrated economic viability.
Area indicated in yellow represents a gap in drill coverage that may representadditional exploration potential outside of the current Mineral Resource Estimateand not included in the current Targets for Further Exploration.
Renard 65775m depth
Renard 4775m depth Renard 9
775m depth
Renard 21,250m depth Renard 3
1,250m depth
Inferred Mineral Resources
Indicated Mineral Resources
High Range TFFE
North East View
R10 R7 R1 R65
R4 R9
R2R3
Targets for Further Exploration(1)
Contained Carats (millions)
Tonnes (millions) Grade (cpht)(2)
Renard 1 1.7 to 3.9 8.6 to 13.0 20 to 30
Renard 2, All Units 3.7 to 15.5 6.1 to 15.5 60 to 100
Renard 3 3.6 to 6.3 3.4 to 3.8 105 to 168
Renard 4 5.6 to 11.8 11.1 to 15.4 50 to 77
Renard 65 7.3 to 13.5 29.0 to 40.9 25 to 33
Renard 7 1.9 to 3.8 6.3 to 9.4 30 to 40
Renard 9 2.0 to 4.3 3.9 to 6.3 52 to 68
Renard 10 0.7 to 2.1 1.2 to 1.7 60 to 120
Lynx 3.0 to 3.8 3.1 to 3.2 96 to 120
Hibou 3.6 to 6.1 3.5 to 4.0 104 to 151
Total TFFE 33.0+28% to 71.1
+40%76.2
+49% to 113.2+51%

2020
Construction Report (Patrick Godin)

21
Environment, Health, Safety, and Stornoway’sTeam
“Courage to Care”
On Personal SafetyOn the Safety of our Colleagues
On the EnvironmentWith our Inter-cultural workforce
Lost Time Injury RateSWY employees: 0.0 (43,453 hours worked to end of Sept.)
Contractors: 0.7 (79,149 hours worked to end of Sept.)
Renard Total: 0.44
Québec Construction Industry: 2.2
Québec Mining Industry: 0.8

22Approach to Mine ConstructionChevrolet/Cadillac
Access Road
Airport Terminal
Accommodation Complex
Mine Dry and Office
Process Plant
Power Plant
Airport Landing Strip
Water Management and Treatment Facility
Maintenance Facility
Mining Equipment
“Chevrolet” “Cadillac”

23
Construction Sequence
2H 2H 2H 2H1H 1H 1H1H
2013 2014 2015 2016
All in parallel with open pit and underground mining activities
R2-R3
R65
Camp
ProcessPlant
Portal
1. Construct Access:
Road and Airport
3. Close Buildings of Major
Facilities (“Outside-In”)
2. Build Camp and
Mine Office/Dry
4. Equip Major Facilities
5. Commence Operations
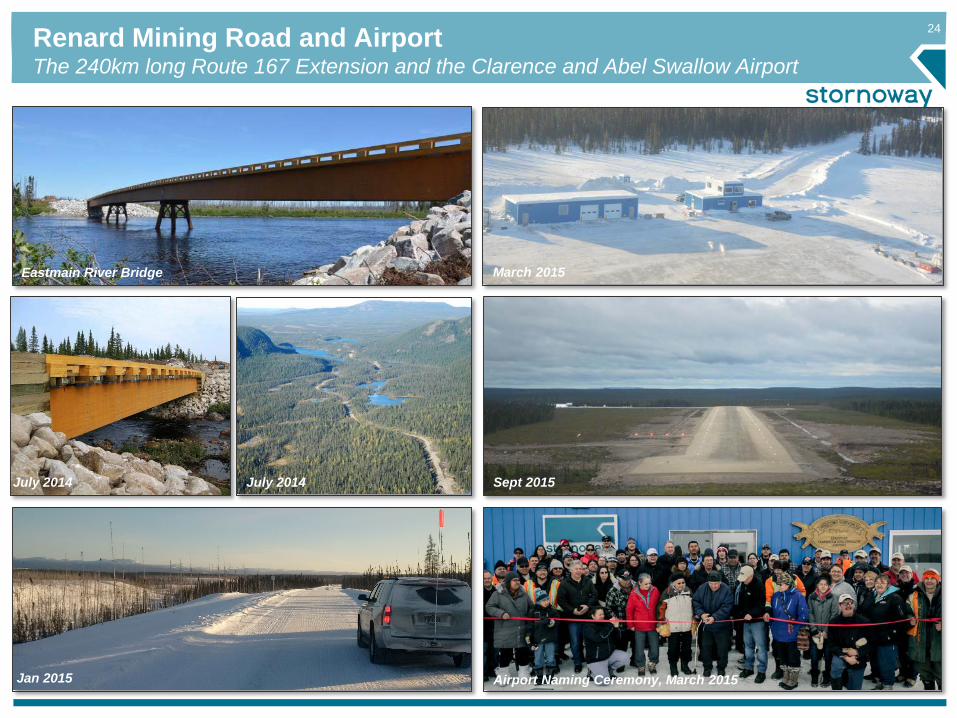
24Renard Mining Road and AirportThe 240km long Route 167 Extension and the Clarence and Abel Swallow Airport
Eastmain River Bridge March 2015
Sept 2015July 2014
Jan 2015 Airport Naming Ceremony, March 2015
July 2014

25
Camp and Mine Dry
Sept 2014 Oct 2014 Jan 2015: Occupation
Sept 2015 June 2015

26Maintenance FacilityCompleted Approximately 6 Months Ahead of Schedule
July 2015April 2015
Inauguration Ceremony, September 24, 2015 Oct 2015

27
Primary Crusher and LNG Power Plant
Sept 2015Oct 2015
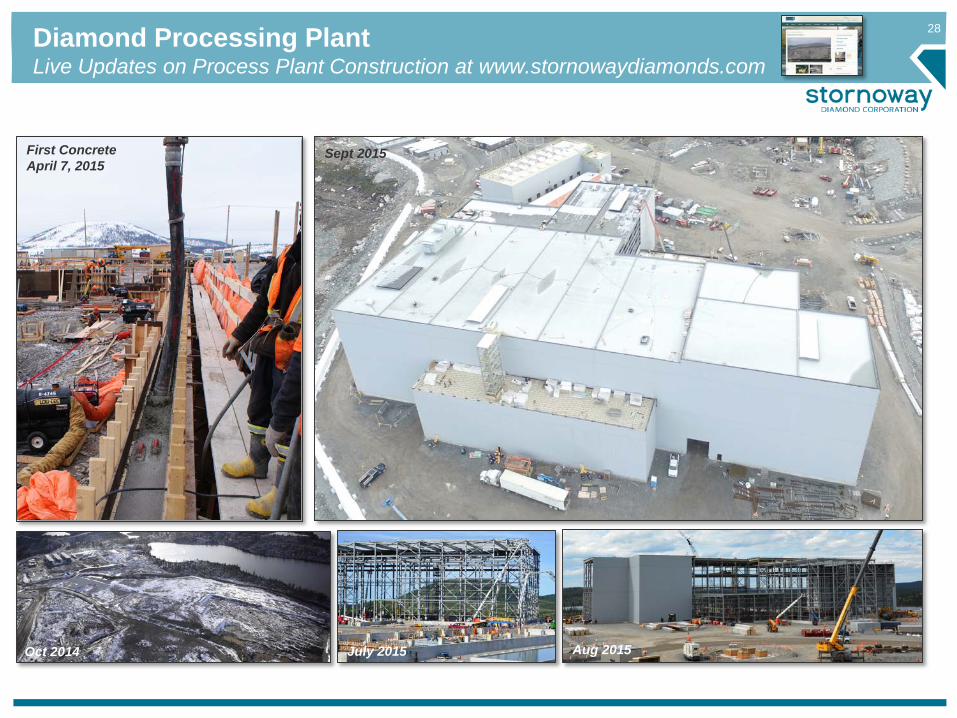
28Diamond Processing PlantLive Updates on Process Plant Construction at www.stornowaydiamonds.com
Oct 2014
Sept 2015First ConcreteApril 7, 2015
Aug 2015July 2015

29Open Pit MiningRenard 2 – Renard 3 Pit Pre-stripping Commenced March 2015
R2-R3 Pre-Strip, March 5, 2015
Open Pit Mining Team, March 5, 2015
R2-R3
R65
Portal
R2-R3 Pit, May 23, 2015
Decline Ventilation, May 10, 2015
Mining Progress as of July 31 20151,842,582 tonnes extracted from R2/R3 and vs plan of
2,042,680 (93%)
R2-R3 Pit August 2015

30
August 2015
Sept 2015
R2-R3
R65
Portal
Decline Progressas of July 31, 2015
486m against plan of 504m (96%)
Underground MiningPortal Development December 2014, Ramp Development Commenced March 2015

31
The Mecheshoo Agreement, March 2012
Renard’s Social LicenceWorking with Stakeholders
The Declaration of Partnership, July 2012
Environmental Exchange Group, 2011
The design of the project, and the December 2011 Environmental and Social Impact Assessment, was developed in conjunction with an environmental Exchange Group that met during the course of 2011 in Mistissini.
The Renard Project has been designed to minimize impact on local water quality and fish habitat, the principal concern of the Crees. The project has been “built to close”, and reclamation liabilities have been bonded 100% with the MERN
In July 2012 Stornoway concluded a “Declaration of Partnership” with the communities of Chapais and Chibougamau.
The Declaration of Partnership provides a framework to address issues of mutual interest such as communication, employment and economic diversification.
In March 2012 Stornoway concluded the “Mecheshoo Agreement” with the Cree Nation of Mistissini and the Grand Council of the Crees (EI).
The “Mecheshoo Agreement” provides for employment and business opportunities, the Crees, fosters cultural, environmental and social protection,
and provides for the Crees’ participation in the project’s long term financial success.

32
Main Contractors at Mine Site in 2014-2015
Construction Talbon Matoush-Grimard
Manseau & Perron inc MY Surveying
Sakhiikan Consortium Kesi Construction
Eskan Company RCM Habitation Modulaire
Jos Ste-Croix Swallow-Fournier inc
Kiskinshiish Camp Services Tessier Ltée
Communications Telesignal SPI Santé/Sécurité
Structures GB Ltée Prevost et Frères
H2O Innovation Nordic Structures Bois
Anixter Canada Recyclage Ungava
Plomberie Chibougamau Sanivac Réseau
Blasteck International Barette et fils
Convoyeur Continental ASDR Environnement
Installations AC Washeyaabiin Const.
Industrie Fournier Biron
Yves Lacombe Pétrole MJ
Roche Ltée Mabarex
Equ. Pétrolier Lac St-Jean Hewitt
Construction Proco Corner Cast
Air Creebec Revetement RHR
Petronor Groupe Industriel Premium
Dyno Nobel Canada Mansour Mining Techno.
Groupe Robert PAR Tanguay (WEC)
Invoiced Expenses from Québec ($245M)
CHIB-CHAP-MIST
MONTREAL
BEAUCE
ABITIBI
SAGUENAY-LAC ST-JEAN
GASP-BSL-COTE-NORD
MAURICIE-CENTRE-SUD
QUEBEC
Total of Invoiced Expenses ($290M)
Renard’s Social LicenceLocal & Regional Participation – Invoiced expenses from September 2014 to August 2015
Chib.-Chap.-Mistissini.
38%
QUEBEC
ONTARIO
OTHER PROVINCES
USA
Elsewhere (SA, TURKEY,SWITZERLAND)
Quebec86%

33Employment StatisticsAverage of 410 people/day Working at the Renard Site in September 2015
Longueuil43%
Renard34%
Vancouver9%
Toronto8% Chiboug/
Mistissini 6%
Crees58%
Non-Crees42%
Crees22%Non-Crees
78%
Longueuil20% Renard
75%
Vancouver2%
Toronto2%
Chiboug/ Mistissini 1%
Personnel at Site
Sept 2014: 193
Sept 2014: 68
Stornoway EmployeesSept 2015: 410
Sept 2015: 290

34Innovation at RenardLiquefied Natural Gas Power Plant
On October 21st, 2013 Stornoway announced it will proceed with an LNG fuelled gen-set option, made possible by the ability to receive regular cryogenic LNG shipments on the Renard Mine Road.
The Renard LNG plant will comprise seven 2.1MW rated gas gen-sets, providing sufficient power generation capacity for the project’s normal operating specification of 9.5MW.
LNG has significant advantages over traditional diesel powered gen-sets. Operating costs are estimated to be $8-$10m less annually, for an incremental capital cost of $2.6m, with 42% less greenhouse gas emissions.
LNG will be purchased from Gaz-Metro in Montreal, with deliveries of three tankers per day by road.
Diesel will continue to be used for the mobile mining fleet and construction activities.
Renard will be one of the first LNG powered mines in Canada, made
possible by road access

35
PKC
Waste Rock
Overburden
UG Mine Portal
Process Plant
Mine Waste Water TreatmentPlant
Collection Trench
Pumping Station
Innovation at RenardSurface Water Management
Sept 2014
Jan 2015
Mine Water Treatment PlantOct 2015
Camp Waste Water Treatment PlantSept 2014
Jan 2015
Camp Waste Water Treatment Plant
100% of surface precipitation and mine waste water at Renard is collected and treated before release.

36Innovation at RenardThe First Diamond Mine to Dry Stack Processed Kimberlite
Processed Kimberlite Containment (PKC)
Dry stacking of processed kimberlite minimizes impacts of project on fish habitat and local water quality
Centrifuges in process plant de-water processed kimberlite (PK)…
…producing a cake for re-handling.
PK cake is loaded-out… …trucked… …and deposited at PKC facility with progressive reclamation.

3737
Looking Forward (Matt Manson)

38
The Challenge of Finding and Developing New Diamond Mines
“Tier 1” defined as mines with Ultimate reserves greater than US$20B: Jwaneng, Orapa, Mir, Udachnya, Venetia, Catoca, Premier
Kimberlite Discoveries Since 1870
6,800
1,000
65
7
875420
20
1
10
100
1,000
10,000
KimberlitesDiscovered
Diamondiferous Economic Tier 1*
Recent Diamond Mines
Source: De Beers/SWY
Economic kimberlites represent just 1% of all discoveries made since 1870 (1.7% in Canada)
Time from Discovery to First Production
Ekati (1998, BHPB, now Dominion) 7 years
Diavik (2002, Rio Tinto/Dominion) 9 years
Victor (2008, De Beers) 20 years
Snap Lake (2008, De Beers) 11 years
Karowe (2012, Lucara) 10 years
Grib (2013, Lukoil) 18 years
Ghaghoo (2014, Gem) 23 years
Renard (2017, Stornoway) 16 years
Gahcho Kué (2017, DeBeers/MPV) 21 years
Bunder (2019, Rio Tinto) 15 Years
Projects are taking longer to develop

39Stornoway will be a Significant Diamond ProducerCurrent and Future Diamond Producers
Latest 12 Month Sales/ Forecast Future Average Sales 1 De Beers (Anglo/Botswana) $6,312m
2 Alrosa (Russia) $4,901m
3 Dominion Diamond (TSX: DDC) $872m
4 Rio Tinto (ASE: RIO) $801m
5 Petra (L: PDL) $425m
6 Stornoway (note 2; TSX: SWY) $310m7 Mountain Province (note 2; TSX: MPV) $259m
8 Gem Diamonds (TSX: GEMD) $241m
9 Lucara (TSX: LUC) $196m
10 Firestone (note 3; L: FDI) $125m
11 Others $2,558m
Total $17,000m
DeBeers37%
Alrosa29% Dominion
5%
RioTinto5%Petra2%
SWY2%
MPV1%
GEM1%LUC
1%Firestone1%
Others15%
Notes:
1. Renard estimated at FS average annual diamond production of 1.63 million carats, and WWW March 2014 weighted diamond price of US$190/ct, un-escalated
2. Gahcho Kué estimated at 49% of Revised FS average annual production of 4.45 million carats, and average modeled diamond price of US$118/ct, un-escalated
3. Firestone estimated at revised 2015 mine plan average annual production of 0.95 million carats at an average price of US$132/ct un-escalated
6 Stornoway (note 1; TSX: SWY) $310m
Source: Kimberly Process, WWW and Company Reports
40Renard’s Cash Flow PotentialBase Case Economics
Renard is Expected to Generate Substantial Cash Flow over its first 11 years of Mining
After Tax, After Stream Operating Cash Flow of between $150 and $250 million, or $0.20 to $0.30 per share
Assumptions
Mineral reserve case only
Capital and operating cost parameters as established in the January 2013 Optimization Study and October 2013 LNG FS
Base case diamond pricing from March 2014; No “special” diamonds.
2.5% annual real diamond price escalation
C$:US$ conversion rate of C$1.10
Based on terms of Financing Transaction closed on July 8th, 2014
Assumes full conversion to equity of US$81million of Convertible Debentures giving 825 million shares outstanding.

41
Stornoway will sell 100% of the Renard diamond production by tender sale in Antwerp. 10 times a year, every 5 weeks. This will create a “Stornoway Sales Week” in the diamond market.
To this end, Stornoway’s wholly owned subsidiary FCDC Sales and Marketing has entered into a sales and marketing agreement with the well known diamond industry broker and rough distributor Bonas-Couzyn, which will act as sales commissionaire and tender agent for arm's length market sales.
Sales of diamonds under the Renard Streaming Agreement will be undertaken by Bonas-Couzyn, on an undivided basis, on behalf of FCDC and the Streamers
Other than under exceptional circumstances, Stornoway will sell 100% of what it produces, will not carry a stockpile outside of normal goods-in-progress, and will be a market price taker.
Stornoway’s Diamond Sales
As a miner, Stornoway will focus on mine production and cost efficiency. Diamond sales will
be by arm's length tender sales in Antwerp, 10 times a year. Stornoway will support the Québec or
Canadian brand identification initiatives of its clients through chain of custody certification.

42Renard’s ProductQuébec Diamonds in the World Market
March 2014 Diamond Valuations (WWW International Diamond Consultants Ltd.)
KimberliteBody
Valuation Sample(carats)
WWW March 2014 Sample
Price(US$/carat)1
WWW March 2014 Base Case
Price Model(US$/carat)1
Sensitivities(Minimum to High)
Renard 2 1,580 $187 $197 $178 to $222Renard 3 2,753 $179 $157 $146 to $192Renard 4 2,674 $101 $106 ($155)2 $100 to $174Renard 65 997 $262 $187 $175 to $211
Notes
1. All prices in US$/carat. Samples utilizing a +1 DTC sieve size cut-off.
2. Should the Renard 4 diamond population prove to have a diamond population with a size distribution equal to the average of Renard 2 and 3, WWW have estimated that a base case diamond price model of $155 per carat based on March 2014 pricing. Source: WWW March 2014 Valuation Update
Base Case Diamond Valuation Estimates Using on Best Practice Methodology
Average weighted diamond price estimate in March 2014 for the Mineral Reserves of US$190/ct (un-escalated).
High Quality Production
The Renard kimberlites have similar, but marginally different diamond populations exhibiting a high incidence of large white gems and only 1% boart by weight.
XRT technology in Plant for Large Diamond Recovery
Coarse Size Distribution in Renard 2 predicts 3 to 6 50-100ct stones and 1 to 2 +100ct stones every 100,000 carats (2-3 weeks).
Plant flow sheet:• Primary jaw crushing to < 230mm• Twin DMS circuits at +1mm -19mm• LDR circuit at +19mm -45mm, scalable to -60mm• Oversize +45mm to secondary cone crusher• LDR and DMS tails +6mm -19mm to tertiary High
Pressure Grinding Rolls

43
Renard: Québec’s Next Major Mine
Fourteen years in the making
Diamonds
Demand underpinned by gifting traditions that are universal, aspirational and cross-cultural…
…but mined: supply is limited and finite
Stornoway
Focus on budget, schedule, operating excellence, cash flow
Stornoway Diamond Corporation (TSX: SWY)Our Priorities
www.stornowaydiamonds.com

4444
Thank You