building solutions for the click to edit master text ... sa.pdf · click to edit master text ......
TRANSCRIPT

Click to edit Master text
styles
Building Solutions for the Energy Industry
Hallvard Hasselknippe – President Subsea
Jefferies Energy Conference – Houston, November 30, 2016

Safe Harbor
his presentation contains both historical and forward-looking statements. These forward-looking statements are not based onhistorical facts, but rather reflect our current expectations concerning future results and events and generally may be identified by theuse of forward-looking words such as “believe”, “aim”, “expect”, “anticipate”, “intend”, “foresee”, “likely”, “should”, “planned”, “may”,“estimates”, “potential” or other similar words. Similarly, statements that describe our objectives, plans or goals are or may beforward-looking statements. These forward-looking statements involve known and unknown risks, uncertainties and other factors thatmay cause our actual results, performance or achievements to differ materially from the anticipated results, performance orachievements expressed or implied by these forward-looking statements. Risks that could cause actual results to differ materially fromthe results anticipated in the forward-looking statements include, among other things: our ability to successfully continue to originateand execute large services contracts, and construction and project risks generally; the level of production-related capital expenditurein the oil and gas industry as well as other industries; currency fluctuations; interest rate fluctuations; raw material, especially steel aswell as maritime freight price fluctuations; the timing of development of energy resources; armed conflict or political instability in theArabian-Persian Gulf, Africa or other regions; the strength of competition; control of costs and expenses; the reduced availability ofgovernment-sponsored export financing; losses in one or more of our large contracts; U.S. legislation relating to investments in Iran orelsewhere where we seek to do business; changes in tax legislation, rules, regulation or enforcement; intensified price pressure by ourcompetitors; severe weather conditions; our ability to successfully keep pace with technology changes; our ability to attract and retainqualified personnel; the evolution, interpretation and uniform application and enforcement of International Financial ReportingStandards, IFRS, according to which we prepare our financial statements as of January 1, 2005; political and social stability indeveloping countries; competition; supply chain bottlenecks; the ability of our subcontractors to attract skilled labor; the fact that ouroperations may cause the discharge of hazardous substances, leading to significant environmental remediation costs; our ability tomanage and mitigate logistical challenges due to underdeveloped infrastructure in some countries where we are performing projects.
Some of these risk factors are set forth and discussed in more detail in our Annual Report. Should one of these known or unknownrisks materialize, or should our underlying assumptions prove incorrect, our future results could be adversely affected, causing theseresults to differ materially from those expressed in our forward-looking statements. These factors are not necessarily all of theimportant factors that could cause our actual results to differ materially from those expressed in any of our forward-looking statements.Other unknown or unpredictable factors also could have material adverse effects on our future results. The forward-looking statementsincluded in this release are made only as of the date of this release. We cannot assure you that projected results or events will beachieved. We do not intend, and do not assume any obligation to update any industry information or forward looking information setforth in this release to reflect subsequent events or circumstances.
****
This presentation does not constitute an offer or invitation to purchase any securities of Technip in the United States or any otherjurisdiction. Securities may not be offered or sold in the United States absent registration or an exemption from registration. Theinformation contained in this presentation may not be relied upon in deciding whether or not to acquire Technip securities.
This presentation is being furnished to you solely for your information, and it may not be reproduced, redistributed or published,directly or indirectly, in whole or in part, to any other person. Non-compliance with these restrictions may result in the violation of legalrestrictions of the United States or of other jurisdictions.
****
T
3Q 2016 Results2

Technip 3Q 2016 Operational and Financial Highlights

3Q 2016 Results4
3Q 2016 Highlights
EFFICIENCY
BALANCE
SHEET
BROAD-BASED
OFFER
CLIENT
INSIGHT
Highly valued project management expertise and long-
lasting customer relationships supported group
profitability at c.10%
Continued cost reductions to achieve €1 billion by 2017
of which €900 million in 2016
€1.5 billion order intake showcasing selective approach,
diversified portfolio and high-end capabilities
Solid balance sheet with net cash at €1.8 billion
Most regulatory milestones completed
Shareholder meetings to be held on December 5thMERGER

Client: Hurricane
Alliance selected as
exclusive provider of subsea
solutions for the Lancaster
EPS(1) and for subsequent
development of the Greater
Lancaster Area
Client: DEA Norge
Important subsea EPCI(3) for
the subsea development of
the Dvalin (previously named
Zidane) field
15km long Pipe-in-Pipe
tieback
Client: ENOC
Large EPC(2) for the design
and construction of new
processing units and
ancillary units
50% capacity expansion of
refinery delivered by Technip
in 1999
3Q 2016 Results5
Sound Quarterly Order Intake Showcases Technip’s Proven Strategy
LancasterFirst Alliance award
DvalinUnique long tie-back solutions
Jebel Ali Refinery expansionLong-lasting client relationship
Unique leadership:
Integrated SPS+SURF
solutions
Cost-effective
technologies:
Project enabler
Seamless execution:
Long-term partner of
choice
(1) Early Production System(2)Engineering, Procurement and Construction(3)Engineering, Procurement, Construction and Installation
ALLIANCE

3Q 2016 Results
Backlog and Contracted Work Provides Visibility for 2017 and Beyond
Subsea€5.1 billion
€1.0 billion €2.6 billion €1.5 billion
2018 & beyond2017
Onshore & Offshore€7.2 billion
2016 (3 months) 2018 & beyond2017
3Q 2016 Order Intake: €486 million
3Q 2016 Order Intake: €1,028 million
Non-backlog elements
€2.1 billion
2016 (3 months)
6
€1.3 billion €3.6 billion €2.2 billion
Note: for detailed scheduling please refer to page 4 of 3Q16 Press Release

3Q 2016 Results7
Market Outlook
DOWNSTREAMRESILIENCE
LIBRA &
OTHER PRE-SALTDEVELOPMENTS
TIEBACKOPPORTUNITIES
GAS & DOWNSTREAMFOCUS
LNG DEVELOPMENTS
CONTINUING
LNG DEVELOPMENT
TIEBACKOPPORTUNITIES DOWNSTREAM
RESILIENCE
REFINING AND PETCHEMGREENFIELD & BROWNFIELD
OPPORTUNITIES
SHALLOW WATERGREENFIELD
OPPORTUNITIES
Broad portfolio of solutions to seize
Upstream and Downstream opportunities

3Q 2016 Results8
€1 Billion Cost Reduction Plan On-Track
SG&A(1) accelerated decrease with (17)%
compared to 3Q15
Fleet streamlining and improved efficiency
Olympic Challenger returned to owner in 3Q16
€195 million OPEX savings expected in 2016
compared to 2014
Footprint rationalization
Closing of regional offices (Mexico, Milton Keynes,
Dusseldorf, etc.)
Company resizing
Expanded refocus on main operating centers
Headcount close to 31,000 in September 2016
(1) Selling, General and Administrative Expenses
R&D spending maintained
SG&A(1)
reduction
Company resizing
Fleet streamlining
Footprint rationalization

Integrated Solutions: A Proven Model
Design, EPCI(1) and commissioning of
flexibles and umbilical
SUBSEA ONSHORE / OFFSHORE
Jangkrik, ENI, Indonesia
EPC(2) of onshore gas treatment plant
Design and installation of flexibles
SUBSEA ONSHORE / OFFSHORE
Juniper, BP, Trinidad & Tobago
EPC(2) of topside and jacket
Transportation, installation and pre-
commissioning of pipelines
SUBSEA ONSHORE / OFFSHORE
Malikai, Shell, Malaysia
EPC(2) of Tension Leg Platform
(1) Engineering, Procurement, Construction and Installation
(2) Engineering, Procurement and Construction
(3) Pipeline End Termination
(4) Engineering, Procurement, and Construction management
Design and EPCI(1) of flexible and flowlines
SUBSEA ONSHORE / OFFSHORE
Prelude FLNG, Shell, Australia
Design and EPC(2) of Floating Liquefied
Natural Gas facility
TECHNOLOGY, EQUIPMENT &
CONSULTING
Fabrication of flexibles and umbilical
TECHNOLOGY, EQUIPMENT &
CONSULTING
FEED and detailed engineering work
involving Genesis
Fabrication of flexibles flowlines
TECHNOLOGY, EQUIPMENT &
CONSULTING
Fabrication of pipelines
TECHNOLOGY, EQUIPMENT &
CONSULTING
FEED
Fabrication of rigid flowline, PLETs(3),
flowline appurtenances and rigid spools
Bahr Essalam, Mellitah, Central Mediterranean Sea
3Q 2016 Results9
Design, detailed engineering and EPCI(1)
SUBSEA ONSHORE / OFFSHORE
Revamping of existing infrastructure and
project management
TECHNOLOGY, EQUIPMENT &
CONSULTING
Fabrication umbilicals

3Q 2016 Results
2016 Objectives: Guidance Upgrade
Onshore / Offshore - Unchanged
Subsea - Upgraded
Adjusted revenue above €5.0 billion (previously between €4.7
and €5.0 billion)
Adjusted operating income from recurring activities(1) around
€700 million (previously around €680 million)
Adjusted revenue between €5.7 and €6.0 billion
Adjusted operating income from recurring activities(1) around
€280 million
(1) Adjusted Operating Income from Recurring Activities after Income/(Loss) of Equity Affiliates
10

TechnipFMC Merger at a Glance

12
SURF: Subsea umbilicals,
risers and flowlines
SPS: Subsea production systems
(incl. processing)
FEED and
sub-surface expertise
Life of field and monitoring
SUBSEA
ONSHORE/OFFSHORE
Jetty Loading Arms
Surface Production & Drilling
Systems
SURFACE
Deepwater
LNG
Petrochemicals
Refining & Hydrogen
FLNG
Mining & Metals
Shallow Water
TechnipFMC: Broadest Portfolio of Solutions for the
Production and Transformation of Oil and Gas

13
60
70
80
90
100
110
2016 2025
…With a Large Portion to Come from Deepwater
0.0
2.0
4.0
6.0
8.0
10.0
12.0
2015 Decline Incremental 2025
~36 Million Barrels / Day of Incremental Production
Required by 2025e…
Source: Rystad Energy Supply Study; October 2016
~8.5
MMb/d MMb/d
Source: Rystad Energy Supply Study, FMC Technologies; October 2016
Current Sources of Production
Conventional & Other
Deepwater
Shale
Offshore Remains Critical to the Future…

14
…and It Accounts for Majority of Majors’ Production
Offshore Contributes Significantly to Majors’ Production……While More Than 50% of the Majors’ 2P Reserves
Remaining Is Offshore
2016 Production by Classification (%) (1) Remaining 2P Reserves by Classification (%) (1)
1 Production and proved reserves as of 2Q 2016
Weighted
Average
Offshore Onshore
Source Wood Mackinzie
58% 53%
48%
59%
46%
68%
90% 84%
60%
42% 47%
52%
41%
54%
32%
10% 16%
40%
0%
20%
40%
60%
80%
100%
54%
40% 42% 45%
35%
82%
96%
85%
55%
46%
60% 58% 55%
65%
18%
4%
15%
45%
0%
20%
40%
60%
80%
100%
Weighted
Average
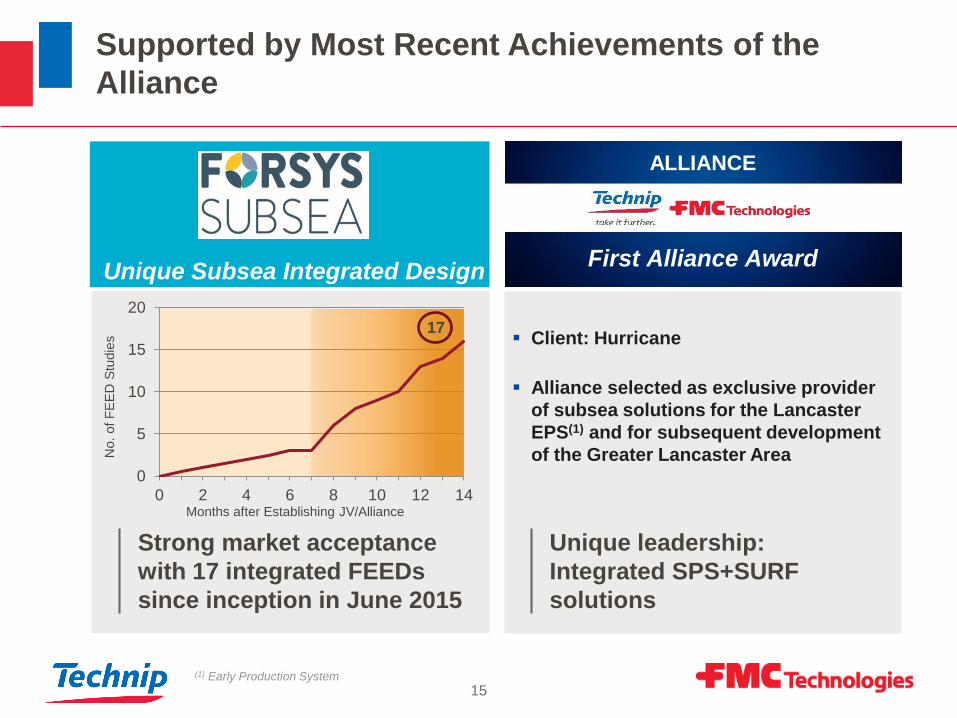
15
Client: Hurricane
Alliance selected as exclusive provider
of subsea solutions for the Lancaster
EPS(1) and for subsequent development
of the Greater Lancaster Area
(1) Early Production System
ALLIANCE
Supported by Most Recent Achievements of the
Alliance
Unique leadership:
Integrated SPS+SURF
solutions
First Alliance AwardUnique Subsea Integrated Design
Strong market acceptance
with 17 integrated FEEDs
since inception in June 2015
0
5
10
15
20
0 2 4 6 8 10 12 14
No.
of F
EE
D S
tudie
s
Months after Establishing JV/Alliance
17

16
Maximised
reliability and
uptime
Increased
aftermarket
capabilities
Improved
performance
over the life of
field
Rationalized
subsea
architecture and design
Optimized
technologyapplications
Improved field
performance
Project ExecutionConceptual Design
& FEED
Life-of-Field
& Maintenance
Joint SPS+SURF
R&D for improved
technology application
and combination
Shortened time to first
oil and offshore
installation through
better planning
Reduced project
interfaces and
contingencies
Strengthen leverage on
procurement
Accelerate time
to first oil
Superior project
execution
Maximize
production uptime
Leading market
players(1)
Leading market players SPS and SURF
Largest
installed base
Unique asset and
technological capabilities
Best possible line-
up to undertake
client
challenges
Leading
capabilities
TechnipFMC is the Sole Player Offering Full Suite of
Capabilities
Engineering Procurement Construction InstallationEquipment
supply
Decommissioning
(1) Genesis Oil & Gas Consultants and Forsys Subsea joint venture

17
Reduce product complexity with proprietary technology
Create differentiated products that focus on deliverability and installability
Case Study: Traditional versus Compact Subsea Manifold
Simplicity – 50% fewer parts
Deliverability – 50% schedule reduction
Installability – 50% less weight
Compact
Subsea Manifold
Reinvent Products

18
Integrate Complementary Technologies
Manifold Connector
Flexible pipe
Subsea processing
ETH PiP(1)
Optimized
connectivity
Increased
efficiency
Simplified
architecture
Direct Tie-In
(1) ETH PiP: Electrically Trace Heated Pipe-in-Pipe

19
TechnipFMC: Driving Change by Redefining the
Production and Transformation of Oil & Gas
Builds a comprehensive and flexible offering across each market
from concept to project delivery and beyond
Surface
Global product and service platform
Enhanced offering in North America
Strengthened international presence
Products: best-in-class equipment and systems provider
Leading and highly complementary equipment offering; scaling up
best-in-class technology through enhanced R&D
Projects: unique capabilities throughout project life-cycle
From concept to project delivery and beyond; setting new project
economic standards
Subsea
Services: enhanced service proposition
Leveraging FMC Technologies’ leading solutions to service a larger
installed base; expanding scope of service offering
Onshore /
Offshore
Strong midstream/downstream footprint
Leveraging further on Technip’s engineering capabilities
From concept to technology to project delivery
60 years of complex developments & client relationships

www.technip.com
Thank you
20