building surface mounted wireless sensor network...
TRANSCRIPT

Building Surface Mounted Wireless Sensor Networkfor Air Conditioner Energy Auditing
Peng Liu∗, Song Zhang, Jian Qiu∗, and Guojun DaiInstitute of Computer Application Technology
Hangzhou Dianzi UniversityHangzhou China 310018
∗{perryliu,qiujian}@hdu.edu.cn
Abstract—Air conditioners possess a large proportion of theenergy consumption in a building for both heating and coolingfunctions. The purpose of this paper is to present the work inprogress which uses simple and cheap sensor nodes mountingon the external unit of air conditioners to automatically sensethe usage pattern. This work is part of the project called CyberIVY, which provides means of building surveillance using SurfaceMounted and Energy-harvesting Wireless Sensor Networks. Bythis implementation, the precise working status of air condition-ers can be monitored. The paper describes the hardware design,node deployment, and networking issues of this wireless sensornetwork. The performance of practical experiments shows thatour system is applicable and robustness for the purpose of energywaste monitoring. Usage pattern, unusual behavior and otherissues can be detected.
I. INTRODUCTION
Many researches [1][2][3][4][5] have mentioned that themajor electricity consumption occurs in residential and com-mercial buildings is the air conditioners, while heating andcooling are both major contributors of the electricity bill. Asolution is to control (turn on/off) those electrical and elec-tronic equipment intelligently according to the environmentalconditions and human requirements. However, the energyconsumption situation has to be extensively studied beforeimplementing such a remote control system.
From the literatures, the best fine-grained way to obtainenergy usage statistics is to measure electricity consumptionusing meters and aggregate data after a time period. However,if the real-time result is required, all the meters have to beconnected with wired or wireless transceivers. Such WirelessAC plug-load meter is proposed in Ref [4]. They create modelsof the behavior of each type of appliance by using measureddata of similar devices. Our research group has also developedsuch a system to measure electricity consumption of singleappliance by means of smart socket. There are some otherways been proposed to reveal the nature of electricity loadand the usage of AC. A.G. Ruzzelli et al use a single wirelessenergy monitoring sensor which is easy to implement.
Clipped to the main electrical unit to carried out Real-Time Recognition and Profiling of Appliances which is calledRECAP[2] (Recognition of electrical Appliances and Profil-ing). The energy monitoring unit transmits energy informationdata to a local machine for process and storage via wirelessnetwork. Some work focusses on user behavior profiling such
as ref [3] and ref [1] by motion, temperature or light sensors.Other methods tend to using simple sensor technology to fulfillthe requirement of complex functions, which avoids complexIC or circuit design. Ref [6] adopts vibration sensors for fanmonitoring instead of using Hall Elements or other meansbecause the fan speed of an AC is stable and vibration isregular as well. To compute and predicate aerial pollutantemissions the authors only need know the operation durationof fans.
Regarding the application of air conditioner monitoring,although socket-level meters can provide the full coverageof electrical power usage, by which we can compute airconditioner energy consumption accurately, they are difficultto be installed and get valid connection with each other. Wiredconnection method is not feasible because it will significantlyaffect the layout and appearance of the building. Furthermore,when new item is added to this network, it is difficult todeploy. Using wireless connection also has some problems asthe indoor wireless connectivity is a miserable task for lowpower transceivers. Relay may solve the problem but it isdifficult to infrastructure from the beginning. The socket isalso very expensive and generates large amount of data.
In most applications, the pattern of usage and energy con-sumption only needs rough monitoring. For example, exam-ining the usage and consumption of individual air conditionerwith simple scheme will be enough for generating manageradequate detail in mind to save the energy budget.
Therefore, in this paper we also propose such a simplesolution by building surface mounted sensor network, BSM-SN, mounted on the external unit of the air conditioners. Bymeasuring the electrical fan Rotational Speed, the system isable to automatically sense air conditioners’ usage pattern andpredicate energy consumption. We also evaluate the network-ing issue for the BSMSN and other interesting phenomena.
This work is part of the project Building Surface MountedSmart Sense, BUMSS, also known as Cyber IVY which pro-vides means of building surveillance using Surface Mountedand Energy-harvesting Wireless Sensor Networks.
The remainder of this paper is organized as follows. InSection II, the related work is introduced. In Section III, thesystem design is described in detail. Then, the networkingissues are discussed including coverage and connectivity insection IV. Then, in Section V, experimental evaluations are
The First International Workshop on Cyber-Physical Networking Systems
978-1-4244-9920-5/11/$26.00 ©2011 IEEE 749

carried out, an application scenario is introduced and examinedas well. Finally, a conclusion is provided in Section VI.
II. RELATED WORKS
Experiences tell people that more detailed informationand precise control requires significantly increasing of thedifficulty and complexity. In fact, some of these accurateinformation will never be used as it is out of the requirement.Nowadays, many researches have returned to match the specialrequirements by simple technologies for cost control, which iseasy to implement and the cost can be significantly reduced.
Gabe Cohn et al proposed single-point sensing solutionfor automatically identifying gas usage (e.g., water heater,furnace, fireplace) down to its source called GasSense [7].GasSense analyzes the acoustic response of a governmentmandated gas regulator, which provides the unique capabilityof sensing both the individual appliance at which gas iscurrently being consumed and an estimation of the amount ofgas flow. GasSense is the first project using acoustic sensingfor appliance-level identification and gas flow estimation. Theauthors announced that GasSense has an average accuracyof 95.2% in identifying individual appliance usage. Similarwork can be found in the system called Hydrosense [8] andanother system called Electrisense [9]. In the former case,researches from University of Washington implies a singlesensor installed in house water infrastructure, e.g., an exteriorhose bib, utility sink spigot, or water heater drain valve soas to support both identification of activity at individual waterfixtures within a house as well as estimate the amount of waterbeing used at each fixture. In the latter case, Gupta S. et al tellus how to obtain a new solution for automatically detectingand classifying the use of electronic devices in a house froma single point of sensing. Experiments show that ElectriSensecan identify and classify the usage of individual devices with amean accuracy as much as 93.82%. Ref. [4][6][10][11][12] usesimilar methods to monitor electricity usage and fan operation.
Besides observing physical parameters, many other re-searches concern how to reveal human activity indoor toautomatically control electrical equipment. Finally, by switch-ing off the unnecessary electrical equipment, the total energyconsumption can be significantly reduced. These researchesalso pay close attention to simple sensor technology whichprefer using motion, temperature or pressure sensors. In [1],J. Lu brought forward smart thermostat that uses occupancysensors to save energy by automatically turning off the H-VAC when occupants are sleeping or away. Patel S.N. alsoproposed a method to detect human movement by differen-tial air pressure sensors in HVAC system [13]. Researchersfrom Italy presented an integrated system for profiling andreducing house energy consumption [3]. The work focused, inparticular, on the key role played by wireless sensor networksto automatically control home appliances according to users’habits.
All these work employ simple sensor technology whichdemands less cost, less sensing requests and easy installation.However, most expecting result will be generated from simple
observation which differ greatly in different setting, locationand so on, thus it is difficult to popularize as it has to designspecified systems. Furthermore, the accuracy and robustnessof these methods are still doubtable which is another barrierdifficult to break through. In this paper, we present a work inprogress which uses simple and cheap sensor nodes to mounton the external unit and automatically sense air conditionersusage pattern. Differed from existing work, only a few param-eter need to be adjust before shifting to another location.
III. SYSTEM DESIGN
(a) Original Image (b) Connected together
Fig. 1. A building with external units installed in the wall
Most buildings in China, especially in the south part, areequipped with air conditioners due to hot weather in summer.For some buildings, external units of air conditioners existon the wall outside every single room as shown in Fig. 1(a).These external units are very likely to be regularly distributedwith equal distance between neighbors so that if wirelesssensor nodes can be mounted on them, it will naturally forma network as seen in Fig.1(b). This is also the original idea ofCyber IVY project, which will provide more sensing servicesand organize larger sensor networks. In the current state, therecent network is called BSMSN for short, which representsBuilding Surface Mounted Sensor Networks.
A. Motivation of using BSMSN
In this paper, as a basic step of Cyber IVY system, theBSMSN is mainly used for two purposes. First of all, to testand evaluate the existing network performances. The reasonfor using wireless sensor nodes to form a network outsiderooms is that in the field we can get a very good transitionrange using IEEE802.15.4 which is around 100-200 meters.Hence, different wings of a building, even adjacent buildingscan be connected together so that adding and removing nodesbecomes an easy job which bring flexibility to the system.Also, multi-hop factors and constant data generation speed willbring significant challenges when using BSMSN networks. Insection IV, we will analyze topology of the network as wellas dataflow and the packet loss.
B. simple rotational speed sensor
Another main reason for us to use BSMSN is to achieveenergy saving on air conditioner by using simple equipment.The architecture of this auditing system is shown as in Fig.2. The main body of the sensor node is based on a telosB
750
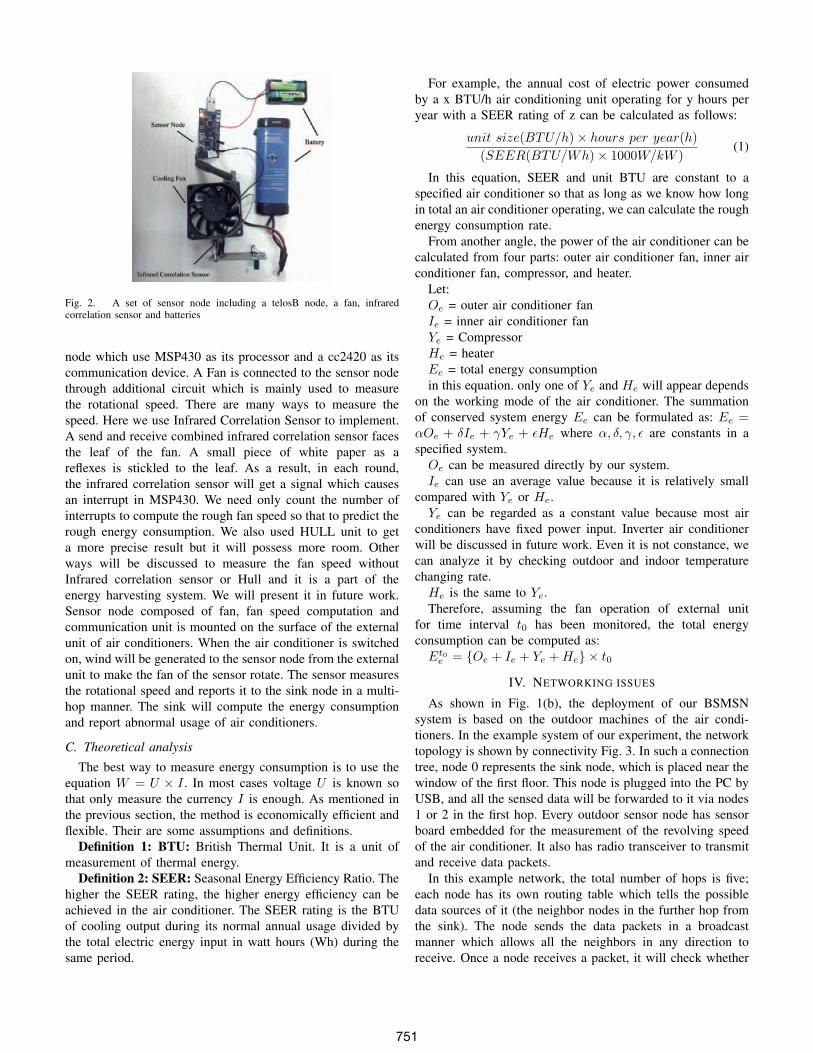
Fig. 2. A set of sensor node including a telosB node, a fan, infraredcorrelation sensor and batteries
node which use MSP430 as its processor and a cc2420 as itscommunication device. A Fan is connected to the sensor nodethrough additional circuit which is mainly used to measurethe rotational speed. There are many ways to measure thespeed. Here we use Infrared Correlation Sensor to implement.A send and receive combined infrared correlation sensor facesthe leaf of the fan. A small piece of white paper as areflexes is stickled to the leaf. As a result, in each round,the infrared correlation sensor will get a signal which causesan interrupt in MSP430. We need only count the number ofinterrupts to compute the rough fan speed so that to predict therough energy consumption. We also used HULL unit to geta more precise result but it will possess more room. Otherways will be discussed to measure the fan speed withoutInfrared correlation sensor or Hull and it is a part of theenergy harvesting system. We will present it in future work.Sensor node composed of fan, fan speed computation andcommunication unit is mounted on the surface of the externalunit of air conditioners. When the air conditioner is switchedon, wind will be generated to the sensor node from the externalunit to make the fan of the sensor rotate. The sensor measuresthe rotational speed and reports it to the sink node in a multi-hop manner. The sink will compute the energy consumptionand report abnormal usage of air conditioners.
C. Theoretical analysis
The best way to measure energy consumption is to use theequation 𝑊 = 𝑈 × 𝐼 . In most cases voltage 𝑈 is known sothat only measure the currency 𝐼 is enough. As mentioned inthe previous section, the method is economically efficient andflexible. Their are some assumptions and definitions.
Definition 1: BTU: British Thermal Unit. It is a unit ofmeasurement of thermal energy.
Definition 2: SEER: Seasonal Energy Efficiency Ratio. Thehigher the SEER rating, the higher energy efficiency can beachieved in the air conditioner. The SEER rating is the BTUof cooling output during its normal annual usage divided bythe total electric energy input in watt hours (Wh) during thesame period.
For example, the annual cost of electric power consumedby a x BTU/h air conditioning unit operating for y hours peryear with a SEER rating of z can be calculated as follows:
𝑢𝑛𝑖𝑡 𝑠𝑖𝑧𝑒(𝐵𝑇 𝑈/ℎ)× ℎ𝑜𝑢𝑟𝑠 𝑝𝑒𝑟 𝑦𝑒𝑎𝑟(ℎ)
(𝑆𝐸𝐸𝑅(𝐵𝑇 𝑈/𝑊 ℎ)× 1000𝑊/𝑘𝑊 )(1)
In this equation, SEER and unit BTU are constant to aspecified air conditioner so that as long as we know how longin total an air conditioner operating, we can calculate the roughenergy consumption rate.
From another angle, the power of the air conditioner can becalculated from four parts: outer air conditioner fan, inner airconditioner fan, compressor, and heater.
Let:𝑂𝑒 = outer air conditioner fan𝐼𝑒 = inner air conditioner fan𝑌𝑒 = Compressor𝐻𝑒 = heater𝐸𝑒 = total energy consumptionin this equation. only one of 𝑌𝑒 and 𝐻𝑒 will appear depends
on the working mode of the air conditioner. The summationof conserved system energy 𝐸𝑒 can be formulated as: 𝐸𝑒 =𝛼𝑂𝑒 + 𝛿𝐼𝑒 + 𝛾𝑌𝑒 + 𝜖𝐻𝑒 where 𝛼, 𝛿, 𝛾, 𝜖 are constants in aspecified system.
𝑂𝑒 can be measured directly by our system.𝐼𝑒 can use an average value because it is relatively small
compared with 𝑌𝑒 or 𝐻𝑒.𝑌𝑒 can be regarded as a constant value because most air
conditioners have fixed power input. Inverter air conditionerwill be discussed in future work. Even it is not constance, wecan analyze it by checking outdoor and indoor temperaturechanging rate.
𝐻𝑒 is the same to 𝑌𝑒.Therefore, assuming the fan operation of external unit
for time interval 𝑡0 has been monitored, the total energyconsumption can be computed as:
𝐸𝑡0𝑒 = {𝑂𝑒 + 𝐼𝑒 + 𝑌𝑒 + 𝐻𝑒} × 𝑡0
IV. NETWORKING ISSUES
As shown in Fig. 1(b), the deployment of our BSMSNsystem is based on the outdoor machines of the air condi-tioners. In the example system of our experiment, the networktopology is shown by connectivity Fig. 3. In such a connectiontree, node 0 represents the sink node, which is placed near thewindow of the first floor. This node is plugged into the PC byUSB, and all the sensed data will be forwarded to it via nodes1 or 2 in the first hop. Every outdoor sensor node has sensorboard embedded for the measurement of the revolving speedof the air conditioner. It also has radio transceiver to transmitand receive data packets.
In this example network, the total number of hops is five;each node has its own routing table which tells the possibledata sources of it (the neighbor nodes in the further hop fromthe sink). The node sends the data packets in a broadcastmanner which allows all the neighbors in any direction toreceive. Once a node receives a packet, it will check whether
751

Fig. 3. A snapshot of the network topology
it comes from the possible source nodes. If the sender of thepacket belongs to the source node set, it will store the packetand deliver it after a random back-off between 0 to 1 second.The data packet will be forwarded to the sink node hop by hopwith a very fast speed as all the packets are sent immediatelyonce it is generated or completely received. As there are fivehops in total, the entire packet delay is less then 5 seconds,with a main value of 2 seconds.
2000
2200
2400
2600
2800
3000
3200
0 1 2 5 11 14 10 18 22 23 20 21
Fig. 4. Package lost rate
This scheme is very simple to be implemented and alsoenables fast data forwarding which guarantees the receiveddata information still valid. However, it suffers from severaldrawbacks, especially the traditional WSNs’ problem, energywaste, and also the packet drop problem. For the formercase, every node keeps active all the time that results inhighest energy consumption of the sensor node. However, asthis is a trail system and faces building monitoring, neitherthe network is inaccessible nor the battery is unrechargeable.Therefore, node energy waste is not a big issue in our demon-stration system. In the future work, solar powered or windpowered energy supply will be implemented in this systemto improve energy efficiency. For the latter case, as there isonly a simple back-off scheme which cannot prevent packetcollisions, packet loss is unavoidable. However, compared withthe measurement frequency, which is in the order of seconds,the duration of packet transmission is relatively short in theorder of milliseconds. The probability of packet transmissionis relatively low. In our experiment result data, the percentagesof packet reception of all the nodes are shown below in Fig. 4.
The x axis represents the identity of the nodes, while the y axisrepresents the number of packets received from each node. Itshows that the node with a larger hop count suffers higher riskof packet drop. It is natural as there are more packet deliveriestaking place in the route, and this packet loss ratio does notaffect the experiment results.
V. EXPERIMENTAL EVALUATION AND SCENARIO
OVERVIEW
Fig. 5. A sensor node near a working external unit
To demonstrate the system and evaluate the performanceof air conditioner monitoring, experiments have been carriedout by doing real measurement. In our demonstration, theparameters measured are the room temperature, the outdoortemperature, and the rotating speed of the air conditioner out-door machine, which indicates whether the air conditioners areworking. These parameters are measured every ten seconds,which allows the sensed data to be forwarded to the sink nodebefore the next measurement takes place. The instant data aresent to the sink node (a node with USB plugged in the PC)via multi-hop network as described above. The received datais stored in the PC, and the missed data can be tracked andreproduced by the algorithm discussed.
Three different experiments are represented as follows withthe result figures and the corresponding analysis. In the firstexperiment, one of the air conditioner with setting tempera-ture 20∘C is switched on. After 15 minutes, the second airconditioner is turn on with 22∘C set. The measurement lasts40 minutes.
Fig. 6 represents the relationship between room temperatureand the air conditioners serving in the room. At the beginning,only air conditioner 1 is working, which helps to increase thetemperature from 18 to 20∘C . When 20∘C is matched, theair conditioner starts to take short breaks but still maintainrelatively stable room temperature. Once the second air con-ditioner is switched on, the room temperature keeps increasinguntil 22 ∘C. However, air conditioner 1 no longer works as theroom temperature exceeds its setting. Thus this experiment 1proves that our sensor network has been successfully deployedand works in a good condition. Although some data may bemissed due to network congestion or link loss, the reproduceddata can still help to accurately reflect the real performance.
752

Fig. 6. Relationship between room temperature and the air conditionersserving in the room
In the second experiment, there are two different applicationscenarios compared. In scenario 1, the doors and windowsare firmly closed, which can help accurately examine thetime period between the air conditioner powered on untilthe temperature setting is met. In scenario 2, the aim is tomeasure this time duration with windows or doors open. Asa common sense, if this happens, the energy consumption ofair conditioner is predicted to be increased. The results of thisexperiment in Fig. 7 show that the room temperature can beincreased by 15∘C within only approximately half an hourin scenario 1. However, as the doors and the windows arewidely open in scenario 2, the room temperature can neverbe increased to the setting value. Thus it results that theair conditioners keep working with full power all the time.From this figure, it can also be obtained that if the settingtemperature is reached, the air conditioner can switch theoutdoor machine off to save power until the temperature dropswith 1 or even 2 degrees. These application scenarios provethat by using sensor network, unusual events such as windowsor doors unclosed can be detected and reported, which helpsto achieve remote monitoring and control the room heatingservice and achieve energy saving.
For further test of the system, such as the capability oflong time unattended monitoring, Fig. 8 records the on/offworking status of the air conditioner for an entire workingday from 6am to 21pm. The room and outdoor environmenttemperatures and the on/off state of the air conditioner areboth shown in the same figure. It is obvious that the airconditioner working continuously for half an hour to one hourand then stop for a while if the setting room temperaturehas been reached. The duration of an ’off’ state depends onhow fast the room temperature drops and whether the airconditioner is manually switched off. It shows that in suchcase of big difference between room and outdoor temperature(20∘C), the room heat is lost very rapidly. The air conditionerhas to keep an approximately 90% duty cycle to maintainthe room temperature. Between 400 minutes to 500 minutes,
Fig. 7. Experimental result of two different scenarios
and also between 800 to 900 minutes, there are two long’temperature drop period’ occur. The reason for this is eitherthe door/window is open (the former case) when the outdoormachine of the air conditioner still works, or the power of theair conditioner is turned off (the latter case).
Fig. 8. the on/off working status of the air conditioner for an entire workingday from 6am to 21pm
Through the above three experiments, it can be clarified thatthe air conditioner monitoring can be successfully achieved bywireless sensor network with simple node design and multi-hop self-organized network. The advantages include: unattend-ed monitoring and stable long time performance, cheap deviceand simple installation, instant result display and data storage,remote unusual usage detection for the entire building. Finally,the energy consumption record has the potential to be used forroom heating system unmanned scheduling, or to detect theenergy waste mechanisms by the help of human location andmovement tracking system, which points out the empty but
753

heated rooms. Further benefits will be explored by our futurework on Cyber IVY system.
VI. CONCLUSIONS
This paper has discussed an ongoing work of buildingsurface mounted smart sense which uses surface mountedsensor network to monitor air conditioner usage pattern aswell as energy consumption. These observing results can helpus to learn and discover non-energy-efficient behavior andsupport decision making of energy saving methods. The maincontribution of this work is to move sensors from insidethe building to the outside facade. Besides monitoring airconditioners, they can also play an important role in thefield of building structure health monitoring, abnormal eventdetection and many other aspects. Future research may includeexploiting of rich solar power and wind power which willallow the network sustainable so as to be more cost-effective.
ACKNOWLEDGMENT
This work is supported by the Doctoral Scientific Re-search Foundation of Hangzhou Dianzi University(Grant No.KYS055608107), the National Natural Science Foundation ofChina (Grant No. 60903167), the Pre-research Scheme ofNational Basic Research Program of China (973 Program)under Grant No. 2010CB334700, and the Natural ScienceFoundation of Zhejiang Province (Y1111063).
REFERENCES
[1] J. Lu, T. I. Sookoor, V. Srinivasan, G. Gao, B. Holben, J. A. Stankovic,E. Field, and K. Whitehouse, “The smart thermostat: using occupancysensors to save energy in homes,” in SenSys. ACM, 2010, pp. 211–224.
[2] A. Ruzzelli, C. Nicolas, A. Schoofs, and G. O’Hare, “Real-time recog-nition and profiling of appliances through a single electricity sensor,” inSECON. IEEE, 2010, pp. 1–9.
[3] A. Barbato, L. Borsani, and A. Capone, “A wireless sensor networkbased system for reducing home energy consumption,” in SECON.IEEE, 2010, pp. 1–3.
[4] X. Jiang, M. V. Ly, J. Taneja, P. Dutta, and D. E. Culler, “Experienceswith a high-fidelity wireless building energy auditing network,” inSenSys. ACM, 2009, pp. 113–126.
[5] “Buildings energy data book,” U.S. DOE Energy Information Adminis-tration, 2008, http://buildingsdatabook.eere.energy.gov/.
[6] Y. Chen, J.-Q. Ni, C. A. Diehl, A. J. Heber, B. W. Bogan, and L.-L.Chai, “Large scale application of vibration sensors for fan monitoringat commercial layer hen houses,” sensors, vol. 10, no. 12, pp. 11 590–11 604, 2010.
[7] G. Cohn, S. Gupta, J. Froehlich, E. Larson, and S. N. Patel, “Gassense:Appliance-level, single-point sensing of gas activity in the home,” inPervasive, vol. 6030. Springer, 2010, pp. 265–282.
[8] J. Froehlich, E. Larson, T. Campbell, C. Haggerty, J. Fogarty, andS. N. Patel, “Hydrosense: infrastructure-mediated single-point sensingof whole-home water activity,” in UbiComp. ACM, 2009, pp. 235–244.
[9] S. Gupta, M. S. Reynolds, and S. N. Patel, “Electrisense: single-pointsensing using EMI for electrical event detection and classification in thehome,” in UbiComp. ACM, 2010, pp. 139–148.
[10] S. N. Patel, T. Robertson, J. A. Kientz, M. S. Reynolds, and G. D.Abowd, “At the flick of a switch: Detecting and classifying uniqueelectrical events on the residential power line (nominated for the bestpaper award),” in UbiComp, vol. 4717. Springer, 2007, pp. 271–288.
[11] Y. Kim, T. Schmid, Z. Charbiwala, and M. B. Srivastava, “Viridiscope:design and implementation of a fine grained power monitoring systemfor homes,” in UbiComp. ACM, 2009, pp. 245–254.
[12] X. Jiang, S. Dawson-Haggerty, P. Dutta, and D. E. Culler, “Designand implementation of a high-fidelity AC metering network,” in IPSN.ACM, 2009, pp. 253–264.
[13] S. N. Patel, M. S. Reynolds, and G. D. Abowd, “Detecting human move-ment by differential air pressure sensing in HVAC system ductwork: Anexploration in infrastructure mediated sensing,” in Pervasive, vol. 5013.Springer, 2008, pp. 1–18.
[14] X. Jiang, S. Dawson-Haggerty, J. Taneja, P. Dutta, and D. E. Culler,“Creating greener homes with IP-based wireless ac energy monitors,” inSenSys. ACM, 2008, pp. 355–356.
[15] L. Farinaccio and R. Zmeureanu, “Using a pattern recognition approachto disaggregate the total electricity consumption in a house into themajor end-uses,” Energy and Buildings, vol. 30, no. 3, pp. 245–259,1999.
[16] Y. Kim, Z. Charbiwala, A. Singhania, T. Schmid, and M. B. Srivastava,“Spotlight: Personal natural resource consumption profiler,” in HotEm-Nets. ACM, 2008, pp. 1–5.
[17] E. M. Tapia, S. S. Intille, and K. Larson, “Activity recognition in thehome using simple and ubiquitous sensors,” Pervasive Computing, vol.3001, pp. 158–175, 2004.
[18] “Annual energy review (aer): Primary energy productionby source,” U.S. Energy Information Administration, 2010,http://www.eia.doe.gov/aer/pdf/pages/sec1 7.pdf/.
754