buildings and facilities table of contents page no. i ... · e. justification for base adjustments...
TRANSCRIPT

i
Federal Prison System Buildings and Facilities
Table of Contents Page No. I. Overview……………………………………………………………………….. 1 II. Summary of Program Changes……………………………………………… N/A III. Appropriations Language and Analysis of Appropriations Language…... 5 IV. Decision Unit Justification
A. New Construction 1. Program Description………………………………………………… 6 2. Performance Tables…………………………………………………. 8 3. Performance, Resources, and Strategies…………………………….. 11
a. Performance Plan and Report for Outcomes b. Strategies to Accomplish Outcomes c. Results of Program Assessment Rating Tool (PART) Reviews
B. Modernization and Repair
1. Program Description…………………………………………………. 14 2. Performance Tables………………………………………………….. 18 3. Performance, Resources, and Strategies……………………………... 21 a. Performance Plan and Report for Outcomes b. Strategies to Accomplish Outcomes c. Results of Program Assessment Rating Tool (PART) Reviews
V. E-Gov Initiatives (Not Applicable)……………………………………N/A VI. Exhibits A. Organizational Chart B. Summary of Requirements C. Program Increases by Decision Unit (Not Applicable) D. Resources by DOJ Strategic Goal/Objective E. Justification for Base Adjustments F. Crosswalk of 2007 Availability G. Crosswalk of 2008 Availability H. Summary of Reimbursable Resources (Not Applicable) I. Detail of Permanent Positions by Category J. Financial Analysis of Program Increases/Offsets (Not Applicable) K. Summary of Requirements by Grade L. Summary of Requirements by Object Class M. Status of Congressionally Requested Studies, Reports, and Evaluations (N/A) N. Summary of Change O. Status of Construction P. Waterfall

1
I. Overview for the Bureau of Prisons, Buildings and Facilities (B&F) Appropriation The Bureau of Prisons (BOP) was established in 1930 to provide more progressive and humane care for Federal inmates, to professionalize the prison service, and to ensure consistent and centralized administration of the 11 Federal prisons in operation at that time (now 114). The mission of the BOP, an agency of the Department of Justice (DOJ), is to protect society by confining offenders in the controlled environments of prisons and community-based facilities that are safe, humane, cost-efficient, and appropriately secure, and that provide work and other self-improvement opportunities to assist offenders in becoming law-abiding citizens. Electronic copies of the Department of Justice’s Congressional Budget Justifications and Capital Asset Plan and Business Case exhibits can be viewed or downloaded from the Internet using the Internet address: http://www.usdoj.gov/jmd/2009justification/. The BOP’s biggest challenge is managing the ever increasing Federal inmate population, and providing for their care and safety in crowded conditions, as well as the safety of BOP staff and surrounding communities, within budgeted levels. Federal inmate population levels have dramatically increased over the past 30 years1. In 1980, there were fewer than 25,000 inmates in BOP custody, and at the end of FY 2007, the population was 200,020. BOP accommodates inmate population growth with a combined use of state, local and private sector contract beds, facility expansion, and limited new construction. The B&F appropriation features two decision units 1) The New Construction decision unit includes funding to expand existing facilities and construct new facilities; and 2) The Modernization and Repair (M&R) decision unit includes funding to maintain existing facilities in an adequate state of repair to provide a safe and secure environment to continue operations, thereby protecting taxpayer capital investments. The Department recently earned a Green score on the Real Property Management initiative from the Office of Management and Budget (OMB). This significant DOJ accomplishment is due, in large part, to the hard work of BOP staff, as the Federal Prison System accounts for approximately 90 percent of all of DOJ’s capital assets. The BOP’s B&F program underwent a PART assessment in FY 2005 for the FY 2007 budget process and received a rating of “Adequate.” The BOP’s program was found to be strong overall but the PART analysis suggested that the BOP take greater advantage of 1 The population increases in the 1980s were a result of Federal law enforcement efforts and new legislation that dramatically altered sentencing in the Federal criminal justice system. The Sentencing Reform Act of 1984 established determinate sentencing, abolished parole, and reduced good time. Additionally, several mandatory minimum sentencing provisions were enacted in 1986, 1988, and 1990. The large inmate population increases of FY 1998 - 2000 were mainly due to higher number of prosecutions of drug defendants, immigration cases, and weapon offenses. The increase in FY 2001 is attributed to incarceration of District of Columbia sentenced felons in Federal prisons. Since 2002 the BOP continues to see a very high level of drug convictions that seem to have leveled off over the past 12 months, but the immense growth in weapons convictions has continued (an increase of over 60 percent in the four year period of 2002 to 2006), and immigration convictions (an increase of nearly 50 percent for the same period).

2
public and private sector bed space to meet its capacity requirements. In FY 2006, the Criminal Alien Requirement (CAR) V contract (1,200 new beds for criminal aliens) was awarded. The CAR VI contract was awarded in January 2007 to five offerors to house low security criminal alien inmates currently under BOP custody. Finally, the BOP has completed construction, on-time and within budget, of 14 new prisons during FY 2004 through FY 2007, including: 11 new medium and high security facilities in FY 2004 and FY 2005; two new facilities in FY 2006; and FCI Pollock, LA was completed in February 2007. FY 2009 Total Bureau of Prisons Request by DOJ Strategic Goal The BOP’s mission plays a direct role in supporting DOJ, Strategic Goal 3: Ensure the Fair Administration of Justice. For FY 2009, a total of $95,807,000, with 277 positions and 261 FTEs is requested for the B&F appropriation to support the Department’s Strategic Goal to: $ Provide for the safe, secure, and humane confinement of detained persons
awaiting trial and/or sentencing, and those in the custody of the Federal Prison System (Strategic Goal 3.3)
Full Program Costs The BOP’s budget integrates both DOJ and BOP Strategic Goals and Objectives. Each performance objective is linked with the costs of critical strategic actions. The 2009 B&F budget request includes resources to continue the New Construction base programs and provides a small amount for the most critical modernization and repair needs of existing institutions. FY 2009 Budget Request by Decision Unit New Construction Base Funds: $25,180,000 For FY 2009, $25,180,000 in New Construction base funds are required to provide for ongoing expenses within the decision unit. New Construction base resources are essential to the program and are required for the Oklahoma Transfer Center lease payments (approximately $10 million/year); salaries and administrative costs of architects, project managers, site selection, procurement, and other staff necessary to carry out the program objective; environmental requirements and geo-technical exploration; construction of inmate work program areas; expansion/conversion projects i.e. additional special housing unit space; and any unforeseen preliminary project costs issues which can arise and are not included in the individual project cost estimate. Further, new construction base funds are utilized when site investigations are required for a project in which a specific location has not yet been identified.
3
Modernization and Repair: $70,627,000 It is extremely important that sufficient funding for the M&R program be provided to address the most critical repair and safety projects in order to maintain operational Federal prisons. For FY 2009, an M&R base amount of $70,627,000 is requested. This level for M&R will fund some of the most basic repairs of BOP’s aging facilities’ infrastructures. The M&R program provides the necessary resources to undertake essential rehabilitation, renovation and replacement projects at existing institutions to ensure that structures, utilities systems, and other plant facilities are kept in a good state of repair. The BOP strives to follow the recommendations of the Federal Facilities Council (FFC), which recommends that facilities maintenance programs should be funded at a minimum percentage of their replacement value. The replacement value methodology for annual M&R funding requests was first implemented in FY 2000, and should ensure a reliable funding stream to extend the useful life of BOP institutions. Delays in completing needed repairs would increase the number and cost of unfunded projects as well as contribute to additional deterioration of BOP’s aging and inadequate infrastructures. M&R is essential to institution security because deteriorated facilities can add to increased risk of escape, inability to lock down cells, or violence due to inadequate living conditions. Challenges The major challenge the BOP continues to face is how to care for and manage the increasing Federal inmate population, while maintaining appropriately safe and secure prisons. The system-wide crowding level in BOP facilities is currently 36 percent above rated capacity, below the bureau’s overcrowding target for the end of FY 2008, and is estimated to climb to 42 percent by the end of FY 2009. For almost 30 years, the BOP has effectively managed dramatic inmate population growth. In FY 2007, the total inmate population grew by 7,436 net additional inmates. The growth in low security special population inmates may be accommodated through the use of private prison contracts, if funding for this need is made available. However, the majority of growth (about 5,900) is in medium and high security inmates, which requires additional BOP capacity by adding beds where infrastructure would support an expansion, and building and activating new secure institutions. One-third of the BOP’s 114 institutions are over 50 years old (37 as of January 2008). The BOP prioritizes its major M&R projects in order to maintain safe and secure facilities and minimize the amount of unobligated funds at the close of each fiscal year. The threshold for “major” projects equals $300,000 and over. Additional resources are required to reduce the backlog and fund some of the critical and failing infrastructure needs such as roof repairs and perimeter fence security systems. Maintaining sufficient

4
M&R resources is essential to ensuring BOP facilities are kept in a good state of repair for the safety of staff, inmates, and the surrounding communities. Failure to adequately maintain structures and utility systems erodes capital investment and multiplies the costs in future years for accomplishing the required maintenance and repair. This is particularly important given the Administration’s emphasis on agency asset management planning processes. It has been particularly challenging to manage the Federal prisoner population at higher security levels. It is important to note that at the medium security level, more than half of the inmates are drug traffickers or weapons offenders, nearly 80 percent have a history of violence, and the average sentence exceeds 10 years. At the high security level, more than 70 percent of the inmates are drug offenders, weapons offenders, or robbers and another 14 percent have been convicted of murder, aggravated assault, or kidnapping, and the average sentence exceeds 15 years. Also, more than 60 percent of high security inmates have been sanctioned for violating prison rules, and nearly 90 percent have a history of violence. Further, with the War on Terrorism, the BOP’s work has taken on significantly greater risks with the incarceration of high-profile convicted terrorists such as: Zacarias Mossaoui, Nidal Ayyad (World Trade Center Bomber), Terry Nichols, Sheik Rahman, Richard Reid, and Ramzi Yousef.
5
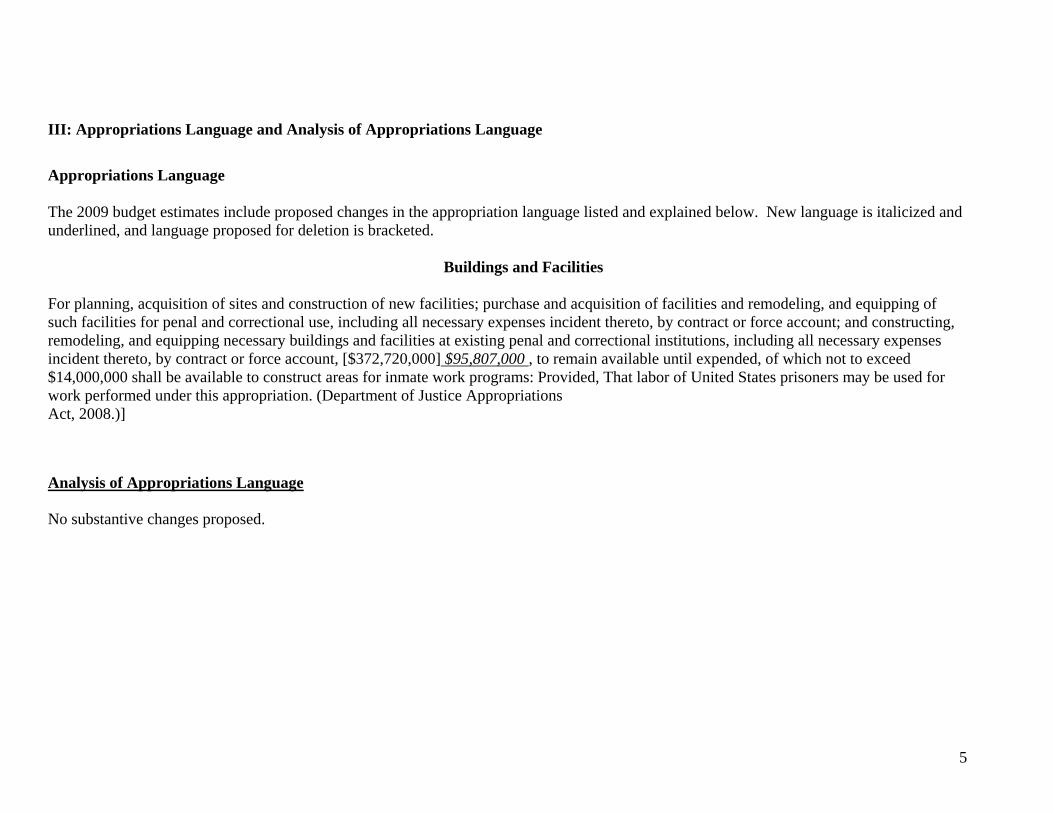
III: Appropriations Language and Analysis of Appropriations Language Appropriations Language The 2009 budget estimates include proposed changes in the appropriation language listed and explained below. New language is italicized and underlined, and language proposed for deletion is bracketed.
Buildings and Facilities For planning, acquisition of sites and construction of new facilities; purchase and acquisition of facilities and remodeling, and equipping of such facilities for penal and correctional use, including all necessary expenses incident thereto, by contract or force account; and constructing, remodeling, and equipping necessary buildings and facilities at existing penal and correctional institutions, including all necessary expenses incident thereto, by contract or force account, [$372,720,000] $95,807,000 , to remain available until expended, of which not to exceed $14,000,000 shall be available to construct areas for inmate work programs: Provided, That labor of United States prisoners may be used for work performed under this appropriation. (Department of Justice Appropriations Act, 2008.)] Analysis of Appropriations Language No substantive changes proposed.
6
IV. Decision Unit Justification A. New Construction
New Construction TOTAL Perm.
Pos. FTE Amount
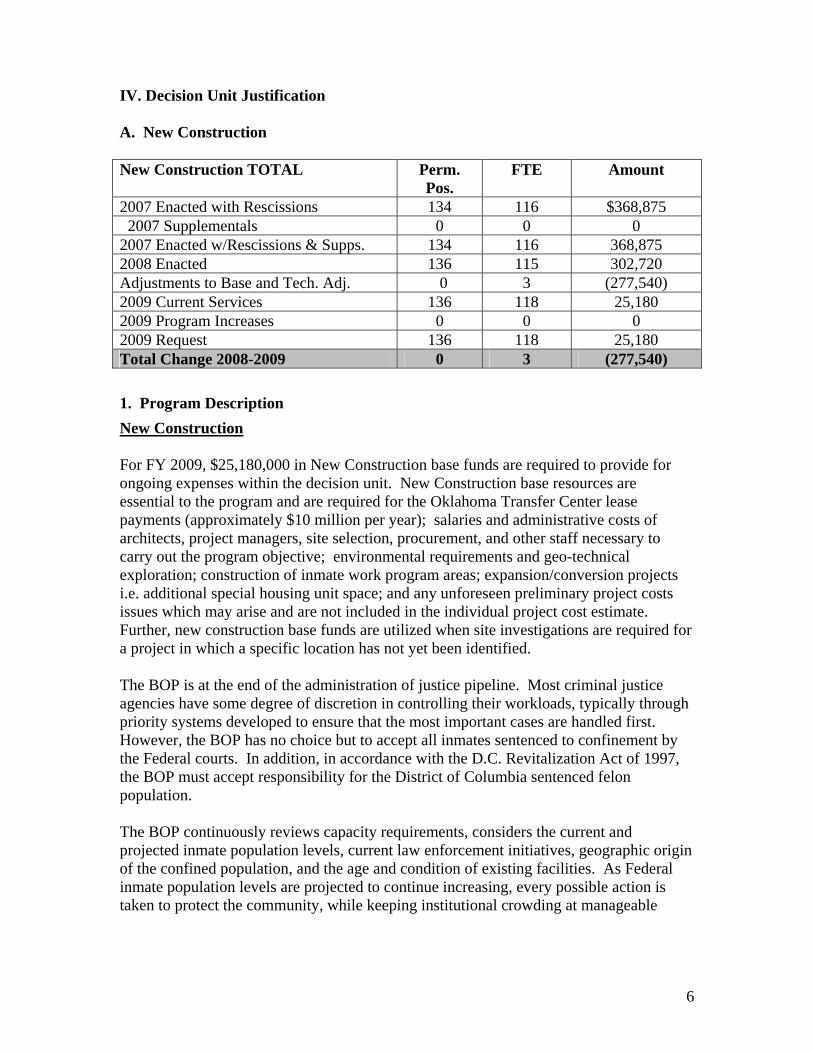
2007 Enacted with Rescissions 134 116 $368,875 2007 Supplementals 0 0 0 2007 Enacted w/Rescissions & Supps. 134 116 368,875 2008 Enacted 136 115 302,720 Adjustments to Base and Tech. Adj. 0 3 (277,540) 2009 Current Services 136 118 25,180 2009 Program Increases 0 0 0 2009 Request 136 118 25,180 Total Change 2008-2009 0 3 (277,540) 1. Program Description New Construction For FY 2009, $25,180,000 in New Construction base funds are required to provide for ongoing expenses within the decision unit. New Construction base resources are essential to the program and are required for the Oklahoma Transfer Center lease payments (approximately $10 million per year); salaries and administrative costs of architects, project managers, site selection, procurement, and other staff necessary to carry out the program objective; environmental requirements and geo-technical exploration; construction of inmate work program areas; expansion/conversion projects i.e. additional special housing unit space; and any unforeseen preliminary project costs issues which may arise and are not included in the individual project cost estimate. Further, new construction base funds are utilized when site investigations are required for a project in which a specific location has not yet been identified. The BOP is at the end of the administration of justice pipeline. Most criminal justice agencies have some degree of discretion in controlling their workloads, typically through priority systems developed to ensure that the most important cases are handled first. However, the BOP has no choice but to accept all inmates sentenced to confinement by the Federal courts. In addition, in accordance with the D.C. Revitalization Act of 1997, the BOP must accept responsibility for the District of Columbia sentenced felon population. The BOP continuously reviews capacity requirements, considers the current and projected inmate population levels, current law enforcement initiatives, geographic origin of the confined population, and the age and condition of existing facilities. As Federal inmate population levels are projected to continue increasing, every possible action is taken to protect the community, while keeping institutional crowding at manageable

7
levels to ensure that Federal inmates continue to serve their sentences in a safe and humane environment. The BOP strives to accommodate its population in the safest and most cost effective manner. Increased capacity is accomplished through the utilization of contract facilities, expansion of existing facilities, acquisition and conversion of military and other properties to prison use, and the ongoing design and construction of new prisons, consistent with the capacity plan. From a cost perspective, the expansion of existing institutions is considered by BOP to be a cost effective technique for increasing prison capacity, and the BOP is currently adding housing units at facilities where program space and systems infrastructure can absorb further population increases. However, where major program and support areas such as food service and utilities are already seriously over capacity, expansion may be cost prohibitive and other alternatives need to be considered. It has been particularly challenging to manage the Federal prisoner population at higher security levels. It is important to note that at the medium security level, more than half of the inmates are drug traffickers or weapons offenders, nearly 80 percent have a history of violence, and the average sentence exceeds 10 years. At the high security level, more than 70 percent of the inmates are drug offenders, weapons offenders, or robbers and another 14 percent have been convicted of murder, aggravated assault, or kidnapping, and the average sentence exceeds 15 years. Also, more than 60 percent of high security inmates have been sanctioned for violating prison rules, and nearly 90 percent have a history of violence
8
PERFORMANCE AND RESOURCES TABLE
Decision Unit: New Construction
DOJ Strategic Goal/Objective: 3.3 Workload/Resources Final Target
(Projected) Actual Projected Changes Requested (Total)
FY 2007 FY 2007 2008 Enacted
Current Services Adjustments and FY 2009
Program FY 2009 Request
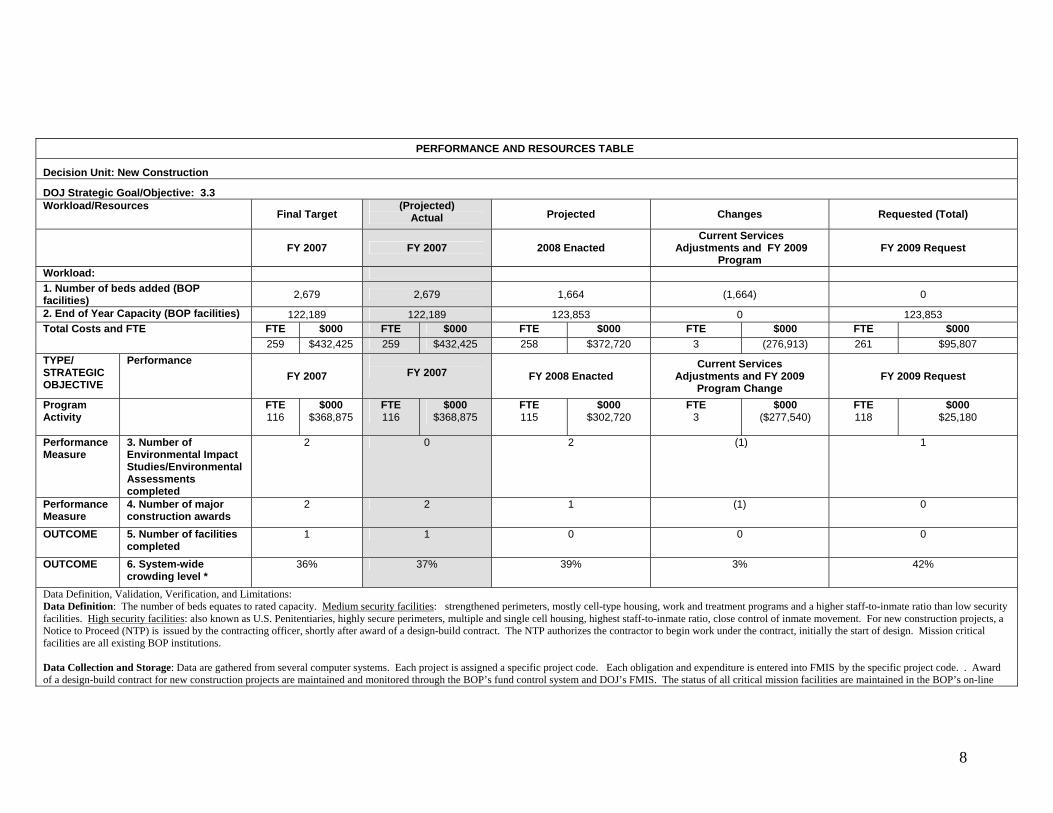
Workload: 1. Number of beds added (BOP facilities) 2,679 2,679 1,664 (1,664) 0
2. End of Year Capacity (BOP facilities) 122,189 122,189 123,853 0 123,853 FTE $000 FTE $000 FTE $000 FTE $000 FTE $000 Total Costs and FTE
259 $432,425 259 $432,425 258 $372,720 3 (276,913) 261 $95,807 TYPE/ STRATEGIC OBJECTIVE
Performance FY 2007
FY 2007 FY 2008 Enacted
Current Services Adjustments and FY 2009
Program Change FY 2009 Request
Program Activity
FTE 116
$000 $368,875
FTE 116
$000 $368,875
FTE 115
$000 $302,720
FTE 3
$000 ($277,540)
FTE 118
$000 $25,180
Performance Measure
3. Number of Environmental Impact Studies/Environmental Assessments completed
2 0 2 (1) 1
Performance Measure
4. Number of major construction awards
2 2 1 (1) 0
OUTCOME 5. Number of facilities completed
1 1 0 0 0
OUTCOME 6. System-wide crowding level *
36% 37% 39% 3% 42%
Data Definition, Validation, Verification, and Limitations: Data Definition: The number of beds equates to rated capacity. Medium security facilities: strengthened perimeters, mostly cell-type housing, work and treatment programs and a higher staff-to-inmate ratio than low security facilities. High security facilities: also known as U.S. Penitentiaries, highly secure perimeters, multiple and single cell housing, highest staff-to-inmate ratio, close control of inmate movement. For new construction projects, a Notice to Proceed (NTP) is issued by the contracting officer, shortly after award of a design-build contract. The NTP authorizes the contractor to begin work under the contract, initially the start of design. Mission critical facilities are all existing BOP institutions. Data Collection and Storage: Data are gathered from several computer systems. Each project is assigned a specific project code. Each obligation and expenditure is entered into FMIS by the specific project code. . Award of a design-build contract for new construction projects are maintained and monitored through the BOP’s fund control system and DOJ’s FMIS. The status of all critical mission facilities are maintained in the BOP’s on-line

9
system (SENTRY) as well as the daily generated prisoner population reports. Data Validation and Verification: Within BOP headquarters, staff retrieve and verify data on a daily basis, analyze it, and formulate reports and projections. Subject matter experts review and analyze population and capacity levels daily, both overall and by security level. The BOP Capacity Planning Committee (CPC), comprised of top BOP officials, meets bi-monthly to review, verify, and update population projections and capacity needs for the BOP. Purchase requests for design-build contracts are approved by specific project management staff (based on dollar threshold limitations); commitments are entered into a computer based fund control system; and purchase requests are forwarded for procurement action. Once the procurement office awards a contract/purchase order, the obligation is entered into the DOJ FMIS. Each month, FMIS obligations are reconciled with the BOP’s fund control register by project, and forwarded to the Central Office Finance Branch, Business Office, to ensure accuracy and compliance. The contracting officer issues the NTP, shortly after award of a design-build contract. The award of a contract is based on completing the procurement of the contract and receipt of the necessary environmental or political requirements or clearances. Data Limitations: Due to the unpredictable environment in prisons and other external factors, there may often be discrepancies between projected and actual numbers contained in the performance tables. Most plans are developed based on historical data, and past experience to project for the future. In addition, budget delays and shortfalls also affect performance results. The time required for a project to go from NTP to “completion” depends on numerous factors, such as: the extent of site development or remediation activities required; climate of the project site (how many months of good construction weather); what time of year the NTP is issued; unusual weather; unforeseen site conditions; and quality of management by the contractor.

10
PERFORMANCE MEASURE TABLE
Decision Unit: New Construction FY 2001 FY2002 FY 2003 FY 2004 FY 2005 FY 2006 FY 2007 FY 2008 FY 2009
Performance Report and Performance Plan Targets
Actual Actual Actual Actual Actual Actual Target Actual Target Target
Performance
Measure
Number of Environmental Impact Studies/Environmental Assessments completed
8 0 0 1 1 1 2 2 4 1
Performance
Measure
Number or major construction awards 6 2 2 0 1 0 3 3 1 0
OUTCOME
Measure
Number of facilities completed 4 2 2 9 1 2 1 1 0 0
OUTCOME Measure
System-wide Crowding in Federal Prisons
32%
33%
39%
41%
34%
36%
36%
37%
39%
42%

11
3. Performance, Resources, and Strategies The New Construction decision unit contributes directly to the Department’s Strategic Goal 3: Ensure the Fair and Efficient Administration of Justice. a. Performance Plan and Report for Outcomes As illustrated in the preceding Performance and Resources Table, the outcome measures for this decision unit are: Number of facilities completed/constructed and System-wide crowding level. In FY 2008, construction completion and the activation of an expansion at FCI Otisville, New York is planned. In FY 2008, the activation process of one new institution (FCI Pollock, Louisiana) is expected to begin, dependent on sufficient operations funding. Construction completion of FCI Pollock was accomplished in February 2007. For FY 2009, the BOP continues development of various ongoing construction projects, but does not plan to complete or begin activation of any of those projects by the end of the Fiscal Year. The BOP activated one prison expansion in FY 2007, but with nearly 7,500 new inmates, BOP missed the target by 1 percent with a 37 percent actual system-wide crowding rate. Population projections for FY 2008 to FY 2009 are based on data and information from a variety of sources including the Administrative Office of the U.S. Courts, U.S. Sentencing Commission, the Executive Office for United States Attorneys, the Office of the Federal Detention Trustee, the Drug Enforcement Administration, the Federal Bureau of Investigation, and the BOP’s own information system (SENTRY). The FY 2008 crowding target is 39 percent and the FY 2009 crowding target is projected to increase to 42 percent. b. Strategies to Accomplish Outcomes Acquire needed capacity through a multi-pronged approach of contracts with private providers of correctional services, with other units of government, and new construction, and ensure that existing facilities are safe and secure. c. Results of Program Assessment Rating Tool (PART)) Reviews The BOP’s B&F program was PARTed in FY 2005 for the FY 2007 budget process. During this process, the BOP’s B&F program received a score of 61.2 percent and a rating of “Adequate.” While BOP’s program was found to be strong overall, the PART analysis suggested that BOP take greater advantage of public and private sector bed space to meet its capacity requirements. In FY 2006, the Criminal Alien Requirement (CAR) V contract (1,200 new beds for criminal aliens) was awarded, and the BOP completed the ramp up of Moshannon Valley private facility. In addition, the CAR VI contract was awarded in January 2007 to five offerors to house low security criminal alien inmates currently under BOP custody. Finally, the FY 2008 Enacted provides annualization of prior year increases which will fund 1,079 beds. The FY 2009 Congressional budget includes funding for 2,622 beds.

12
Action: The BOP has constructed 11 new medium and high security facilities and is committed to contracting out for low and minimum security inmates. There are 109,500 low and minimum security inmates, and about 28,000 are housed in contract confinement. Status: The BOP completed construction of 11 new medium and high security facilities in FY 2004/FY 2005, completed one in January 2006 (FCI Butner, NC) and one in April 2006 (SFF Hazelton, WV). In addition, FCI Pollock, LA was completed in February 2007. Also, BOP continues to demonstrate its commitment to contracting out for low and minimum security inmates. On January 3, 2008, 33,489 inmates were housed in contract confinement. This is an increase from 14.9 percent at the end of FY 2005 and 15.6 percent at the end of FY 2006 to 16.8 percent on January 3, 2008. Action: The BOP is beginning to take greater advantage of State, local and private sector bed space to meet its space requirements. Status: The BOP continues to add contract low security beds consistent with funding, to help reduce crowding. The CAR V contract (1,200 new beds for Criminal Aliens) was awarded on May 24, 2006. On January 17, 2007, the BOP awarded multiple CAR VI contracts to five offerors to house low security criminal alien inmates currently in BOP custody. Additionally, the BOP completed the ramp up of the Moshannon Valley private facility in FY 2007. The FY 2008 Enacted annualizes of prior year increases which support an increase of approximately 1,100 contract beds. The FY 2009 Congressional budget includes $50 million to begin the procurement of 4,000 new contract beds. Action: Analyze, review and provide summary on staffing efficiencies, savings and cost avoidances associated with the procurement of electrified security fences. The BOP expects to award contracts in FY 2006 for $10 million to procure lethal electrified fences at seven high security federal prisons. The BOP believes this technology will serve as heightened security and help deter potential escapes and operate more cost-effectively by reducing the guard towers, and redesigning staffing patterns. Status: The BOP awarded a contract on April 14, 2006, to have stun/lethal electric perimeter fencing installed at 7 newly constructed high security facilities ( USP Coleman, FL I and II; USP Terre Haute, IN; USP McCreary, KY;USP Tucson, AZ; USP Pollock, LA; and USP Hazelton, WV). Construction has begun on the stun/lethal electric perimeter fence at all 7 sites. This project is planned to be completed in phases at the 7 sites by summer 2008. Upon completion of this project, and implementation of electric fencing, the BOP expects to achieve an annual savings of 165 positions and FTE and associated annual cost avoidance of over $11 million. Action: System-wide crowding at federal correctional facilities has been in excess of 30 percent for the past several years. The BOP is evaluating crowding conditions, and rated capacity may need to be adjusted.

13
Status: The OMB required the BOP to complete an assessment of the “the acceptable level of crowding in federal prisons”. The BOP completed the assessment, reviewed the study with DOJ leadership and forwarded it on March 28, 2006. The study concluded that the acceptable level of crowding should be reduced substantially, as high levels of crowding lead to serious assaults. The study involved a time span of more than 8 ½ years and documented the higher level of serious assaults that are associated with crowding. Action: Perform an independent, non-biased evaluation and/or validation of the Program Review Division’s program audit review procedures of the construction program to ensure compliance with PART guidelines. If possible, enhance and modify BOP’s existing program evaluation approach to provide the most rigorous evidence and recommendations possible. This approach will be high quality, of sufficient scope unbiased and independent, and conducted on a regular basis, covering targeted aspects of new construction and modernization and repair programs. Status: The GAO completed and recently closed its independent study of the BOP’s Capital Asset Program. This requirement was completed with OMB’s Concurrence.

14
B. Modernization and Repair
Modernization and Repair TOTAL Perm. Pos.
FTE Amount
2007 Enacted with Rescissions 141 143 $63,550 2007 Supplementals 0 0 0 2007 Enacted w/Rescissions & Supps. 141 143 63,550 2008 Enacted 141 143 70,000 Adjustments to Base and Tech. Adj. 0 0 627 2009 Current Services 141 143 70,627 2009 Program Increases 0 0 0 2009 Request 141 143 70,627 Total Change 2008-2009 0 0 627 1. Program Description Modernization and Repair The Modernization and Repair (M&R) program provides the resources to undertake essential rehabilitation, modernization and renovation of buildings, other structures, and associated systems, necessary modifications to meet legal requirements and accommodate correctional programs, repair or replacement of utilities systems and other critical infrastructure and repair projects at existing institutions in order to keep all systems and structures in a good state of repair. Proper maintenance, modernization, and repair of BOP institutions is essential. Failure to adequately maintain structures and utility systems erodes capital investment and multiplies the costs in future years for accomplishing the required maintenance and repair. Most important, failure to maintain structures can cause direct and/or indirect security problems. Most maintenance and repair projects are performed using inmate work crews. This provides instructional work for inmates and labor for the work to be performed. Inmate work crews require staff supervision to direct the work being performed and for obvious security reasons. One-third of the BOP’s 114 institutions are over 50 years old (37 as of January 2008), and most have not undergone major renovations from the time they were constructed or acquired and converted to prison use by the BOP. Each facility has numerous buildings, as well as inmate living quarters on the compound, many of which require extensive work to maintain an adequate state of repair to assure that they meet established standards. Prison facilities are subjected to much heavier than normal use, since they are continuously used 24 hours a day, 365 days a year. Due to crowded conditions, at medium and high security, these facilities are over utilized, which is causing extensive wear and tear, as well as premature deterioration. This is especially true in many of the older facilities where the utility system infrastructures (water, sewer, electrical, and heating/air conditioning) were originally designed for a smaller inmate population.
15
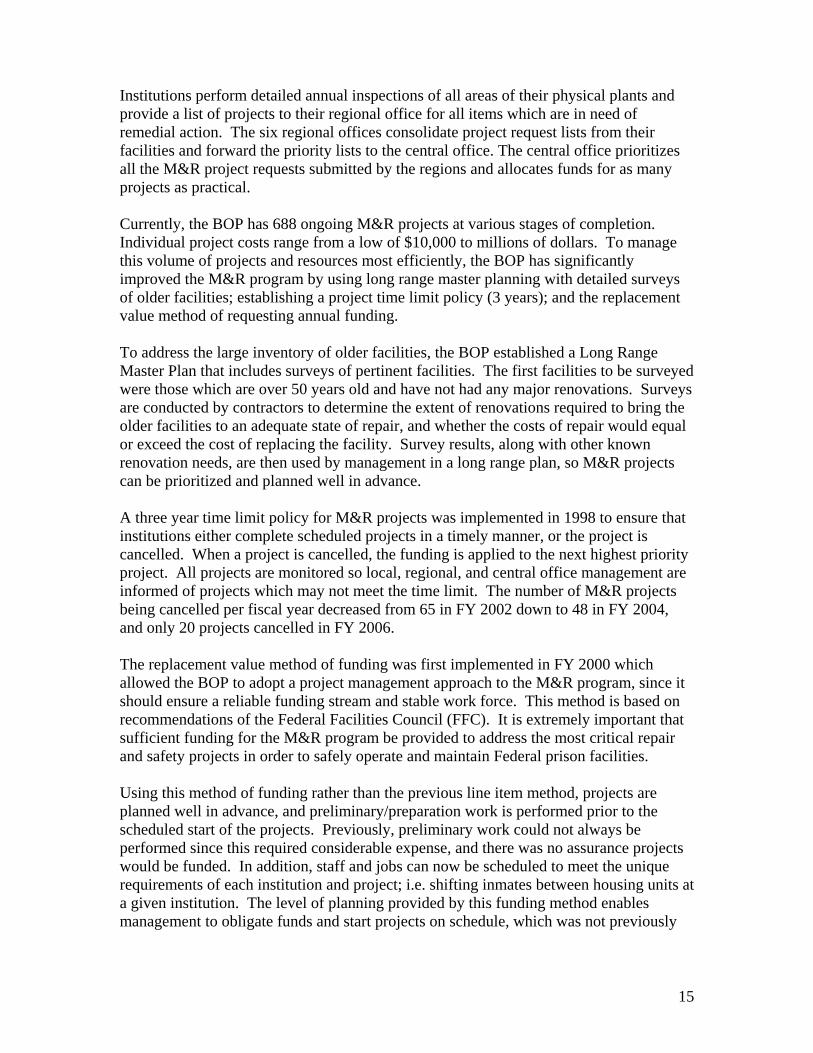
Institutions perform detailed annual inspections of all areas of their physical plants and provide a list of projects to their regional office for all items which are in need of remedial action. The six regional offices consolidate project request lists from their facilities and forward the priority lists to the central office. The central office prioritizes all the M&R project requests submitted by the regions and allocates funds for as many projects as practical. Currently, the BOP has 688 ongoing M&R projects at various stages of completion. Individual project costs range from a low of $10,000 to millions of dollars. To manage this volume of projects and resources most efficiently, the BOP has significantly improved the M&R program by using long range master planning with detailed surveys of older facilities; establishing a project time limit policy (3 years); and the replacement value method of requesting annual funding. To address the large inventory of older facilities, the BOP established a Long Range Master Plan that includes surveys of pertinent facilities. The first facilities to be surveyed were those which are over 50 years old and have not had any major renovations. Surveys are conducted by contractors to determine the extent of renovations required to bring the older facilities to an adequate state of repair, and whether the costs of repair would equal or exceed the cost of replacing the facility. Survey results, along with other known renovation needs, are then used by management in a long range plan, so M&R projects can be prioritized and planned well in advance. A three year time limit policy for M&R projects was implemented in 1998 to ensure that institutions either complete scheduled projects in a timely manner, or the project is cancelled. When a project is cancelled, the funding is applied to the next highest priority project. All projects are monitored so local, regional, and central office management are informed of projects which may not meet the time limit. The number of M&R projects being cancelled per fiscal year decreased from 65 in FY 2002 down to 48 in FY 2004, and only 20 projects cancelled in FY 2006. The replacement value method of funding was first implemented in FY 2000 which allowed the BOP to adopt a project management approach to the M&R program, since it should ensure a reliable funding stream and stable work force. This method is based on recommendations of the Federal Facilities Council (FFC). It is extremely important that sufficient funding for the M&R program be provided to address the most critical repair and safety projects in order to safely operate and maintain Federal prison facilities. Using this method of funding rather than the previous line item method, projects are planned well in advance, and preliminary/preparation work is performed prior to the scheduled start of the projects. Previously, preliminary work could not always be performed since this required considerable expense, and there was no assurance projects would be funded. In addition, staff and jobs can now be scheduled to meet the unique requirements of each institution and project; i.e. shifting inmates between housing units at a given institution. The level of planning provided by this funding method enables management to obligate funds and start projects on schedule, which was not previously
16
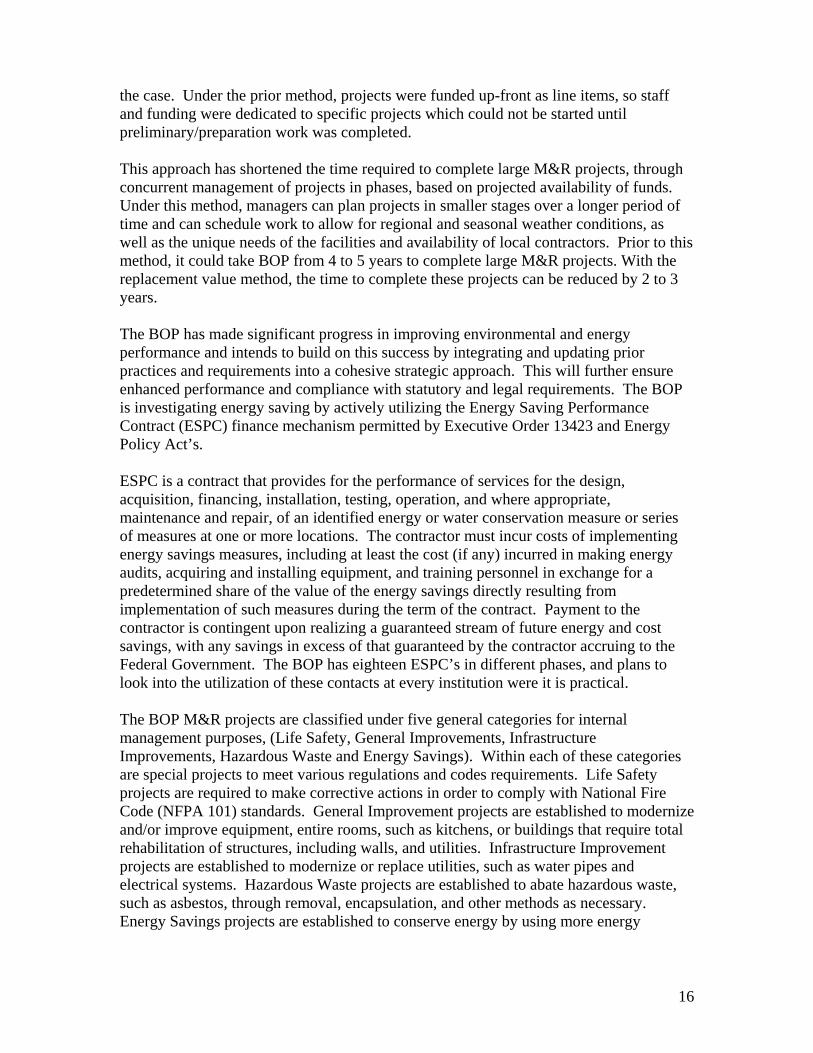
the case. Under the prior method, projects were funded up-front as line items, so staff and funding were dedicated to specific projects which could not be started until preliminary/preparation work was completed. This approach has shortened the time required to complete large M&R projects, through concurrent management of projects in phases, based on projected availability of funds. Under this method, managers can plan projects in smaller stages over a longer period of time and can schedule work to allow for regional and seasonal weather conditions, as well as the unique needs of the facilities and availability of local contractors. Prior to this method, it could take BOP from 4 to 5 years to complete large M&R projects. With the replacement value method, the time to complete these projects can be reduced by 2 to 3 years. The BOP has made significant progress in improving environmental and energy performance and intends to build on this success by integrating and updating prior practices and requirements into a cohesive strategic approach. This will further ensure enhanced performance and compliance with statutory and legal requirements. The BOP is investigating energy saving by actively utilizing the Energy Saving Performance Contract (ESPC) finance mechanism permitted by Executive Order 13423 and Energy Policy Act’s. ESPC is a contract that provides for the performance of services for the design, acquisition, financing, installation, testing, operation, and where appropriate, maintenance and repair, of an identified energy or water conservation measure or series of measures at one or more locations. The contractor must incur costs of implementing energy savings measures, including at least the cost (if any) incurred in making energy audits, acquiring and installing equipment, and training personnel in exchange for a predetermined share of the value of the energy savings directly resulting from implementation of such measures during the term of the contract. Payment to the contractor is contingent upon realizing a guaranteed stream of future energy and cost savings, with any savings in excess of that guaranteed by the contractor accruing to the Federal Government. The BOP has eighteen ESPC’s in different phases, and plans to look into the utilization of these contacts at every institution were it is practical. The BOP M&R projects are classified under five general categories for internal management purposes, (Life Safety, General Improvements, Infrastructure Improvements, Hazardous Waste and Energy Savings). Within each of these categories are special projects to meet various regulations and codes requirements. Life Safety projects are required to make corrective actions in order to comply with National Fire Code (NFPA 101) standards. General Improvement projects are established to modernize and/or improve equipment, entire rooms, such as kitchens, or buildings that require total rehabilitation of structures, including walls, and utilities. Infrastructure Improvement projects are established to modernize or replace utilities, such as water pipes and electrical systems. Hazardous Waste projects are established to abate hazardous waste, such as asbestos, through removal, encapsulation, and other methods as necessary. Energy Savings projects are established to conserve energy by using more energy

17
efficient equipment and systems. Energy projects are also required to meet pertinent energy conservation laws and regulations. The five categories may also contain subcategories of projects (such as Accessibility, Environmental and others) to meet specific needs. For example, General Improvement projects may each include smaller Accessibility projects to meet Architectural Barriers Act requirements. Environmental projects are necessary for the BOP to be in compliance with environmental and safety regulations required by the Environmental Protection Agency (EPA) and the Office of Safety and Health Administration (OSHA). The M&R program has demonstrated substantial improvements through the implementation of the Long Range Planning method with its associated facility surveys, the project time limit policy, and the replacement value method of requesting funding. These changes have helped the BOP complete more projects in a shorter period of time and stretch its repair dollars. The BOP has been able to substantially reduce the M&R unobligated balance with the time limit policy, from over $118 million in FY 1999 down to $23.5 million at the end of FY 2007.

18
PERFORMANCE AND RESOURCES TABLE
Decision Unit: Modernization and Repair of Existing Facilities
DOJ Strategic Goal/Objective: 3.3 Workload/Resources
Final Target (Projected) Actual
Projected Changes Requested (Total)
FY 2007
FY 2007
2008 Enacted
Current Services Adjustments and FY 2009
Program Change
FY 2009 Request
Workload: 1. Total projects established 297 377 425 15 440
FTE $000 FTE $000 FTE $000 FTE $000 FTE $000 Total Costs and FTE 259 $432,425 259 $432,425 258 $372,720 3 ($276,913) 261 $95,807 TYPE/ STRATEGIC OBJECTIVE
Performance
FY 2007
FY 2007
FY 2008 Enacted
Current Services Adjustments and FY 2009
Program Change
FY 2009 Request
Program Activity
FTE 143
$000 $63,550
FTE 143
$000 $63,550
FTE 143
$000 $70,000
FTE 0
$000 $627
FTE 143
$000 $70,627
Performance Measure
2. Total projects completed and closed
375 435 340 0 340
Performance Measure
3. Total projects active at year end
514 603 688 100 788
OUTCOME 4. Court ordered remedial projects 5. Dollar value of fines for violations
0
0
0
0
0
0
0
0
0
0
Performance Measure
6. Number of facilities over 30 years old 7. Number of facilities over 50 years old 8. Long range master plan for facilities over 50 years old in development 9. Long range master plan for facilities over 50 years old – completed
55
36
0
25
55
36
0
25
57
37
0
25
3
1
0
0
60
38
0
25
Data Definition, Validation, Verification, and Limitations: Data Definition:. Medium security facilities: strengthened perimeters, mostly cell-type housing, work and treatment programs and a higher staff-to-inmate ratio than low security facilities. High security facilities: also known as U.S. Penitentiaries, highly secure perimeters, multiple and single cell housing, highest staff-to-inmate ratio, close control of inmate movement. The three-year time limit policy for M&R projects means that

19
institutions are allowed three years to complete scheduled projects or the project is canceled and the funds are committed to other high priority M&R projects. To ensure that electronic equipment utilized for life safety sustains trouble-free operation, the BOP schedules life cycle equipment replacement based on a ten-year cycle. The critical equipment is radio systems and PBX (Public Branch Exchange) systems. Mission critical facilities are all existing BOP institutions. Data Collection and Storage: Data are gathered from several computer systems. Each project is assigned a specific project code. Each obligation and expenditure is entered into FMIS by the specific project code. Modernization and Repair (M&R) projects are closely monitored to ensure completion and closure prior to the 3-year expiration. At the start of every fiscal year, the BOP’s Central Office identifies the M&R projects that will reach the 3-year expiration by the end of that fiscal year. The BOP relies on an in-house house data base in Microsoft Access and DOJ’s FMIS to effectively track and manage M&R projects (dates and costs). The BOP uses the Total Maintenance System (TMS) program to determine nationally which radio, PBX System and equipment qualify for replacement annually, based on age and performance. Data Validation and Verification: Within BOP headquarters, staff retrieve and verify data on a daily basis, analyze it, and formulate reports and projections. Subject matter experts review and analyze population and capacity levels daily, both overall and by security level. Purchase requests are approved by specific project management staff (based on dollar threshold limitations); commitments are entered into a computer based fund control system; and purchase requests are forwarded for procurement action. Once the procurement office awards a contract/purchase order, the obligation is entered into the DOJ FMIS. Each month, FMIS obligations are reconciled with the BOP’s fund control register by project, and forwarded to the Central Office Finance Branch, Business Office, to ensure accuracy and compliance. M&R data is maintained in the Microsoft Access database and is verified periodically against FMIS which also tracks the financial status of projects. On an annual basis, the BOP’s Central Office Facilities Branch documents which electronic equipment, utilized for life safety, will be at the end of the ten year life cycle. This is accomplished through review and evaluation of the systems by field staff, the contractor, and close monitoring of the TMS program. Each institution enters their data into the TMS program and the information on the critical equipment is reviewed and verified by their respective Regional Office for accurate dates and equipment condition. . Data Limitations: Due to the unpredictable environment in prisons and other external factors, there may often be discrepancies between projected and actual numbers contained in the performance tables. Most plans are developed based on historical data, and past experience to project for the future. In addition, budget delays and shortfalls also affect performance results. For example, due to budget shortfalls in the past the M&R program could not complete all required equipment replacements based on the ten-year life cycle due to limited funds, and some replacements had to be delayed to the following year.

20
PERFORMANCE MEASURE TABLE
Decision Unit: Modernization & Repair FY2001 FY2002 FY 2003 FY 2004 FY 2005 FY 2006 FY 2007 FY 2008 FY 2009
Performance Report and Performance Plan Targets
Actual Actual Actual Actual Actual Actual Target Actual Target Target
Performance Measure
M&R projects: Completed/Active 638/949 478/743 476/725 474/770 461/781 423/592 375/514 435/603 340/688 340/788
Performance
Measure
Number of facilities over 30 years old 44 47 49 51 52 55 55 55 57 60
Performance
Measure
Number of facilities over 50 years old 31 33 33 33 35 36 36 36 37 38
Performance
Measure
Long range master plan for facilities over
50 years old in development 4 5 3 1 1 0 0 0 0 0
Performance
Measure
Long range master plan for facilities over
50 years completed 15 16 17 20 24 25 25 25 25 25

21
3. Performance, Resources, and Strategies The Modernization and Repair (M&R) decision unit contributes directly to the Department’s Strategic Goal 3: Ensure the Fair and Efficient Administration of Justice. a. Performance Plan and Report for Outcomes As illustrated in the preceding Performance and Resources Table, the outcome measures for this decision unit are: Court ordered remedial projects and Dollar value of fines for violations. In FY 2007, there were no court ordered remedial projects. The BOP projects that there will continue to be no court ordered remedial projects or dollar value of fines for violations in FY 2008 to FY 2009. The BOP follows a plan to assure that existing facilities meet established standards. Institutions perform detailed annual inspections of all areas of their physical plants and provide a list of projects to their regional office for all items which are in need of remedial action, and they are placed on a priority list for funding. However, projects could be delayed due to budget constraints and limited resources. In FY 2008, the BOP plans to complete and close 340 M&R projects, leaving 688 active at Fiscal Year end. For FY 2009, the BOP estimates that 340 M&R projects will be completed and closed, and 788 remaining active at Fiscal Year end. b. Strategies to Accomplish Outcomes Ensure that existing facilities are safe and secure. c. Result of Program Assessment Rating Tool (PART) Reviews See New Construction Programs Decision Unit

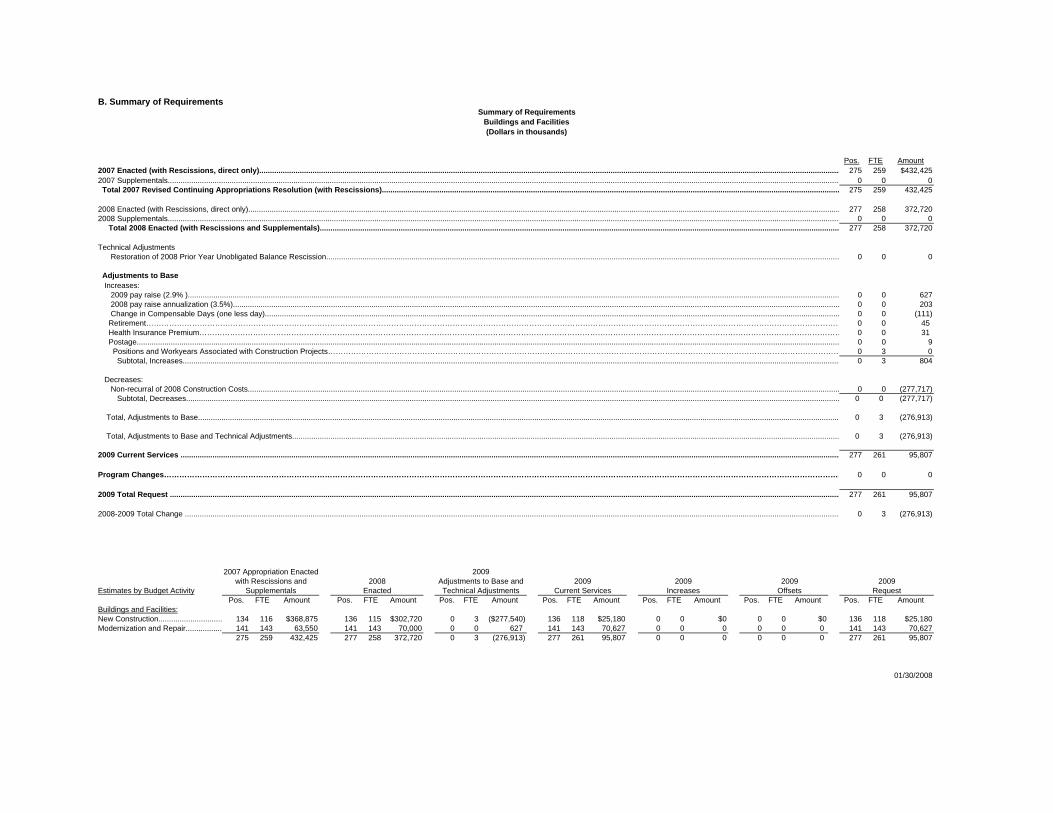
B. Summary of RequirementsSummary of Requirements
Buildings and Facilities(Dollars in thousands)
Pos. FTE Amount2007 Enacted (with Rescissions, direct only)................................................................................................................................................................................................................................................................................. 275 259 $432,4252007 Supplementals............................................................................................................................................................................................................................................................................................................................ 0 0 0 Total 2007 Revised Continuing Appropriations Resolution (with Rescissions)....................................................................................................................................................................................................................... 275 259 432,425
2008 Enacted (with Rescissions, direct only)...................................................................................................................................................................................................................................................................................... 277 258 372,7202008 Supplementals............................................................................................................................................................................................................................................................................................................................ 0 0 0 Total 2008 Enacted (with Rescissions and Supplementals).................................................................................................................................................................................................................................................... 277 258 372,720
Technical Adjustments Restoration of 2008 Prior Year Unobligated Balance Rescission................................................................................................................................................................................................................................................. 0 0 0
Adjustments to Base Increases: 2009 pay raise (2.9% ).................................................................................................................................................................................................................................................................................................................. 0 0 627 2008 pay raise annualization (3.5%)............................................................................................................................................................................................................................................................................................. 0 0 203 Change in Compensable Days (one less day).............................................................................................................................................................................................................................................................................. 0 0 (111) Retirement………………………………………………………………………………………………………………………………………………………………………………………………………………………………………………… 0 0 45 Health Insurance Premium……………………………………………………………………………………………………………………………………………………………………………………………………………………………… 0 0 31 Postage.......................................................................................................................................................................................................................................................................................................................................... 0 0 9 Positions and Workyears Associated with Construction Projects………………………………………………………………………………………………………………………………………………………………………………… 0 3 0 Subtotal, Increases..................................................................................................................................................................................................................................................................................................................... 0 3 804
Decreases: Non-recurral of 2008 Construction Costs...................................................................................................................................................................................................................................................................................... 0 0 (277,717) Subtotal, Decreases................................................................................................................................................................................................................................................................................................................... 0 0 (277,717)
Total, Adjustments to Base............................................................................................................................................................................................................................................................................................................. 0 3 (276,913)
Total, Adjustments to Base and Technical Adjustments................................................................................................................................................................................................................................................................. 0 3 (276,913)
2009 Current Services ...................................................................................................................................................................................................................................................................................................................... 277 261 95,807
Program Changes…………………………………………………………………………………………………………………………………………………………………………………………………………………………………………… 0 0 0
2009 Total Request ........................................................................................................................................................................................................................................................................................................................... 277 261 95,807
2008-2009 Total Change .................................................................................................................................................................................................................................................................................................................... 0 3 (276,913)
2007 Appropriation Enacted 2009with Rescissions and 2008 Adjustments to Base and 2009 2009 2009 2009
Estimates by Budget Activity Supplementals Enacted Technical Adjustments Current Services Increases Offsets RequestPos. FTE Amount Pos. FTE Amount Pos. FTE Amount Pos. FTE Amount Pos. FTE Amount Pos. FTE Amount Pos. FTE Amount
Buildings and Facilities:New Construction.............................. 134 116 $368,875 136 115 $302,720 0 3 ($277,540) 136 118 $25,180 0 0 $0 0 0 $0 136 118 $25,180Modernization and Repair................. 141 143 63,550 141 143 70,000 0 0 627 141 143 70,627 0 0 0 0 0 0 141 143 70,627
275 259 432,425 277 258 372,720 0 3 (276,913) 277 261 95,807 0 0 0 0 0 0 277 261 95,807
01/30/2008

D: Resources by DOJ Strategic Goal and Strategic Objective
Resources by Department of Justice Strategis Goal/ Objective Federal Prison System Buildings and Facilities (Dollars in thousands)
Strategic Goal 3 2007 Enacted 2008 2009 2009 2009Objective with Resc. & Sup. Enacted Current Services Increases Offsets Request
Direct, Direct, Direct, Direct, Direct, Direct, Reimb. Direct Reimb. Direct Reimb. Direct Reimb. Direct Reimb. Direct Reimb. Direct
Ensure the Fair and Efficient Other Amount Other Amount Other Amount Other Amount Other Amount Other Amount Administration of Justice FTE $000s FTE $000s FTE $000s FTE $000s FTE $000s FTE $000s
(3.3) Buildings and Facilities 259 $432,425 258 $372,720 261 $95,807 0 $0 0 0 261 $95,807 Grand Total 259 432,425 258 372,720 261 95,807 0 0 0 0 261 95,807

22
E. Justification for Base Adjustments
Justification for Base Adjustments Federal Prison System Building and Facilities
Increases 2009 pay raise. This request provides for a proposed 2.9 percent pay raise to be effective in January of 2009. This increase includes locality pay adjustments as well as the general pay raise. The amount requested, $627,000 , represents the pay amounts for ¾ of the fiscal year plus appropriate benefits ($439,000 for pay and $188,000 for benefits). Annualization of 2008 pay raise. This pay annualization represents first quarter amounts (October through December) of the 2008 pay increase of 3.5 percent included in the 2008 President’s Budget. The amount requested $203,000, represents the pay amounts for ¼ of the fiscal year plus appropriate benefits ($142,000 for pay and $61,000 for benefits). Retirement. Agency retirement contributions increase as employees under CSRS retire and are replaced by FERS employees. Based on U.S. Department of Justice Agency estimates, we project that the DOJ workforce will convert from CSRS to FERS at a rate of 1.3 percent per year. The requested increase of $45,000 is necessary to meet our increased retirement obligations as a result of this conversion. Health Insurance: Effective January 2007, this component’s contribution to Federal employee’s health insurance premiums increased by 2.5 percent. Applied against the 2008 estimate of $1,248, the additional amount required is $31,000. Postage: Effective May 14, 2007, the Postage Service implemented a rate increase of 5.1 percent. This percentage was applied to the 2008 estimate of $172,000 to arrive at an increase of $9,000. Positions and Workyears Associated with Construction Projects: Required workyears associated with construction funding received in FY 2007 for FCI Mendota, CA.

F: Crosswalk of 2007 Availability
Crosswalk of 2007 Availability
Federal Prison SystemBuildings and Facilities(Dollars in thousands)
FY 2007 Enacted Reprogrammings/ Carryover/
Without Rescissions Rescissions Supplementals Transfers Recoveries 2007 AvailabilityDecision Unit: Pos. FTE _Amount Pos. FTE Amount Pos. FTE Amount Pos. FTE Amount Pos. FTE Amount Pos. FTE Amount 1. New Construction…………........................... 134 116 $368,875 0 0 $0 0 0 $0 0 0 $0 0 0 $333,878 134 116 $702,753
2. Modernization and Repair………………....... 141 143 63,550 0 0 0 0 0 0 0 0 0 0 0 29,528 141 143 93,078
Total.................................................................. 275 259 432,425 0 0 0 0 0 0 0 0 0 0 0 363,406 275 259 795,831
Unobligated Balances. Funds were carried over from FY 2006 from the Buildings and Facilities account. The Bureau of Prisons brought forward $363,406,000 from funds provided in prior years for the Buildings and Facilities account.

G: Crosswalk of 2008 Availability
Crosswalk of 2008 Availability
Federal Prison SystemBuildings and Facilities(Dollars in thousands)
Reprogrammings/ FY 2008 Enacted Rescissions Supplementals Transfers Carryover/Recoveries 2008 Availability
Decision Unit: Pos. FTE _Amount Pos. FTE Amount Pos. FTE Amount Pos. FTE Amount Pos. FTE Amount Pos. FTE Amount 1. New Construction………….... 136 115 $302,720 0 0 $0 0 0 $0 0 0 $0 0 0 $115,634 136 115 $418,354
2. Modernization and Repair…… 141 143 70,000 0 0 0 0 0 0 0 0 0 0 0 23,524 141 143 93,524
Total........................................... 277 258 372,720 0 0 0 0 0 0 0 0 0 0 0 139,158 277 258 511,878
Reimbursable FTE………………Total FTE………………………… 0 0 0 0 0 0Other FTE: LEAP………………… Overtime……………Total Compensable FTE………… 0 0 0 0 0 0
Unobligated Balances. Funds were carried over from FY 2007 from the Buildings and Facilities account. The Bureau of Prisons brought forward $139,158,000 from funds provided in prior years for the Buildings and Facilities account.
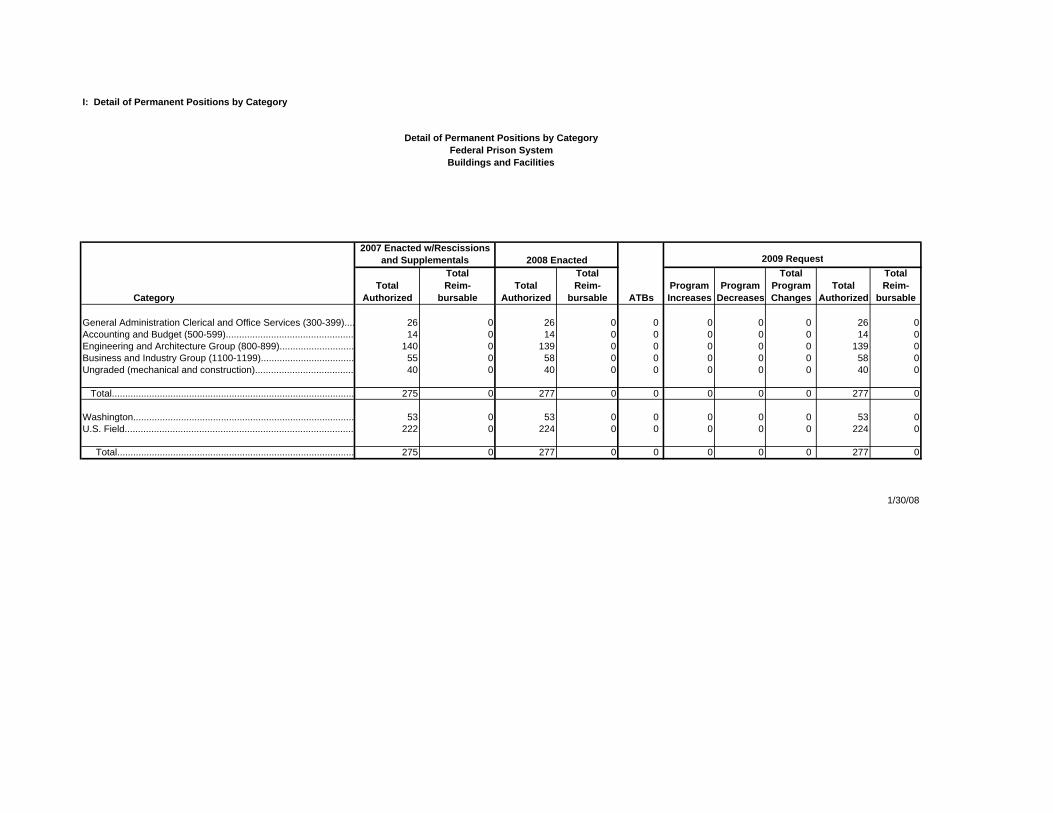
I: Detail of Permanent Positions by Category
Detail of Permanent Positions by CategoryFederal Prison SystemBuildings and Facilities
2007 Enacted w/Rescissionsand Supplementals 2008 Enacted 2009 Request
Total Total Total TotalTotal Reim- Total Reim- Program Program Program Total Reim-
Category Authorized bursable Authorized bursable ATBs Increases Decreases Changes Authorized bursable
General Administration Clerical and Office Services (300-399).... 26 0 26 0 0 0 0 0 26 0 Accounting and Budget (500-599)................................................ 14 0 14 0 0 0 0 0 14 0Engineering and Architecture Group (800-899)............................ 140 0 139 0 0 0 0 0 139 0Business and Industry Group (1100-1199)................................... 55 0 58 0 0 0 0 0 58 0Ungraded (mechanical and construction)..................................... 40 0 40 0 0 0 0 0 40 0
Total........................................................................................... 275 0 277 0 0 0 0 0 277 0
Washington................................................................................... 53 0 53 0 0 0 0 0 53 0U.S. Field...................................................................................... 222 0 224 0 0 0 0 0 224 0
Total......................................................................................... 275 0 277 0 0 0 0 0 277 0
1/30/08
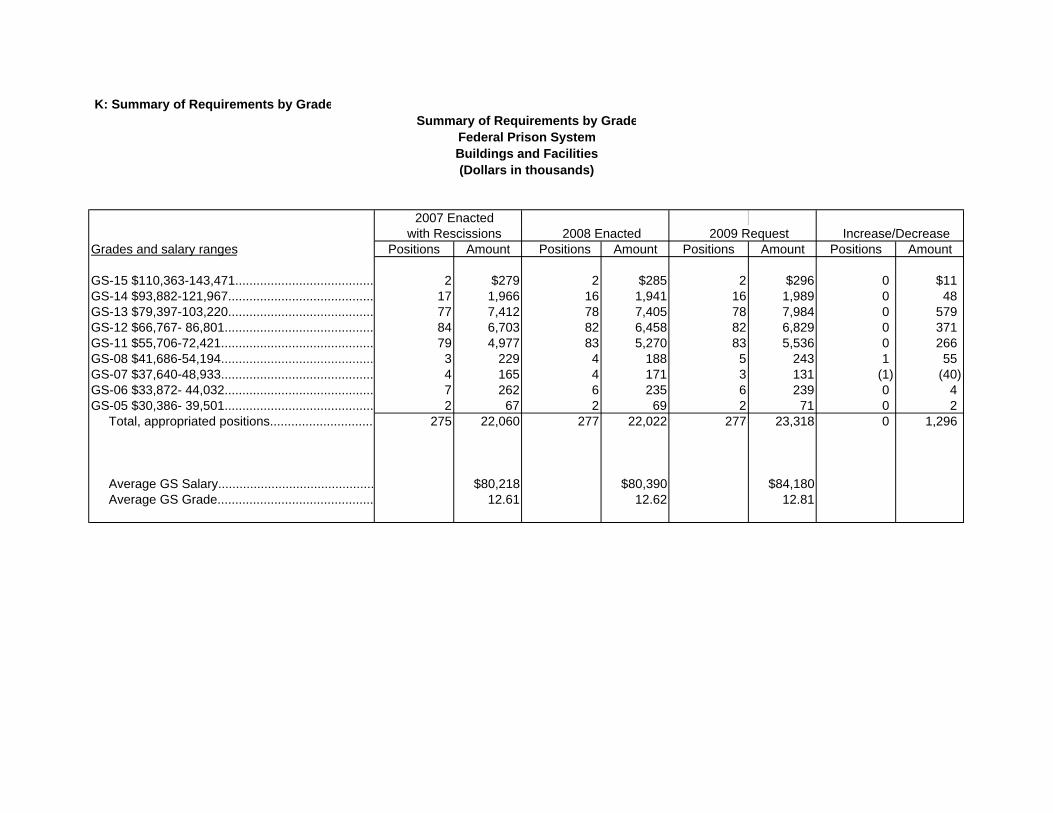
K: Summary of Requirements by GradeSummary of Requirements by Grade
Federal Prison SystemBuildings and Facilities(Dollars in thousands)
2007 Enactedwith Rescissions 2008 Enacted 2009 Request Increase/Decrease
Grades and salary ranges Positions Amount Positions Amount Positions Amount Positions Amount
GS-15 $110,363-143,471....................................... 2 $279 2 $285 2 $296 0 $11GS-14 $93,882-121,967......................................... 17 1,966 16 1,941 16 1,989 0 48GS-13 $79,397-103,220......................................... 77 7,412 78 7,405 78 7,984 0 579GS-12 $66,767- 86,801.......................................... 84 6,703 82 6,458 82 6,829 0 371GS-11 $55,706-72,421........................................... 79 4,977 83 5,270 83 5,536 0 266GS-08 $41,686-54,194........................................... 3 229 4 188 5 243 1 55GS-07 $37,640-48,933........................................... 4 165 4 171 3 131 (1) (40)GS-06 $33,872- 44,032.......................................... 7 262 6 235 6 239 0 4GS-05 $30,386- 39,501.......................................... 2 67 2 69 2 71 0 2 Total, appropriated positions............................. 275 22,060 277 22,022 277 23,318 0 1,296
Average GS Salary............................................ $80,218 $80,390 $84,180 Average GS Grade............................................ 12.61 12.62 12.81

L: Summary of Requirements by Object Class
Rescissions and Supps. 2009 Request Increase/DecreaseObject Classes FTE Amount FTE Amount FTE Amount FTE Amount11.1 Direct FTE & personnel compensation 259 $16,706 258 $20,345 261 $21,075 3 $730 11.3 Other than full-time permanent 0 0 0 0 0 0 0 011.5 Total, Other personnel compensation 0 0 0 0 0 0 0 0 Total 259 16,706 258 20,345 261 21,075 3 730
Remimbursable FTE[Full-time permanent]
Other Object Classes:
12.0 Personnel benefits 6,206 6,153 6,334 18121.0 Travel and transportation of persons 804 925 1,350 425 22.0 Transportation of things 301 60 70 7023.2 Rental payments to others 9,080 9,073 9,073 023.3 Comm., util., & other misc. charges 8,873 62 120 58 24.0 Printing and reproduction 0 0 0 0 25.2 Other services 587,918 254,320 139,754 (114,566)26.0 Supplies and materials 14,949 9,800 8,800 (1,000)31.0 Equipment 6,656 4,839 4,339 (500)32.0 Land 5,168 2,200 2,500 30042.0 Insurance claims and indemnities 0 0 0 0 Total Obligations 656,661 307,777 193,415 (114,302)
Unobligated balance, start-of-year (363,406) (139,170) (204,113)Unobligated balance, end-of-year 139,170 204,113 106,505Recoveries of prior year obligations Total DIRECT Requirements 432,425 372,720 95,807
Summary of Requirements by Object ClassBuildings and Facilities(Dollars in Thousands)
Enacted2007 Enacted with 2008
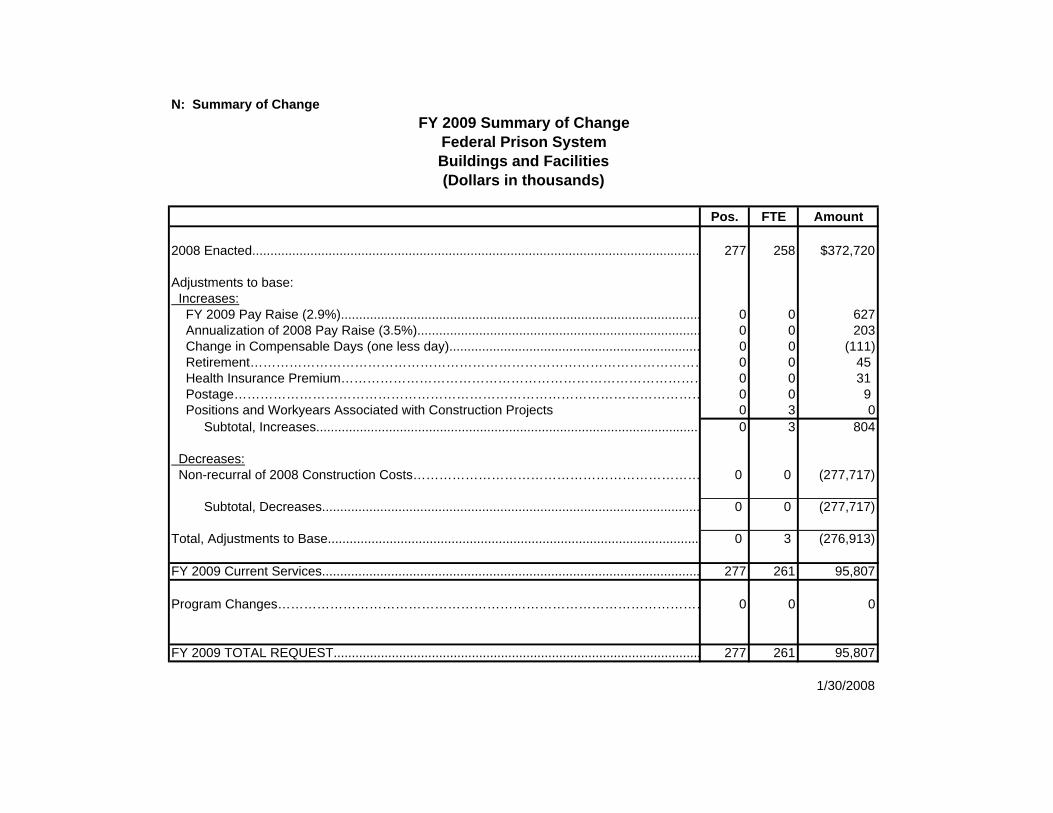
N: Summary of ChangeFY 2009 Summary of Change
Federal Prison SystemBuildings and Facilities(Dollars in thousands)
Pos. FTE Amount
2008 Enacted........................................................................................................................... 277 258 $372,720
Adjustments to base: Increases: FY 2009 Pay Raise (2.9%)................................................................................................... 0 0 627 Annualization of 2008 Pay Raise (3.5%).............................................................................. 0 0 203 Change in Compensable Days (one less day)..................................................................... 0 0 (111) Retirement…………………………………………………………………………………………… 0 0 45 Health Insurance Premium………………………………………………………………………… 0 0 31 Postage……………………………………………………………………………………………… 0 0 9 Positions and Workyears Associated with Construction Projects 0 3 0 Subtotal, Increases.......................................................................................................... 0 3 804
Decreases: Non-recurral of 2008 Construction Costs………………………………………………………… 0 0 (277,717)
Subtotal, Decreases........................................................................................................ 0 0 (277,717)
Total, Adjustments to Base...................................................................................................... 0 3 (276,913)
FY 2009 Current Services........................................................................................................ 277 261 95,807
Program Changes……………………………………………………………………………………… 0 0 0
FY 2009 TOTAL REQUEST..................................................................................................... 277 261 95,807
1/30/2008
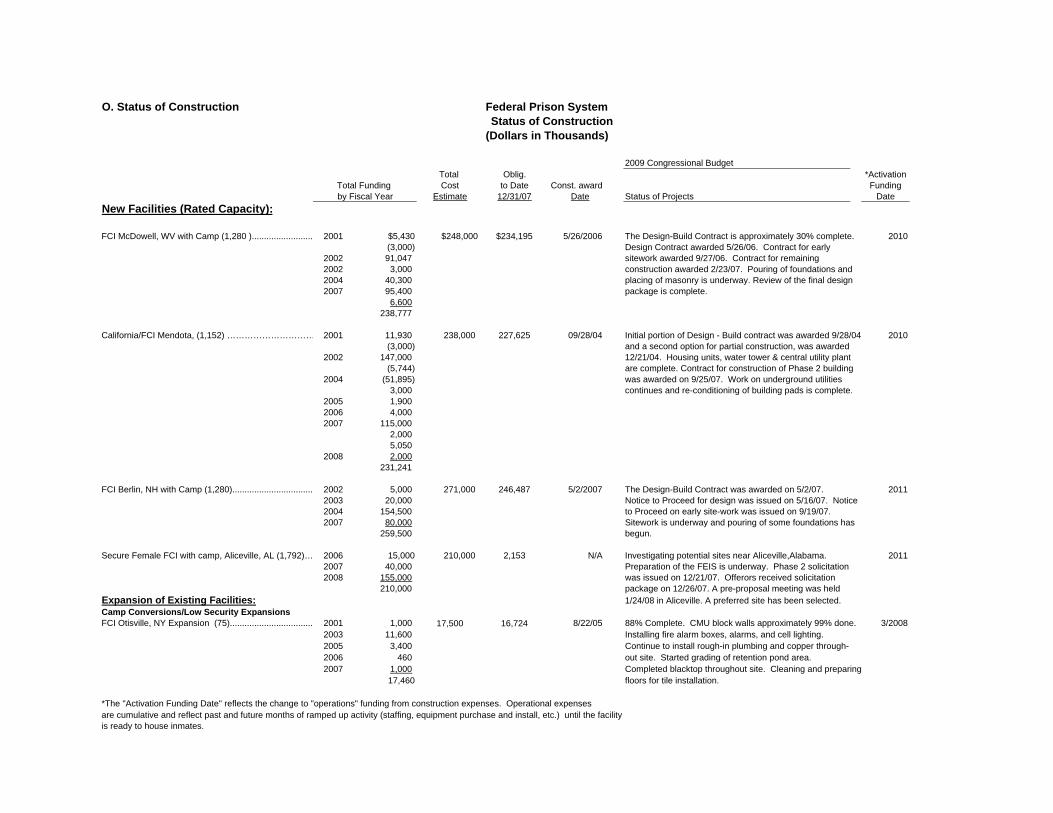
O. Status of Construction Federal Prison System
2009 Congressional BudgetTotal Oblig. *Activation
Total Funding Cost to Date Const. award Fundingby Fiscal Year Estimate 12/31/07 Date Status of Projects Date
New Facilities (Rated Capacity):
FCI McDowell, WV with Camp (1,280 )......................... 2001 $5,430 $248,000 $234,195 5/26/2006 The Design-Build Contract is approximately 30% complete. 2010(3,000) Design Contract awarded 5/26/06. Contract for early
2002 91,047 sitework awarded 9/27/06. Contract for remaining 2002 3,000 construction awarded 2/23/07. Pouring of foundations and2004 40,300 placing of masonry is underway. Review of the final design2007 95,400 package is complete.
6,600238,777
California/FCI Mendota, (1,152) ………………………… 2001 11,930 238,000 227,625 09/28/04 Initial portion of Design - Build contract was awarded 9/28/04 2010(3,000) and a second option for partial construction, was awarded
2002 147,000 12/21/04. Housing units, water tower & central utility plant (5,744) are complete. Contract for construction of Phase 2 building
2004 (51,895) was awarded on 9/25/07. Work on underground utilities3,000 continues and re-conditioning of building pads is complete.
2005 1,9002006 4,0002007 115,000
2,0005,050
2008 2,000231,241
FCI Berlin, NH with Camp (1,280)................................. 2002 5,000 271,000 246,487 5/2/2007 The Design-Build Contract was awarded on 5/2/07. 20112003 20,000 Notice to Proceed for design was issued on 5/16/07. Notice 2004 154,500 to Proceed on early site-work was issued on 9/19/07.2007 80,000 Sitework is underway and pouring of some foundations has
259,500 begun.
Secure Female FCI with camp, Aliceville, AL (1,792)… 2006 15,000 210,000 2,153 N/A Investigating potential sites near Aliceville,Alabama. 20112007 40,000 Preparation of the FEIS is underway. Phase 2 solicitation2008 155,000 was issued on 12/21/07. Offerors received solicitation
210,000 package on 12/26/07. A pre-proposal meeting was heldExpansion of Existing Facilities: 1/24/08 in Aliceville. A preferred site has been selected.Camp Conversions/Low Security ExpansionsFCI Otisville, NY Expansion (75).................................. 2001 1,000 17,500 16,724 8/22/05 88% Complete. CMU block walls approximately 99% done. 3/2008
2003 11,600 Installing fire alarm boxes, alarms, and cell lighting.2005 3,400 Continue to install rough-in plumbing and copper through-2006 460 out site. Started grading of retention pond area.2007 1,000 Completed blacktop throughout site. Cleaning and preparing
17,460 floors for tile installation.
*The "Activation Funding Date" reflects the change to "operations" funding from construction expenses. Operational expensesare cumulative and reflect past and future months of ramped up activity (staffing, equipment purchase and install, etc.) until the facilityis ready to house inmates.
Status of Construction(Dollars in Thousands)

Federal Prison System
2009 Congressional BudgetPreliminary ** Oblig. *Activation
Total Funding Cost to Date Const. award FundingNew Facilities (Rated Capacity): by Fiscal Year Estimate 12/31/07 Date Status of Projects Date
USP Yazoo City, MS with Camp (1,216)………………… 2006 $3,000 $260,000 ** $154 N/A The FY 2006 Report language included site/planning funds 20132007 12,500 to for this facility. Investigating potential site on existing BOP2008 60,750 281,000 property at Yazoo City. Procurement for Environmental
76,250 Assessment continues.
FCI Hazelton, WV with Camp (1,280)............................ 2001 5,000 265,000 ** 414 N/A The environmental services contract for the Environmental 2013(3,000) to Assessment preparation was awarded 7/6/07. The EA
2004 3,000 286,000 preparation is underway.2005 (2,500)2008 60,755
63,255
FCI Bennettsville II,SC with Camp (1,408).................... 2002 5,000 222,000 ** 0 N/A Considering potential sites. 20132004 (2,000) to2005 (2,500) 239,000
500
FCI Midwestern/Leavenworth, KS with Camp (1,408)... 2001 5,431 276,000 ** 0 N/A Considering potential sites. 2013(3,000) to
2004 (1,000) 298,0001,431
USP South Central/Forrest City, AR with Camp (1,216) 2001 5,000 316,000 ** 21 N/A The environmental services contract for the Environmental 2014(3,000) to Assessment preparation was awarded 7/10/07. The EA2,000 341,000 preparation is underway.
FCI Western with Camp (1,408)………………………… 2001 6,000 318,000 ** 3,429 N/A Considering potential sites. 2014(3,000) to
2004 (1,000) 343,0002005 2,000
4,000
Secure Female Unit, North Central Region (512)……… 2002 5,000 126,000 ** 21 N/A Considering potential sites. 20142004 (2,000) to2005 (2,500) 136,000
500
* The "Activation Funding Date" reflects the change to "operations" funding from construction expenses. Operational expenses are cumulative and reflect past and future months of ramped up activity (staffing, equipment purchase and install, etc.) until the facilityis ready to house inmates.
**Preliminary cost estimates are updated based on the following factors: When full construction funds are anticipated to become available;Geographic location; Historical and anticipated cost escalation; and Allowances for uncertainity as to actual sites to be developed. 1/30/2008
Status of Construction(Dollars in Thousands)

Federal Prison System
2009 Congressional BudgetPreliminary ** Oblig. *Activation
Total Funding Cost to Date Const. award Fundingby Fiscal Year Estimate 12/31/07 Date Status of Projects Date
New Facilities (Rated Capacity):
FCI Letcher County, KY (1,408)………………………. 2006 $5,000 $320,000 ** $7 N/A Procurement planning for preliminary site reconnaissance 2015to environmental services continues.
345,000
Secure Female FCI with camp, Florida (1,256)….. 2002 5,000 239,000 ** 0 N/A Considering potential sites. 2015(2,500) to
2008 (2,000) 264,000500
* The "Activation Funding Date" reflects the change to "operations" funding from construction expenses. Operational expenses are cumulative and reflect past and future months of ramped up activity (staffing, equipment purchase and install, etc.) until the facilityis ready to house inmates.
**Preliminary cost estimates are updated based on the following factors: When full construction funds are anticipated to become available;Geographic location; Historical and anticipated cost escalation; and Allowances for uncertainity as to actual sites to be developed.
01/30/08
Status of Construction(Dollars in Thousands)

P. WaterfallANTICIPATED CAPACITY BY FISCAL YEAR
2008 2009 2010 2011 2012 2013 2014 2015 TOTALFacility
FCI Otisville, NY Expansion ………........................... 75
FCI McDowell, WV, (Minimum & Medium)…………… 1,280FCI Mendota, CA (Medium)……………..................... 1,152
FCI Berlin, NH (Min. & Medium)…..…….................... 1,280Secure Female FCI with camp, Aliceville, AL …………… 1,792
USP Yazoo City, MS (Minimum & High)………………. 1,216FCI Hazelton, WV (Minimum & Medium)……………… 1,280FCI Bennettsville II, SC (Minimum & Medium) .…...… 1,408FCI Midwestern/Leavenworth, KS (Minimum & Medium)…….. 1,408
USP South Central/Forrest City, AR (Min. & High)..... 1,216FCI Western (Minimum & Medium)…………………… 1,408Secure Female Unit,North Central Region...………… 512
FCI Letcher County, KY (Minimum & Medium)..……. 1,408Secure Female FCI with camp, FL...…..….………… 1,256
--------- --------- --------- ----------- ----------- ----------- …………… ……………. -----------TOTAL CAPACITY 75 0 2,432 3,072 0 5,312 3,136 2,664 16,691