built environment journal built environment journal
TRANSCRIPT

Built Environment Journal
Built Environment
Journal Faculty of Architecture, Planning and Surveying Volume 12 No. 2 July 2015 ISSN 1675-5022
Developing Criteria and Variables for Evaluating the Effects of Vegetation on Single-Family Houses Alamah Misni Arising Issues in the Execution of Built Heritage Conservation Projects in Ireland: Reflection from Case Studies Firzan, M Keumala, Nila Zawawi, Rodiah Ahmad, A.G The Importance of Healthy and Sustainable Built Environments for Vulnerable Groups of Population Bhzad Sidawi Mohamed Taha Al-Hariri Implementing the Last PlannerTM System in a Road Construction Project in Nigeria Ograbe Ahiakwo David Oloke Subashini Suresh Jamal Khatib
Impact of Procurement Methods and Project Types on Construction Projects Performance Jimoh Richard Oyewobi Luqman Aliu Nurayn

Built Environment Journal
BUILT ENVIRONMENT JOURNAL (BEJ)
Chief Editor Professor Dr Abdul Hadi Hj Nawawi, Universiti Teknologi MARA, Malaysia
Managing Editor Assoc. Prof. Datin Dr Hamimah Adnan, Universiti Teknologi MARA, Malaysia
Editorial Advisory and Review Board
Professor Dr Yusoff Abbas, Universiti
Teknologi MARA, Malaysia Professor Dr Zainal Mat Saat, Universiti
Teknologi MARA, Malaysia Assoc. Prof. Dr Norhati Ibrahim, Universiti
Teknologi MARA, Malaysia Professor Dr Dasimah Omar, Universiti
Teknologi MARA, Malaysia Professor Albert PC Chan, The Hong Kong
Polytechnic University
Professor Dr Ismail Rahmat, Universiti
Teknologi MARA, Malaysia
Assoc. Prof. Dr Jamalunlaili Abdullah,
Universiti Teknologi MARA, Malaysia Assoc. Prof. Dr Faridah Mohd Yusof,
Universiti Teknologi MARA, Malaysia Professor Dr Ir Siti Hawa Hamzah,
Universiti Teknologi MARA, Malaysia Professor Dr George Ofori, National
University of Singapore, Singapore Professor Dr Charles Egbu, Salford
University, United Kingdom Assoc. Prof. Dr Faisal Arain, Northen
Alberta Institute of Technology (NAIT) Professor Ir. Dr. Zuhairi Abdul Hamid,
CREAM Professor Low Sui Pheng, National University
of Singapore
Dr Paul Chynoweth, Salford University,
United Kingdom Dr Asrul Nasid Masrom, Universiti Tun
Hussein Onn, Malaysia Professor Dr Azmi Ibrahim, Universiti
Teknologi MARA, Malaysia Dr Zaharah Yahya, Universiti Teknologi
MARA Professor Christopher Andrew Gorse , Leeds
Sustainability Institute Dr Angela Guggemos, Colorado State
University
Sr. Dr. Siti Aekbal Saleh, Universiti
Teknologi MARA, Malaysia Muhammad Redza Rosman, Universiti
Teknologi MARA, Malaysia
Copyright © August 2015 by Faculty of Architecture, Planning and Surveying, Universiti Teknologi
MARA, 40450 Shah Alam, Selangor, Malaysia.
All rights reserved. No part of this publication may be reproduced, stored in a retrieval system, or
transmitted in any form or any means, electronic, mechanical, photocopying, recording or otherwise,
without prior permission, in writing, from the publisher.
Built Environment Journal is jointly published by Faculty of Architecture, Planning and Surveying
and UiTM Press, Universiti Teknologi MARA, 40450 Shah Alam, Selangor, Malaysia.
The views and opinion expressed therein and those of the individual authors and the publication of
these statements in the Built Environment Journal do not imply endorsement by the publisher or the
editorial staff. Copyright vested in Universiti Teknologi MARA. Written permission is required to
reproduce any part of this publication.

Built Environment
Journal Faculty of Architecture, Planning and Surveying Volume 12 No. 2 July 2015 ISSN 1675-5022
1. Developing Criteria and Variables for Evaluating the Effects of Vegetation on Single-Family Houses Alamah Misni
2. Arising Issues in the Execution of Built Heritage
Conservation Projects in Ireland: Reflection from Case Studies Firzan, M Keumala, Nila Zawawi, Rodiah Ahmad, A.G
3. The Importance of Healthy and Sustainable Built Environments
for Vulnerable Groups Of Population Bhzad Sidawi Mohamed Taha Al-Hariri
4. Implementing the Last Plannertm System in a Road
Construction Project in Nigeria Ograbe Ahiakwo David Oloke Subashini Suresh Jamal Khatib
5. Impact of Procurement Methods and Project Types on
Construction Projects Performance Jimoh Richard Oyewobi Luqman Aliu Nurayn

Built Environment Journal Vol. 12, No.2, 1-11, 2015
DEVELOPING CRITERIA AND VARIABLES FOR EVALUATING THE EFFECTS OF VEGETATION ON SINGLE-
FAMILY HOUSES
Alamah Misni
Faculty of Architecture, Planning and Surveying, Universiti Teknologi MARA,
Shah Alam, MALAYSIA
ABSTRACT
This paper describes the methodology used to measure the effects of surrounding
vegetation, building construction and human factors on a small number of individual houses
and a large number of single-family houses. The primary data were obtained from fieldwork
and site measurements during a two-stage process. All supporting data for this study was
sourced from various Malaysian government departments. Fieldwork in the first stage
focused on five individual single-family houses. Quantitative measurements were taken to
record the construction of the buildings, their surrounding vegetation, human factors, and
weather data during the daytime. In this report only five houses of different ages and types of
landscaping were chosen to compare the effect of landscaping on the thermal performance of
the house. These five houses had used different styles and designs of tropical landscaping,
which could produce different conditions of micro-climates. The air temperature, relative
humidity and wind speed data were obtained from the exterior and interior of houses during
similar weather conditions to ensure they could be accurately compared. This data was
automatically recorded at half hour intervals by static and mobile sensors of the data
loggers. The albedo data for every type of building were also measured during the day time.
In the second stage, the fieldwork measurements were divided into four categories: building
construction, landscaping, human factors, and weather data. The annual energy consumption
for every house was also evaluated by analysing electricity consumption for different single-
family houses ranging in age from 3 to 40 years. The target number of respondents was 50
houses. Statistical calculation and analysis was used to measure and evaluate the energy
saving.
Keywords: Building construction, human factors, single-family houses, vegetation
INTRODUCTION
This study describes the methodology used to measure the effects of surrounding vegetation,
building construction and human factors on a small number of individual houses and a large number of
single-family houses. The primary data were obtained from fieldwork and site measurements during a
two-stage process. All supporting data for this study was sourced from various Malaysian government
departments. Fieldwork in the first stage focused on 10 individual single-family houses. Quantitative
measurements were taken to record the construction of the buildings, their surrounding vegetation,
human factors, and weather data during the daytime. In this report only five houses of different ages
and types of landscaping were chosen to compare the effect of landscaping on the thermal
performance of the house. These five houses had used different styles and designs of tropical
landscaping, which could produce different conditions of micro-climates.

Developing Criteria and Variables for Evaluating the Effects of Vegetation on Single-Family Houses
The air temperature, relative humidity and wind speed data were obtained from the exterior and
interior of houses during similar weather conditions to ensure they could be accurately compared. This
data was automatically recorded at half hour intervals by static and mobile sensors of the data loggers.
The albedo data for every type of building were also measured during the day time. In the second
stage, the fieldwork measurements were divided into four categories: building construction,
landscaping, human factors, and weather data. The annual energy consumption for every house was
also evaluated by analysing electricity consumption for different single-family houses ranging in age
from 3 to 40 years. The target number of respondents was 50 houses. Statistical calculation and
analysis was used to measure and evaluate the energy saving.
LITERATURE REVIEW
The research methodology was divided into the two fieldwork stages using a process called
triangulation. This is where more than one research method or type of data is used to answer the
research questions (Evans & Gruba, 2002). In this study, two stages of methodology were used to
answer two research questions. According to Yin (2003), at least three principles for collecting data
must be used from the six possible sources of documented evidence. The three main sources chosen
for collecting data in this study were interviewed, direct observation, and physical artefacts evidence.
To measure the effect of surrounding landscaping on the thermal performance of a house, site
measurements were made of the physical features that surrounded the building, and equipment was
used to record weather data inside and outside of the houses (Wong & Yu, 2005). The outdoor weather
data included temperature, relative humidity and wind speeds while the indoor data focused on
temperature and relative humidity (Koch-Nielsen, 2002). Finally, in assessing the influence of
landscaping on reducing the amount of energy used for air-conditioning was to calculate the average
proportion of electricity used for cooling (Akbari, 2002). Data on landscaping, building construction
and energy use of air-conditioning systems, and the number of occupants in each house was obtained
through observation and interviews with the homeowners.
METHODOLOGY
Study location
Figure 1: Putrajaya and Shah Alam located at approximately 101ºE and 3ºN
Source: (Malaysia, 1993)
Putrajaya and
Shah Alam

Built Environment Journal Vol. 12, No.2, 1-11, 2015
The single-family houses sampled, were randomly chosen from two well planned Malaysian cities:
Putrajaya and Shah Alam (Samad, Zain, Maarof, Hashim, & Adnan, 2011). The city of Putrajaya is
situated at latitude 2°N and longitude 101°E, at an elevation of between 75 and 94m, 25km south of
Kuala Lumpur. While Shah Alam is located at latitude 3°N and longitude101°E, at an elevation of
between 24 and 48m, about 25km west of Kuala Lumpur. The distance between Putrajaya and Shah
Alam is approximately 23.7km. Five locations of low-density housing development were selected to
be the case study areas. The specific locations used were in Precinct 14, in the Federal Territory of
Putrajaya, and Sections 3, 6, 9 and 11 in Shah Alam, Selangor. Putrajaya is a well planned city, and is
known as an “intelligent city” because of its extensive information and communication technologies
(Malek, 2011). It was also planned as a garden city, with 38% of the city reserved for green space
areas that emphasise and enhance the natural landscape. Shah Alam is the capital of Selangor State,
and is also one of the most well planned cities in Malaysia (Aziz & Hadi, 2007). It has around 10% of
its area dedicated to green space areas.
The Study House
In Putrajaya and Shah Alam, the most common type of house is the two-storey single-family house
that is surrounded by a garden. Generally, these types of house represent around 10 to 30% of all
houses in a housing development.
Figure 2: Examples of modern tropical houses in the study areas ranging in age from 3 to 40
years with surrounding landscaping Source: (Misni, 2010)
In this study the houses looked at were medium sized, single-family houses (around 300–
600m2). The garden area includes the entire space around the building and is private to the owner. This

Developing Criteria and Variables for Evaluating the Effects of Vegetation on Single-Family Houses
research was undertaken looking at single-family houses ranging in age from 3 to 40 years. The
different ages were chosen because they provided differences in the maturity of the surrounding
landscape, which affects the amount of energy used and thermal comfort and performance of the
house.
Weather Data
In the first stage of fieldwork, which included site measurements for 10 individual houses, weather
data from the Malaysian Meteorology Department was gained for the same days as when the climate
data was recorded in the houses. This weather data was required to compare it with the study location.
The dates this data was gathered were the 16th and 17
th of January, 2010 in Putrajaya, and the 23
rd, 24
th
and 28th of February, 2010 for the Shah Alam study areas. The data included air temperature, relative
humidity, rainfall, daily global radiation, cloud cover and wind. In the second stage of fieldwork,
which included site measurements of 50 houses, weather data was obtained from the Malaysian
Meteorology Department in 2008 and 2009. Weather data were recorded at two stations: Sepang
Weather Station for the Putrajaya study area and Subang Weather Station for Shah Alam. Averages of
this data were used to determine the exact tropical weather conditions in the study areas.
Local Authority Records
Putrajaya Cooperation and Shah Alam City Council were the two local authorities involved in this
study. They provided the master plans, construction details and landscaping information for the
sample houses. In the Putrajaya study area, the whole housing development was designed and
constructed by a developer. The sizes of the houses are slightly different, but are similar in design and
are typical of tropical architecture. In Shah Alam, every homeowner is free to build their own house.
Developers only provide the infrastructure and land for sale. Detailed plans for houses in Shah Alam
are done privately. In this study, the architects, landscape architects and planners who managed the
areas of study were interviewed to gather information about the general construction, basic building
design, landscaping, and the exact date and age of construction for every development. This primary
data was validated with on-site interviews, data collection, and observation of each of the sample
houses.
Electricity Uses Data
Domestic electricity tariff information was obtained from the Malaysian Electric Utility Company
(National Energy Limited–TNB). Data for the monthly amount of electricity used by the 50 residential
houses was collected as the cost of electricity in Malaysian Ringgit (MYR). These costs were
converted into energy used in kWh based on current local tariff. Annual domestic electricity use in the
city of Shah Alam was analysed to validate the amount of energy used in relation to the increase in air
temperature and humidity levels in the two main seasons: rainy and dry. The increase in cooling
energy use was closely related to air temperature changes in the hot-humid tropical environment.
Satellite Images
Satellite images for the study areas were obtained from Remote Sensing Data Services, Malaysian
Remote Sensing Agency, Kuala Lumpur. These satellite images were formatted in high resolution,
‘Quickbird’ data series (0.6m resolution), and were taken in 2007. The images show the natural
condition of the housing estates and their surrounding landscapes. Vegetation information was
observed by the author during the fieldwork stages, and was compared with the digital satellite
images. The satellite images came from geographic information system (Archview@GIS). This data
was compared with the master plans from each house’s local authority to confirm their location,

Built Environment Journal Vol. 12, No.2, 1-11, 2015
orientation and surrounding landscape; and to record the overall condition of the houses and
landscaping in each location.
The Variables
Building Orientation
The configuration of the house should be designed to ensure the comfort of its occupants and for
energy efficiency. In a hot-humid tropical climate, proper house orientation in relation to the sun and
its devices will enable energy savings and more comfortable conditions. In this study four main
categories of wall orientation/direction are North, East, South and West and also the in between of the
main directions include the Northeast, Southeast, Southeast and Northwest.
Building Envelopes
Building envelopes include the walls, roof, glazing and floor foundation. Walls are the major part
of the building envelope and in these houses faced in all directions, while the roof is the top covering
and is exposed to the direct solar radiation throughout the day. In the tropics, heat gain through glass
windows and doors is often the major source of solar heat gain. Hence, if such glazing located facing
the direct solar radiation orientation, it should be minimized and shading maximized. Hence, not only
were the materials of the building noted, but the direction of the glazing was also assessed. The
measurements taken in the study areas were the areas of building envelopes include walls, roof,
glazing and floors.
Surrounding Vegetation
Strategically placed shade trees around the building can potentially modify micro-climate and
building energy use through shading. This shading can minimize the amount of radiant heat absorbed
and stored by buildings and other built surfaces. Shading in outdoor areas will be provided by all types
of vegetation to the building envelopes and surrounding garden earth surfaces. The plants shading
areas and their angles were recorded during morning, afternoon, and the peak time of the day. The
measurement of evaporation and transpiration in the study areas refers to the amount of water vapor in
the atmosphere. The evapotranspiration is gained as a result of evaporation from exposed water
surfaces, moist ground and plant transpiration. The measurements in the study areas were relative
humidity or absolute humidity reading. In a hot-humid tropical climate, wind is generally of moderate
speeds and is not steady all the time. Strategic outdoor designs to promote wind are required. The
strategic location of vegetation can capture and directing the flow of air and provide effective
ventilation and convective cooling of surrounding gardens and building surfaces. The measurements
taken in the study areas were wind speeds.
Human Factors
Human factors in this study are the number of occupants who need cooling and their daily living
habits of using air-conditioning system. The cooling energy use will be calculated based on the
horsepower of the air-conditioning system, temperature setting and the duration of daily use.
RESULTS AND DISCUSSIONS
Stage 1
In this first stage, the measurements focused on individual houses. Research methods have been
divided into three parts: selection of houses with suitable surrounding landscape; observation of

Developing Criteria and Variables for Evaluating the Effects of Vegetation on Single-Family Houses
building construction and landscape design; and field measurements of building construction,
landscaping and day time weather data.
Case study one involved looking at the construction and surrounding landscape of three single-
family houses aged 5, 10 and 30 years old in Shah Alam, Selangor, Malaysia. While their construction
was similar, the design and size of each house varied because they were built in different eras of
construction methods, and styles of architecture and landscaping. As mentioned before, the design and
construction of single-family houses in Shah Alam are up to each homeowner to decide on. The 30
year old house was located in Section 6, Shah Alam, and was surrounded with mature tropical
landscaping, while the 10 year old house was located in Section 11, Shah Alam, and was surrounded
by tropical landscaping of intermediate age. The 5 year old house was located in Section 9, Shah
Alam, and was surrounded by immature tropical landscaping. The houses were labelled as mature,
ordinary, and new landscaped houses. The three housing estates were close in location, as they were
around 3km apart. The three ages of construction were chosen because they provided different
vegetation maturity and landscaping styles, which would have different effects on the thermal
performance of the houses by shading, evapotranspiration and channeling wind.
In case study two, two similar house constructions and locations were chosen, but the landscape of
each house was totally different. This was to help demonstrate the effects of the surrounding landscape
on a house’s thermal performance. These houses were located in Precinct 14, Putrajaya, Malaysia, and
were labelled as a heavily landscaped house and a sparsely landscaped house. The heavily landscaped
house had strategic landscaping, while the sparsely landscaped house had a minimum of landscaping
in the garden. A heavily landscaped house will usually produce cooler ambient air than a sparsely
landscaped house. This is because large quantities of vegetation located in strategic areas of a property
could lower the ambient air temperature by providing shade, channeling wind and through
evapotranspiration. A well designed tropical house will also reflect heat from solar radiation from the
building envelope, while providing shade for every opening and by being orientated to allow wind to
blow through the building’s interior spaces.
Local weather recording
In case study one, which was conducted in Shah Alam, weather recordings were carried out during
daytime on the 23rd
, 24th, and 28
th of February, 2010. These dates were chosen because they had
similar weather conditions each day, with six to eight hours of sunshine during the day and drizzle at
night. In case study 2, which was conducted in Putrajaya, the weather recordings were carried out
during daytime on the 16th and 17
th of January, 2010. The weather on these two days was similar, with
sunshine for the whole day, and the soft rain starting at 19.30 hours. Cloud is very typical of this
tropical region, measuring approximately 6.9–7 okta. The study measured climatic parameters and the
physical characteristic of the four azimuths of the houses. Each measurement point represents an area
of 90m², and an approximate radius of 3m to 10m around the fixed/mobile weather station. The
measurements were taken at 30-minute intervals in all locations a meter above the ground and in the
shade. The albedo data for every type of building envelope was also measured during the daytime.
Exterior space
The weather measurements taken for both studies were not influenced by shadows or reflected
solar radiation. The basic measuring equipment that was used to do the field measurements included:
Two sets of mobile TSI VelociCalc Plus Meters, model 8386, data loggers and
sensors.
Two sets of portable Model Babuc A code BSA014, multi-data loggers and sensors.
Two sets of Lux meters PCE-172.
Two sets of compasses and measuring tapes.
A set of digital cameras and drawing equipment.

Built Environment Journal Vol. 12, No.2, 1-11, 2015
Interior space
Four sets of Electronic Mini Thermo hygrograph, model Testo 175-T2 were used to measure air
temperature and air humidity data inside the buildings. This equipment was set automatically, and
placed at a metre above the floor near the windows that faced the four azimuths on the ground floor of
the houses. The purpose of these measurements was to compare with outside weather data.
Energy use measurements
This experiment used quantitative measurements to document the energy used for air conditioning,
while considering the influence of surrounding vegetation, including trees, shrubs, vines, groundcover
and lawn. Data about the internal temperature of each house was obtained during days with similar
climate conditions. This was to ensure the data for houses with different designs and landscaping was
comparable. Interviews with home owners and observations revealed that air conditioning units were
used in every room of the houses looked at. The type of air-conditioning units used and their horse
power were recorded, and energy consumption for these units was given by the owner of the house.
The cost for air conditioner use has been determined by National Electricity Limited (TNB). This,
along with an analysis of the reduction of ambient temperature and air conditioning consumption
during the day and on the hottest afternoons, would reveal the potential savings associated with the
corresponding landscape.
Landscape element measurements
The study of all landscape elements was conducted through observation and interviews with the
owner of each house. Landscape elements and house plans were drawn in detail and to scale.
Landscape elements included soft landscape and hard landscape. The location of every type of
vegetation was recorded at five meter intervals extending out from the building from each of four
azimuths, as shown in Figure 3. Tree azimuth classes were defined with reference to building wall
orientation. According to Simpson (2002), a wall is cardinally oriented if the normal distance to the
wall is within ±45°E of a cardinal direction (North, East, South or West), otherwise, it is inter-cardinal
(NE, SE, SW or NW). A detailed landscape plan was recorded for every type of vegetation because
shading, evapotranspiration and wind flow are all affected by different types of landscaping.
House
Large tree
Small tree
Medium tree
GABLE END
Front
5m 5m 5m
Figure 3: House configuration and the five metre intervals of vegetation measurements and
other landscape elements around the house Source: (Simpson, 2002)

Developing Criteria and Variables for Evaluating the Effects of Vegetation on Single-Family Houses
Data Analysis
Once all of the data were collected, master spreadsheets were developed using Microsoft Excel
12.0 and Origin 8.0. All vegetation data gathered from the four azimuths of each house and was
recorded numerically in this spreadsheet as percentages or figures. This data was analysed based on a
few variables, including vegetation structure and typology or biomass, which was representative of the
real conditions of vegetation on the site. The actual amount and biomass of every type of vegetation
could appear as an average or mean to represent the surrounding landscape and design for every
sample house. The types of equipment used for cooling, and resident’s living habits were given
different codes and numerical values in the spreadsheets to convert the actual values to energy
consumption. Energy consumption for cooling was represented as a total value for the study period of
kWh in Malaysian Ringgit (MYR). All drawings used as supporting documents were generated by
Autodesk Revit Architecture 2011 and AutoCAD 2011.
All exterior and interior weather data gathered using devices such as the Babuc A, mobile TSI
VelociCalc data loggers, and the Mini Thermo hygrograph were transferred and formatted for
Microsoft Excel 12.0. The daily to yearly weather data obtained from the Malaysian Meteorology
Department and monthly electricity costs data from National Energy Limited (TNB) were also put into
this format. The best weather data from five individual houses was chosen for case studies 1 and 2,
and the results of these studies were presented in various types of tables and figures using Microsoft
Excel 12.0 and Origin 8.0 software.
Stage 2
Survey data were divided into two categories: data was collected by interviewing the owners of the
houses, and from measurements and observation of the properties.
Homeowner interviews
Homeowner interviews were conducted to find information on human factors such as the amount of
occupants, and lifestyle habits, including the time and numbers of air-conditioning units used every
day. This provided information on the exact amount of cooling energy used in the house on a daily and
monthly basis. These took approximately 10 to 15 minutes to complete, and asked three main
questions. The first question asked about the number of residents in the house. The second question
focused on a set number of electricity bills during the two main seasons in the tropics to evaluate the
monthly and annual energy consumption for every house. Details about the type of air-conditioning
systems used were also gathered, including each system’s capacity, the total time it is used, the times it
is turned on during the day and night, and the average temperature setting of the system. From this
data the total amount of cooling energy used was calculated. Approximately 50 data collection sheets
were filled in, and interviews completed from throughout the metropolitan Shah Alam and Putrajaya
areas from January through March of 2010. Overall, only one-fifth of the number of householders
approached cooperated and answered the interviews.
Data collection
To obtain accurate data about each house in the study, the fieldwork information was collected
through observation and by taking measurements. The aim of the fieldwork was to collect all the
possible data about the physical characteristics of the house, including the structure and construction
method, and the surrounding landscape. These were filled out after consent was gained from the
participants. Primary data from homeowners through interviews, along with direct observations of
each house’s environment were essential. The main goal was to observe the physical characteristics of
the properties, including building construction and the surrounding landscape, and the lifestyle habits
Built Environment Journal Vol. 12, No.2, 1-11, 2015
of the occupants that could not be obtained without going to each property and contacting them
directly.
Building structure and construction
The first data collected was general information about the building structure and construction of
each house in the study. This data can be validated against construction records from local authorities,
but the on-site data collected is the most up to date information about the houses, as some houses in
the sample have had extensions built, such as enlarged car porches and additional kitchen spaces. The
year of construction and house sizes were the main data variables used to classify the houses to ensure
there was a range of ages and that they were medium sized. Information about the main structure and
materials used was gathered to ensure the houses had similar construction and materials.
Data on the building envelope of every house was also gathered. This included information on
windows and doors, wall and roof area and colour, and insulation. This information is significant
because the building envelope influences the amount of heat absorbed by a house, which indirectly
influences the cooling system. Data collected about windows, sliding doors and common external
doors included actual size, materials and locations. For wall and roof areas, the biggest building
envelope surfaces of every building, the areas were calculated in square meters. Their colour was also
noted, because colour provides different abilities to reflect sunlight, as well as an albedo value for
every house sample. Every house in the study areas used a layer of aluminium foil as an insulation
layer for roofing. Ceiling type and the material used were also noted, as these provide another
insulation layer for the roof. Data about the type of ceiling was collected for every room in each house;
include heights, ceiling types, materials, and colours.
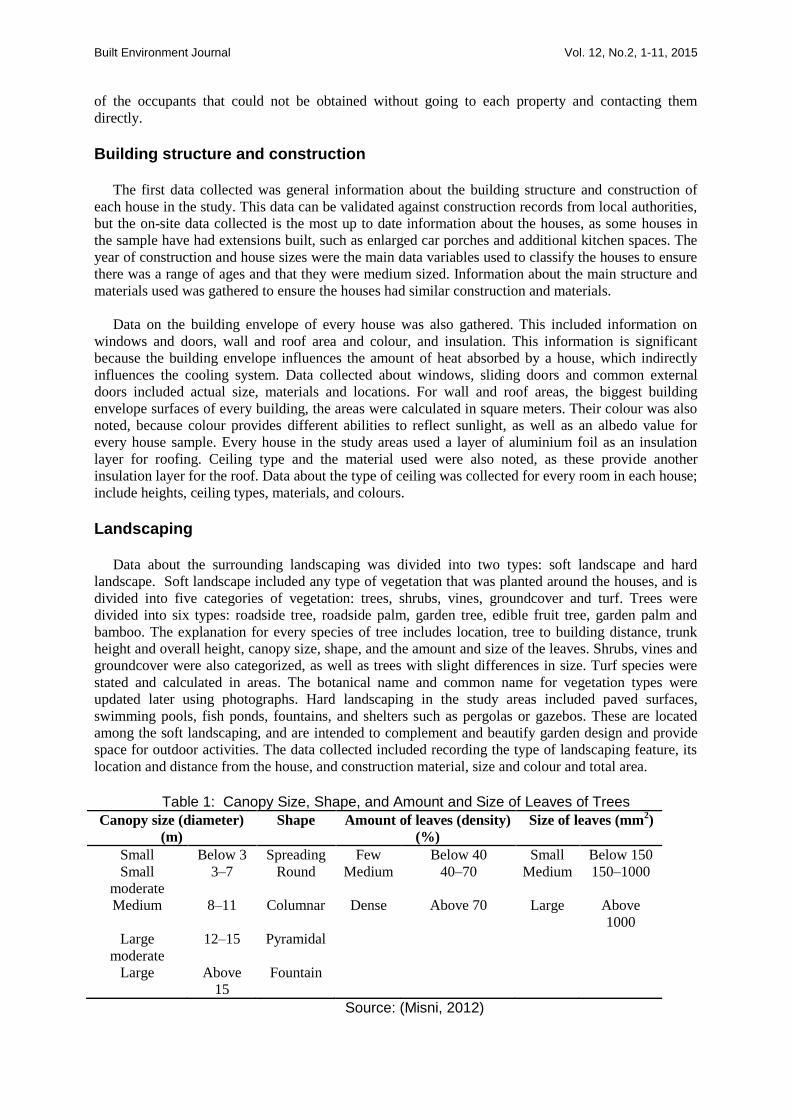
Landscaping
Data about the surrounding landscaping was divided into two types: soft landscape and hard
landscape. Soft landscape included any type of vegetation that was planted around the houses, and is
divided into five categories of vegetation: trees, shrubs, vines, groundcover and turf. Trees were
divided into six types: roadside tree, roadside palm, garden tree, edible fruit tree, garden palm and
bamboo. The explanation for every species of tree includes location, tree to building distance, trunk
height and overall height, canopy size, shape, and the amount and size of the leaves. Shrubs, vines and
groundcover were also categorized, as well as trees with slight differences in size. Turf species were
stated and calculated in areas. The botanical name and common name for vegetation types were
updated later using photographs. Hard landscaping in the study areas included paved surfaces,
swimming pools, fish ponds, fountains, and shelters such as pergolas or gazebos. These are located
among the soft landscaping, and are intended to complement and beautify garden design and provide
space for outdoor activities. The data collected included recording the type of landscaping feature, its
location and distance from the house, and construction material, size and colour and total area.
Table 1: Canopy Size, Shape, and Amount and Size of Leaves of Trees
Canopy size (diameter)
(m)
Shape Amount of leaves (density)
(%)
Size of leaves (mm2)
Small Below 3 Spreading Few Below 40 Small Below 150
Small
moderate
3–7 Round Medium 40–70 Medium 150–1000
Medium 8–11 Columnar Dense Above 70 Large Above
1000
Large
moderate
12–15 Pyramidal
Large Above
15
Fountain
Source: (Misni, 2012)

Developing Criteria and Variables for Evaluating the Effects of Vegetation on Single-Family Houses
The final portion of the data collection sheet contained a space to sketch the house plan and
surrounding landscaping elements to provide a detailed reference about their exact location and sizes.
The plan of the house was also based on satellite images, master plans and detail drawings found from
government departments. A scale of 1:200 was used as can be seen in Figure 3. This data collection
took approximately three to four hours to complete per house, depending on the size of the house and
surrounding landscape.
Data Analysis
Quantitative methods were used to evaluate the result of the effect of vegetation, building
construction and human factors on cooling energy used in a hot-humid environment. All of the data
gathered from 50 houses and their surrounding landscapes, from five housing estates in two cities, was
analysed using the Statistical Package for the Social Sciences (SPSS 19.0). Origin 8.0 software was
used to generate figures and tables from SPSS data. The effects of the surrounding landscape, together
with building construction and human factors data, were calculated and evaluated by these statistical
analysis systems. The cooling energy used in an individual single-family house was revealed in
parallel with the neighbourhood trends of energy used for cooling.
CONCLUSIONS
The direct and indirect thermal impact of the vegetation surrounding single-family houses and their
neighbourhoods in tropical climates was investigated using three research methods to collect data:
interview, direct observation, and physical artefacts evidence. The primary data on the effects of
vegetation on the thermal performance of buildings and their micro-climates on site were gathered to
predict the effects of shade, evapotranspiration, and channeling wind on temperature and energy use.
The secondary data was obtained from government agencies. These were used to validate that all of
the primary data was accurate. In the first stage of fieldwork and measurements, the physical condition
of five houses and their surrounding landscaping and weather data was recorded. The outdoor and
indoor weather data were recorded for approximately 12 hours during the daytime in each of the four
azimuths of the houses at 30 minute intervals using scientific equipment. In the second stage, 50
homeowners were interviewed to gain information about the human factors aspect of this study. On-
site observations, data collection and information about building construction and the surrounding
landscaping of each house were made manually and recorded by photographs. Statistical analysis was
used to quantify and analyse the cooling-energy savings potential. This was based on the comparison
between the surrounding landscaping, building construction and cooling energy use.
REFERENCES
Akbari, H. (2002). Shade trees reduce building energy use and CO2 emissions from power plants.
Environmental Pollution, 116 (Supplement 1), S119-S126.
Aziz, N. A., & Hadi, A. S. (2007). Linking urban form to a liveable city. Malaysian Journal of
Environmental Management, 8, 87-107.
Evans, D., & Gruba, P. (2002). How to Write a Better Thesis. Victoria Melbourne University Press
Koch-Nielsen, H. (2002). Stay Cool a Design Guide for the Built environment in Hot climates. London
James & James (Science Publishers) Ltd.
Malaysia. (1993). Gambar Peta Malaysia Retrieved 5 March, 2011, from http://gambar-
peta.blogspot.com/2010/09/gambar-peta-malaysia.html.
Malek, J. A. (2011, July 14-16). Informative Global Community Development Index of Informative
Smart City. Paper presented at the 8th WSEAS International Conference on EDUCATION and
EDUCATIONAL TECHNOLOGY, Corfu Island, Greece.

Built Environment Journal Vol. 12, No.2, 1-11, 2015
Samad, A. M., Zain, M. A. M., Maarof, I., Hashim, K. A., & Adnan, R. (2011, 4-6 March). Utilization
of Artificial Neural Network and GIS for property market valuation. Paper presented at the 2011
IEEE 7th International Colloquium on Signal Processing and its Applications, Penang,
Malaysia.
Simpson, J. R. (2002). Improved estimates of tree-shade effects on residential energy use. Energy and
Buildings, 34 (10), 1067-1076.
Wong, N. H., & Yu, C. (2005). Study of green areas and urban heat island in a tropical city. Habitat
International, 29 (3), 547-558.
Yin, R. K. (2003). Applications of Case Study Research (Second edition). London SAGE Publications.

Arising Issues in the Execution of Heritage Conservation Projects: Collective Reflections from Case Studies in Ireland
Arising Issues in the Execution of Heritage Conservation Projects: Collective Reflections from Case
Studies in Ireland
Muhammad Firzan¹, Nila Keumala¹, Rodiah Zawawi¹, and A Ghafar Ahmad²
¹Faculty of Built Environment, University of Malaya, 50603 Kuala Lumpur, MALAYSIA
²School of Housing, Building and Planning, Universiti Sains Malaysia, 11800 USM, Pulau
Pinang, MALAYSIA
ABSTRACT
Apparently, conservation agenda around the globe is getting more significant nowadays. In
the quest to safeguard and sustain invaluable heritage assets remaining today, it is evident
that more new: guidelines being regulated, approaches being introduced, courses being
offered, and, growing interests being projected. Architecture discipline which melds together
different areas such as: history, humanity, science, art, and technology, has emerged a new
branch of specialization known as built heritage conservation. Realising the importance of
Western’s experience as precedence for the relatively new Malaysian conservation industry,
this paper collectively highlights on the execution of built heritage conservation projects
across Ireland. Through a series of reflection sessions shared by practitioners based on their
involvements on respective case studies, this paper summarises four arising issues of: an
enquiry on praxis and compliance of conservation doctrines, essentiality of engaging the
public in decision-making process and volunteerism, obsolescence and dereliction of
historical buildings and sites as the diseases to heritage tourism, and, achieving
environmental sustainability demand through energy efficiency and building retrofitting. Prior
insights and recommendations based on these arising issues are presented for the attention of
heritage stakeholders and conservation actors of Malaysia.
Keywords: Heritage, conservation, Ireland, Malaysia, reflective practice.
INTRODUCTION
Ireland is a country renowned for its richness in tradition, culture, and history. Despite merely
having two of its cultural heritage assets being prescribed into the UNESCO World Heritage namely,
the Archaeological Ensemble of the Bend of the Boyne (Irish: Brú na Bóinne) in 1993, and, the
Skellig Michael Island (Irish: Sceilg Mhichíl) in 1996 (UNESCO, 1999-2014), there are great
abundance of heritage assets can be observed across the country ranging from cultural and natural
properties. Evidently, Ireland has a respectable historical protection schemes and systematic heritage
management structure in their conservation agenda as can be observed in their two primary concern of
conservation as stipulated in Ireland’s Planning and Development Act 2000 namely: the Protected
Structures and the Architectural Conservation Area (Oireachtas, 2000; Department of Arts, Heritage
and the Gaeltacht, 2011). Hence, in the quest to shift the relatively new Malaysian conservation
industry to a better standard (Syed Mustapa, Kamal, Zaidi and Abd Wahab, 2007; Sulaiman,
Kamaruzzaman, Rao and Pitt, 2011; Syed Mohamad, Akasah and Abdul Rahman, 2014), precedent
from Ireland’s conservation experience is of the essence. To such a great degree, global conservation
agenda for both developed and developing countries, should legitimately be emphasised, uplifted and
celebrated in order to savour our finite and precious assets of cultural heritage that are still remaining
today.
Built Environment Journal Vol. 12, No.2, 12 - 23, 2015
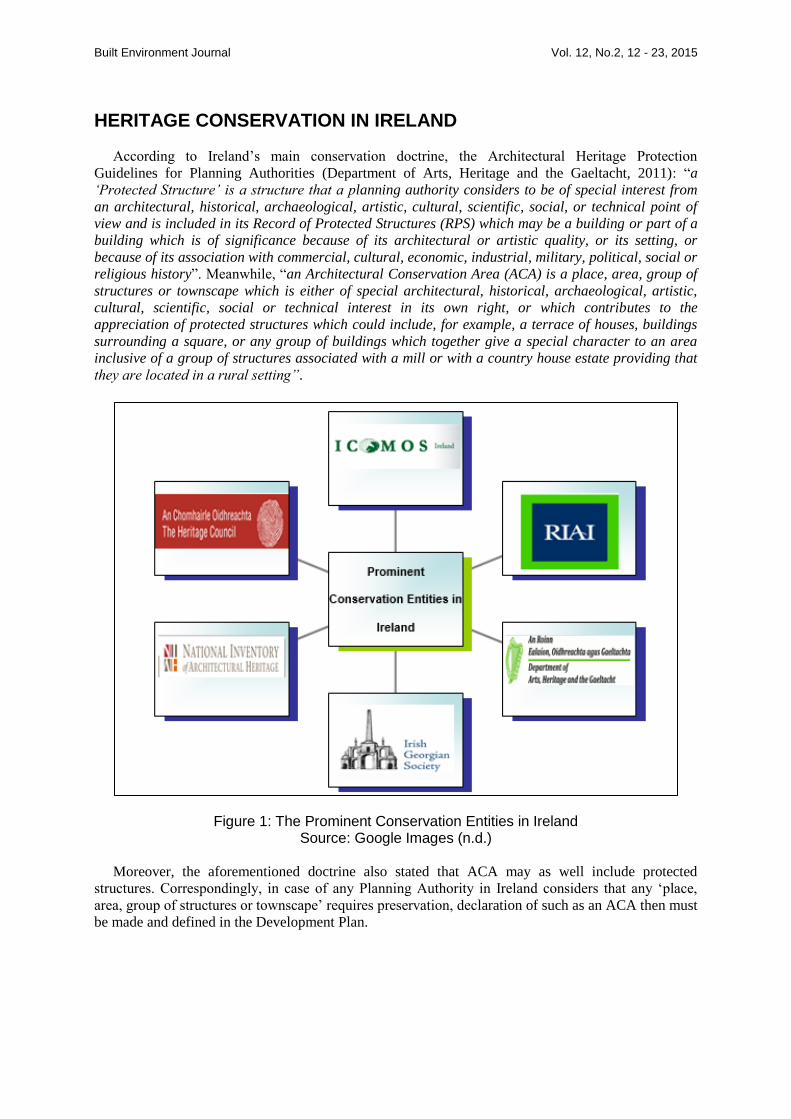
HERITAGE CONSERVATION IN IRELAND
According to Ireland’s main conservation doctrine, the Architectural Heritage Protection
Guidelines for Planning Authorities (Department of Arts, Heritage and the Gaeltacht, 2011): “a
‘Protected Structure’ is a structure that a planning authority considers to be of special interest from
an architectural, historical, archaeological, artistic, cultural, scientific, social, or technical point of
view and is included in its Record of Protected Structures (RPS) which may be a building or part of a
building which is of significance because of its architectural or artistic quality, or its setting, or
because of its association with commercial, cultural, economic, industrial, military, political, social or
religious history”. Meanwhile, “an Architectural Conservation Area (ACA) is a place, area, group of
structures or townscape which is either of special architectural, historical, archaeological, artistic,
cultural, scientific, social or technical interest in its own right, or which contributes to the
appreciation of protected structures which could include, for example, a terrace of houses, buildings
surrounding a square, or any group of buildings which together give a special character to an area
inclusive of a group of structures associated with a mill or with a country house estate providing that
they are located in a rural setting”.
Figure 1: The Prominent Conservation Entities in Ireland Source: Google Images (n.d.)
Moreover, the aforementioned doctrine also stated that ACA may as well include protected
structures. Correspondingly, in case of any Planning Authority in Ireland considers that any ‘place,
area, group of structures or townscape’ requires preservation, declaration of such as an ACA then must
be made and defined in the Development Plan.

Arising Issues in the Execution of Heritage Conservation Projects: Collective Reflections from Case Studies in Ireland
Ashworth and Larkham (2013) further elaborated on the criteria of whose and which heritage in
Ireland to be conserved:
“It must reflect the identification of the specific fusion of all the exogenous and
indigenous influences which created Ireland's history”.
“The particularity of that past and its relevance to the present must be placed within
the context of a recognizable generality of the European process”.
“Heritage definition must underscore the maturation of Irish identity into a plurality,
central to which is the rejection of the Gaelic origin-myth and the removal of
Catholicism as a defining element of nationality”.
REFLECTIVE PRACTICE: LEARNING FROM CASE STUDIES
Reflective practice as defined by Schon (1983) is: “the capacity to reflect on action so as to engage
in a process of continuous learning”. Based on one’s intuition or gut feeling, reflective practice may
enhance in approaching and deriving problems and solutions respectively. To prove such claim, Schon
(1983) further explained that practitioner will be able to identify both the ends to be sought (solutions)
and the means to be employed (methods) through reflecting in and on practice by the process of:
framing the problem, determining the features to attend, attempting the order to impose and trying to
change the directions of a situation. It is imperative to note that reflective practice enable novice
students lacking in practical knowledge and technical skills, to learn critically through project reviews
and case studies as shared by professional consultants within the industry.
Apart from aiding professional and personal development, reflective practice enable skills pertinent
to the tasks being shared to be polished and improved. A typical reflection session basically provides
the ‘mentor-protégé’ learning experience on pragmatic conservation approaches between conservation
practitioners and learners. Contextually, information acquired within this paper are based on a series of
reflection sessions by involved practitioners ranging from Ireland’s architects, conservationists and
archaelogists, whom shared their experiences in executing built heritage conservation projects.
Discussion made is based on Surgenor (2011)’s explanation regarding reflective writing that involve:
looking back at the case studies, analysing the conservation interventions from own perspective and
theoretical background, and then, rethinking the meaning of learned experiences from the practicing
professionals.
SUMMARY ON ARISING ISSUES IN THE EXECUTION OF BUILT HERITAGE CONSERVATION PROJECTS IN IRELAND
Conservation Doctrines: An Enquiry on its Praxis and Compliance
Commonly, the uniqueness of built heritage physical attributes and its dissimilarities with one
another in terms of design, construction and materials influence the rationale regarding selection of
conservation approach and philosophy. In that sense, it is apparent that there are plethora of
international standards, regulations, charters, formal recommendations and conventions, affecting the
conservation procedures around the world. Most of the do’s and don’ts in conservation nowadays
basically are contributory to earlier experts in the field, as derived from renowned former theoreticians
and practitioners such as the names of William Morris, John Ruskin, Paul Philippot and Jukka
Jokilehto. Although the existence and formulation of these epistemological doctrines are basically
intended to ward off unnecessary damage to cultural heritage and to assist decision makers and
conservators in carrying out conservation, it is still unclear on how conservators do really approached,
embedded and abided so, to the best possible level.
In fact, the abundance of conservation doctrines has indirectly provided a sense of freedom pertain
to the uses of conservation language among conservators. With that, due to the utilisation of rhetorical
statements from conservation doctrines, it has become difficult for others to delineate and differentiate

Built Environment Journal Vol. 12, No.2, 12 - 23, 2015
the uprightness and especially, the erroneous of any particular conservation project. It is indeed
questionable whether the guidelines prior conservation doctrines were choice out of personal
preferences of conservators or not, since the tendency of meeting conservation best practice can be
perceptively met according to one’s very own understanding. On the other facet, the ambiguity in the
extent of adherence and compliance of conservation projects to conservation doctrines also remains a
question mark as there is no any specific measurement to determine so.
Corresponding to that, Argyris and Schön (1974) stated that people have mental maps regarding the
way they act in situations, which involves the way they plan, implement and review their actions. As a
consequence, these maps that actually guide their actions rather than the theories people explicitly
espouse. In real scenario, discrepancy do exists between what is recommended in conservation
doctrines and what has actually taken place on heritage site. Taking the conservation case of Skellig
Michael Island for an exemplar, a criticism on the reconstruction work at this particular site has been
made by a group of archaeologists lead by Michael Gibbons. As an independent archaeologist during
that time, Gibbons claimed that the shape of the Oratory Terrace has been done based on conjectural
study.
Referring to a pertinent doctrine, this case has therefore violated the main doctrine adopted by
UNESCO namely the Venice Charter (ICOMOS, 1964) in terms of “the aesthetic and historic value”
of a monument that must be preserved. According to outline in its Article 5, “The conservation of
monuments is always facilitated by making use of them for some socially useful purpose. Such use is
therefore desirable but it must not change the lay-out or decoration of the building. It is within these
limits only that modifications demanded by a change of function should be envisaged and may be
permitted.” In addition, Article 6 of the same charter stated, “The conservation of a monument implies
preserving a setting which is not out of scale. Wherever the traditional setting exists, it must be kept.
No new construction, demolition or modification which would alter the relations of mass and colour
must be allowed.”
Figure 2: The Large (Top) and Small (Below) Oratory Terrace at Skellig Michael Island
Source: Bourke, Hayden, & Lynch (2011)
Despite the criticism, Grellan Rourke, the senior conservation architect of Irish Heritage Service
who was also the main archaeologist of Office of Public Works in charge for the conservation of
Skellig Michael Island has denied the claim. He posited that merely preservation of existing fabrics
has been undertaken without intruding the originality and authenticity of the monastic structures of
this hermitage site (The Tara Foundation, 2014). Rourke further summarised the rationale behind the
decisions taken regarding his conservation works and the resultant of archaeological excavations in a
report titled, “Skellig Michael, Co. Kerry: The Monastery and South Peak Archaeological
Stratigraphic Report: Excavations 1986–2010” (Bourke, Hayden and Lynch, 2011).

Arising Issues in the Execution of Heritage Conservation Projects: Collective Reflections from Case Studies in Ireland
Apart from the compliance issue, it is unfathomable on which standards or guidelines out from the
multifariousness should be adopted by conservators in dealing with their specific case. The abundance
availability of conservation doctrines demands conservators to fully understand and digest each
document which may adversely, resulting in confusion and overlapping ideas. Nevertheless, in a
global context, more conservation documents and guidelines pertaining region-specific or particular
treatment of building components are being published. Yet looking on the positive side, those
materials potentially offer more detailed and more comprehensive sources of reference to enrich
conservators with the know-how as well as the do’s and don’ts’s knowledge.
Presumably, one of the ways to omit scepticism on work done by conservators is through
acknowledgment by any means of award, accolade or honour acquisition. The recognition received
from relevant or prestigious organisation will give a sense of confidence to a conservator besides
helping to deter cynical feedback from both peers and laymen. Among the prestigious conservation
awards in Ireland are the Irish Georgian Society’s Architectural Conservation Award and the Royal
Institute of the Architects of Ireland (RIAI)’s Irish Architecture Awards in the Best Conservation/
Restoration Project category.
Learning from this sub-issue, Malaysia may enhance its conservation industry through revisiting
the currently in-use doctrines in particular, the National Heritage Act 2005 (Act 645) and also the
Garis Panduan Pemuliharaan Bangunan Warisan 2012 by conforming the existing measures adopted
from international doctrines to be more contextualised locally, through in-depth research by experts
and full stakeholders engagement and consultation. Moreover, the main conservation governance of
Malaysia namely, the Department of National Heritage may actively initiate more conservation
awarding programmes to reward the conservation practitioners, of consultants and contractors, whom
have exercised and demonstrated a plausible good model of conservation projects. With that,
improved benchmarking standards in conservation can be set up thus better contributions to the
protection of local cultural heritage resources can be triggered and anticipated.
Essentiality of Engaging the Public in Decision-Making Process and Volunteerism
Decision-making process certainly is a very crucial planning agenda in harvesting the feasibility
and sustainability of any intervention. As we all know, a successful conservation programme or
development project outcome is always conflict-free after its execution. In order to achieve such,
empowerment of the local community and involvement of the public in any decisive process is
therefore an indispensable matter and should no longer be considered merely as an option. After all,
relying on conservation laws alone is insufficient in meeting the best practice prior safeguarding built
heritage properties.
By taking the case study of Granby ‘Pop-Up’ Park for instance, it is proven that creation of a
cheap, sustainable and enjoyable space is possible and achievable due to the beauty of community
engagement and great volunteerism. This ‘pop-up’ park with the iconic pallet theatre reflects the
success of multi-collaboration, public outreach, team effort and local creativity. It is obvious that great
things can be accomplished when the community acts as an active unit and take responsibility to make
harmonious decisions together. In addition, this sort of project in pro-bono collaboration by Sean
Harrington Architects firm also nurtures the sense of ownership, place and pride within the locals.
Adding to that, social problem affecting the environment such as vandalism will not be an issue as
people will protect and appreciate their shared possession and effort.
The aforementioned scenario is also in line with the Charter of Built Vernacular Heritage
(ICOMOS, 1999) statement of, “The built vernacular heritage occupies a central place in the
affection and pride of all peoples. It has been accepted as a characteristic and attractive product of
society. It appears informal, but nevertheless orderly. It is utilitarian and at the same time possesses
interest and beauty. It is a focus of contemporary life and at the same time a record of the history of

Built Environment Journal Vol. 12, No.2, 12 - 23, 2015
society. Although it is the work of man it is also the creation of time. It would be unworthy of the
heritage of man if care were not taken to conserve these traditional harmonies which constitute the
core of man's own existence”.
Figure 3: The Pallet Theatre at Granby 'Pop-Up' Park, Dublin
Source: Sean Harrington Architects (2014)
It is claimed that the more participation, the happier a community will be (Wallace & Pichler,
2008). Local community is a basically group of people within a shared locality whom shares social
interactions and want the most productive, effective and rewarding way of working together, besides
the freedom of making choices. They also look forward to meet their personal needs and growth
opportunity as the mileage for their commitment and contribution into the community. The beauty of
community-building concept is it encompasses a wide range of activities, goals, actors and processes
in diverse range of community, social, economic, environmental and urban change issues (Woodend,
2013). This is also practiced in Japan, another Asean country where community-based agenda is a
major concern which has been long-rooted in their planning tradition termed as ‘Machizukuri’.
By having public outreach and hearing session, decision-makers can conduct the need assessment
to gain information on local people’s requirements, hopes and desires which can assist in achieving
social equity. The consideration of enabling access, egress and use of facilities to accommodate the
disabled and elderly people in an area is one good example of better considerations and sensitivity to
the public. Referring to Ireland’s architectural conservation, accessibility and universal design is much
concerned yet also much challenging, due to the factor that most old buildings were generally
designed without fulfilling barrier-free features. This scenario has commit issuance to official
publications such as Code of Practice on Accessible Heritage Sites and Advice Series on Improving
the Accessibility of Historic Buildings and Places by the National Disability Authority (NDA). It is
imperative to note that by not consulting the local community, provision of such documents will tend
to have the propensity to overlook on their problems mitigation.
However, the critical issue of engaging community members is, on its real influence in
implementing decision. De Filippi (2005) addressed on manipulation issues in participatory process by
asserting that: “community members can make valuable contributions in all steps of communication,
not just as targets of messages and materials developed by communication specialists”. In other
words, people voices are being moulded and patterned by the desired outcome of certain stakeholders
with their own interests. As the proverb says ‘truth is stranger than fiction’, this issue does exist and is
common in nowadays planning and management scenario in which community participation is merely

Arising Issues in the Execution of Heritage Conservation Projects: Collective Reflections from Case Studies in Ireland
treated as a requirement rather than solution. Such flaw should totally be avoided as for its backfiring
aftermath in resulting ineffectiveness of any programme results pertinent to conservation.
Positive values such as respect, understanding, volunteerism, trust and honesty are crucial to
improve public engagement in Malaysian physical infrastructure’s planning, development and
conservation activities. These values are vital in transforming the local people in becoming the
‘changing agents’ by making decisions and taking actions for themselves in tune with the famous
Abraham Lincoln’s slogan “of the people, for the people and by the people”. Furthermore, it is
observable that cultural heritage conservation in Melaka and George Town, as the UNESCO World
Heritage Sites of Malaysia, are having essential need to increase the liveability of the city while
maintaining the status of a living museum. Yet, both cities are heavily demanding on the role of each
city’s state government and local authority despite the potential strength of local people to employ the
‘Heritagization’ buzzword. ‘Heritagization’ is a process of using heritage resources to achieve certain
social goals and aim to establish solidarity among members of national, religious or social group by
highlighting their differences thus legitimizing a certain social order (Poria and Ashworth, 2009).
Obsolescence and Dereliction of Historical Buildings and Sites as the Diseases to Heritage Tourism
Apparently, heritage assets are facing strong competition to coexist with contemporary and
sophisticated world of today, besides suffering constant pressure in blending with modern
development. Even though possessing bankable demand via heritage tourism, a threat to both heritage
significance and tourism industry is vivid in the form of negligence of old buildings and historical
sites, to the point of dilapidation and obsolescence pose. These problems can be related with a number
of factors such as underuse, care-free, aesthetical impairment and lack of financial funding.
Obsolescence and negligence of historical building is definitely inappropriate either economically or
ethically as conservation should be continuous and not meant to be focused during a specific period of
time.
Such predicament can be strongly linked with the lack of awareness and ill perception on
maintenance activities which carry paramount benefits in conservation, both philosophically and
practically (Dann and Cantell, 2008). The tendency to leave old building deteriorating and dilapidating
before being conserved is such an unethical manner as conservation should not only be perceived as a
heroic major restoration work yet also minor actions such as repairing, cleaning and replacing. Harun
(2011) acknowledged that the absence of proper maintenance may adversely leads to a more severe
defects and deterioration to the building fabrics. Meanwhile, Sodangi, Khamidi and Idrus (2013)
emphasised the benefits in maintaining heritage buildings such as: enhancing the quality of life for
everyone in the community, fostering investment through tourism products which will economically
benefit the community, contributing to regeneration and providing a source of local pride and sense of
place. Dann and Cantell (2008) further asserted that the longer maintenance is being ignored, rejected
or postponed, the more advantages of maintenance are lost to building owners and managers.
This notion is supported by Yahya and Ibrahim (2012) saying that achievement from maintenance
investment in buildings will define their value. A good building is always precedential by optimal care
besides having fewer occurrences of defects on the building elements, which calls upon necessary
actions to be taken at the UNESCO World Heritage Sites of Melaka and George Town, inflicted with
core problem of poorly executed maintenance and restoration as based on the Draft of Special Area
Plan (AJM Planning and Urban Design Group, 2011). This has consequently resulted in the strong
presence of dilapidated buildings and premises within both historical cities which may potentially lead
to more adverse impacts such as damaging the Outstanding Universal Values (OUV), disqualifying the
World Heritage status and impairing the tourism industry.
Looking into a larger scope, dereliction of an urban area especially historical site requires urgent
effective resolution to prevent further loss in terms of society, physical and economical aspects.

Built Environment Journal Vol. 12, No.2, 12 - 23, 2015
Aungier Street, a neighbourhood in Dublin is one of the examples of historical sites which has been
regarded as underused and currently is undergoing revitalisation process to make it more marketable
as a heritage tourism product, under the responsibility of Dublin City Council. The rebranding process
of its Valentine District has adopted the ‘place-making’ planning strategy for the benefits of residents,
businesses and visitors which sets out to capitalise on the tourism potential of the area. Place-making
as defined by Schneekloth and Shibley (1995) is the way in which all human beings transform the
places they find themselves into the places where they live.
Figure 4: The Aungier Street Area Map (right) and Postcard View from the Early 20th Century (left)
Source: Dublin City Council (2013) and Dublin City Council (n.d.) respectively
Urban spatial and design features such as increased footpath width, incidental space, surface
change, shared space and traffic calming are being incorporated in the physical revitalisation scheme
besides improving the traffic connection by making cities ‘lighter, flow and smiles’ in the area. By
taking such initiatives, the problem of vacant buildings can be tackled as more residential and
commercial opportunities will be created thus making the area thrive economically and functionally
(Dublin City Council, 2013). Other potentials of the Aungier Street Area as shared by Dublin City
Council are: the existence of 17th Century houses and listed buildings, development of social housing
for precinct improvement, Dublin City Council Energy Pilot Project, public realm improvements and
greening projects.
The Charter for the Conservation of Historic Towns and Urban Areas also known as the
Washington Charter 1987 (ICOMOS, 1987) summarised, “…’the conservation of historic towns and
urban areas’ is understood to mean those steps necessary for the protection, conservation and
restoration of such towns and areas as well as their development and harmonious adaptation to
contemporary life”. Furthermore, the Nara Document on Authenticity (ICOMOS, 1994) in its
Appendix 2 defines conservation as, “…all efforts designed to understand cultural heritage, know its
history and meaning, ensure its material safeguard and, as required, its presentation, restoration and
enhancement (Cultural heritage is understood to include monuments, groups of buildings and sites of
cultural value as defined in article one of the World Heritage Convention).”
In a nutshell, it is utmost appropriate to treat cultural heritage tourism as a mechanism to upkeep
heritage significance while not sacrificing the site authenticity to compromise and satisfy visitors’
expectations at any cost (Fullerton, McGettigan and Simon, 2010). This assertion is much applicable
in the context of conservation realm in Malaysia, currently managed to get four of its heritage sites
officially registered in the prestigious UNESCO’s World Heritage List and potentially will became
major attractions and icons of national identity besides holding international accountability via tourism

Arising Issues in the Execution of Heritage Conservation Projects: Collective Reflections from Case Studies in Ireland
industry (Shackley, 2006; Freya and Steiner, 2011; Maghsoodi Tilaki, Abdullah, Bahauddin and
Marzbali, 2014).
Achieving Environmental Sustainability Demand through Energy Efficiency and Building Retrofitting
Green building, sustainable design and eco-architecture are among the keywords of post-
modernism architectural movements that share a similar idea on environmental-friendliness. In current
conservation practice, integrating environmental sustainability measures in upgrading heritage
buildings to meet the contemporary expectations is a noble endeavour. Moreover, the demands of
sustainable conservation itself are wide-ranging that include economic, social, physical, ethical and
environmental spectrums. Focusing on conservation endeavour, the environmental sustainability can
be achieved through energy efficiency and building retrofitting.
In Ireland, new building standards which urge minimal consumption of energy and fuel have
influenced the expectations of older buildings users. The European Directive on the Energy
Performance of Buildings (2002/91/EC) adopted into Irish law in 2006, specifically targeted energy
requirements of buildings whether new or existing residential or non-residential, due to the fact that
buildings contribute significantly to this country’s energy consumption. Building Energy Rating
(BER) and Dwellings Energy Assessment Procedure (DEAP) are two prominent rating and assessment
tools for such procedure. Yet, it is vital to have realistic expectations of older buildings and to bear in
mind that environmental sustainability should not forsake heritage interest.
In the quest to meet the balance of environmental and authenticity demands, it is imperative to fully
recognise: architectural characters of a building, repair and maintenance issues, past construction
techniques and unique characteristics of traditional building materials. Detrimental impacts on historic
fabrics may result in absence of such understanding and misapplication of modern technologies (The
Department of the Environment, Heritage and Local Government, 2010).
Perceivably, there is a distinction in the process of man-made environment between new
developments and readily-available resources, in terms of the needs to pre-planned sustainable design
features for the former and to reintegrate those for the latter. However, the greenest buildings are the
ones that we already have (Jacobs, 1993) as existing buildings possess ‘embodied energy’ which
means efforts, materials and systems that can be saved by avoiding demolition and reconstruction of a
new building which will generate the carbon footprint of logistics and transportations. This notion
champions the beneficial act of reusing heritage buildings through adaptive reuse by minimising waste
and avoiding toxic emission to the environment as demolition of building and its materials does not
took place (Langston, 2010).
Basically, environmental sustainable features in a building deal with the performance of
quantifiable measurements such as: lighting, acoustics, temperature, humidity, durability of materials,
amount and distribution of spaces and also end-user satisfaction (Mahgoub, 1999). There are various
stakeholders and parties in Ireland which possess expertise in this matter such as the Irish Green
Building Council (IGBC), the Sustainable Energy Authority of Ireland (SEAI) and of course, the
Royal Institute of the Architects of Ireland (RIAI) in case of reference and consultation needed. As a
summary, these are the basic critical sustainable design issues and sciences of architecture to be
scrutinised by heritage stakeholders and conservation actors in Malaysia as highlighted by architects,
Sean Harrington (personal communication, 22 April 2014) and Paul Jennings (personal
communication, 01 April 2014):
Energy: Reducing thermal demand by south-facing site strategy of building to make
full use of sun orientation, high level of insulations to walls and roofs as well as
avoidance of cold bridges and lowering airtightness.
Biodiversity and wildlife: Provision of habitats for insects besides enabling residents
to grow plants and trees through gardens, plant boxes, courtyards and communal
spaces as well as green roofing.

Built Environment Journal Vol. 12, No.2, 12 - 23, 2015
Building materials: Avoid the use of environmental-hazardous materials and
substances such as cement, PVC products and Medium-density fibreboard (MDF) and
high Volatile Organic Compounds (VOC).
Water: Utilise and save water through; water absorption via green roofs and soft
landscaping, rain-water harvesting for irrigation and car wash and smart water
usage by having dual flushes toilet and powerless shower.
Waste: Having good waste composting machine and recycling pavilions such as the
Swedish vacuum waste disposal system.
CONCLUSION
Learning through case studies and reflective practice manifest change, solidify understanding and
foster confidence in oneself prior to embark through professional journey. Well-equipped future
practitioners with up to the standard knowledge and skills pertinent to heritage conservation and
management are in ever greater demand. As built heritage that we enjoyed today have survived years
of generation, it is supremely a shared-responsibility to ensure those treasures are inheritable by
upcoming generations without any hiatus or lacklustre. As time proceeds, construction industry of new
development may get saturated as a result of land scarcity nevertheless conservation industry
presumably will perpetuate, through the activities of maintenance and adaptive reuse.
Therefore, apart from lessons learned through contemplating on foreign case studies arising issues,
conservation performance in Malaysia can be further fine-tuned by reflecting continuously on local
conservation endeavours. This is achievable by incorporating evaluation paradigm in the current
conservation programme. Despite of various benefits in having programme evaluation, evaluation is
still rare and uncommon especially in the context of heritage conservation in Malaysia. Lastly, this
paper serves as a part of an on-going doctoral research focusing on developing a conceptual
framework (Post Conservation Evaluation) catering for Malaysian heritage building.
ACKNOWLEDGEMENT
The content of this paper is mostly based on the precedent study conducted during the researcher
involvement in the Erasmus Mundus Europe Asia (EMEA) Exchange Programme at University
College Dublin, Dublin, Ireland. This research is funded by University of Malaya’s Postgraduate
Research (PPP) Grant with the Grant I.D. No.: PG192-2014B.
REFERENCES
AJM Planning and Urban Design Group. (2011). George Town Historic Cities of the Straits
of Malacca. Draft Special Area Plan. George Town World Heritage Incorporated.
Argyris, C., & Schön, D. A. (1974). Theory in practice: increasing professional effectiveness.
Jossey-Bass Publishers.
Ashworth, G., & Larkham, P. (2013). Building A New Heritage (RLE Tourism). Routledge.
Bourke, E., Hayden, A. R., & Lynch, A. (2011). Skellig Michael, Co. Kerry: The Monastery
and South Peak Archaeological Stratigraphic Report: Excavations 1986–2010.
Ireland: Government of Ireland.
Cavanagh, S., Masson , J., & McDowell, K. (2011). Reflective practice groups in learning
disability services. The Cumbria Partnership Journal of Research, Practice and
Learning.
Dann , N., & Cantell, T. (2008). Maintenance in Conservation. In M. Forsyth, Understanding
Historic Building Conservation. Oxford, UK: Blackwell Publishing Ltd.
Arising Issues in the Execution of Heritage Conservation Projects: Collective Reflections from Case Studies in Ireland
De Filippi, F. (2005). Sustainable "Living" Heritage Conservation Through Community-
Based Approaches. Forum UNESCO University and Heritage 10th International
Seminar, (p. 6). Newcastle Upon Tyne.
Department of Arts, Heritage and the Gaeltacht. (2011). Architectural Heritage Protection:
Guidelines for Planning Authorities. dublin, Ireland: The Stationary Office,
Government of Ireland.
Dublin City Council. (2013). Aungier Street: Revitalising an Historic Neighbourhood.
Dublin, Ireland: Dublin City Council.
Dublin City Council. (2013). Public Realm Strategy: Your City Your Space Annual Report .
Dublin, Ireland: Comhairle Cathrach, Bhaile Atha Cliath.
Dublin City Council. (n.d.). AUNGIER STREET: Revitalising an Historic Neighbourhood.
Retrieved April 26, 2014, from
http://www.dublincity.ie/yourcouncil/localareaservices/southeastarea/southeastarea/au
ngierstreet/Pages/default.aspx
Freya, B., & Steiner, L. (2011, November). World Heritage List: Does it Make Sense?
International Journal of Cultural Policy, 17(05), 555–573.
Fullerton , L., McGettigan , K., & Simon, S. (2010). Integrating Management and Marketing.
International Journal of Culture, Tourism and Hospitality Research, 108.
Google Images, (n.d.) Retrieved from Google: http://images.google.com/
Harun, S. (2011). Heritage Building Conservation in Malaysia: Experience and Challenges.
Procedia Engineering.
ICOMOS. (1964). Venice Charter 1964. The International Charter for the Conservation and
Restoration of Monuments and Sites. International Council on Monuments and Sites.
ICOMOS. (1987). Washington Charter 1987. Charter for the Conservation of Historic Towns
and Urban Areas. Washington DC: International Council on Monuments and Sites.
ICOMOS. (1994). Nara Document on Authenticity. Japan: International Council on
Monuments and Sites.
ICOMOS. (1999). Charter on the Built Vernacular Heritage. Mexico: International Council
on Monuments and Sites.
Jacobs, J. (1993). The Death and Life of Great American Cities. New York: Random House.
Langston, C. (2010). Green Adaptive Reuse: Issues and Strategies for the Built Environment.
1st International Conference on Sustainable Construction & Risk Managment
(ICSCRM 2010). Chongqing Municipality, China.
Maghsoodi Tilaki, M., Abdullah, A., Bahauddin, A., & Marzbali, M. (2014). The Necessity of
Increasing Livability for George Town World Heritage Site: An Analytical Review.
Modern Applied Science, 08(01), 123-133.
Mahgoub, Y. (1999). Building Performance Evaluation. An Integrative Framework for
Architectural and Urban Design Projects Evaluation. Lectured on 1st Arab
Architecture/ Design Convention & Exposition, 24-27 October.
Oireachtas (2000). Planning and Development Act 2000 (Amended 2010). Ireland.
Poria, Y., & Ashworth, G. (2009). Heritage Tourism—Current Resource for Conflict. Annals
of Tourism Research, Vol. 36(No. 3), pp. 522–525. Shackley, M. (2006). Visitor
management: Case Studies from World Heritage Sites. Oxford: Butterworth-
Heinemann.
Shackley, M. (2006). Visitor management: Case Studies from World Heritage Sites. Oxford:
Butterworth-Heinemann.
Schneekloth, L. H., & Shibley, R. G. (1995). Placemaking: The Art and Practice of Building
Communities. New York: Wiley.
Schon, D. (1983). The reflective practitioner. San Francisco: Jossey Bass.

Built Environment Journal Vol. 12, No.2, 12 - 23, 2015
Sean Harrington Architects. (2014). Pallete Theatre. Retrieved April 25, 2014, from Sean
Harrington Architects: http://www.sha.ie/portfolio/pallet-theatre/
Sodangi, M., Khamidi, M., & Idrus, A. (2013). Towards Sustainable Heritage Building
Conservation in Malaysia Mahmoud. Journal of Applied Sciences & Environmental
Sustainability, 54-61.
Sulaiman, R., Kamaruzzaman, S. N., Rao, S. P., & Pitt, M. (2011). The Environmental
Performance of Air Conditioning Systems in Heritage Buildings in Tropical Climates.
Journal of Surveying, Construction & Property, 02(01), 93-106.
Surgenor, P. (2011, May). Reflective Practice. Tutor, Demonstrator & Coordinator
Development at UCD. UCD Teaching and Learning/ Resources. Retrieved from UCD
Teaching and Learning/ Resources: www.ucd.ie/teaching
Syed Mohamad, S., Akasah, Z., & Abdul Rahman, M. (2014). Factors Contributing to
Building Maintenance Performance of Heritage Buildings. InCIEC 2013 (pp. 851-
860). Singapore: Springer Science+Business Media.
Syed Mustapa , S., Kamal, K., Zaidi, M., & Abd Wahab, L. (2007). Maintenance Approach of
Historic Buildings in Malaysian Context. Building Engineer.
The Department of the Environment, Heritage and Local Government. (2010). Advice Series.
Energy Efficiency in Traditional Buildings. Dublin, Ireland: The Stationary Office,
Government of Ireland .
The Tara Foundation. (n.d.). The Tara Foundation: Campaigning for Ireland's heritage,
resources and human rights. Retrieved April 07, 2014, from Grellan Rourke denies
damage to Skellig Michael:
http://thetarafoundation.wordpress.com/2008/07/06/grellan-rourke-denies-damage-to-
skellig-michael/
UNESCO. (1999-2014). Ireland - UNESCO World Heritage Centre. (UNESCO World
Heritage Centre) Retrieved 04 27, 2014, from
http://whc.unesco.org/en/statesparties/IE/
Wallace , C., & Pichler, F. (2008). More Participation, Happier Society? A Comparative
Study of Civil Society and the Quality of Life. Social Indicators Research.
Woodend, L. (2013). A Study into the Practice of Machizukuri (Community Building) in
Japan.
Yahya , M., & Ibrahim, M. (2012). Building Maintenance Achievement in High Rise
Commercial Building: A Study in Klang Valley, Malaysia. OIDA International
Journal of Sustainable Development.
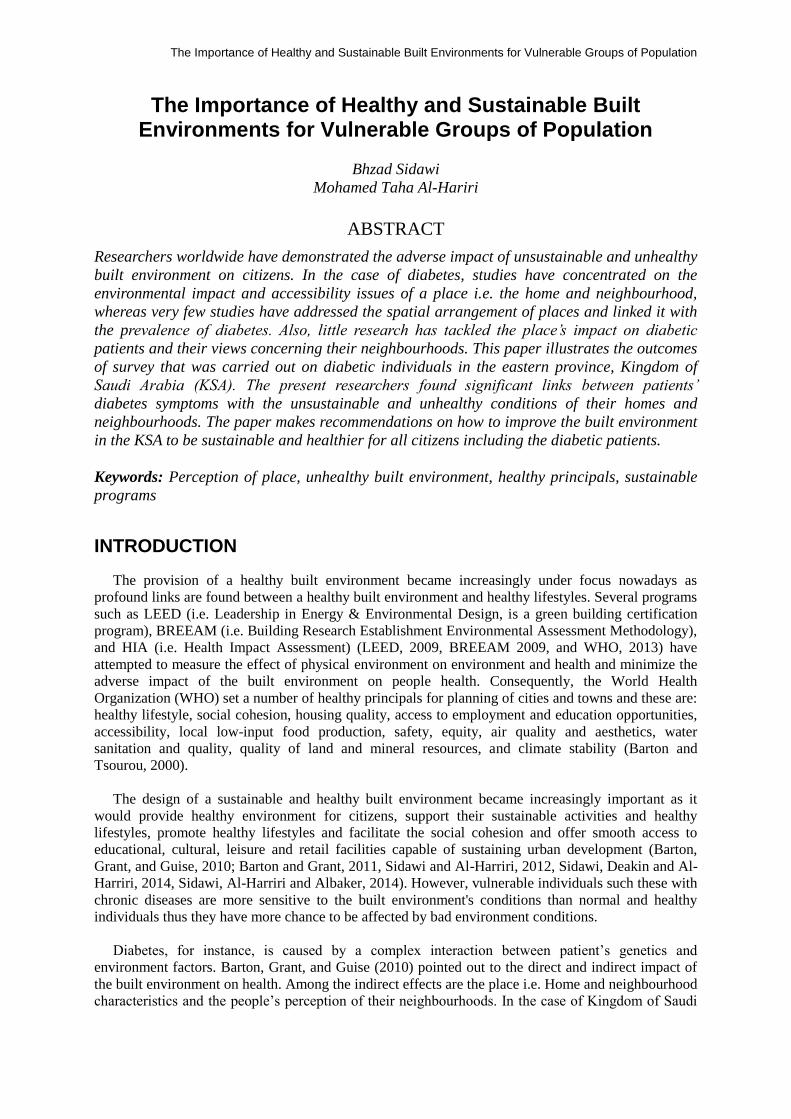
The Importance of Healthy and Sustainable Built Environments for Vulnerable Groups of Population
The Importance of Healthy and Sustainable Built Environments for Vulnerable Groups of Population
Bhzad Sidawi
Mohamed Taha Al-Hariri
ABSTRACT
Researchers worldwide have demonstrated the adverse impact of unsustainable and unhealthy
built environment on citizens. In the case of diabetes, studies have concentrated on the
environmental impact and accessibility issues of a place i.e. the home and neighbourhood,
whereas very few studies have addressed the spatial arrangement of places and linked it with
the prevalence of diabetes. Also, little research has tackled the place’s impact on diabetic
patients and their views concerning their neighbourhoods. This paper illustrates the outcomes
of survey that was carried out on diabetic individuals in the eastern province, Kingdom of
Saudi Arabia (KSA). The present researchers found significant links between patients’
diabetes symptoms with the unsustainable and unhealthy conditions of their homes and
neighbourhoods. The paper makes recommendations on how to improve the built environment
in the KSA to be sustainable and healthier for all citizens including the diabetic patients.
Keywords: Perception of place, unhealthy built environment, healthy principals, sustainable
programs
INTRODUCTION
The provision of a healthy built environment became increasingly under focus nowadays as
profound links are found between a healthy built environment and healthy lifestyles. Several programs
such as LEED (i.e. Leadership in Energy & Environmental Design, is a green building certification
program), BREEAM (i.e. Building Research Establishment Environmental Assessment Methodology),
and HIA (i.e. Health Impact Assessment) (LEED, 2009, BREEAM 2009, and WHO, 2013) have
attempted to measure the effect of physical environment on environment and health and minimize the
adverse impact of the built environment on people health. Consequently, the World Health
Organization (WHO) set a number of healthy principals for planning of cities and towns and these are:
healthy lifestyle, social cohesion, housing quality, access to employment and education opportunities,
accessibility, local low-input food production, safety, equity, air quality and aesthetics, water
sanitation and quality, quality of land and mineral resources, and climate stability (Barton and
Tsourou, 2000).
The design of a sustainable and healthy built environment became increasingly important as it
would provide healthy environment for citizens, support their sustainable activities and healthy
lifestyles, promote healthy lifestyles and facilitate the social cohesion and offer smooth access to
educational, cultural, leisure and retail facilities capable of sustaining urban development (Barton,
Grant, and Guise, 2010; Barton and Grant, 2011, Sidawi and Al-Harriri, 2012, Sidawi, Deakin and Al-
Harriri, 2014, Sidawi, Al-Harriri and Albaker, 2014). However, vulnerable individuals such these with
chronic diseases are more sensitive to the built environment's conditions than normal and healthy
individuals thus they have more chance to be affected by bad environment conditions.
Diabetes, for instance, is caused by a complex interaction between patient’s genetics and
environment factors. Barton, Grant, and Guise (2010) pointed out to the direct and indirect impact of
the built environment on health. Among the indirect effects are the place i.e. Home and neighbourhood
characteristics and the people’s perception of their neighbourhoods. In the case of Kingdom of Saudi

Built Environment Journal Vol. 12, No.2, 24 - 32, 2015
Arabia (KSA), certain cultural, environmental, and urban constraints would affect health. The
consideration of such factors, would not only tackle the catastrophic spread of “unhealthy lifestyles”,
and enable the built environment to contribute to the healthy lifestyles of diabetic patients in the KSA
but also sustain the sustainable and healthy urban development of towns and cities in the KSA. The
present researchers investigated the possible indirect built environment and spatial arrangement
impacts on the health of diabetic individuals in the KSA. A survey has been carried out on a sample
that consists of seventy six patients who usually visit the King Fahd teaching hospital of the University
of Dammam, Al-Khober. The patients were surveyed and physically examined. The field study's
results are discussed and linked with previous research studies.
THE DIABETES SYMPTOMS AND ITS' PREVALENCE IN THE KSA
Diabetes mellitus is the most common non-communicable disease worldwide and the fourth to fifth
leading cause of death in developed countries. There are – in general- two types of diabetes. In
Diabetes type I (T1DM), the person's own body has destroyed the insulin-producing beta cells in the
pancreas. Although type II diabetes mellitus (T2DM) can be caused by genetic factors, an unhealthy
lifestyle happens to be the main cause (Sidawi and Al-Hariri, 2012). A person with T2DM has one of
two problems, and occasionally both: a) not enough insulin is being produced; and b) the insulin is not
working properly. The direct symptoms of diabetes, such as thirst, frequent tingling sensation,
frequent urination and fatigue, can be mild and may cause little interruption to activities of daily
living, it is the complications of the disease, including blindness in adults (Jeppesen & Bek, 2004)
non-traumatic lower-limb amputation (Chaturvedi, Stevens, Fuller, Lee, & Lu, 2001) and kidney
failure that result in transplantation and dialysis (Atkins, 2005). Furthermore, the risk of coronary
heart disease is two to four times higher in diabetic patients. The risk of stroke or peripheral vascular
disease also increases strongly.
The Kingdom of Saudi Arabia has one of the highest percentages of diabetes in the world, with an
estimated number of 3,414,510 people diagnosed with the disease in 2012, which is 23.38% of the
population (International Diabetes Federation, 2012). Little research though was conducted in the
KSA with regard to the effect of the unhealthy built environment on diabetic patients whereas it is
evident that urbanism and poor built environment conditions in the KSA (Khodeir et al. 2012) have
promoted unhealthy lifestyles and aggravated diabetes (Sidawi and Al-Hariri, 2012, Sidawi, Al-Harriri
and Albaker, 2014, Sidawi, Deakin and Al-Harriri, 2014).
THE IMPACT OF BUILT ENVIRONMENT ON HEALTH
Barton, Grant, and Guise (2010) have classified the impact of the built environment on health into
two categories: direct and indirect. Direct impacts include those traditionally associated with: a)
planning and b) environmental health, e.g. air quality (indoor and outdoor), climate, water quantity
and quality, noise and traffic-related injuries (Sustainable Development Commission, 2008). Indirect
impacts include how the characteristics and design of the built environment influence the determinants
of health, in particular perceptions of the local area, social connections and physical activity, which in
turn are associated with physical and mental health and well-being (Barton, Grant, &, Guise 2010).
THE INDIRECT IMPACTS OF BUILT ENVIRONMENT Home and neighbourhood characteristics
This section discusses the characteristics of a home and neighbourhood, and how it promotes social
connections, accessibility, physical activity, and whether it creates positive perception for the residents
in their neighbourhood. It is well known that the influences of interactions between the level of
activity and psychosocial wellbeing and stress in the pathogenesis of T2DM.1 (Sridhar, Venkata, and
Lakshmi, 2010). Additionally, genome-wide association studies have identified the complex interplay
between genes and the environmental factors that may change in genes expression making the genes

The Importance of Healthy and Sustainable Built Environments for Vulnerable Groups of Population
potentially important pathogenic mechanisms in Diabetes and its consequences (Jirtle and Skinner,
2007).
At home level, a US study has looked at many risk factors for diabetes including physical
characteristics and personal habits (e.g. weight, smoking, exercise, and alcohol use), marital status,
education and housing conditions. The study rated the houses on the following basis: cleanliness
inside of the building, the physical condition of the building's interior and exterior, and the condition
of the furnishings in the building. The researchers tested the impact of housing conditions and used
physical attributes and habits as mediators and they found that housing conditions still influence
diabetes risk and contribute to the development of diabetes (Schootman, Andresen, Wolinsky, 2006).
For instance, dampness in buildings would critically affect health and a study found that damp housing
is often associated with poor maintenance of the dwelling and socio-economic disadvantage of the
occupants (Environmental Epidemiology Unit, 1999). There is a growing body of literature suggest
that the progression of the Diabetes and its complications resulting in part from poor lifestyle habits
such as lack of physical activity, which are in turn affected by built environment factors (Sudhir, Appa
and Sridhar, 2010). Poorer health status in socioeconomically deprived and rural environments may
reflect, in part, the inaccessibility of built environmental features such as public pools, recreation
centres, physical fitness utilities, parks, sidewalks, and streetlights (Goldberg et al., 2000).
Allanah, Ashley and Farley (2010) stated that an ill designed urban setting would enforce people to
adopt an unhealthy lifestyle thus contribute to the development of T2DM. Eckel et al. (2004) have
linked passive entertainment and a lack of physical activity with the increasing incidence of the
diabetes. Physical activity has been found to reduce the symptoms of coronary heart disease and
strokes associated with T2DM (Frumkin, Frank and Jackson, 2004). The decline in local facilities, the
reduction in pedestrian movement and neighbourly street life all reduce opportunities for the
supportive social contact so vital for mental well-being (Barton, Grant, &, Guise, 2006). The absence
of facilities, barriers to facilities (such as steep hills, busy roads to cross) or the perception that
facilities are inadequate have negative associations with physical activity (Humpel, Owen, Leslie,
2002). So, neighbourhood design that promote social networks are those which have mixed use and
pedestrian oriented, with public spaces, such as parks, that can act as places for socializing
(Greenspace Scotland, 2008). Those living in more “walkable” neighbourhoods, characterized by high
population density, mixed land use and high levels of connectivity (e.g. good pedestrian and cycling
facilities) have been found to be more physically active (Pikora, Giles-Corti, Knuiman et al. 2005,
Duncan, Spence, and Mummery, 2005).
The neighbourhood characteristics in Saudi Arabia
There are a number of housing arrangements in KSA such as: gated compounds; terraced housing,
villas, blocks of flats, or mixed development. The gated compounds are usually well fenced and
guarded and have facilities that are different in number and quality according to the compound class
i.e. middle, upper, rich and very rich. Facilities in gated compounds can be only used by the
compound's residents and their guests. Some of the compounds have a lack in facilities such as: café
shops, restaurants, laundries, bank branches, gardens etc., so the residents have to travel by car to get
their daily/ weekly needs from the district's centres or shopping malls. Each of the above mentioned
spatial arrangements would have a unique effect on the occupant’s health and well-being. Residential
districts in KSA can be also classified in accordance to the social class. The facilities, finishing
quality, level of furnishing and cleanliness varies from one district to another. These suffer from
irregular location of the amenities such as; gardens, parks, leisure and recreation within the
neighbourhoods, quarters, and districts (Choguill, 2008).
In Jeddah, problems of poor quality public spaces within modern residential areas seem to beset the
public realm (Manadeli, 2010). Alshuwaikhat and Aina (2006) conducted a study in AL Dhahran,
KSA and found that there is low level of access to open spaces by people (i.e. percentage of
population) comparing with the standards. Also, there is lower percentage of total land dedicated to
open space than standard (ibid). Aleid and Alseef (2010) revealed a lack of recreational

Built Environment Journal Vol. 12, No.2, 24 - 32, 2015
places/facilities and public parks, particularly kids’ playgrounds. Citizens in Alkhober are also not
satisfied about the public facilities. They highlighted the absence of green areas, lack of safety, lack of
entertainment facilities for children, the absence of shaded public spaces and recreational facilities,
and lack of hygiene and cleanness (Alshuaibi, 2012). With respect to the built environment and
individuals’ habits in KSA, the following issues are noticed:
rapid growth of Saudi cities and the absences of healthy and sustainable planning code
the extreme hot, dry inland and humid weather in coastal cities create environmental
conditions that affect the type and timing of people's activities. Thus, Saudis tend to engage in
unhealthy activities: such as irregular sleeping patterns (e.g. afternoon nap, sleeping late),
evening or late night trips to local malls and shopping arcades or sitting in coffee shops, late
night’s heavy meals. These activities replace outdoor activities, such as children’s
playgrounds and walking children to school (Choguill, 2008);
in major cities across the KSA, it was found that the majority of Saudi adolescents spent more
than 2 hours watching TV, and around half of them do not meet the daily physical activity
requirements (Al-Hazzaa et al., 2011)
poor living conditions add to these problems and adversely affect the health of all citizens,
particularly those with diabetes (Allanah, 2012, Sidawi and Al-Hariri, 2012, Sidawi, Deakin
and Al-Harriri, 2014). Such living conditions make it difficult for diabetics to enjoy walking
around their neighbourhoods due to the extreme hot, dry and humid weather conditions and
high level of air pollution within cities (Sidawi et al. 2011 and Sidawi, 2012);
certain cultural issues should also be taken into consideration when exploring the relationship
between diabetics and living conditions such as the segregation between men and women and
restricted rules regarding women clothing and their mobility, social relationships within the
Saudi families and tribes and socio-economic disadvantage for poor (Sidawi, 2013& 2014).
Perceptions of Place and Health
Perception of place problems refers to aspects people say they dislike about their local area when
interviewed in general health surveys (NICE, 2007). Such problems have been considered in
relationship to health (Parkes & Kearns, 2005, Stafford & Marmot, 2003). Some problems can be
labelled as physical or environmental when they relate to the presence of noise, dense traffic, dirt,
odours, fumes or various signs of deterioration in the built environment such as abandoned buildings,
trash, litter, graffiti and vacant housing (NICE, 2007). Other problems refer to the absence of basic
infrastructure, facilities and amenities in the neighbourhood (ibid). Studies have consistently found
evidence of a relationship between neighbourhood environment (both perceptions and more objective
measures) and self-reported health (Curtice, Ellaway and Robertson et al. 2005, Wilson, Elliot and
Law et al. 2006). For example, people who perceive their neighbourhoods to be hostile, dirty, poorly
maintained, and lacking in safe places to play, are more likely to experience anxiety, depression, and
poor health (Curtice, Ellaway and Robertson et al., 2005). On the other hand, high self-efficacy,
perceptions of good quality facilities in the area and high levels of neighbourliness were independently
associated with good self-rated health and physical functioning. Perceptions of problems in the area
were also predictive of poorer health (NICE, 2007). The perception of problems in the neighbourhood
is negatively associated with several health outcomes such and health behaviours (NICE, 2007). Such
perceptions might influence people’s health through various pathways (Kawachi & Berkman, 2003).
Perceived environmental problems, such as air or water pollution would affect physiological
pathways, whereas perceived problems and social cohesion may influence health through psychosocial
and physiological pathways (Latkin & Curry, 2003). So, perceived problems in the neighbourhood,
such as noise and dense traffic are considered as chronic stressors heightening the level of anxiety,
insecurity and fear among residents. Perceived local environments might influence health through
behavioural pathways such as smoking, diet and physical activities.

The Importance of Healthy and Sustainable Built Environments for Vulnerable Groups of Population
HEALTHY BUILT ENVIRONMENT AND HEALTHY LIFESTYLE
WHO has emphasized on the importance of planning healthy built environments (Barton and
Tsourou, 2000). The built environment should be designed to be sustainable and promote healthy
lifestyles, facilitate social cohesion and offer access to educational, cultural, leisure and retail facilities
capable of sustaining urban development (Curwell and Deakin 2002, Barton, Grant, and Guise, 2010,
Barton and Grant, 2011). Jackson and Kochtitzky (2001) advocated providing neighbourhood
opportunities for walking to accomplish routine activities such as shopping, going to work and
exercise. Green areas should be carefully located, designed and integrated with the neighbourhood in
order to be pleasant in appearance, encourage walking and improve health. Landscape architecture
appears to be the primary key at the finest scale to sound mind and body, and simply viewing nature
reduces the stress of daily urban life (Jackson, 2011). In addition, urban green space does more than
offer opportunities for physical activity; it offers opportunities for engagement with, and observation
of, nature, as well as opportunities for social interaction, thus enhancing individuals’ sense of well-
being (Greenspace Scotland, 2008). Accessibility for all types of users to all facilities and services is a
must. Visual landmarks and logical transit pathways assist people, particularly the elderly, in reaching
their destinations. Psychologically, the above-mentioned elements provide a sense of ease and
comfort. On a neighbourhood, urban or city level, urban planning should promote walking, the use of
public transport, minimizing the number of vehicles on roads, providing well (cross) ventilated and
shaded urban areas in hot climate countries. It also reduces the pollution and noise levels and would
provide thermally comfortable urban areas.
THE RESEARCH OBJECTIVES AND METHODOLOGY
The research aim is to examine the effect of the built environment on diabetic individuals within
the context of The Eastern province, Kingdom of Saudi Arabia. Therefore, the researchers have set a
number of objectives and these are
To find out the relation between the disease’s symptoms and resulted medical investigations
of patients with the characteristics of their residence;
To find out possible links between the disease’s symptoms and medical investigations of
patients with their perception of the neighbourhoods
Consent to carry out the study was first obtained from the University of Dammam’s ethics
committee. The fieldwork began in January 2013. The study’s sample constituted of diabetic patients
who usually visit the diabetic clinic at the King Fahd teaching hospital of the University of Dammam,
Al-Khobar. This list of patients includes T1 and 2DM male and female adults, age 15-70 years and
resident in the Eastern province, KSA. Seventy six patients have participated in the study. These
patients were handed a questionnaire form to fill in, and physical exams of patients’ health statuses
were carried out. The questionnaire includes questions on the characteristics of their home and
neighbourhood, the patients’ lifestyles and activities since the onset of the disease, their perception of
the environmental conditions of the home, work and neighbourhood, and self-reported health
conditions since the onset of the disease. All patients have filled in the questionnaire and returned it.
The patients were physically examined. The exams include; a blood pressure test and Body Mass
Index (BMI). The medical test results such as the fasting blood glucose, HBA1C, urine albumin, and
lipid profile, were extracted from the patients’ medical files.
DISCUSSION OF THE RESULTS
Many previous researchers have pointed out to the pathways through which the unsustainable and
unhealthy built environment would impact health. This is true for diabetic patients who suffer from
indoor and outdoor conditions (see for instance Schootman, Andresen and Wolinsky, 2006). Such
conditions would force people to adopt unhealthy lifestyles, and contribute not only to the
development of diabetes T2DM but to the deterioration of the health status of T1DM patients (see also

Built Environment Journal Vol. 12, No.2, 24 - 32, 2015
Allanah, Ashley and Farley, 2010, Eckel et al., 2004, Jirtle and Skinner, 2007, Sidawi, Deakin and Al-
Harriri, 2014).
In this paper the present researchers examined the adverse impact of the built environment on
health of specific population that is the diabetic individuals in the KSA. The study showed that the
progress of the disease is caused by unhealthy built environment in the KSA (see also Khodeir et al.
2012, Sidawi and Hariri, 2012, and Sidawi, Deakin and Al-Harriri, 2014). This is represented by high
pollution levels, and irregularity of spatial configuration/ arrangement of public facilities and the lack
of the public facilities as well. The irregular settings of urban services would promote unhealthy
lifestyles as around half of the respondents never or rarely do any recreational activities, morning sport
exercises or participate in social activities (see also Barton, Grant, and Guise, 2006, and Humpel,
Owen, Leslie, 2002). In regards to the dietary habits, around half of the respondents admitted bad
habits related to drinking fizzy drinks or eating junk food meals, watching TV or working in the office
for long hours.
In regards to the environmental conditions, the patients suffered from various home or
neighbourhood's environmental conditions such as unpleasant outside views, noise from neighbours,
traffic noise etc. Also, patients said they suffer mostly from extreme fatigue/ tiredness, tension/ stress,
blurred vision, and an inability to control their nerves. The study found significant links between the
environmental conditions at home and in the neighbourhoods with the frequency of disease symptoms
whereas bad environmental conditions are associated with higher frequency of self-reported symptoms
(see also Schootman, Andresen and Wolinsky 2006). The home conditions have links with the medical
investigations results whereas uncomfortable home conditions from environmental, social and
psychological perspectives have a bad effect on diabetic individuals and causes higher levels of LDL,
TG and poorer HDL. Respondents who live in poor areas suffer more from the poor environmental
conditions at home and in their neighbourhoods and subsequently they suffer more from a number of
diabetes manifestations such as: Paraesthesia, Blurred vision, and stress (also see Barton, Grant, and
Guise, 2010 for health& poor environment correlations).
CONCLUSION AND RECOMMENDATIONS
With regards to this research findings and previous research, the present researchers would suggest
that fundamental changes should be carried out in the Saudi built environment to promote physical
activity, improve psychological and physiological conditions not only of normal citizens but also for
vulnerable groups of population such as diabetic individuals. However, a number of issues should be
considered in any future planning of cities. Amongst of these, is the Islamic lifestyle and practices; and
the Saudi culture. Also, one should consider the have unique social, cultural, environmental and
economic characteristics of Saudi cities. The fabric of these cities is rapidly changing due to the urban
sprawl on macro level, neighbourhoods’ level, and micro level (i.e. homes level). There are also on-
going and rapid negative environmental changes due to the increased levels of pollution and
desertification in the KSA and the global warming at national, regional and global level. Therefore, the
present sustainability programs and Health Assessment tools should be developed further into a robust
assessment framework that addresses and measures the relationship between people’s activities and
the built environment (i.e. indoor, outdoor, and interlink relationship between them). Such framework
should be incorporated into the planning and decision making process so it would help improving the
existing neighbourhoods and designing new healthy neighbourhoods and cities.
ACKNOWLEDGEMENT
The researchers would like to thank the University of Dammam (UoD), deanship of scientific
research for funding this research study under the research project number 2012107.

The Importance of Healthy and Sustainable Built Environments for Vulnerable Groups of Population
REFERENCES
Allanah, Li; Ashley, K., and Farley, E. (2012). Diabetes and the built environment: Contributions from
an emerging interdisciplinary research programme, UWOMJ, 79:1, pages 20-22
Aleid, I and Alseef, S. (2010). The application of GIS in planning public services in Alriyadh. The
10th National GIS Symposium in Saudi Arabia, Dammam, 2014.
Alshuaibi. M. M. (2012). Retrieving of the city centres: A case study of the Prince Bander Bin
Abdullazziz street, Alkhober (Alsuwaikit). Msc thesis.
Alshuwaikhat Habib M. & Aina Yusuf A. 2006. GIS-based urban sustainability assessment: The case
of Dammam city, Saudi Arabia, King Fahd University of Petroleum & Minerals Journal,
Dhahran, Saudi Arabia.
Al-Hazzaa, H. M., Abahussain, N. A., Al-Sobayel, H. I., Qahwaji, D. M., & Musaiger, A. O. (2011).
Physical activity, sedentary behaviors and dietary habits among Saudi adolescents relative to
age, gender and region. International Journal of Behavioral Nutrition and Physical Activity, 8,
140. http://dx.doi.org/10.1186/1479-5868-8-140
Atkins R. (2005). The epidemiology of chronic kidney disease. Review, Kidney Int. Suppl. 94 (Apr),
S14–S18.
Barton, H., Grant, M. and Guise, R. (2006), Shaping neighbourhoods a guide for health, sustainability
and vitality. Taylor & Francis, USA.
Barton, H., Grant, M. and Guise, R. (2010). Shaping Neighbourhoods for local health and global
sustainability, Routledge, London.
Barton, H. and Grant, M. (2011). Urban planning for healthy cities: A review of the progress of the
European Healthy Cities Programme, Journal of Urban Health, Bulletin of the New York
Academy of Medicine,
http //dx.doi.org/10.1007/s11524-011-9649-3
Barton, H. and Tsourou, C. (2000). Healthy urban planning, Spon Press on behalf of WHO Regional
Office for Europe, London, 2000.
BREEAM. (2009). BREEAM for Communities: Stage 2. SD5065 Technical Guidance Manual:
Version 1, BREEAM for Communities Assessor Manual: Development Planning Application
Stage.
Chaturvedi, N., Stevens, L. K., Fuller J. H., Lee, E. T., Lu M. (2001). Risk factors, ethnic differences
and mortality associated with lower-extremity gangrene and amputation in diabetes: The WHO
Multinational Study of Vascular Disease in Diabetes, Diabetologia, 44, 65–71.
Choguill, C. L. (2008). Developing sustainable neighbourhoods. Habitat International, 32, 41–48.
Curtice, J., Ellaway, A., Robertson, C, et al. (2005). Public Attitudes and Environmental Justice in
Scotland. Scottish Executive Social Research,
Curwell, S. and Deakin, M. (2002). Sustainable urban development and BEQUEST, Building
Information and Research, Vol. 30, No. 2.
Duncan, M., Spence, J., Mummery, W. (2005). Perceived environment and physical activity: a meta-
analysis of selected environmental characteristics, International Journal of Behavioural
Nutrition and Physical Activity, 2005, 2 (11): DOI: 1186/1479-5868-2-11
Eckel, R. H. , York, D. A. , Rössner, S., et al. (2004). Obesity, a Worldwide Epidemic Related to
Heart Disease and Stroke: Executive Summary: AHA Conference Proceedings Prevention
Conference VII, Circulation, 110:2968-2975
Environmental Epidemiology Unit. (1999). Rapid Reviews of Public Health for London: Housing
and the Built Environment. London: London School of Hygiene and Tropical Medicine.
Frumkin, H., Frank, L., and Jackson, R.(2004). Urban Sprawl and Public Health: Designing, Planning
and Building for Healthy Communities, Island Press, Washington.
Greenspace Scotland.(2008). HIA of Green space: A Guide. Greenspace Scotland, Stirling.
Goldberg, M. S., Bailar, III J. C., Burnett, R. T., Brook. J. R., Tamblyn. R., & Bonvalot, Y. (2000).
Identifying subgroups of the general population that may be susceptible to short-term increases
in particulate air pollution: A time series study in Montreal, Quebec. Res. Rep. Health Effects
Inst., 97, 7-113.
Humpel, N., Owen, N., Leslie, E. (2002). Environmental factors associated with adults’ participation
in physical activity: a review. American Journal of Preventative Medicine, 22(3):188-199.

Built Environment Journal Vol. 12, No.2, 24 - 32, 2015
International Diabetes federation. IDF DIABETES ATLAS, (2012)
http://www.idf.org/sites/default/files/5E_IDFAtlasPoster_2012_EN.pdf
Jackson, R.J., Kochtitzky, C. Creating a Healthy Environment: The Impact of the Built Environment
on Public Health. Sprawl Watch Clearinghouse, Washington, DC, 2001.
Jackson, R. J. 2011. What Olmstead [sic] Knew. Western City.
[http://www.westerncity.com/Mar01Olmstead.htm]
Jeppesen, P., and Bek, T. (2004). The occurrence and causes of registered blindness in diabetes
patients in Arhus County, Denmark , Acta Ophthalmol. Scand., 82 (5), 526–530.
Jirtle RL, Skinner MK. (2007). Environmental epigenomics and disease susceptibility. Nat Rev Genet,
8: 253–262
Kawachi, I., & Berkman, L. Introduction. In I. Kawachi, & L. F. Berkman (Eds.). (2003).
Neighborhoods and health (pp. 1–19). New York: Oxford University Press
Khodeir, M., Magdy, S., Mansour, A., Mianhua, Z. ,Hong, S., Max, C., Lung‐Chi C., Polina M.
(2012). Source apportionment and elemental composition of PM2.5 and PM10 in Jeddah City,
Saudi Arabia, Atmospheric Pollution Research, 3 331‐340
Latkin, C. A., & Curry, A. D. Stressful neighborhoods and depression: A prospective study of the
impact of neighborhood disorder. Journal of Health and Social Behavior, 2003, 44, 34–44.
LEED. (2009). LEED 2009 for Neighborhood Development Rating System. U.S. Green building
council.
NICE. (2007). Assessing people’s perceptions of their neighborhood and community involvement (Part
1), 2007, http://www.nice.org.uk/nicemedia/documents/peoplesperceptions.pdf
Parkes, A., & Kearns, A. (2001). The multi-dimensional neighbourhood and health: A cross-sectional
analysis of the Scottish Household Survey, Health & Place, 12 (1). pp. 1-18
Pikora, T., Giles-Corti, B., Knuiman, M. et al. (2005). Neighbourhood environmental factors
correlated with walking near home: using SPACES , Medicine and Science in Sports and
Exercise, 38(4): 708-14.
Schootman, M., Andresen, E.M., Wolinsky, F.D., Malmstrom, T.K., Miller, J.P., & Miller, D.K.
(2006). Neighborhood conditions and risk of incident lower-body functional limitations among
middle-aged African Americans. American Journal of Epidemiology, 163(5), 450-8.
Sidawi B. and Meeran S. (2011). A framework for providing lifelong finance to the owners of
affordable dwellings in the Kingdom of Saudi Arabia , Cities, Volume 28, Pages 138-146.
Sidawi, B., Al-Hariri M. T. A. (2012). The Impact of Built Environment on Diabetic Patients: The
Case of Eastern Province, Kingdom of Saudi Arabia , Global Journal of Health Science, 2012,
Vol 4, No 4, pp 126-138.
Sidawi, B. (2012). The clients’ satisfaction with property-related financing by banks and Real Estate
Development Fund (REDF) , IAHS XXXVIII World Congress on Housing, Visions for the
Future of Housing Mega Cities, edited by Ural, O., Şahin M., and Ural, D., April 16-19, 2012,
Istanbul, Turkey, Pages 1207-1213.
Sidawi, B. (2013). The financial support of ongoing socio-economic needs of citizens: the case of
Kingdom of Saudi Arabia. International Journal of the Built Environment and Asset
Management (IJBEAM), 2013, Vol. 1, No.2, pp. 106 - 120
Sidawi, B., Al-Harriri, M. T., Albaker, W. I. (2014). Creating a healthy built environment for diabetic
patients: the case study of the Eastern province of the Kingdom of Saudi Arabia. Global Journal
of Health Science; Vol. 6, No. 4; pp 136-147.
Sidawi, B., Deakin, M. and Al-Harriri M. (2014). The place-based impact of built environments:
Diabetes, living conditions, homes and neighbourhoods. Indoor and Built Environment. October
29, 2014.
Sidawi, B. (2014). An Evaluation of the performance of the housing finance system in the Kingdom of
Saudi Arabia – from the perspective of low and middle income consumers. International
Journal of Housing Markets and Analysis, Emerald, UK, V7, issue 2, pp.156 - 174
Sridhar GR, Venkata P, Lakshmi G. (2010). Time trends in the prevalence of diabetes mellitus: ten
year analysis from Southern India (1994–2004) on 19,072 subjects with diabetes. J Assoc
Physicians India., 58:290–4.
Stafford, M., & Marmot, M. (2003). Neighbourhood deprivation and health: Does it affect us equally?
International Journal of Epidemiology, 32, 357–366.

The Importance of Healthy and Sustainable Built Environments for Vulnerable Groups of Population
Sudhir Kumar, P., Appa Rao, A., & Sridhar, G. R. (2010). Built environment and diabetes. Intl J
Diab. Dev.
Countries, 30, 63-8.Sustainable Development Commission. (2008). Health, place and nature: How
outdoor environments influence health and well-being: a knowledge base. London,
Wilson, K., Elliot, S., Law, M., et al. (2006). Linking perceptions of neighbourhoods to health in
Hamiton, Canada. Journal of Epidemiology and Community Health, 58: 192-198.
WHO. (2013). Health Impact Assessment (HIA). http://www.who.int/hia/about/en/

Built Environment Journal Vol. 12, No.2, 33 - 49, 2015
Implementing The Last PlannerTM
System in a Road Construction Project in Nigeria
Ograbe Ahiakwo1; David Oloke
2; Subashini Suresh
3 and Jamal Khatib
4
1BTech, MSc, PhD Student in Built Environment, School of Technology, University of
Wolverhampton, Wulfruna Str. Wolverhampton WV1 1LY United Kingdom 2BEng, MSc, PhD, Snr. Consultant-Built Environment, School of Technology, University of
Wolverhampton, Wulfruna Str. Wolverhampton WV1 1LY, United Kingdom 3BEng, MEng, PhD, Principal Lecturer, School of Technology, University of Wolverhampton,
Wulfruna Str. Wolverhampton WV1 1LY, United Kingdom 4BEng, MEng, PhD, Professor in Civil Engineering Material, Built Environment,
University of Wolverhampton, School of Technology, Wulfruna Street, WV1 1LY, United
Kingdom
[email protected]; [email protected]; [email protected];
ABSTRACT
This paper describes a research investigation into the implementation of the Last Planner
System (LPS) in a road construction project. LPS is known to be the most developed practical
use of Lean Construction. It focuses on minimising the negative impacts of variability,
uncertainties, buffers, making projects more predictable, creating reliable work plans and
convalescing collaborative planning. LPS is unpopular in highway and road construction
projects, as a lot of case studies have been recorded of its application on infrastructure and
building projects as against highway and road projects. However in the road project. In order
to achieve this aim, an Action Research strategy is adopted using different data collection
methods such as interviews, observation and survey questionnaire. The initial state of
production plan reliability within this case project was observed to be highly unreliable with
a high degree of variability. However as the implementation commenced, production plans
were stabilized with an improved reliability in the schedules. The results from this study
demonstrate that although a road construction process is a linear process, a number of
benefits were still recorded in terms of improving construction planning and control
processes, during the implementation.
Keywords: Action research, Last Planner System, Lean construction, Planning, Road
construction.
INTRODUCTION
Nigeria ranks tops compared with other countries in Sub-Saharan Africa in terms of road network
infrastructure with an estimated road network of 200,000 km connecting different villages to cities
(FME 2013). However, the highway industry in Nigeria suffers from many problems and most of
these problems can be practically linked to the construction culture within the industry.
This construction culture at the project level is often associated with such attributes as
fragmentation, antagonism, mistrust, poor communication, short-term mentality and blame culture
(Odeh and Battaineh, 2002; Oke and Ogunsemi, 2011). As a result, the entire construction industry is

Implementing The Last PlannerTM
System in a Road Construction Project in Nigeria
overwhelmed by poor quality work, cost and time overruns resulting from poor project definitions
during planning; inadequate planning; inadequate funds; inflation; bankruptcy of contractor; variation
of project scope; political factors; death of client; incompetent project manager; wrong estimate;
inadequate cost control unethical behaviours in the form of fraudulent practices and kickbacks
(Mansfield et al., 1994; Olomolaiye et al., 1987; Oyewobi et al., 2011; Olusegun and Michael 2011,
Oke and Ogunsemi, 2011).
These attributes all affect the quality work of work produced, the final cost of executing the project
and the time spent in carrying out the project (Aibinu and Jagboro, 2002; Odeh and Battaineh, 2002).
Furthermore, Ankara (2007) looked at different cultural orientations in relation to project
performances. It was revealed that dimensions of culture were found to be significantly associated
with project performance outcomes.
Conversely, Mossman (2012) proposed that Lean Construction using the Last Planner System
influences construction culture by encouraging collaboration, transparency, trust, reliability of
scheduling and delivery of value while, consuming the fewest resources. Henceforth, overcoming
natural cultural issues of poor quality work and overruns in time and cost.
THE LAST PLANNER SYSTEM
The Last Planner System (LPS) has been argued to be the most developed practical use of lean
construction (Thomas et al., 2003), and it is a trademark of the Lean Construction Institute (Kalsaas,
2012). Lean Construction on the other hand is a construction production management, philosophy that
arose from the recognition of the limitations of the traditional project management philosophies while
applying Lean Production to the construction industry (Howell, 1999). It focuses on improving
production flow with a goal of better meeting customer needs while using fewer resources and
maximizing value (Gonzalez et al., 2010, Ballard 1999, Howell 1999, Koskela 1992).
The general idea behind the Last PlannerTM
System (LPS) of Production Control originates from
the need to collaboratively manage program co-ordination, so as to increase work flow and work plan
predictability (Ballard, 1993; Ballard, 1997; Ballard, 2000; Ballard and Howell, 2003). It operates with
buffers in the form of ‘workable backlogs’ that level the workflow by buffering against unpredicted
plan variation. The basic function of LPS thus is to make projects more predictable, minimising
buffers, learning from plan failures, reducing uncertainties, creating reliable work plans, decreasing
workflow variability and improving collaborative planning, (Ballard, 2000; Ballard et al., 2009,
Gonzalez et al., 2010, Mossman, 2013).
The Last Planner allows planners to produce a record of “what can be done”, from which workers
choose tasks – “what will be done”, while a procedure of system appraisal allows a review of “what
was done”, whereas all the time steps are taken to shield tasks from the effects of dependences with
other tasks (Ballard, 2000; Ballard et al., 2007, Ballard et al., 2009). In a nutshell it develops a work
plan using ‘should-can-will’ analysis (Ballard, 2000). The ‘should’ shows all the work to be carried
out, but in most cases restrains arise which limit the work that ‘can’ be done. Then LPS works in such
a way that it makes a commitment to the work that ‘will’ be done. The PPC calculates the ratio of
tasks ‘did’ to the task that ‘will’ be done. A low PPC shows poor planning and the reasons for poor
results are investigated to promote better planning (Ballard 2000; Ballard and Howell 2003; Salem et
al., 2005)
Generally LPS involves five levels of planning: (1) The Master Schedule, (2) Phase Schedule, (3)
Look-ahead planning, (4) Weekly work plans and (5) Percentage Plans Completed (PPC). Details of
these are explained as sighted in Koskela et al., (2010) Tommelein and Ballard, (1997); Ballard and
Howell, (2004); Ballard, (1997); Hamzeh et al., (2008), however a summary of their description is
shown below.
Built Environment Journal Vol. 12, No.2, 33 - 49, 2015
The Master Schedule
This is generally referred to as the master plan, and it is the first phase of the production planning
system (Hamzeh et al., 2008). Here the objective is to provide an overall view of the project, and to
analyse feasibility of project completion (Tommelein and Ballard, 1997). The aim is to bring all the
major actors together early in the process, so that critical interdependencies can be discussed,
assumptions tested, with a collaborative creation of an agreement to the production sequence and best
practice for the entire project (Alsehaimi, 2011).
Phase Schedule
This entails phase planning i.e. breaking the entire master plans into phases and planning based on
those phases. This is achieved by using reverse-phase scheduling – i.e. working backwards from the
desired delivery dates; tasks are scheduled in reverse order, allowing them to be performed at the last
responsible moment, thus minimising unnecessary accumulation of work in progress (Ahiakwo et al.,
2014). Phase scheduling involves developing more detailed work plans and providing goals that can
be considered targets to the project team. It basically entails a face to face conversation that establishes
context, define the milestone deliverable, develops an execution strategy, identifies tasks and
organises them in a pull plan working from the end of the phase back (Patel, 2011).
Look-ahead planning
Look-ahead planning breaks activities down into the level of processes/operations, identifies
constraints, assigns responsibilities, and makes tasks ready by removing constraints (Hamzeh and
Bergstrom, 2010). They also make tasks ready so that they can be done when the right time comes.
Look-ahead planning states the preconditions that must be evaluated by breaking down activities into
the level of processes/operations, so that possible constraints are identified, responsibilities are
assigned, and assignments are made, while frantic efforts are made to remove the constraints (Hamzeh,
2011). Any tasks whose constraints have been removed are put on a list called the ‘workable backlog’.
They are usually the outcomes of mid-term planning by showing activities at the level of processes
and operations (Ballard, 1997).
Weekly work plans
Weekly work planning develops the look-ahead plan into a weekly work plan by presenting
activities in the most detailed level required to drive the production process (Hamzeh and Bergstrom,
2010). Consequently, they contain only tasks that are ready to be performed after thel constraints
associated with performing the planned task has been removed (Patel, 2011).
Percentage Plans Completed (PPC)
PPC is a measure of the proportion of promises made that are delivered on time and it is calculated
in percentage as the number of completed planned activities divided by the total number of planned
activities (Ballard, 1997). The aim of PPC is to learn about planning failures and to measures whether
the planning system is able to reliably anticipate what will actually be done (Patel, 2011)
The Last Planner System has been predominantly implemented in building and infrastructure
projects, with only few case studies recorded for road and highway construction. This is because the
planning and management of road construction generally involved the use of Linear Scheduling
Method (LSM) (Trofin 2004). LSM was developed mainly for scheduling repetitive linear
construction projects, such as roadways, pipelines and rail construction (Song et al, 2008). These
activities are usually positioned in a time and space format, along with the production rates for the
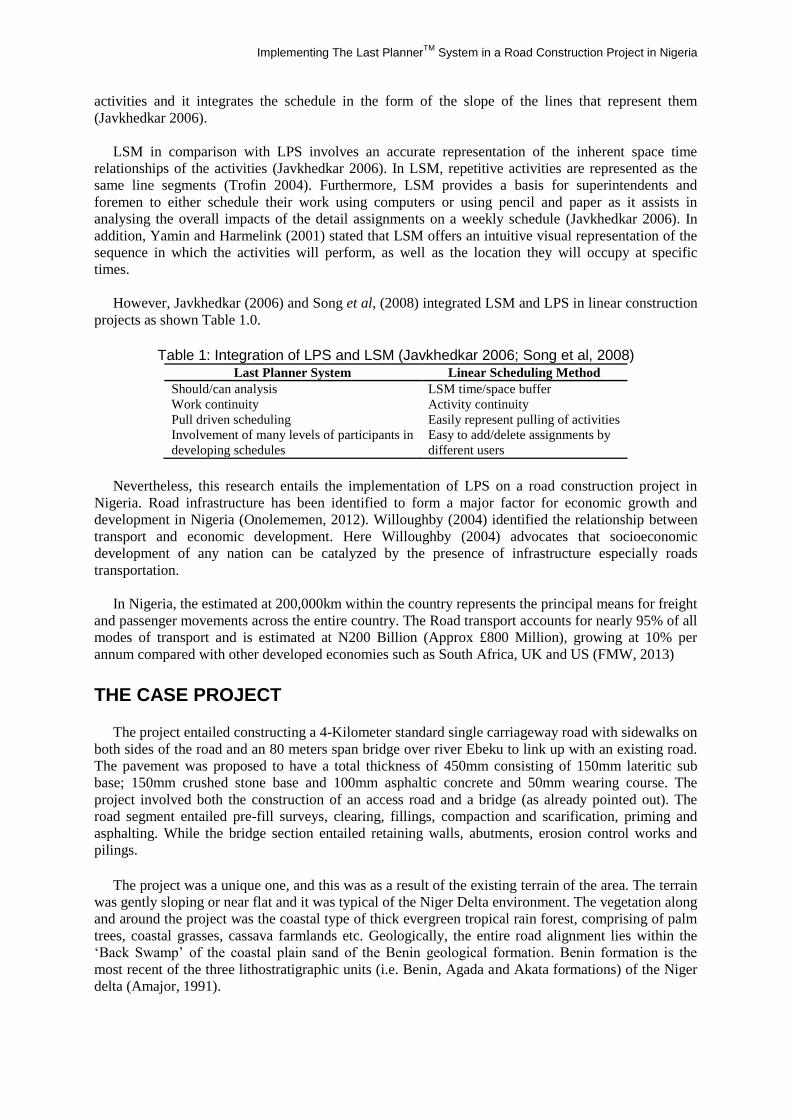
Implementing The Last PlannerTM
System in a Road Construction Project in Nigeria
activities and it integrates the schedule in the form of the slope of the lines that represent them
(Javkhedkar 2006).
LSM in comparison with LPS involves an accurate representation of the inherent space time
relationships of the activities (Javkhedkar 2006). In LSM, repetitive activities are represented as the
same line segments (Trofin 2004). Furthermore, LSM provides a basis for superintendents and
foremen to either schedule their work using computers or using pencil and paper as it assists in
analysing the overall impacts of the detail assignments on a weekly schedule (Javkhedkar 2006). In
addition, Yamin and Harmelink (2001) stated that LSM offers an intuitive visual representation of the
sequence in which the activities will perform, as well as the location they will occupy at specific
times.
However, Javkhedkar (2006) and Song et al, (2008) integrated LSM and LPS in linear construction
projects as shown Table 1.0.
Table 1: Integration of LPS and LSM (Javkhedkar 2006; Song et al, 2008)
Last Planner System Linear Scheduling Method
Should/can analysis LSM time/space buffer
Work continuity Activity continuity
Pull driven scheduling Easily represent pulling of activities
Involvement of many levels of participants in
developing schedules
Easy to add/delete assignments by
different users
Nevertheless, this research entails the implementation of LPS on a road construction project in
Nigeria. Road infrastructure has been identified to form a major factor for economic growth and
development in Nigeria (Onolememen, 2012). Willoughby (2004) identified the relationship between
transport and economic development. Here Willoughby (2004) advocates that socioeconomic
development of any nation can be catalyzed by the presence of infrastructure especially roads
transportation.
In Nigeria, the estimated at 200,000km within the country represents the principal means for freight
and passenger movements across the entire country. The Road transport accounts for nearly 95% of all
modes of transport and is estimated at N200 Billion (Approx £800 Million), growing at 10% per
annum compared with other developed economies such as South Africa, UK and US (FMW, 2013)
THE CASE PROJECT
The project entailed constructing a 4-Kilometer standard single carriageway road with sidewalks on
both sides of the road and an 80 meters span bridge over river Ebeku to link up with an existing road.
The pavement was proposed to have a total thickness of 450mm consisting of 150mm lateritic sub
base; 150mm crushed stone base and 100mm asphaltic concrete and 50mm wearing course. The
project involved both the construction of an access road and a bridge (as already pointed out). The
road segment entailed pre-fill surveys, clearing, fillings, compaction and scarification, priming and
asphalting. While the bridge section entailed retaining walls, abutments, erosion control works and
pilings.
The project was a unique one, and this was as a result of the existing terrain of the area. The terrain
was gently sloping or near flat and it was typical of the Niger Delta environment. The vegetation along
and around the project was the coastal type of thick evergreen tropical rain forest, comprising of palm
trees, coastal grasses, cassava farmlands etc. Geologically, the entire road alignment lies within the
‘Back Swamp’ of the coastal plain sand of the Benin geological formation. Benin formation is the
most recent of the three lithostratigraphic units (i.e. Benin, Agada and Akata formations) of the Niger
delta (Amajor, 1991).

Built Environment Journal Vol. 12, No.2, 33 - 49, 2015
RESEARCH METHOD
The research method used in carrying out this research is a prescriptive kind of research and is
termed Design Science Research (DSR). DSR is a research method used in solving problems faced in
the real world by producing an innovative construction that can make contribution to theory in the area
where it is applied (Lukka, 2003). The basic idea in DSR is that the entire research process is not
linear but generally involves fundamental activities; ‘build’ and ‘evaluate’ (March and Smith, 1995).
‘Build’ here refers to creating things that serve human purposes. While ‘evaluate’ entails evaluating
the performance of what was built.
Similarly, Vaishnavi and Kuechler (2007) indicated that in DSR, knowledge is produced during the
research process and this knowledge strengthens the relevance of an academic research. Consequently,
DSR is a research approach for conducting research in Lean Construction (Formoso et al., 2012). This
is because, Koskela (2008) revealed that to help solve the problem of relevance affecting construction
management as a discipline, other than carrying out explanatory studies in the form of explanatory
science, such studies should be positioned as a design science research. Similarly, Alshehamni et al.,
(2009) and Simeon (1996) points out that in order to connect research and practice while producing
theoretical knowledge, research should be positioned as design science. In view of these, this research
is positioned under the umbrella of DSR.
The research strategy adopted to provide a structure for a plan of actions, which would guide and
govern this research process, is an Action Research strategy. An Action Research (AR) is an
established qualitative research method used for scholarly enquiry by building and testing theories
with a perspective of solving practical problems in a real setting (Azhar 2007). It is usually carried out
within a five phase cyclical process of: diagnosing, action planning, action taking, evaluating and
specifying learning.
Step 1: Diagnosing: This entails analysing the current situation to identify all the problems that
can be derived. It also involves holistically interpreting complex research problems that lead to the
development of theoretical assumptions (Baskerville, 1999; Jang et al., 2011). Within this research
however, diagnosing involved analysing the current state of Nigerian highway construction process. It
was identified that road construction projects and other construction projects are faced with a lot of
challenges.
Step 2: Action planning: This involves setting up plans based on the theoretical assumptions
identified. In this phase, the researcher and practitioners collaborate, specifying the actions that would
improve the problems identified (Azah et al., 2010). The Last Planner System is identified as the tool
to tackle the basic management challenges that usually occur within highway projects.
Step 3: Action taking: For Action taking, the planned action is implemented with a collaboration
of the research and practitioners. These actions result in changes within the organisation (in which the
intervention is carried out) (Baskerville, 1999; Azah et al, 2010). Here the LPS is implemented within
the road construction process. It comprised of five levels of planning processes of: The Master
Schedule, Phase Schedule, Look-ahead planning, Weekly work plans and Percentage Plans Completed
(PPC).
The master plan was the first phase of the production planning system. The objective was to
provide an overall view of the project, and to analyse feasibility of project completion and to display
the execution strategies, demonstrate the feasibility of completing the work within the available time
and identify the important milestones and these milestone schedules are used to divide the project into
logical phases. The duration within these schedules are established in a manner so that those
responsible for the project are confident that the work can be completed as planned
The phase plan involved developing a more detailed work plan and providing the goals that served
as targets to the project team. It basically entailed working backwards from the desired delivery dates,

Implementing The Last PlannerTM
System in a Road Construction Project in Nigeria
scheduling tasks in the reverse order, allowing them to be performed at the last responsible moment,
so as to minimise unnecessary accumulation of work in progress.
Look-ahead planning broke down activities down into the level of processes/operations, so that
possible constraints were identified, responsibilities were assigned, and assignments were made ready
by removing possible constraints.
The Preparation of the weekly work plan was in consultation with the last planner (the researcher
served as the last planner) and it involved negotiating with all project team managers in a meeting to
achieve a plan for each week that contains only tasks that are ready to be performed.
Step 4: Evaluating: The researcher and practitioner critically assess the outcome of implementing
the plan. This includes examining the theoretical effects of executing the plan (Azah et al, 2010).
Percentage Plans Completed (PPC) checks were also used to evaluate the implementation process on a
weekly basis. The aim of the PPC was to measures whether the planning system was able to reliably
anticipate what will actually be done.
Step 5: Specifying learning: This is usually an ongoing process. The accumulated knowledge
gained from the action research is directed to the organisation where the research was carried out and
the scientific community as well. Consequently, where the results are negative and the planned change
is unsuccessful and it also provides a foundation for further research.
RESEARCH ACTIVITIES AT THE SITE
The research plan was to implement Last Planner System in three phases of the project comprising
of 8 weeks of implementation and PPC calculations. These phases are:
Phase 1- clearing and preliminary earthworks; Phase 2- comprehensive earth works and grading;
Phase 3- Priming and asphalting.
At the end of each phase (8 weeks) a comparison and review of the implementation was carried
out. Conversely, during the implementation, the look-ahead schedule and the constraint analysis chart
were used to allow for the anticipation of future needs for materials, equipment and labour. They
ensured tasks were ready to start when required with a certainty of labour, equipment and material
requirements. The constraints identified during the constraint analysis were grouped under eight
categories; contract, designs, submittals and documentation, operations, equipment, labour, weather
and materials. This classification helped facilitate an enhanced co-ordination with the responsible
persons resolving particular constraints identified.
The PPC charts and reasons for non-completion forms on the other hand were used throughout the
implementation process. These reasons for non-completion were also subdivided into eight categories;
contract, designs, submittals and documentation, operations, equipment, labour, weather and materials.
A weekly PPC’s of 8 weeks was measured and is shown in Table 2 to Table 5.
Figures 1 and 2 show the PPC analysis for the first phase, i.e. 8 weeks within the project. At the
end of the phase, a meeting was held to evaluate the implementation process, discussing the lessons
learnt from the implementation.
Table 2: Comparison of 8 weeks of PPC (19/11/12 – 21/01/13)
Start date for
week
No. of completed
tasks
No. of uncompleted
tasks
Total
activities/tasks
PPC
19/11/2012 5 6 11 45%
26/11/2012 8 6 14 57%
03/12/2012 10 4 14 71%

Built Environment Journal Vol. 12, No.2, 33 - 49, 2015
Start date for
week
No. of completed
tasks
No. of uncompleted
tasks
Total
activities/tasks
PPC
10/12/2012 9 6 15 60%
17/12/2012 8 3 11 72%
07/01/2013 8 2 10 80%
14/01/2013 6 1 7 86%
21/01/2013 6 2 8 75%
TOTAL 60 57 90 67%
19/11/2012 26/11/2012 03/12/2012 10/12/2012 17/12/2012 07/01/2013 14/01/2013 21/01/2013
20%
40%
60%
80%
100%
weeks
PP
C’s
Figure 1: Weekly PPC’s for 8 weeks (19/11/12 – 21/01/13)
From the review of the implementation process, it was observed that the involvement of all parties
in the project was crucial for the success of the implementation process. Similarly, the reasons for
incomplete assignments were analysed and documented for corrective actions to be taken during the
next weekly meeting.
Material
0
10
20
30
40
50
Pre-re
quisite
workLabour
supplySubmitt
al Poor
weather
Rework
Equipment
Incomplete
Design
inform
ation
REASONS FOR INCOMPLETE ASSIGNMENTS
Fre
qu
en
cy
of
oc
cu
ran
ce
s
3
8
1518
21
24
38
45
Figure 2: Reasons for incomplete assignments (19/11/12 – 21/01/13)
The reasons for the incomplete assignments within the first phase of 8-weeks are shown in Figure
2. The figure demonstrated that equipment break down was the most frequent reason for incomplete
assignments. This was followed by incomplete design information; a lot of details were not included in
the vertical and horizontal alignments designs. This made it difficult setting-out the project and
calculating the levels for the cut and fill. In the same vein, this led to a lot of rework; which had the
third highest frequency of 24. Other reasons for incomplete assignments included; submittals (late

Implementing The Last PlannerTM
System in a Road Construction Project in Nigeria
request), poor weather and materials unavailability, pre-requite work and labour supply. Although this
analysis for incomplete assignments was limited to the category presented.
Furthermore, weekly PPC’s were calculated for next 16 weeks with an evaluation process carried
out after 8 weeks for the 16th week of the project. The evaluation process basically evaluated the
implementation process with the project team also discussed the lessons learnt from the
implementation. Tables 3 and figure 3 shows the PPC measure for the second phase which
commenced on the 28th of January 2013 till 18
th March 2013. Similarly, Figures 4 showed the reasons
for incomplete assignments within this phase.
Table 3: Comparison of 8 weeks of PPC (28/01/13 – 18/03/13)
Start date for week No. of completed tasks No. of uncompleted tasks Total activities/tasks PPC
28/01/2013 8 3 11 73%
04/02/2013 7 2 9 78%
11/02/2013 9 4 13 69%
18/02/2013 9 3 12 75%
25/02/2013 8 3 11 73%
04/03/2013 10 2 12 83%
11/03/2013 11 4 15 73%
18/03/2013 9 3 12 75%
TOTAL 71 22 93 76%
28/01/201 04/02/2013 11/02/2013 18/02/2013 25/02/2013 04/03/2013 14/03/2013 18/03/2013
20%
40%
60%
80%
100%
Figure 3: Weekly PPC’s for 8 weeks (28/01/13 – 18/03/13)
From Tables 3 and Figures 3 it is observed that the average PPC within this period was 76% which
was a remarkable improvement from the previous evaluation whose PPC was averaged at 67%. In
addition, the highest PPC value of 83% was recorded on the week commencing from the 4th of March
2013, while the lowest PPC value of 69% was recorded on the week of 11th February 2013.
Furthermore, the reasons for the incomplete assignments within these 8-weeks are shown in Figure
4. It was identified that pre-requisite work was the most frequent reason for incomplete assignments
and delays as a result of waiting for a task to be completed before another starts. This was basically
because of the nature of the stage that the project had reached; i.e. this was the stage where most of the
activities were dependent on the earth works. Particularly the compaction of the graded laterite in
layers of 150mm by vibrating rollers; the compactor had to wait for the stock-piled materials to be
spread along the road. However the site engineer had to stockpile the laterite materials to avoid
setbacks experienced from community disturbances being experienced during haulage of the laterite
materials.
In the same vein, the compacted surfaces had to be scarified and compacted over and over again
and this rework was affecting the completion of assignments planed. This rework was also recorded in
Figure 4 as the second highest percentage of uncompleted assignments. The third reason given was the

Built Environment Journal Vol. 12, No.2, 33 - 49, 2015
un-availability of materials. This was because of community disturbances from the youths around a
neighbouring community; this community was the only access to the project site and suppliers
delivering materials to the site were delayed until government officials had to step in to resolve the
situation.
The fourth major reason for incomplete assignments was equipment break down. This was
followed by incomplete design information; especially during the construction of the side drains which
was carried out within this phase. Similarly, details of the fill levels were not indicated hence the
surveyors had to establish one. Other reasons for incomplete assignments included; poor weather,
submittals (late request) and labour supply.
Material
0
10
20
30
40
50
Pre-re
quisite
workLabour
supply
Submittal Poor
weather
Rework
Equipment
Incomplete
Design
inform
ation
REASONS FOR INCOMPLETE ASSIGNMENTS
Fre
qu
en
cy
of
oc
cu
ran
ce
s
58
10
2125
3537
40
Figure 4: Reasons for incomplete assignments (28/01/13 – 18/03/13)
Finally, for the remaining 8 weeks to make up 24 weeks of the LPS implementation weekly PPC’s
were calculated and an evaluation carried out at the end of the 8 weeks. The project team discussed the
lessons learnt from the implementation and evaluated the entire implementation process. Tables 5 and
Figure 5 shows the PPC measure for week commencing on 25th March 2013 to week commencing 13
th
May 2013 while Figure 6 shows the reasons for incomplete assignments.
Table 4: Comparison of 8 weeks of PPC (25/03/13 – 13/05/13)
Start date for
week
No. of completed
tasks
No. of uncompleted
tasks
Total
activities/tasks
PPC
25/03/2013 9 3 12 75%
01/04/2013 8 2 10 80%
08/04/2013 7 2 9 78%
15/04/2013 6 3 9 67%
22/04/2013 5 1 6 83%
29/04/2013 5 2 7 71%
06/05/2013 6 2 8 75%
13/05/2013 7 1 8 88%
TOTAL 53 16 69 77%

Implementing The Last PlannerTM
System in a Road Construction Project in Nigeria
25/03/201 01/04/2013 08/04/2013 15/04/2013 22/04/2013 29/04/2013 06/05/2013 13/05/2013
20%
40%
60%
80%
100%
Figure 5: Weekly PPC’s for 8 weeks (25/03/13 – 13/05/13)
From comparison of the 8 weeks PPC in Tables 5 and the chart of the weekly PPC’s in figures 5 it
is observed that the average PPC within this period is 77%. This stage of the project had just rounded
up earth works while priming and asphalting commenced. It was recorded that the highest PPC value
of 88% was recorded on the week commencing from the 13th May 2013. Major activities carried out
within that week were the pavement works consisting of lateritic sub base, crushed stone base and
asphaltic concrete. However, the lowest PPC value of 67% was recorded on the week of 15th April
2013; the major setback on the project within that week was poor weather. The reasons for the
incomplete assignments within these 8-weeks are shown in Figure 6.
Material
0
10
20
30
40
50
Pre-requisite
workLabour
supplySubmitta
l Poor
weatherRework
Equipment
Incomplete
Design
informatio
n
REASONS FOR INCOMPLETE ASSIGNMENTS
Fre
qu
ency
of
occ
ura
nce
s
245
1415
25
31
36
Figure 6: Reason for incomplete assignments (25/03/13 – 13/05/13)
The reasons for the incomplete assignments were captured in Figure 6. It was observed that poor
weather was the major reason for incomplete assignments within this phase and it had a chain effect of
affecting pre-requisite work. The rains poured out heavily and caused most of the tasks to be
suspended and this resulted in workers waiting for task to be completed before another starts.
Similarly, submittal (late request) was the third highest reasons for incomplete assignments; and it
resulted in delays as requests were submitted too late for decisions to be made that would enable
particular activities to start on time.
The fourth major reason for incomplete assignments was equipment break down. This was
followed by incomplete design information; especially while constructing the pavements. Other
reasons for incomplete assignments included; defects requiring rework, material unavailability and
labour supply.
FINDINGS

Built Environment Journal Vol. 12, No.2, 33 - 49, 2015
Observation: It was revealed from the initial observations that there was no set out procedure for
managing site activities. The site engineer gathered the project team every morning to assign work
packages on a day to day basis. The back drop to this arrangement was that operators, subcontractors
and suppliers did not know ahead of time what was planned out. This caused series of delays in the
start-up process of the project. Nevertheless, it was observed that team-working was very evident at
the site and responsibilities were well shared among the project team.
Interviews: From the interviews carried out, it was noticed that there was no planning technique in
place. The answers to the interviews provided a comprehensive account of the organisation’s project
management practice and it was revealed that the project manager and the management team were
motivated. They were made up of professionals who had good experience on road construction and a
little knowledge of project management concepts with no awareness of Lean construction.
Furthermore, it was also identified that there was no special communication tool such Walkie Talkies
or ICT tools (such emails and intranet or internet communication) was available for the project. The
project team relied on mainly on verbal communication. Finally, meetings were held daily before start
of work at site to brief the operators of their tasks and management meetings were held if any issues
went wrong within the site.
Implementation: During the implementation of the last planner system, a lot of data was gathered
and different forms were completed on site by the project team, and these forms include the look-
ahead schedule, constraints analysis charts, PPC chart and the reason for non-completion forms. The
implementation occurred in three phases of 8 weeks per phase.
The average PPC’s for the entire implementation period was 73%, with the highest PPC at 88%
and the lowest at 45%.
100%
weeks
PPC’s
20%
40%
60%
80%
Phase 1
Phase 2
Phase 3
2 4 6 8 10 12 14 16 18 20 22 24
Figure 7: Comparison of Weekly PPC’s for the three phases
From the assessment as depicted in Figure 7, after the PPC’s stabilised for Phase 2 and Phase 3, the
project participants became familiar with the implementation process. They showed great enthusiasm
to learn and improve the project hence improvements recorded in phase 2 and 3. Similarly in phase 1,
it was observed that after 2 weeks of PPC calculations, the project team was ready to keep their
commitments and improve the project performance.

Implementing The Last PlannerTM
System in a Road Construction Project in Nigeria
Similarly, a comparison of the reasons for incomplete weekly assignments were analysed for each
phase and further compared for the entire project duration. This is depicted in Figure 6.16. From the
analysis, it is observed that equipment breakdown was the major reason for incomplete assignment for
the 3 phases of 24-weeks recorded. It had a total frequency of 85 occurrences. This is because during
any road construction project in Nigeria, plants and equipment are the main items used in carrying out
the project. Hence, when equipment and plants breakdown or are unavailable, there is a chain effect on
the project program and outcome.
0
10
20
30
40
50
Fre
qu
en
cy
of
oc
cu
ran
ce
s
3
8
15
1821
24
38
45
Pre-requisite
work
40
3637
31
Rework Material
35
Submittal
25
Equipment
25
15
Incomplete
Design
information
21
14
Poor
weather
10
5
8
4
Labour
supply
52
85 7379
66
51
67 54
10
PHASE 1 PHASE 2 PHASE 3
Summation of the
frequencies for the 3
phases
Figure 8: Reasons for incomplete assignment for the three phases
In the same vein, a road construction project is linear in nature; hence it is mandatory that some
tasks have to be completed before others start. For examples, asphalting will only commence after the
road section to be asphalted has been primed, and priming will only take place and all earthworks has
been completed. Similarly, the earthwork depends on clearing and setting out of the road. All of these
indicate the importance of pre-requisite work and pre-requisite work was observed to be the second
most recurrent reason for incomplete assignments throughout the entire project implementation period,
with a total frequency of 79.
Furthermore, incomplete design information was the third most frequent reason, with a frequency
of 73. It was observed that three weeks into commencement of the project, the working drawings and
specifications were not ready. The contractor had to wait for the consultants to furnish them with the
specifications of the vertical and horizontal alignments. This however caused most of the planned
assignments not to be completed.
The fourth was poor weather. This was a major reason for incomplete assignments during the third
phase of the implementation. The poor weather was mainly excessive rainfalls resulting in flooding of
the road sections, caused most of the planned work to be suspended. Most graded sections were
scarified and re-graded which was counted as rework. Hence rework was recorded as the fifth most
frequent reason for incomplete assignment throughout the entire implementation period.
Additionally, community disturbances caused material unavailability within the second phase of
the 24 weeks of the full implementation period. This material unavailability reoccurred 54 times as
reasons for incomplete assignments. While, submittals i.e. sending in late requests for materials and
equipment resulted in the sixth most frequent reason for incomplete assignments and labour supply
was the lowest reason for incomplete assignment; because equipment’s were mainly relied upon to
carry out majority of the tasks.
Questionnaires: The survey questionnaires were administered to the entire project participants to
evaluate the LPS implementation process. The respondents to the question included the main

Built Environment Journal Vol. 12, No.2, 33 - 49, 2015
contractor team, the consultants, the subcontractors and suppliers. Each questionnaire was divided into
four sections (A-D) with section A focusing on the overview of the implementation. Section B dwelt
on the barriers of the implementation, while the section C focused on the critical success factors of the
LPS and the finally section D concentrated on the benefits gained from the LPS process. Tables 5.1 to
Table 5.4 illustrate the results from the questionnaire surveys.
Tables 5.1: Overview of the LPS implementation
Tables 5.2: Barriers of the LPS implementation
Tables 5.3: Critical Success factors of the LPS implementation
Reasons weighting frequency (f)
1 2 3 4 5 Σf χ RII Rank % Rating
1 LPS was effective 0 0 0 13 6 19 4.31 0.86 3rd 100%
2 Results obtained were
satisfactory
0 0 0 4 15 19 4.79 0.95 2nd 100%
3 WWP & PPC was useful 0 0 0 2 17 19 4.89 0.98 1st 100%
4 difficulty in carrying out the
implementation
5 10 3 1 0 19 2.00 0.40 4th 5%
Barriers weighting frequency (f)
1 2 3 4 5 Σf χ RII Rank % Rating
1 Poor supervision & quality
control
0 2 4 12 1 19 3.63 0.73 5th 68%
2 Fluctuations & variation 0 4 8 6 1 19 3.21 0.64 6th 37%
3 Subcontractors involvement 0 2 5 9 3 19 3.68 0.74 4th 63%
4 Resistance to change 0 0 6 10 3 19 3.84 0.77 3rd 68%
5 Cultural issues 0 0 1 13 5 19 4.21 0.86 1st 95%
6 Lengthy approval 0 0 2 9 8 19 4.31 0.84 2nd 89%
Barriers weighting frequency (f)
1 2 3 4 5 Σf χ RII Rank % Rating
1 Training & empowering last
planners
0 0 0 15 4 19 4.21 0.84 3rd 100%
2 Team work 0 0 3 15 1 19 3.89 0.78 6th 84%
3 Motivating people to make changes 0 0 0 9 10 19 4.52 0.90 2nd 100%
4 Appropriate human capital 0 2 5 8 4 19 3.74 0.75 7th 63%
5 Top management support 0 0 0 8 11 19 4.58 0.92 1st 100%
6 Managing resistance to change 0 2 3 8 6 19 3.95 0.79 5th 74%
7 Close relationship with suppliers 0 0 1 16 2 19 4.05 0.81 4th 95%

Implementing The Last PlannerTM
System in a Road Construction Project in Nigeria
Tables 5.4: Benefits of the LPS implementation
The findings from the questionnaire on the overview of the implementation revealed that the
respondents were in agreement that the LPS implementation was Useful, Satisfactory and Effective,
with only few respondents indicating that they experienced difficulty in carried out the
implementation. For the questionnaire response on the barriers during the implementation, lengthy
approval ranked first as the main barrier, this was followed by cultural issues, then resistance to
change and subcontractors. While poor supervision and quality control ranked fifth. The sixth barrier
was fluctuation and variation.
The findings from the Critical Success factors (CSF) indicates that most identified important CSFs
are Top management support, Motivating people to make changes and Training and empowering Last
planners. While the respondents indicated that the main benefits recorded from the implementation
are: Reduces bad news, Completes projects on schedule, Stabilises projects, Projects are safer, faster
and within cost.
CONCLUSION
This LPS implementation has shown that LPS, which is rarely implemented in a linear process like
a road construction process, could enhance construction management practice in an environment
which differs from places where it has been previously implemented and characterised predominantly
by poor quality, cost and time overruns.
On the whole LPS had a significant and positive impact on the project management process of the
road project by enhancing planning practice, improving site logistics, removing constraints before they
became obstacles and improving the entire site management.
Nevertheless, during the LPS implementation obstacles were encountered and these prevented the
achievement of the full potential of the LPS implementation. Some of the obstacles include: cultural
issues, lengthy approvals, resistance to change, sub-contractors involvement, supervision and quality
control, fluctuation and variations. Besides its contribution in improving the project management
practice within the study organisation, it has contributed to construction management by illustrating
that irrespective of the nature of the construction project or the environment within which the project
is occurring, the LPS can still be successfully implemented to record improvements.
Furthermore, the results from this case project can be used as a reference for organisations in
Nigeria which look forward to improving their managerial practice. The study also suggest that
Barriers weighting frequency (f)
1 2 3 4 5 Σf χ RII Rank % Rating
1 Solve problems on time 0 1 7 4 7 19 3.89 0.78 7th 57%
2 Reduces bad news 0 0 0 10 9 19 4.47 0.89 1st 100%
3 Reducing load on
management
0 0 1 8 7 16 3.68 0.74 9th 95%
4 Predictable & reliable
work plan
1 1 3 7 7 19 3.95 0.79 6th 74%
5 Projects are safer,
faster and within cost
0 0 2 11 6 19 4.21 0.84 4th 90%
6 Stabilises projects 0 0 1 9 9 19 4.42 0.88 3rd 95%
7 Improves logisitics 1 1 3 9 5 19 3.84 0.77 8th 74%
8 Improves predictions
of labour
1 2 3 9 4 19 3.68 0.74 9th 68%
9 Reduces risks 0 3 0 10 6 19 4.00 0.80 5th 84%
10 completes project on
schedule
0 0 0 10 9 19 4.47 0.89 1st 100%
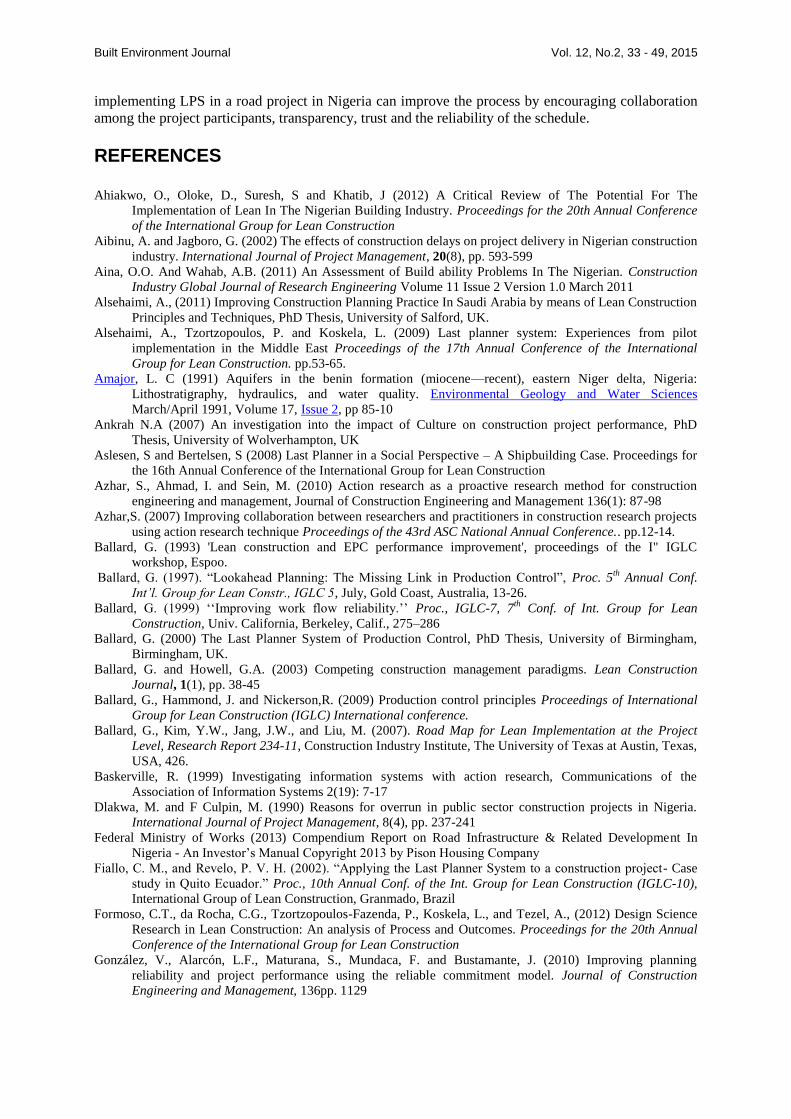
Built Environment Journal Vol. 12, No.2, 33 - 49, 2015
implementing LPS in a road project in Nigeria can improve the process by encouraging collaboration
among the project participants, transparency, trust and the reliability of the schedule.
REFERENCES
Ahiakwo, O., Oloke, D., Suresh, S and Khatib, J (2012) A Critical Review of The Potential For The
Implementation of Lean In The Nigerian Building Industry. Proceedings for the 20th Annual Conference
of the International Group for Lean Construction
Aibinu, A. and Jagboro, G. (2002) The effects of construction delays on project delivery in Nigerian construction
industry. International Journal of Project Management, 20(8), pp. 593-599
Aina, O.O. And Wahab, A.B. (2011) An Assessment of Build ability Problems In The Nigerian. Construction
Industry Global Journal of Research Engineering Volume 11 Issue 2 Version 1.0 March 2011
Alsehaimi, A., (2011) Improving Construction Planning Practice In Saudi Arabia by means of Lean Construction
Principles and Techniques, PhD Thesis, University of Salford, UK.
Alsehaimi, A., Tzortzopoulos, P. and Koskela, L. (2009) Last planner system: Experiences from pilot
implementation in the Middle East Proceedings of the 17th Annual Conference of the International
Group for Lean Construction. pp.53-65.
Amajor, L. C (1991) Aquifers in the benin formation (miocene—recent), eastern Niger delta, Nigeria:
Lithostratigraphy, hydraulics, and water quality. Environmental Geology and Water Sciences
March/April 1991, Volume 17, Issue 2, pp 85-10
Ankrah N.A (2007) An investigation into the impact of Culture on construction project performance, PhD
Thesis, University of Wolverhampton, UK
Aslesen, S and Bertelsen, S (2008) Last Planner in a Social Perspective – A Shipbuilding Case. Proceedings for
the 16th Annual Conference of the International Group for Lean Construction
Azhar, S., Ahmad, I. and Sein, M. (2010) Action research as a proactive research method for construction
engineering and management, Journal of Construction Engineering and Management 136(1): 87-98
Azhar,S. (2007) Improving collaboration between researchers and practitioners in construction research projects
using action research technique Proceedings of the 43rd ASC National Annual Conference.. pp.12-14.
Ballard, G. (1993) 'Lean construction and EPC performance improvement', proceedings of the I" IGLC
workshop, Espoo.
Ballard, G. (1997). “Lookahead Planning: The Missing Link in Production Control”, Proc. 5th
Annual Conf.
Int’l. Group for Lean Constr., IGLC 5, July, Gold Coast, Australia, 13-26.
Ballard, G. (1999) ‘‘Improving work flow reliability.’’ Proc., IGLC-7, 7th Conf. of Int. Group for Lean
Construction, Univ. California, Berkeley, Calif., 275–286
Ballard, G. (2000) The Last Planner System of Production Control, PhD Thesis, University of Birmingham,
Birmingham, UK.
Ballard, G. and Howell, G.A. (2003) Competing construction management paradigms. Lean Construction
Journal, 1(1), pp. 38-45
Ballard, G., Hammond, J. and Nickerson,R. (2009) Production control principles Proceedings of International
Group for Lean Construction (IGLC) International conference.
Ballard, G., Kim, Y.W., Jang, J.W., and Liu, M. (2007). Road Map for Lean Implementation at the Project
Level, Research Report 234-11, Construction Industry Institute, The University of Texas at Austin, Texas,
USA, 426.
Baskerville, R. (1999) Investigating information systems with action research, Communications of the
Association of Information Systems 2(19): 7-17
Dlakwa, M. and F Culpin, M. (1990) Reasons for overrun in public sector construction projects in Nigeria.
International Journal of Project Management, 8(4), pp. 237-241
Federal Ministry of Works (2013) Compendium Report on Road Infrastructure & Related Development In
Nigeria - An Investor’s Manual Copyright 2013 by Pison Housing Company
Fiallo, C. M., and Revelo, P. V. H. (2002). “Applying the Last Planner System to a construction project- Case
study in Quito Ecuador.” Proc., 10th Annual Conf. of the Int. Group for Lean Construction (IGLC-10),
International Group of Lean Construction, Granmado, Brazil
Formoso, C.T., da Rocha, C.G., Tzortzopoulos-Fazenda, P., Koskela, L., and Tezel, A., (2012) Design Science
Research in Lean Construction: An analysis of Process and Outcomes. Proceedings for the 20th Annual
Conference of the International Group for Lean Construction
González, V., Alarcón, L.F., Maturana, S., Mundaca, F. and Bustamante, J. (2010) Improving planning
reliability and project performance using the reliable commitment model. Journal of Construction
Engineering and Management, 136pp. 1129
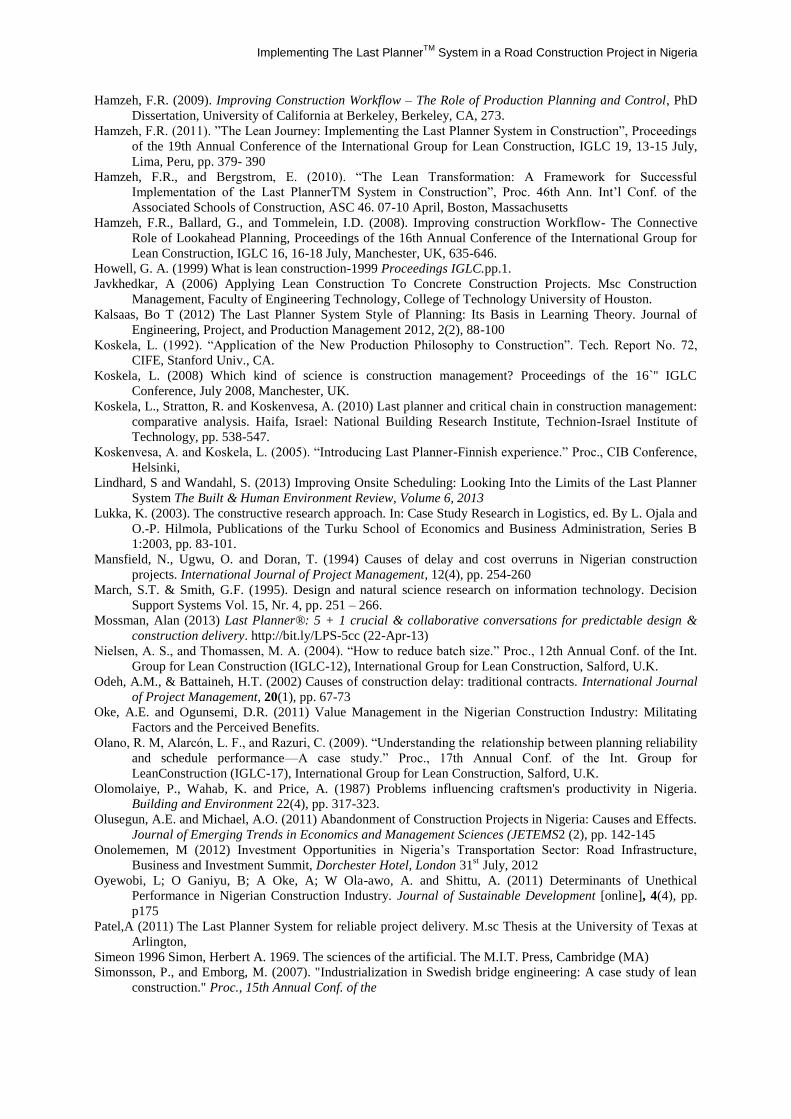
Implementing The Last PlannerTM
System in a Road Construction Project in Nigeria
Hamzeh, F.R. (2009). Improving Construction Workflow – The Role of Production Planning and Control, PhD
Dissertation, University of California at Berkeley, Berkeley, CA, 273.
Hamzeh, F.R. (2011). ”The Lean Journey: Implementing the Last Planner System in Construction”, Proceedings
of the 19th Annual Conference of the International Group for Lean Construction, IGLC 19, 13-15 July,
Lima, Peru, pp. 379- 390
Hamzeh, F.R., and Bergstrom, E. (2010). “The Lean Transformation: A Framework for Successful
Implementation of the Last PlannerTM System in Construction”, Proc. 46th Ann. Int’l Conf. of the
Associated Schools of Construction, ASC 46. 07-10 April, Boston, Massachusetts
Hamzeh, F.R., Ballard, G., and Tommelein, I.D. (2008). Improving construction Workflow- The Connective
Role of Lookahead Planning, Proceedings of the 16th Annual Conference of the International Group for
Lean Construction, IGLC 16, 16-18 July, Manchester, UK, 635-646.
Howell, G. A. (1999) What is lean construction-1999 Proceedings IGLC.pp.1.
Javkhedkar, A (2006) Applying Lean Construction To Concrete Construction Projects. Msc Construction
Management, Faculty of Engineering Technology, College of Technology University of Houston.
Kalsaas, Bo T (2012) The Last Planner System Style of Planning: Its Basis in Learning Theory. Journal of
Engineering, Project, and Production Management 2012, 2(2), 88-100
Koskela, L. (1992). “Application of the New Production Philosophy to Construction”. Tech. Report No. 72,
CIFE, Stanford Univ., CA.
Koskela, L. (2008) Which kind of science is construction management? Proceedings of the 16`'' IGLC
Conference, July 2008, Manchester, UK.
Koskela, L., Stratton, R. and Koskenvesa, A. (2010) Last planner and critical chain in construction management:
comparative analysis. Haifa, Israel: National Building Research Institute, Technion-Israel Institute of
Technology, pp. 538-547.
Koskenvesa, A. and Koskela, L. (2005). “Introducing Last Planner-Finnish experience.” Proc., CIB Conference,
Helsinki,
Lindhard, S and Wandahl, S. (2013) Improving Onsite Scheduling: Looking Into the Limits of the Last Planner
System The Built & Human Environment Review, Volume 6, 2013
Lukka, K. (2003). The constructive research approach. In: Case Study Research in Logistics, ed. By L. Ojala and
O.-P. Hilmola, Publications of the Turku School of Economics and Business Administration, Series B
1:2003, pp. 83-101.
Mansfield, N., Ugwu, O. and Doran, T. (1994) Causes of delay and cost overruns in Nigerian construction
projects. International Journal of Project Management, 12(4), pp. 254-260
March, S.T. & Smith, G.F. (1995). Design and natural science research on information technology. Decision
Support Systems Vol. 15, Nr. 4, pp. 251 – 266.
Mossman, Alan (2013) Last Planner®: 5 + 1 crucial & collaborative conversations for predictable design &
construction delivery. http://bit.ly/LPS-5cc (22-Apr-13)
Nielsen, A. S., and Thomassen, M. A. (2004). “How to reduce batch size.” Proc., 12th Annual Conf. of the Int.
Group for Lean Construction (IGLC-12), International Group for Lean Construction, Salford, U.K.
Odeh, A.M., & Battaineh, H.T. (2002) Causes of construction delay: traditional contracts. International Journal
of Project Management, 20(1), pp. 67-73
Oke, A.E. and Ogunsemi, D.R. (2011) Value Management in the Nigerian Construction Industry: Militating
Factors and the Perceived Benefits.
Olano, R. M, Alarcón, L. F., and Razuri, C. (2009). “Understanding the relationship between planning reliability
and schedule performance—A case study.” Proc., 17th Annual Conf. of the Int. Group for
LeanConstruction (IGLC-17), International Group for Lean Construction, Salford, U.K.
Olomolaiye, P., Wahab, K. and Price, A. (1987) Problems influencing craftsmen's productivity in Nigeria.
Building and Environment 22(4), pp. 317-323.
Olusegun, A.E. and Michael, A.O. (2011) Abandonment of Construction Projects in Nigeria: Causes and Effects.
Journal of Emerging Trends in Economics and Management Sciences (JETEMS2 (2), pp. 142-145
Onolememen, M (2012) Investment Opportunities in Nigeria’s Transportation Sector: Road Infrastructure,
Business and Investment Summit, Dorchester Hotel, London 31st
July, 2012
Oyewobi, L; O Ganiyu, B; A Oke, A; W Ola-awo, A. and Shittu, A. (2011) Determinants of Unethical
Performance in Nigerian Construction Industry. Journal of Sustainable Development [online], 4(4), pp.
p175
Patel,A (2011) The Last Planner System for reliable project delivery. M.sc Thesis at the University of Texas at
Arlington,
Simeon 1996 Simon, Herbert A. 1969. The sciences of the artificial. The M.I.T. Press, Cambridge (MA)
Simonsson, P., and Emborg, M. (2007). "Industrialization in Swedish bridge engineering: A case study of lean
construction." Proc., 15th Annual Conf. of the

Built Environment Journal Vol. 12, No.2, 33 - 49, 2015
Song, L., Liang, D., and Javkhedkar, A. (2008). “A case study on applying lean Group for Lean Construction
(IGLC-15), International Group of Lean Construction, East Lansing, MI.
Thomas, H.R.; M.J. Horman; Minchin Jr, R.E. and D Cheng (2003) Improving labor flow reliability for better
productivity as lean construction principle. Journal of Construction Engineering and Management,
129pp. 251
Tommelein, I.D. and Ballard, G. (1997). “Look-ahead Planning: Screening and Pulling.” Technical Report No.
97-9, Construction Engineering and Management Program, Civil and Environmental Engineering
Department, University of California, Berkeley, CA, USA.
Trofin, I (2004) Impact of Uncertainty On Construction Project Performance Using Linear Scheduling. Msc
Thesis Building Construction University Of Florida
Vaishnavi and Kuechler 2007 Vaishnavi, V. & Kuechler, B. 2007. Design Research in Information Systems.
Available at http://www.isworld.org/Researchdesign/drisISworld.htm
Willoughby, C. (2004) Infrastructure and the Millennium Development Goals: Complementarity of
Infrastructure for Achieving the Millennium Development Goals. Berlin: United Nations, 2004. 1-33.
Windapo, A. and Martins, O. (2010) An investigation into Nigerian property construction companies’ perception
of critical risk. Insurance Markets and Companies: Analyses and Actuarial Computations, Volume 1,
Issue 1, 2010
Yamin, R.A. and Harmelink, D.J (2001). Comparison of linear scheduling method (LSM) and critical path
method (CPM), Journal of Construction Engineering and Management, ASCE, 127 (5), 374-381.

Impact of Procurement Methods and Project Types on Construction Projects Performance
Impact of Procurement Methods and Project Types on Construction Projects Performance
Jimoh Richard1*
, Oyewobi Luqman2 and Aliu Nurayn
3
1,3Building Department, Federal University of Technology, Minna-Nigeria
2Quantity Surveying Department, Federal University of Technology, Minna-Nigeria
ABSTRACT
Procurement systems provide the general framework and organisation of line of
responsibilities for stakeholders within the construction process. It is a major contributor to
client satisfaction in achieving successful completion of projects. This paper focused on
examining the impact of different procurement methods and project types on performance of
construction projects. The research employed a quantitative approach using structured
questionnaires to elicit information from 420 stakeholders in the Nigerian construction industry.
The relationship between project types and procurement systems was established as well as their
influence on project delivery. The data were analysed and discussed. The results showed that
there is correlation between procurement methods and factors used in assessing project success,
while no relationship exists between procurement methods and project type. The implication is
that cost, time and quality are factors affecting the selection of procurement methods.
Keywords: Construction project; procurement methods; project performance; project types;
Nigeria
INTRODUCTION
The construction industry globally is highly fragmented; therefore the coming together of participants
in the building process on an ad hoc basis has significant effect on project delivery and performance.
Hence, the obvious separation of clients, main or general contractors and subcontractors requires an
arrangement to procure the projects and establish authorities between the stakeholders for construction
work to commence (Gruneberg and Hughes, 2006). Since Emerson’s (1962) and Latham’s (1994) reports
have been published, the need to implement procurement methods in building process has heightened.
However, evidence from the literature indicates that though there are many distinct methods available for
realising construction projects, but in practice only a relatively few procurement methods are employed
(Love et al., 1998; Masterman, 1992; Ng, Luu and Chen, 2002).
Broadly, construction procurement systems are classified as traditional and non-traditional
procurement systems (Harris & McCaffer, 2005). For a very long time in the UK, traditional
construction procurement system has been the major route for procuring constructed facilities after the
industrial revolution, and to date, it remains the foremost procurement system in the UK (Saad, Jones
and James, 2002; Royal Institution of Chartered Surveyors (RICS), 2007). This option appears as the
most preferred system of procuring construction project by client who is involved in the construction
process. The continued increase in the complexity of buildings, the need to manage project finance,
the need to reduce design coupled with the need to have constructed facilities realised faster without
compromising the client objectives has resulted in the decline in the use of the traditional procurement
system to procure building works across the globe (Love et al., 1998; Maizon, 1996). Xue, Wang,
Shen and Yu (2007) and Eriksson, Nilsson and Atkin (2008) advanced the reasons for this decline to
include acrimonious relationship which often leads to conflicts and disputes; poor collaboration among
parties, poor focus on customers’ needs, and incessant failure to meet clients’ requirements which
have become prevalent in the construction industry.

Built Environment Journal Vol. 12, No.2, 50 - 60, 2015
Literature on research that examined procurement systems in the Nigerian construction industry
established that both traditional and non-traditional procurement options are being practised in the
industry (Babatunde et al., 2010; Ibrahim, Daniel and Ahmad, 2014). However, traditional procurement
method is more popular in the Nigerian construction industry than the non-traditional, while the use of
traditional construction procurement option in the industry accounts for most of the projects
underperformance in terms of cost and time (Ojo et al., 2006; Ibrahim et al., 2014). As a result of this and
the demand for suitable procurement method to be employed in achieving successful projects to reduce
the impact of time overruns, poor quality and cost overruns of construction projects on the growth and
performance of the construction industry, other procurement systems have been explored.
Considering the plurality of research in the industry that investigates procurement systems being used
in the Nigerian construction industry, none of them examines the influence of procurement methods and
project types on performance (time, quality and cost) in Nigeria. To achieve this aim, the research
presented in this paper addresses the following hypotheses:
There is statistical significant relationship between the different types of procurement methods
available for procuring building projects and the various project types.
There is statistical significant relationship between the different types of procurement methods
available for procuring building projects and project success criteria.
There is significant relationship between project performance measures (cost and time
overruns) and different procurement methods.
OBJECTIVE PERFORMANCE OF THE VARIOUS PROCUREMENT METHODS
The construction industry professionals will be able to produce any project with any procurement method, if given unlimited time and cost resources and the client not being too enthusiastic
about quality requirement. However, because of cost of finance and advantages in putting the building
into early use, particularly by the private developers, clients have to impose limits on cost and time, and
must be satisfied with the quality of the building (Naoum and Langford, 1987). Hence construction
industry professionals have resorted to using the ‘appropriate’ procurement method to achieve the
constraints imposed by the client. Naoum and Langford (1987) opined that the use of appropriate
procurement method can define the project’s success on cost, time and quality objectives. Construction
project may be considered as being successful if the constructed facility is delivered on time, within the
estimated cost and quality standards, and meets the client high level of satisfaction (e.g. Cookie-Davies,
2002; Naoum and Langford, 1987). Construction projects performance is a function of meeting client’s
need and satisfaction with regards to the roles and responsibilities of participants engaged in the
construction process (Gruneberg and Hughes, 2006). This is the desire of many construction clients, but
the project performance considered in this paper is measured against the widespread and traditional
measures of performance based on the iron-triangle of cost, time and quality (Cookie-Davies, 2002).
However, Masterman (1992) argued that the approach being used by many construction project clients
and their professional advisors in selecting the procurement methods can be haphazard, ill-timed and
illogical. Therefore, wrong choice or inappropriate usage of suitable procurement options has been
established to be one of the main problems of project performance and successful completion. Although,
each procurement method exhibits different characteristics, have distinctive benefit and inherent
disadvantages, but ‘one-cap-fits-all’ does not exist as there is no single best system that could suit all
kinds of clients and projects (Ng et al., 2002). This research thus investigates which procurement method
is more appropriate for different project types and what is their performance effect in meeting client’s
objectives in terms of cost, time and quality.
METHODS

Impact of Procurement Methods and Project Types on Construction Projects Performance
This research employs quantitative research approach using structured questionnaires to elicit
information as it has been successfully employed in previous similar studies (e.g. OJo & Ikpo, 2013).
However, a number of researchers have acknowledged that survey questionnaire as a method of obtaining
information often suffers from poor response rate, but it permits views from a wide range of credible
participants to be elicited (e.g. Bryman, 2008). The list of active professionals and contractors on the
register of relevant professional bodies in Abuja (Federal Capital Territory) were obtained amounting to
551 using formula technique to determine the minimum sample size (see Table 1). Thus, 551
questionnaires were self-administered using simple random sampling among main contractors,
consultants, and clients (construction professionals working in client organisations), and of these, 420
were returned and used for the analyses. In an effort to obtain and ensure the credibility of the results, the
questionnaires were administered to the participants with over five years’ experience and who are actively
involved in construction procurements in their respective organisations. This criterion was unambiguously
stated in the request for information notice provided in the survey questionnaire. Nonetheless, the authors
were unable to determine if this requirement in any way influence the response rate obtained, but the
desire to get experienced participants that have requisite knowledge and to ensure that credible responses
prevailed. This high response rate of 76.2% was possible because of the self-administration of the
questionnaires and the series of follow-ups on phone and mails. A period of six (6) months was used in
the administration of the questionnaires. The data obtained were analysed using correlation and regression
methods of analyses to establish relationship and at the same time test the hypotheses.
Table 1: Sample size derivation table
S/No Description Of
Population
Population Source Of Population Sample Size At
95% Confidence
Level
CONSULTANTS
1 Architects 64 Nigeria Institute of Architects,
Abuja Chapter
56
2 Structural
Engineers
58 Council for the regulation of
engineering in Nigeria
51
3 Quantity
Surveyors
76 Nigeria Institute of Quantity
Surveyors, Abuja Chapter
64
4 Electrical &
Mechanical
Engineers
51 Council for the regulation of
engineering in Nigeria
46
CONTRACTOR
5 Contractors 200 Federal Ministry of Works
Registration Board
134
CLIENTS
6 Federal Ministries 57 Federal Ministry of
Information
50
7 FCT local
councils/
Municipal
Authority
16 Federal Capital Authority 16
8 Corporate/
financial
Institutions
127 Corporate affairs commission 97
9 Private
individuals/
private developers
48 Corporate affairs commission
and Federal inland revenue
service
43
Total Questionnaires distributed 557
RESULTS AND DISCUSSION
Table 2 provides the breakdown of the 551 administered and 420 returned questionnaires. Of 134, 206
and 211 questionnaires that were self-administered to contractors, clients and consultants in building

Built Environment Journal Vol. 12, No.2, 50 - 60, 2015
projects in Abuja, 132, 180 and 108 questionnaires were returned from contractors, clients and consultants
respectively, giving a total of 420 questionnaires returned.
Table 2 also reveals the length of time or the period the respondents have been operating in the
Nigerian construction industry. The respondents that have spent 20-25 years have the highest
percentage of 42.8% with a response count of 180 followed by those that have spent 15-20 years with
a response count of 84 representing 17.9%. The newest staff members that have been there for 5-10
years have the least response count of just 24 with 5.1%. On the other hand, the respondents that are
oldest in the industry, spending 31 years and above have a response count of 60 accounting for 12.8%
of the total respondents. In general, most of the respondents have at least five years working
experience in the construction industry. Based on the number of years spent in the construction
industry, majority of the respondents are well informed about the activities in the industry.
Table 2: Background information of respondents' Categorisation of the groups
Group Number of questionnaires sent Number returned Response rate
Contractors 134 132 98.51%
Clients 206 180 87.38%
Consultants 211 108 51.19%
Total 551 420 76.23%
Year of experience in the construction industry
Year of experience Frequency Percent
5-10 years 24 5.1
10-15 years 72 15.4
20-25 years 84 17.9
25 - 30 years 180 42.8
31years and above 60 12.8
Total 420 100.0
Respondent profession in the organisation
Professional role in the organisation Frequency Percent
Architect 83 19.8
Builder 85 20.2
Quantity Surveyor 42 10.0
Engineer (Civil, Structural,
Mechanical and Electrical)
48 11.4
Project Manager 162 38.6
Total 420 100.0
Project Type and Procurement Methods
Using the quantitative survey approach to elicit information, a number of projects and constructed
facility types as well as procurement methods were identified. Table 3 presents the project types and
the respective procurement systems employed in delivering the projects obtained from the
questionnaire survey. Table 3 indicates that traditional lump sum methods were majorly the
procurement route used in the Nigerian construction industry to procure new projects 33.3%
(amounting to 140). Design and build route was the closest indicating 26.2% of the total responses.
Construction management methods account for 22.9% of the total survey, Contract Management and
PPP have the lowest with counts of 56 and 18 representing 13.3% and 4.3% respectively. In all, most
of the respondent’s organisations execute combination of traditional, design & build, construction
management, management contracting and PPP. This result shows that the organisations are well
acquainted with the various procurement methods, hence their capabilities to give accurate answers to
the questions asked. Also, the result confirms the study carried out by Babatunde et al. (2012), they
ranked traditional method as the highest and most frequently used procurement method for procuring
building projects in Nigeria. This finding is also in line with Saad, Jones and James (2002) study who
argued that traditional construction procurement system has been the major route for procuring

Impact of Procurement Methods and Project Types on Construction Projects Performance
constructed facilities for a very long time in the UK. This is not surprising as Nigeria still tows the UK
construction industry ways of doing things.
Table 3 shows that respondents were involved in the procurement of a variety of project types, the
most prominent project types were commercial and administrative offices (27.3%), followed by
residential buildings (22.7%). This result affirms the nature of the study area which is the Federal
Capital of Nigeria with many office buildings both for administrative and commercial purposes.
Table 3: Project types and procurement methods Types of Project Awarded Frequency Percent
Offices 36 27.3
Industrial (Factories, Shopping Complexes and
warehouses)
11 8.3
Health (Hospital) 18 13.6
Residential Houses 30 22.7
Commercial (Hotels, Banks, Markets, Shopping Mall) 23 17.4
Educational (Schools and Universities) 14 10.6
Total 132 100.0
Procurement methods Frequency Percent
Traditional Contract Method (Lump Sum) 140 33.3
Design and Build 110 26.2
Construction Management 96 22.9
Management Contracting 56 13.3
Public Private Partnership (PPP) 18 4.3
Total 420 100.0
Relationship between project type and procurement system
The previous research that focused on the Nigerian construction sector asserted that both the traditional
and non-traditional procurement systems are in use in the industry. However, a major problem identified
with traditional procurement system is the non-integration of design and construction (Ojo et al.,
2006). To mitigate this shortcoming that is associated with the use of traditional procurement method,
non-traditional systems such as design and build, management contracting and construction management
have been encouraged (Dada, 2013; Oladinrin et al., 2013). Hence, the following hypothesis was
formulated and tested:
H1: There is a statistical significant relationship between the different types of procurement methods
available for procuring building projects and the various project types
Table 4 shows the correlation coefficient, level of significance between procurement methods and
project types. The decision taken is based on the categorisation by Field (2013), a correlation of ±0.1
denotes small effect, ±0.3 represents medium effect and ±0.5 is a large effect. The results show that
offices have a correlation coefficient of 0.217, a value that is weak but positive. It is statistically
significant (p = 0.007). The same applies to Health (Hospital) with a value of 0.326. All other Project
Types give values that are statistically insignificant. Conclusively, with 2 “reject” and 4 “accept”, the
correlation results show that most of the project types are statistically insignificant and hence, the
hypothesis that stated that there is correlation between procurement methods and project types is
partially supported. Hence, the procurement methods available are not dependent on the types of
project available.
Table 4: Correlation analysis of procurement methods and project type
Project Type Correlation
Coefficient
P-value Significance of
Correlation
Decision
Offices 0.217** 0.007 Significant Reject
Industrial (Factories, Shopping 0.054 0.506 Not Significant Accept

Built Environment Journal Vol. 12, No.2, 50 - 60, 2015
Project Type Correlation
Coefficient
P-value Significance of
Correlation
Decision
Complexes and warehouses)
Health (Hospital) 0.326** 0.000 Significant Reject
Residential Houses 0.067 0.405 Not Significant Accept
Commercial (Hotels, Banks, Markets,
Shopping Mall)
0.151 0.059 Not Significant Accept
Educational (Schools and Universities) -0.007 0.931 Not Significant Accept
Procurement methods and project success criteria
In order to determine the relationship between the various procurement methods studied and the
identified project success criteria, the following hypothesis was tested:
H2: There is statistical significant relationship between the different types of procurement methods
available for procuring building projects and project success criteria.
Table 5 shows weak correlation coefficient between procurement method and project success
criteria except health and safety measures (i.e. when no causalities recorded to complete a project) that
indicate medium effect on construction projects. However, the procurement methods used have
significant effects on all the measures of project success criteria except “When no conflicts recorded to
complete a project” that is statistically insignificant. The correlation results show that most of the
factors are statistically significant and hence, the hypothesis that states that there is statistical
significant relationship between the different types of procurement methods available for procuring
building projects and project success criteria is accepted. That is, there is correlation between
procurement methods and project success criteria. The implication is that cost, time and quality are
factors affecting the selection of procurement methods. Hence, the procurement methods available are
dependent on the project success criteria. These results are in line with the findings of Eyitope et al.
(2012), who inferred that completing a project within its budgeted cost is more relieving and satisfying
to the client. The findings are also in consonance with assertion of Peter et al. (2008) who argued that
causalities constitute hindrances to the progress of work and consequently impede the success of the
project. Nonetheless, conflict within a project also constitute a great hindrance to the progress of work
as this could amount to disruption of work, which could lead to time overrun as posited by Maizon et
al. (2006) but the study shows its effect is insignificant.
Table 5: Correlation analysis of procurement methods and project success criteria
Factor Correlation
Coefficient
P-
value
Significance of
Correlation
Decision
Completing a project
within budgeted cost
0.210** 0.008 Significant Reject
Completing a project
within the estimated
construction time
0.225** 0.005 Significant Reject
Satisfying with the quality of a project -0.170** 0.033 Significant Reject
When no conflicts recorded to
complete a project
-0.068 0.402 Not Significant Accept
When no causalities recorded to
complete a project
-0.435** 0.000 Significant Reject

Impact of Procurement Methods and Project Types on Construction Projects Performance
The effect of the different procurement systems on project performance (cost and time overruns)
Construction projects performance is measured using the most commonly used parameters of cost,
time and quality. This is due to the fact that construction clients want their project completed on time,
within the budgeted cost without compromising the quality and safety. The performance of project
with respect to the procurement method used is measured using cost and time. Therefore, to establish
whether the various procurement systems have any effect on project performance, the hypothesis
stated below was tested.
H3: There is significant relationship between project performance measures (cost and time) and
different procurement methods.
Table 6 shows the results of the regression analysis of different procurement types on cost
performance of construction projects. The coefficient of determination R2 ranges from 0.52, 0.88 for
the entire projects considered. The significant level shows that there is a significant effect of cost
overrun on contract sum for traditional method, which implies that other procurement routes should be
considered for procurement as it relates to reliability of estimated cost. These findings are in tune with
the findings of Jaafar and Nuruddin (2012) and Eyitope et al. (2012), who confirmed that the
increasing awareness of construction stakeholders to the benefits of other procurement methods as
opposed to the traditional procurement method. However, this is contrary to the submission of
Adesanya (1992) and Enekwechi (1993) which identified traditional procurement as the best method
in Nigeria to achieve estimated time target and cost budget. The reason for this may not be farfetched
in that these studies were conducted more than 20 years when designs and construction were simpler
than what we have presently. The findings also supported the result of Rose and Manley (2011) who
reported their research work based on forty-two case studies that 78% of management contracting
projects were completed within or less than their budgeted cost compared with only 30% traditional
contracts. The results of similar research work by Mathonsi and Thwala (2012) in Southern Africa
confirmed the above result.
Table 6: Summary of regression analysis of cost overrun for different procurement methods
Regression Analysis of Cost Overrun (Co) on Contract Sum (Cs)
Traditional Method
Project Size R2
(Adjusted)
Regression Equation P.valu
e
Remarks
1-10 million 0.64 Cs = 0.633+3.725Co 0.0001 Significant
11-100 million 0.73 Cs =
0.368+2.7776Co
0.0000 Significant
Above 100 million 0.58 Cs = 0.356+1.655Co 0.0000 Significant
Design and Build Method
1-10 million 0.69 Cs = 0.452+3.895Co 0.1000 Not Significant
11-100 million 0.62 Cs = 0.321+2.651Co 0.2000 Not Significant
Above 100 million 0.88 Cs = 0.821+1.612Co 0.2000 Not Significant
Project Management Method
1-10 million 0.76 Cs = 0.410+3.521Co 0.2000 Not Significant
11-100 million 0.79 Cs = 0.201+2.416Co 0.1000 Not Significant
Above100 million 0.59 Cs = 0.301+1.430Co 0.5000 Not Significant
Management Contracting Method
1-10 million 0.81 Cs = 0.391+3.310Co 0.0000 Significant
11-100 million 0.73 Cs = 0.290+2.201Co 0.1000 Not Significant
Above 100 million 0.64 Cs = 0.910+1.343Co 0.2000 Not Significant
PPP Method
1-10 million 0.64 Cs = 0.150+3.267Co 0.2100 Not Significant
11-100 million 0.52 Cs = 0.482+2.722Co 0.0700 Not Significant
Above 100 million 0.58 Cs = 0.290+1.327Co 0.1000 Not Significant
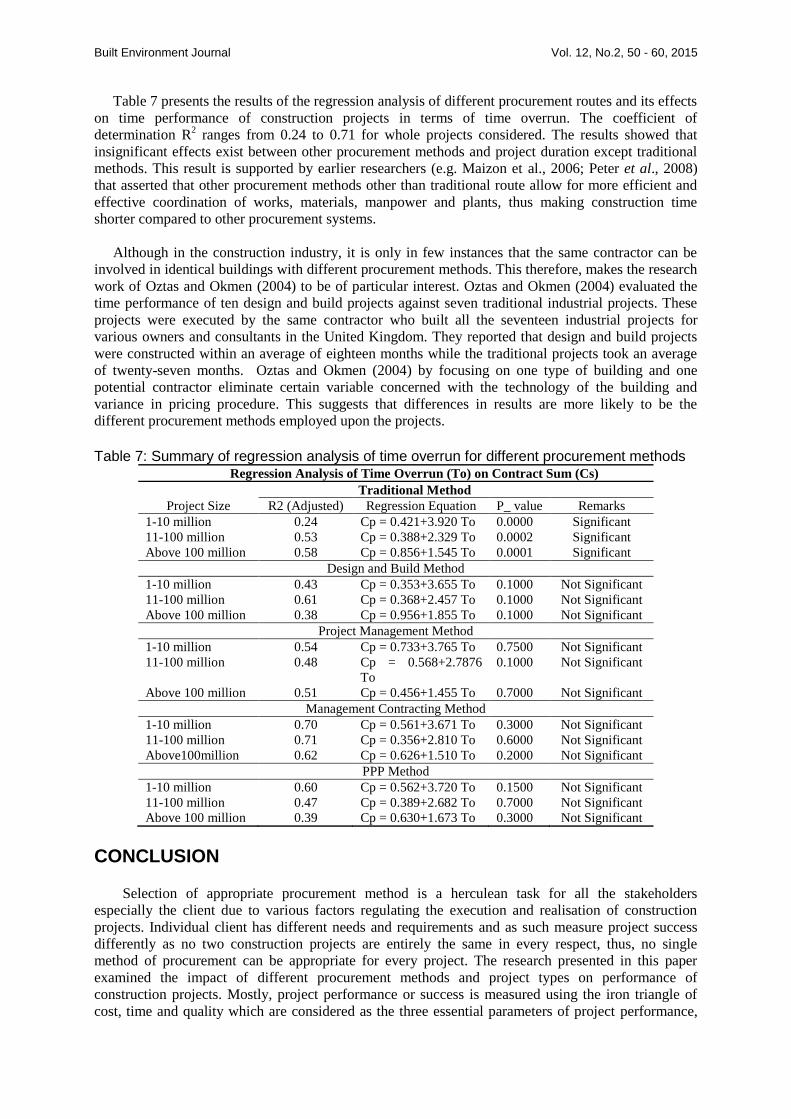
Built Environment Journal Vol. 12, No.2, 50 - 60, 2015
Table 7 presents the results of the regression analysis of different procurement routes and its effects
on time performance of construction projects in terms of time overrun. The coefficient of
determination R2 ranges from 0.24 to 0.71 for whole projects considered. The results showed that
insignificant effects exist between other procurement methods and project duration except traditional
methods. This result is supported by earlier researchers (e.g. Maizon et al., 2006; Peter et al., 2008)
that asserted that other procurement methods other than traditional route allow for more efficient and
effective coordination of works, materials, manpower and plants, thus making construction time
shorter compared to other procurement systems.
Although in the construction industry, it is only in few instances that the same contractor can be
involved in identical buildings with different procurement methods. This therefore, makes the research
work of Oztas and Okmen (2004) to be of particular interest. Oztas and Okmen (2004) evaluated the
time performance of ten design and build projects against seven traditional industrial projects. These
projects were executed by the same contractor who built all the seventeen industrial projects for
various owners and consultants in the United Kingdom. They reported that design and build projects
were constructed within an average of eighteen months while the traditional projects took an average
of twenty-seven months. Oztas and Okmen (2004) by focusing on one type of building and one
potential contractor eliminate certain variable concerned with the technology of the building and
variance in pricing procedure. This suggests that differences in results are more likely to be the
different procurement methods employed upon the projects.
Table 7: Summary of regression analysis of time overrun for different procurement methods
Regression Analysis of Time Overrun (To) on Contract Sum (Cs)
Traditional Method
Project Size R2 (Adjusted) Regression Equation P_ value Remarks
1-10 million 0.24 Cp = 0.421+3.920 To 0.0000 Significant
11-100 million 0.53 Cp = 0.388+2.329 To 0.0002 Significant
Above 100 million 0.58 Cp = 0.856+1.545 To 0.0001 Significant
Design and Build Method
1-10 million 0.43 Cp = 0.353+3.655 To 0.1000 Not Significant
11-100 million 0.61 Cp = 0.368+2.457 To 0.1000 Not Significant
Above 100 million 0.38 Cp = 0.956+1.855 To 0.1000 Not Significant
Project Management Method
1-10 million 0.54 Cp = 0.733+3.765 To 0.7500 Not Significant
11-100 million 0.48 Cp = 0.568+2.7876
To
0.1000 Not Significant
Above 100 million 0.51 Cp = 0.456+1.455 To 0.7000 Not Significant
Management Contracting Method
1-10 million 0.70 Cp = 0.561+3.671 To 0.3000 Not Significant
11-100 million 0.71 Cp = 0.356+2.810 To 0.6000 Not Significant
Above100million 0.62 Cp = 0.626+1.510 To 0.2000 Not Significant
PPP Method
1-10 million 0.60 Cp = 0.562+3.720 To 0.1500 Not Significant
11-100 million 0.47 Cp = 0.389+2.682 To 0.7000 Not Significant
Above 100 million 0.39 Cp = 0.630+1.673 To 0.3000 Not Significant
CONCLUSION
Selection of appropriate procurement method is a herculean task for all the stakeholders
especially the client due to various factors regulating the execution and realisation of construction
projects. Individual client has different needs and requirements and as such measure project success
differently as no two construction projects are entirely the same in every respect, thus, no single
method of procurement can be appropriate for every project. The research presented in this paper
examined the impact of different procurement methods and project types on performance of
construction projects. Mostly, project performance or success is measured using the iron triangle of
cost, time and quality which are considered as the three essential parameters of project performance,

Impact of Procurement Methods and Project Types on Construction Projects Performance
but health and safety has found its way into these performance criteria as shown in the study. The
research showed that construction clients in Nigeria are becoming more informed due to the quest to
have their project completed on time, within budget and with the right quality; the adoption of
different procurement methods show that the construction industry is now trying to meet the clients’
needs. The study indicated that different procurement method have different effect on the cost and
time performance of construction projects. The results established that there is a relationship between
procurement methods and factors used in assessing project success, while no relationship exists
between procurement methods and project types. The implication is that cost, time, quality and health
and safety are factors affecting the selection of procurement methods.

Built Environment Journal Vol. 12, No.2, 50 - 60, 2015
REFERENCES
Adesanya, O.M. (1992). Management Contracting Concepts and Nigeria’s Construction
Industry. Paper Presented At the Joint Seminar on Management Contract of
Quantity Surveyors Registration Board of Nigeria and Nigerian Institute of
Quantity (18th
September 1992, Lagos)
Babatunde, S.O., Opawole, A. & Ujaddughe, I.C. (2010). An Appraisal of
Procurement Methods in the Nigerian Construction Industry. Civil Engineering
Dimension, 12, 56-58.
Retrieved from www.puslit.petra.ac.id/../c1v10120010.pdf/ (Accessed 14 December
2012).
Bryman, A. (2008). Social Research Methods, 3rd
edition. New York: Oxford University Press
Cooke-Davies, T.J. (2002). The ‘real’ success factors on projects. International Journal of
Project Management, 20, 185–190.
Dada, M.O. (2013). Conflicts in construction projects procured under traditional and
integrated systems: A correlation analysis. International Journal of Construction Supply
Chain Management. 3(1), 1-15
Emerson, H. (1962). Report for Ministry of Works: Survey of Problems before the
Construction Industries. London: HMSO
Enekwechi, C.O. (1993). Construction Management as a Contract Procurement System’,
Builders Magazine, VII (6), 17-18
Eriksson, P. E., Nilsson, T. & Atkin, B. (2008). Client perceptions of barriers to partnering.
Engineering, Construction and Architectural Management, 15(6), 527–539
Eyitope, A., Ajibola, M., Ajibola, O. & Gbadebo, F. (2012) Critical Selection Criteria for
Appropriate Procurement Strategy for Project Delivery in Nigeria. Retrieved from
http://jetems.sholarlinkresearch.org/article (Accessed 31 January 2013)
Field, A. (2013). Discovery statistics using IBM SPSS statistics, 4th
edition. Los Angeles:
Sage Publication Limited.
Gruneberg, S. and Hughes, W. (2006), ‘‘Understanding construction consortia: theory,
practice and opinions’’, Royal Institution of Chartered Surveyors (RICS) Research
Papers, 6(1), 1-53.
Ibrahim, I. I., Daniel, S. and Ahmad, A. (2014). Investigating Nigerian Indigenous
Contractors Project Planning In Construction Procurement: An Explanatory Approach.
International Journal of Civil & Environmental Engineering IJCEE-IJENS, 14(04), 16-
25
Jaafar, M & Nuruddin, A.R. (2012). The development of Public and Private construction
procurement system in the Malaysian construction industry. Journal of Design and
Built Environment, 11, 1-11. Retrieved from http://e-
journal.um.edu.my/filebank/publis (Accessed 12 February 2013)
Latham, M. (1994). Constructing the team: Joint Review of Procurement and Contractual
Arrangements in the United Kingdom Construction Industry: Final Report. London:
Department of Environment. Retrieved from http://hdl.handle.net/10068/491035
(Accessed 21 September 2011)
Love, P.E.D., Skitmore, R.M. & Earl, G. (1998). Selecting an appropriate procurement
method for a building project. Construction Management and Economics, 16, 221-223
Maizon, H., Melissa, C.Y., Ng Chu, Y., Ng Sock, H., Shim Mong, H. & Tay Lee, Y. (2006).
Factors Influencing the Selection of Procurement Systems by Clients. Proceeding of
International Conference on Construction Industry 2006, Padang, Indonesia, 21st – 25th
June, 1-10

Impact of Procurement Methods and Project Types on Construction Projects Performance
Maizon, H. (1996). The Effects of Procurement Systems on performance of construction
projects in Malaysia. Proceedings of CIB W92: North Meets South: Developing Ideas,
The University of Natal, Durban, South Africa
Masterman, J.W.E. (1992). An Introduction to Building Procurement Systems. London: E and
FN Spon
Masterman, J.W.E. & Gameson, R. (1994). Client characteristics and needs in relation to their
selection of procurement systems. In: Rowlinson, S. (ed.) Proceedings of East Meets
West Procurement Systems Symposium, CIB Publication 175, 4–7 December, Hong
Kong, 79–87
Mathonsi, M.O & Thwala, W.D. (2012), Factors influencing the selection of procurement
systems in the south-african construction industry. African journal of business
management, 6, 3583-3594. Retrieved from
http://www.academicjournals.org.AJBM (Accessed 12 February 2012)
Naoum, S.G., & Langford, D.A. (1987). Management Contracting in managing
Construction Worldwide. London: Chartered Institute of Building
Ng, T. S., Luu, D. C. & Chen, S. E. (2002). Decision criteria and their subjectivity in
construction procurement selection. The Australian Journal of Construction Economics
and Building, 2(1), 70-80
Ojo, S. O. & Ikpo, I. J. (2013). Determining the Performance of Procurement Methods against
Selection Criteria using Outranking – Satisfying Methodology. Journal of Engineering,
Project, and Production Management, 3(2), 74-84
Ojo, S.O., Adeyemi, Y.A. & Fagbenle, I.O. (2006). The Performance of Traditional Contract
Procurement on Housing Projects in Nigeria. Civil Engineering Dimension Journal,
8(2), 81-86.
Oladinrin, O.T., Olatunji, S.O. & Hamza, B.T. (2013). Effect of selected procurement systems
on building project performance in Nigeria. International Journal of Sustainable
Construction Engineering & Technology, 4(1) 48-62
Oztas, A., & Okmen, O.(2004). Risk Analysis in Fixed-Price Design-Build Construction
Projects. Building and Environment Journal, 39, 229-237.
Peter, D., Peter, L., & David, B. (2008). Building Procurement Methods (Report).
Construction Innovation. Retrieved from www.construction-innovation.info/im
(Accessed 14 January 2013)
Royal Institution of Chartered Surveyors (RICS) (2007). Survey of Building Contracts in Use
During 2007. London: The Royal Institution of Chartered Surveyors
Saad, M., Jones, M. & James, P. (2002). A review of the progress towards the adoption of
supply chain management (SCM) relationships in construction. European Journal of
Purchasing and Supply Management, 8(3), 173–183
Xue, X., Wang, Y., Shen, Q. & Yu, X. (2007). Coordination mechanisms for construction
supply chain management in the Internet environment. International Journal of Project
Management, 25(2), 150–157

Built Environment Journal
NOTES FOR CONTRIBUTORS
SUBMISSION
All materials submitted for publication must be
original, unpublished work and are not under
consideration for publication elsewhere.
Papers may be submitted by e-mail to
[email protected]. Alternatively, 2 copies of the
manuscript together with a full version on CD may
be submitted to the Editorial Board.
Address:
Assoc. Prof. Datin Dr. Hamimah Adnan
Managing Editor
Built Environment Journal (BEJ)
Faculty of Architecture, Planning and Surveying
Universiti Teknologi MARA
40450 Shah Alam
Selangor, Malaysia.
Editors reserve the right to edit/comment on the
content of the manuscript. If major or substantial
amendments are recommended by the editors the
authors will be given the option to accept or reject
the recommendations (and withdraw participation).
MANUSCRIPT PREPARATION
Language
The manuscript must be submitted in British
English.
Length
The manuscript should be within the range of 5000
– 7500 words in Times New Roman font, 12 point
type. Authors are requested to state how many
words their paper contains. The manuscripts should
be typed and single spaced on one side of A4 paper
only, with 4 cm margins on the sides, the top and
the bottom. All text should be set aligned justified
throughout. The pages should be numbered in
order.
Title Page
The first page of the manuscripts must contain the
full title, name of author(s), designation(s) of
affiliation(s), highest academic qualification and the
present address(es) with the telephone/fax/e-mail
contact information listed.
Abstract and Keywords
The abstract must not exceed 250 words and should
summarise the paper including the main
conclusions. There shall be not more than 5
keywords.
Text
The order when typing manuscripts: Title,
author(s), highest academic qualification,
Affiliations, Abstract, Keywords, Main Text (Aim,
Problem Statement/Issues, Methodology and
Analysis),Conclusion and Recommendations,
References, Acknowledgment and Appendix (if
any). Simple language, short sentences and a good
use of headings are encouraged. Headings should
be numbered and the use of more than three levels
of heading should be avoided. Headings and
paragraphs should be separated by two carriage
returns. Text following a heading should not be
indented.
Illustration
Photographs, diagrams and charts should be
referred to as “Figure(s)” and numbered in the order
in which they are referred to in the text. Maps and
diagrams should be submitted in a form ready for
reproduction, all in legible digital format. Please
note that illustrations in the journal shall be printed
in black-and-white or grey-scale.
Units
All measurements and data should be given in
metric units or, if other units are used, then the
metric equivalent should be given in parentheses.
Reference
The Harvard system is used. The reference is
referred to in the text by the following manner:
Onojaefe D, Ukpere WI (2009). Partnership and
the e-commerce initiative of small businesses.
African Journal Business Management, 3(12):
855-861.
Shahimi, N. (2006). A Study on The Achievement of
Class F Contractors. Shah Alam: Department
of Quantity Surveying, Faculty of Architecture,
Planning and Surveying, Universiti Teknologi
MARA Malaysia.
Swan W, Khalfan MMA (2007). Mutual Objective
Setting For Partnering Projects in the Public
Sector. Engineering, Construction and
Architectural Management, 14(2): 119-130.
Stevens, R. (2004). “Partnering, Environmental &
Risk Management”,. International
Construction Conference 2004. CIOB
Malaysia.
CIDB (2011), Construction Industry Development
Board, Malaysia, www.cidb.gov.my.
COPYRIGHT
Once published in the Built Environment Journal,
the copyright including electronic copyrights of the
article is automatically invested with UiTM. The
copyright covers the exclusive use of rights to
reproduce and distribute the article, including
reprints, photography reproductions, microfilm,
electronic publication or any reproduction of a
similar nature and translations. Permission to
publish illustrations must be obtained by the author
before submission. Any acknowledgements should
be included in the figure captions.