bulgarian small and medium enterprises promotion...
TRANSCRIPT

Analysis of the Situation and Factors for Development of SMEs
in Bulgaria
Prepared by:
Bulgarian Small and Medium Enterprises Promotion Agency
SMEs in the Crisis Context
Sofia, 2011
2
Analysis of the situation and factors for development of SMEs,
prepared by BSMEPA and NOEMA, 2011
Preface
The aim of the present analysis is to investigate and describe the situation
of small and medium-sized enterprises (SMEs) in Bulgaria in the context of
National Strategy for Small and Medium Enterprises, 2007-2013, as well as
to support the formulation of adequate and transparent policy for SMEs
development. It is prepared by experts of NOEMA on behalf of the
Bulgarian Small and Medium Enteprises Promotion Agency to Ministry of
Economy, Energy and Tourism (MEET).
The analysis follows logic of the ten principles of Small Business Act (SBA)
— the main document of European Commission related to the policy of EU
towards SMEs, created in 2008 — and of the Strategy. These principles are
developed to direct the conceptualization and implementation of policies
towards SMEs: (1) Entrepreneurship, (2) Second Chance, (3) Think Small
First, (4) Responsive Administration, (5) Finance, (6) Public Procurement
and State Aid, (7) Single Market, (8) Skills and Innovation, (9) Environment
и (10) Internationalization.
Situation in the SME sector is outlined for the period of 2005-2011, while
the main statistical data covers the period of 2005-2009. Observation
indicators are complemented with the results of a nationally
representative sociological survey among SMEs conducted in February,
2011. For the purposes of the analysis, other surveys carried out in the last
years are used as well as statistics and reports concerning SMEs in EU-27.
Time scope of the analysis coincides with development of the world
financial and economic crisis. Its impacts on the business in Bulgaria, and
SME sector in particular, is a special topic of treatment. In the context of
crisis and whole economic situation of the country, factors for SME
development are examined and analysed. Namely, SMEs are the backbone
of Bulgarian economy and a driving force of employment.

3
Analysis of the situation and factors for development of SMEs,
prepared by BSMEPA and NOEMA, 2011
Contents
Summary .............................................................. 6
Stylized Facts .......................................................................... 12
SME, crisis and role of present analysis ............................................ 13
Objectives and tasks .................................................................. 13
Scope and methodology .............................................................. 14
Structure ............................................................................... 15
SME Developments ................................................. 16
Dynamics and business demography ............................................... 16
Number, structure and average size of enterprises .............................. 16
Distribution of enterprises by size class and economic activities .............. 19
Distribution of enterprises by size class and economic regions ................ 20
Birth, death and surviving of SMEs ................................................. 23
Employment in the SME sector ..................................................... 26
Contribution of SMEs to the employment .......................................... 26
Structure of employment by economic activities ................................ 27
Structure of employment by economic regions ................................... 29
Structure of production and labour productivity ................................. 31
Profitability and investment ........................................................ 34
Profitability ............................................................................ 34
Propensity to invest .................................................................. 36
External trade ......................................................................... 39
Entrepreneurship ..................................................................... 44
Profile of SME owners ................................................................ 44
Education and qualification of owners ............................................. 44
Entrepreneurship among women.................................................... 46
Entrepreneurship among young owners up to 40 ................................. 46
Key points .............................................................................. 48
The Economic Crisis ............................................... 49
Development of the Bulgarian economy in the times of crisis ............... 49
The crisis in EU in brief .............................................................. 49
Bulgaria during the crisis years 2007-2008 ........................................ 50
Bulgaria in crisis, 2009-2010 ......................................................... 52
Banking system ........................................................................ 55
Trends in the development of SMEs in EU ........................................ 56
Impact of the crisis upon SMEs in Bulgaria ....................................... 60
Initial reaction to the crisis.......................................................... 60
General effects of the crisis ......................................................... 61
4
Analysis of the situation and factors for development of SMEs,
prepared by BSMEPA and NOEMA, 2011
Crisis as an opportunity .............................................................. 63
Problems in the context of current market situation ............................ 64
Key points .............................................................................. 67
Factors for Development ......................................... 69
Institutional environment ........................................................... 69
Role of the institutional environment .............................................. 69
Institutional environment before the crisis and today ........................... 70
Index of the institutional environment ............................................ 73
Determinants of the institutional environment ................................... 75
Access to Finance ..................................................................... 78
Role of the access to finance........................................................ 78
The access to finance before the crisis and today ............................... 78
Index for the access to finance ..................................................... 80
Determinants of the access to finance ............................................. 81
Innovation .............................................................................. 83
Role of the innovations............................................................... 83
Innovation activities before the crisis and today ................................. 84
Index for the innovation activity ................................................... 85
Determinants of the innovation activity of the SMEs ............................ 86
Intellectual property ................................................................. 88
Role of the trade marks and patents ............................................... 88
The intellectual propery and SMEs ................................................. 89
Index for trade marks and patents ................................................. 89
Determinants of the patent activity of the SMEs ................................. 90
Internationalization .................................................................. 92
Role of the internationalization .................................................... 92
The internationalization of SME and their participation in clusters ........... 93
Index for internationalisaiton ....................................................... 93
Determinants of the internationalisation .......................................... 95
Best practices ......................................................................... 97
Role of the best practices ........................................................... 97
The best practices and SMEs ........................................................ 98
Index for best practices .............................................................. 99
Determinants of the best practices .............................................. 100
Factors for sustainable development and competitiveness ................. 103
Stages in competitive development .............................................. 103
Competitiveness and sustainability of SMEs in the times of crisis............ 103
Strengths and weaknesses, threats and opportunities for SME development ......................................................................................... 111
Weaknesses .......................................................................... 111
Strengths ............................................................................. 113
Threats ............................................................................... 115

5
Analysis of the situation and factors for development of SMEs,
prepared by BSMEPA and NOEMA, 2011
Opportunities ........................................................................ 116
Key points ............................................................................ 118
Measures and policies ........................................... 119
Legal framework .................................................................... 119
Contemporary approaches in formulating policies for SME ................... 120
Overall Assessment of the State Impact ......................................... 121
Proposals for measures and policies .............................................. 125
Bibliography ....................................................... 129
Annex ............................................................... 133
Microeconomic indicators for the performance of SME sector ............. 133
Main macroeconomic indicators .................................................. 136
Scope and methodology of the statistical analyses ........................... 137
Classification of economic activities ............................................. 137
Methodology of the survey among SMEs ......................................... 138
Methodology for calculation of the indices ...................................... 139
Regression analysis: estimation output .......................................... 148
List of tables and figures in the analysis ....................................... 149
6
Analysis of the situation and factors for development of SMEs,
prepared by BSMEPA and NOEMA, 2011
Summary
The present analysis is prepared for the purposes of the Bulgarian Small
and Medium Enteprises Promotion Agency (BSMEPA). BSMEPA carries out a
legislative responsibility for implementation of the national policy in the
field of SMEs, as participates in the development and fulfillment of
measures in the annual programs for application of the National Strategy
for Promotion of Small and Medium-sized Enterprises, as well as the
Operational Programme ―Development of Competitiveness of Bulgarian
Economy‖, 2007-2013 of the Sructural Fund for Regional Development of
European Union (EU). BSMEPA is a secondary budget funds spender to
MEET. Vision of the Agency corresponds to the vision of MEET, and
contributes to the implementation of integrated policy for improvement of
the competitiveness of Bulgarian enterprises, with the purpose of
achieving a sustainable economic growth, including through the effective
use of European funds and the improvement of business climate. This
priority is closely associated with higher levels of value added, respectively
real growth of GDP in the conditions of increasing competition and
successful integration of businesses in the Single European market.
The analysis is based on the latest statistical data for the sector
development along with the results of a nationally representative
sociological survey among SMEs in Bulgaria, conducted at the beginning of
2011. The survey covers the six economic regions for planning and includes
300 enterprises in the spheres of production, trade, services and
construction.
Main focus of the present analysis is put on the situation of the SME sector
under the conditions of economic crisis today. Key questions, on which
answers the analysis looks for are, as follows:
What is happening with the SME sector today?
Which enterprises are loosers in the crisis?
Which enterprises are mostly sustainable in the crisis? What is the connection between competitiveness factors and capability of
the enterprises to cope with the crisis? and other.

7
Analysis of the situation and factors for development of SMEs,
prepared by BSMEPA and NOEMA, 2011
The answers of these questions can support the process of formulation of
adequate policies for encouraging of the SME sector.
Development of SMEs in the period of 2005-2010 shows the following
important tendencies and demographic features:¹
The number of SMEs increases, while the number of large enterprises
decreases. The tendency continues during the years of crisis (2008-
2009) includingly.²
The role of SMEs in relation to employment increases: the number of
employed in the SME sector increases faster than the number of
employed in the large enterprises, including the period of crisis (2008-
2009).
Structure of non-financial enterprise population in Bulgaria is very
close to the structure of EU-27³ in 2009, as well as the average
individual size of enterprises by size class. An exception is the average
size of large enterprises, which are smaller in individual size in
Bulgaria, which results at a higher contribution share to employment in
Bulgaria compared to EU-27.
Typical Bulgarian firm, similarly to the typical European firm, is the
microfirm, with the average of 2 occupied persons.
Micro enterprises dominate in all economic activities. In the sector of
―Wholesale and retail trade‖, they are over a half of all size classes.
During the crisis 2009, it is only the micro enterprises that increase
(reaching to 90.3%), while small (8.0%) and medium-sized (1.5%)
enterprises slightly decrease. Share of the micro firms in employment
also increases (up to 29%), while shares of small and medium-sized
enterprises slightly decrease (24% and 23% correspondingly), which
breaks the tendency from past years.
By competitiveness, SMEs leave behind the large enterprises with
about two times lower productivity, lower profit margin and lower
level of salary. Lowest is the profit margin of micro enterprises, where
labour productivity is the lowest. With the increase of enterprise
individual size, its profitability is increasing.
¹ According to data of the National Statistial Institute (NSI).
² For the analysis of dynamics of the SME number, there
should be bared in mind that changes in the methodology of NSI occurred, new classification of the economic activities was introduced in 2008 (NACE.BG-2008), and other events happened that all impacted the number of SMEs registered.
³ In the EU-27 data, Bulgaria and other member states
of EU are included.
Summary

8
Analysis of the situation and factors for development of SMEs,
prepared by BSMEPA and NOEMA, 2011
Bulgarian SMEs have 2 to 7 times lower coefficient of labor productivity
in comparison to the new member states of EU, and 15-30 times lower
coefficient in comparison to EU-15 countries. This means that persons
occupied in the Bulgarian SMEs create smaller value added and that is
why they are less paid. By number of enterprises and number of
occupied persons in the enterprises, Bulgarian SMEs are close to those
in Denmark and Austria, but the latter create 12–13 times higher value
added.
Sector structures of different firm size classes significantly differ from
each other and change very slowly in time. A largely uneven territorial
distribution of number and activities of SMEs is evident.
SME share in the turnover of non-financial enterprise population
continues to increase, and reaches 69% of the total turnover in 2009.
This is typical for all economic activities, except of mining and
quarrying industry. Contribution of different firm size classes is
relatively even, with the leading importance of large enterprises (31%).
Contribution of SMEs in value added is 62%. Most significant is the
share of large enterprises (38%), followed by the medium-sized (24%),
small (21%) and micro firms (17%).
In the last few years, an outtaking contribution of SMEs to gross
investment in value added is observed — 63% vs. 37% of large
enterprises. Micro firms are leading in this development, with a share
of 131%, which significantly exceeds the average for economy level of
65%. Concerning small and medium-sized enterprises, the indicator
shows 68% and 59% respectively.
The analysis is focused on selected key factors for sustainable development
and competitiveness. For each of these factors, an index is constructed. It
ensures a general view on the investigated processes. Indeces give an
opportunity to compare the situations of different groups of SMEs, as well
as an evaluation of connections between the factors and the economic
performance of firms. Application of these indeces in future analyses
might serve to monitor the sector dynamics. Main findings related to the
current state of selected key factors are the following:
Institutional environment. In the past 2010, an improvement of the
institutional environment, which is defined as services and procedures
of the state administration, is observed.¹ Institutional environment for
the sector of SMEs is mostly favourable in relation to services and
procedures of the Commercial Register and lisences and registration
regimes. Services and procedures related to custom‘s offices and
judicial system offer the most unfavourable environment.
¹ According to results of the national survey among
SMEs carried out for the purposes of the present analysis.
Summary
9
Analysis of the situation and factors for development of SMEs,
prepared by BSMEPA and NOEMA, 2011
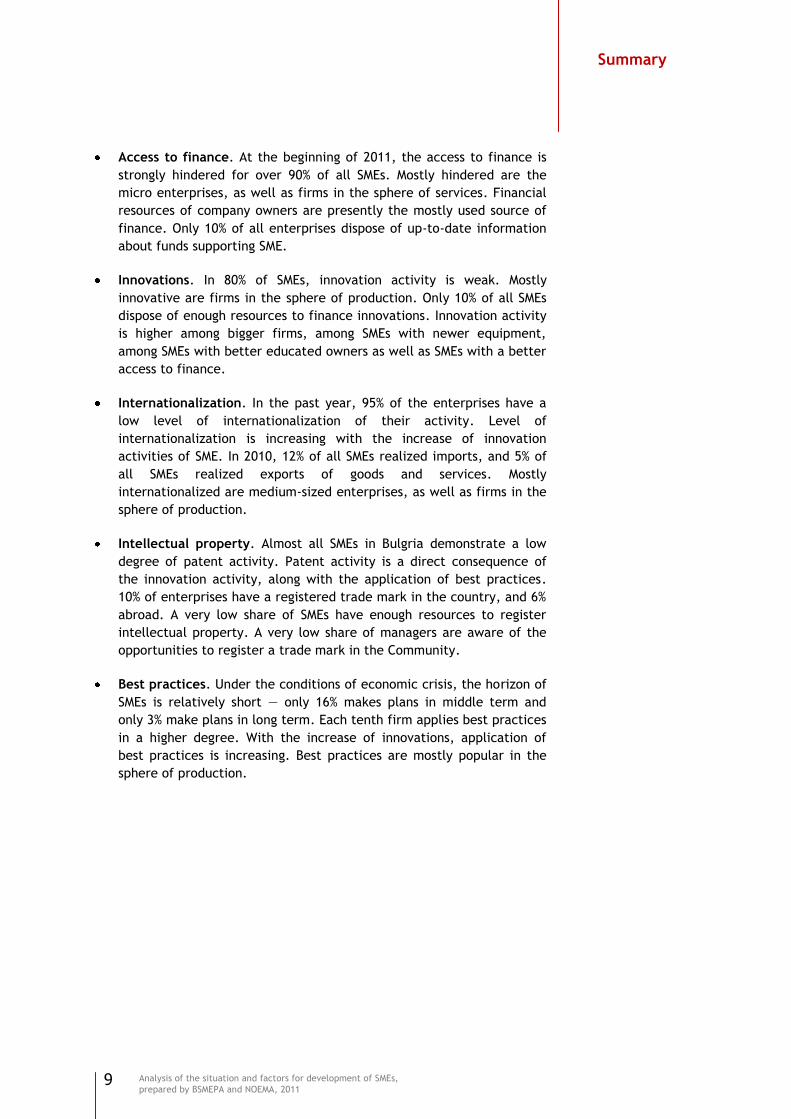
Access to finance. At the beginning of 2011, the access to finance is
strongly hindered for over 90% of all SMEs. Mostly hindered are the
micro enterprises, as well as firms in the sphere of services. Financial
resources of company owners are presently the mostly used source of
finance. Only 10% of all enterprises dispose of up-to-date information
about funds supporting SME.
Innovations. In 80% of SMEs, innovation activity is weak. Mostly
innovative are firms in the sphere of production. Only 10% of all SMEs
dispose of enough resources to finance innovations. Innovation activity
is higher among bigger firms, among SMEs with newer equipment,
among SMEs with better educated owners as well as SMEs with a better
access to finance.
Internationalization. In the past year, 95% of the enterprises have a
low level of internationalization of their activity. Level of
internationalization is increasing with the increase of innovation
activities of SME. In 2010, 12% of all SMEs realized imports, and 5% of
all SMEs realized exports of goods and services. Mostly
internationalized are medium-sized enterprises, as well as firms in the
sphere of production.
Intellectual property. Almost all SMEs in Bulgria demonstrate a low
degree of patent activity. Patent activity is a direct consequence of
the innovation activity, along with the application of best practices.
10% of enterprises have a registered trade mark in the country, and 6%
abroad. A very low share of SMEs have enough resources to register
intellectual property. A very low share of managers are aware of the
opportunities to register a trade mark in the Community.
Best practices. Under the conditions of economic crisis, the horizon of
SMEs is relatively short — only 16% makes plans in middle term and
only 3% make plans in long term. Each tenth firm applies best practices
in a higher degree. With the increase of innovations, application of
best practices is increasing. Best practices are mostly popular in the
sphere of production.
Summary

10
Analysis of the situation and factors for development of SMEs,
prepared by BSMEPA and NOEMA, 2011
The answer of question „Which enterprises are mostly sustainable in the
crisis?” is searched through econometric modelling based on contemporary
theories about competitiveness and sustainable development. As a result,
the following mechanisms of competitiveness factors influence are
extrapolated:
Access to finance is a key factor in the environment of economic crisis
and impacts directly the occupation in SMEs. Enterprises with a better
access to finance have either reduces a smaller number of personnel or
have not dismissed personnel at all. Together wih high interest rates,
limited access to finance has affected negatively the payment of
credits. In this case, access to finance is examined through both access
to financial instruments and state aid in support to SMEs.
Application of best practices in the enterprise activities impacts
directly the financial results achieved in positive direction. Enterprises
with better practices related to human resources, information and
communication technologies (IT) and use of market strategies have
suffered from decrease of sales and profit at a lower degree or have no
decrease of sales and profit.
Innovation activity and activities related to intellectual property also
impact positively financial results during the crisis, but indirectly — via
their influence over the best practices. Competitive advantages of
innovation appear to lag behind under the conditions of crisis.
Influence of internationalization on sales and profit is indirect via its
effects over the activities related to intellectual property, and then —
over the best practices. It appears that the crisis affect both
enterprises with exports and enterprises without exports. From one
side, firms that keep their turnover are internationalized at a higher
degree. From other side, firms that reduced their personnel are also
internationalized at a higher degree. Consequently, there are two
groups of exporting enterprises — one, which are loosing in the crisis,
and other, which are managing to take benefits from the crisis.
However, both groups of enterprises keep their profit.
The identified connections between competitiveness factors and
economic crisis effects clearly distinguish the profle of sustainable
enterprises, which can lead the SME sector through the crisis and take
the economy to higher levels of growth in shor-term and long-term
perspective. These are medium-sized firms, having a larger access to
finance or more own resources or implemented best practices, like
regular training of personnel, systematic use of IT, development of
marketing strategies. With higher competitive potential are also SMEs,
which introduce innovations, engage with patent activities and
creation of own trade marks, participate in different forms of
internationalization (imports, exports, cooperation with foreigh
partners, etc.).
Summary
11
Analysis of the situation and factors for development of SMEs,
prepared by BSMEPA and NOEMA, 2011
Implications of the world financial and economic crisis in Bulgaria are the
following:
The beginning of present economic crisis passed quickly throughout
Europe and the world in the second half of 2008 with a rapid decline of
the world trade. The first signals of its reflection in Bulgaria appeared
at the end of 2008 with a reduction of Bulgarian goods and services
exports growth rate. At the beginning of 2009, GDP falled at 4.9%¹,
because of a sharp negative correction of consumption and
investments. In 2009, economy contracted with 5.5%. Drop in
consumption is 7.3%, and in investment is 24.9%.
SMEs reacted more sensitively to the crisis after the first half of 2009
Though a significant part of enterprises left in passive, waiting position
(44%), a prevailing part (56%) anticipate active strategies, among
which are reduction of expenses, including reduction of the personnel
number, or retuning of market positions. Unemployment started to
quickly increase, as the number of occupied persons in the last six
months of 2009 decreased with 120 thousand people, and at the end of
year unemploymend reached 9.1%.
In the last quarter of 2009, macroeconomic indicators in Germany and
other coutries of EU showed signals of ending of recession. In Bulgaria
— the two crisis and revival after it — happen a couple of months
later. In 2010, two macroeconomic indicators show the beginning of
crisis end — volume of the exports reached and even exceeded the
level from before the crisis, and GDP was positive at the end of the
year (0.2%). However, unemployment increased till 11.2% in the last
quarter of the year. (On annual base, unemployment is 10.2% for
2010.)²
The registered growth of GDP in the last three quarters of 2010 and for
the whole 2010, as well as high rates of exports growth (over 70% in
January 2011)³ confirm the positive signals for economic crisis end.
Despite that, the outer environments leaves rather uncertain, for
which risks for unsustainable development of Bulgarian economy are
still significant. About a sound shift of the tendencies, we can speak
after a sensible animation of labor market.
¹ According to NSI data.
² According to NSI data.
³ According to Bulgarian National Bank (BNB) data.
Summary

12
Analysis of the situation and factors for development of SMEs,
prepared by BSMEPA and NOEMA, 2011
Stylized Facts
In 2009, the number of SMEs is 315850.¹
In 2009, the sector of SME forms 99.8% of the non-financial enterprise
population in the country.
After 2007, the annual growth rate of SME number is accelerated up
to 14.5% in 2009.
In 2009, 90.3% of all SMEs are micro firms.
In 2009, the share of micro enterprises increase (with 1.4%) at the
expense of small and medium-sized enterprises (commonly decreased
with 1.3%).
In 2008, the number of new born enterprises is 49287, which
represents 18.2% of all active enterprises. In 2009, the indicator is
expected to fall to 18%.
In 2008, the coefficient of enterprise death is 13.2%, and corresponds
to 35 716 firms. In 2009, the indicator is expected to increase to 14%.
For the period of 2005-2009, the number of SMEs has increased with
32%, and of large enterprises with 5%.
Related to employment, SMEs ensure 76% of the occupied jobs, and
large enterprises — 24%.
In 2009, the number of occupied persons in SMEs is 1553164.
For the period of 2005-2009, the employment in SMEs has increased
with 18%, and in large enterprises has decreased with 2%.
In the crisis 2009, only micro enterprises increase the number of
occupied persons (11%).
In 2009, one SME occupies the average of 5 persons.
Average for the period of 2006-2009, the number of occupied persons
in the new born enterprises is 123409.
In 2009, labour productivity of SME decreases with 12%, in difference
with an increase of 4% of the large enterprises.
In 2009, turnover of the SME sector amounts at 63 thousand Euro.
¹ The analysis includes sectors B-J, L, М, N and chapter
95 of sector S by NACE.BG-2008.
Summary

13
Analysis of the situation and factors for development of SMEs,
prepared by BSMEPA and NOEMA, 2011
Introduction
SME, crisis and role of present analysis
SMEs¹ are backbone of the European and Bulgarian economy. They are the
main source of growth and creation of jobs. SMEs are the most sensible
participants in the economy in reaction to business environment. They
mostly suffer under the burden of too much beaurocracy and, at the same
time, take benefit most actively from the initiatives for облекчаване of
administrative regulation. They are the ones who take the most of
economic crisis negatives, and at the same time florish under the
conditions of economic growth.
By the end of 2008, the world economy entered into recession. According
to the indicators of economic growth, the economy of EU started to
recover by the end of 2009. The crisis in Bulgaria started from the
beginning of 2009, and some of its effects were felt even later. In the past
2010, the phenomena of crisis continued, despite of some signals of revival
and minimal growth of GDP (0.2%).
In such a context, the present analysis outlines the most important issues
and gives directions for policies in supporting SMEs.
Objectives and tasks
Main objective of the analysis is to examine the present situation of the
SME sector, the potential of development of the enterprises, and to
describe the key effects from the state policies.
The main tasks are fulfilled through:
1. Analysis of the situation and development of SME sector in the last
years as well as profiling of the Bulgarian entrepreneur today.
2. Analysis of the economy of Bulgaria in relation to the crisis as well as
identification of important implications of the crisis over the
enterprises.
1
¹ Definition of SME used by the present report is based on the criterion of number of employees. According to this criterion, there are three size classes of enterprises in the SME sector: micro — 1-9 employees, small — 10-49 employees, medium-sized — 50-249 employees.
14
Analysis of the situation and factors for development of SMEs,
prepared by BSMEPA and NOEMA, 2011
3. Analysis of the key factors of SME development, including construction
and implementation of an index for each factor to view the enterprises
from a distance and to summarize the present situation.
4. Overall evaluation of the effects of state policies for SME
development. Formulation of suggestions about stimulating measures
and policies on the base of SME present situation.
Scope and methodology
Situation of the SME sector is investigated for the period of 2005-2011.
Main statistical data covers the period of 2005-2009. Research indicators
are complemented with national representative survey among SMEs carried
out in the beginning of 2011. For the purposes of analysis, data from other
surveys are used, along with statistical records and reports related to SME
in EU-27. In addition, some parts of the analysis resume contemporary
business paradigms treating various aspects of SME development.
Analysis is focused on the key factors for sustainable development and
competitiveness. For each factor, a specific methodology is elaborated and
indeces are constructed. The latter give an opportunity for a general view
over the processes passing through Bulgarian enterprises. The methodology
allows comparison between diffent segments of SME as well reveal of their
internal dynamics.
Research on the main question, namely effects of the economic crisis over
SME sector, is conducted through specification of econometric models,
which are based on modern theories about competitiveness. As a result,
mechanisms of affecting different groups of enterprises are extrapolated in
correlation with level of enterprise competitiveness. It is the base, on
which the most sustainable and least affected by the crisis enterprises are
identified. It is exactly the enterprises with the largest potential to lead
the sector through the crisis if shortterm state aid was addressed to them.
1 Introduction

15
Analysis of the situation and factors for development of SMEs,
prepared by BSMEPA and NOEMA, 2011
Structure
The analysis includes four main parts and an annex.
In the first part, the SME sector is presented on the basis of statistical data
from NSI, Eurostat and the survey conducted. Dynamics in the number and
employment of SMEs is outlined along with foreign trade. The Bulgarian
entrepreneuer today is profiled.
The second part is also based on macroeconomic statistics and survey
results. It includes a macroeconomic view of the crisis and microeconomic
analysis of its effects on SMEs.
The third part is dedicated on the factors of development of SME, as the
focus is put on institutional environment, access to finance, innovations,
activity related to intellectual property, internationalization and
application of best practices. The role of each factor is shown as well as
the situation before and during the crisis. The results of each index are
presented.
The fourth part is dedicated on the measures and policies from the side of
state institutions. Review of the contemporary approaches for formulation
of policies addressed to SME development is included along with general
evaluation of the state policies effects over the sector in the last decade.
At the end, suggestions about policies based on the main findings of the
analysis are articulated.
The annex includes bibliography, description of the methodology applied,
tables with macroeconomic and business statistics and a table with the key
survey indicators.
1 Introduction
16
Analysis of the situation and factors for development of SMEs,
prepared by BSMEPA and NOEMA, 2011
SME Developments
Dynamics and business demography
Number, structure and average size of enterprises
Over the last decade, the number of SMEs in the EU increased significantly
and they appeared to be the main driver of employment growth. In 2002-
2008, the number of SMEs has grown by 13%, while the number of large
enterprises (with over 250 employees) by 5%.¹ For the same period, SMEs
accounted for an employment growth of 1.9% annually, while employment
in large enterprises increased by 0.8%. In Bulgaria, the growth in number
of small and medium-sized enterprises was higher as compared to EU-27
(24%), which corresponded to 41% growth in employment. The latter was
quite above than the average EU level (12%).
In 2009, there were 316 565 enterprises in the non-financial sector of
Bulgarian economy. Only about 0.2% of them were large scale enterprises.
Hence, the vast majority of enterprises (315 850 or 99.8%) are SMEs.
Within the non-financial business economy 90.3% are micro enterprises,
having a staff headcount of less than 10. The small enterprises represent
8% of the stock, while 1.5% of enterprises are medium-sized. The evolution
of SMEs structure indicates to some differences in 2009 compared to 2005-
2008 period. The share of micro enterprises followed an upward trend,
mostly at the expense of smaller and less pronounced of medium and large
enterprises.
The analysis of dynamics in the number of SMEs should consider: the
changes in the accounting methodology concerning SMEs introduced by the
NSI; the introduction of a single entry point for submission of the annual
statements of the SMEs to both NSI and National Revenue Agency in 2010;³
the introduction of new revision of the Classification of Economic Activities
(NACE.BG-2008) in 2008; the considerable relief of the conditions for
registration of a company; the introduction of the Commercial Register;
and others. Among the factors, which affect the increasing number of SMEs
is also the introduction of a flat tax that has reduced the proportion of the
unregistered economy. Crisis also reflects the size of the sector, as larger
enterprises exempt staff and transformed into smaller firms.
In 2005-2008, the number of SMEs has grown faster than the number of
LSEs. The positive SMEs developments continued in 2009 in contrast with
decline in the number of LSEs as the latter was mainly affected by the
crisis. For the whole of period of 2005-2009, the number of SMEs increased
2
¹European SMEs under Pressure: Annual Report on EU Small and Medium-Sized Enterprises 2009. The report was prepared
by EIM Business and Policy Research with financial support of European Communities under the Competitiveness and Innovation Programme 2007-2013. ² The analysis includes sectors B-J, L, М, N and section 95 of sector S in NACE.BG-2008. 3 From 2010 the SMEs submit annual activity reports /statements with annual returns of levying income tax for 2010 to the National Revenue Agency and NSI.
.
17
Analysis of the situation and factors for development of SMEs,
prepared by BSMEPA and NOEMA, 2011
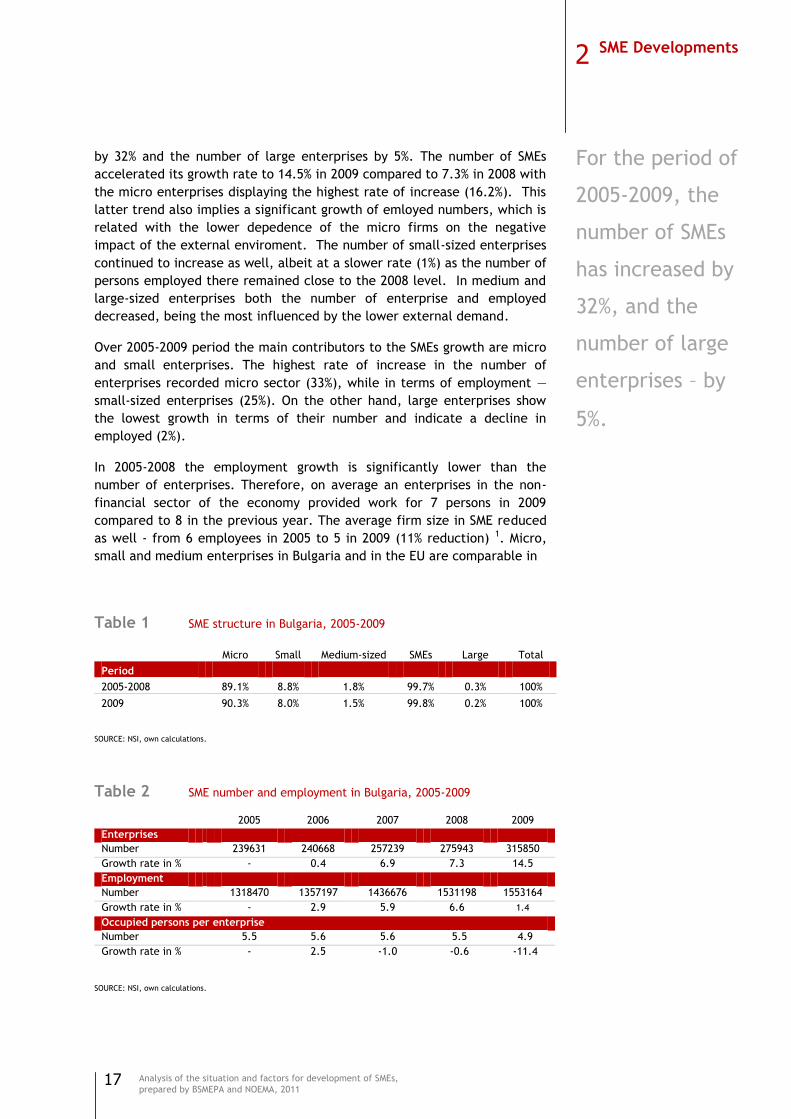
by 32% and the number of large enterprises by 5%. The number of SMEs
accelerated its growth rate to 14.5% in 2009 compared to 7.3% in 2008 with
the micro enterprises displaying the highest rate of increase (16.2%). This
latter trend also implies a significant growth of emloyed numbers, which is
related with the lower depedence of the micro firms on the negative
impact of the external enviroment. The number of small-sized enterprises
continued to increase as well, albeit at a slower rate (1%) as the number of
persons employed there remained close to the 2008 level. In medium and
large-sized enterprises both the number of enterprise and employed
decreased, being the most influenced by the lower external demand.
Over 2005-2009 period the main contributors to the SMEs growth are micro
and small enterprises. The highest rate of increase in the number of
enterprises recorded micro sector (33%), while in terms of employment —
small-sized enterprises (25%). On the other hand, large enterprises show
the lowest growth in terms of their number and indicate a decline in
employed (2%).
In 2005-2008 the employment growth is significantly lower than the
number of enterprises. Therefore, on average an enterprises in the non-
financial sector of the economy provided work for 7 persons in 2009
compared to 8 in the previous year. The average firm size in SME reduced
as well - from 6 employees in 2005 to 5 in 2009 (11% reduction) 1. Micro,
small and medium enterprises in Bulgaria and in the EU are comparable in
Table 1 SME structure in Bulgaria, 2005-2009
Micro Small Medium-sized SMEs Large Total
Period
2005-2008 89.1% 8.8% 1.8% 99.7% 0.3% 100%
2009 90.3% 8.0% 1.5% 99.8% 0.2% 100%
SOURCE: NSI, own calculations.
Table 2 SME number and employment in Bulgaria, 2005-2009
2005 2006 2007 2008 2009
Enterprises
Number 239631 240668 257239 275943 315850
Growth rate in % - 0.4 6.9 7.3 14.5
Employment
Number 1318470 1357197 1436676 1531198 1553164
Growth rate in % - 2.9 5.9 6.6 1.4
Occupied persons per enterprise
Number 5.5 5.6 5.6 5.5 4.9
Growth rate in % - 2.5 -1.0 -0.6 -11.4
SOURCE: NSI, own calculations.
For the period of
2005-2009, the
number of SMEs
has increased by
32%, and the
number of large
enterprises – by
5%.
2 SME Developments
18
Analysis of the situation and factors for development of SMEs,
prepared by BSMEPA and NOEMA, 2011
terms of the average firm sized, while the number of occupied persons per
enterprise in large enterprises in Bulgaria is lower compared to the
average EU level. In 2009 a micro enterprise in Bulgaria provides work for 2
persons on average, a small small-sized - 20, a medium-sized — 97 and the
large-sized enterprise — 684 and all size groups of enterprises followed a
downward trend compared to 2008.
Differences in the share of SMEs in Bulgaria and EU-27 are quite small.
SMEs in Bulgaria account for 99.7% in 2008 and 99.8% in 2009 of the total
number of enterprises in the non-financial economy. By comparison the
share of SMEs sector in the EU-27 is 99.8% in 2008.
Within the SMEs population, the share of micro enterprises in Bulgarian
non-financial business economy is relatively lower as compared to the EU-
27, while the share of the small and medium-sized enterprises is relatively
higher than the EU average level. However, in 2009 differences in the SMEs
structure in Bulgaria and EU countries became smaller as the share of the
micro enterprises in Bulgaria increased by 1.4% and the share of the small
and medium sized enterprises decreased by 1.0% and 0.3% respectively.
Table 3 SME number and individual size in Bulgaria, 2009
Micro Small Medium-
sized
SMEs Large Total
Enterprises
Number 285 881 25 201 4 768 315 850 715 316 565
% 90.3 8.0 1.5 99.8 0.2 100
Employment
Number 594 210 497 951 461 003 1 553 164 488 754 2 041 918
% 29.1 24.4 22.6 76.1 23.9 100
Occupied persons per enterprise
Number 2.1 19.8 96.7 4.9 683.6 6.5 SOURCE: NSI, own calculations
Table 4 SME number and employment in Bulgaria and EU-27, 2008
Micro Small Medium-
sized
SMEs Large Total
Enterprises
N Bulgaria 245 926 24 938 5 079 275 943 774 276 717
% Bulgaria 88.9 9.0 1.8 99.7 0.3 100.0
% ЕU-27 91.8 6.9 1.1 99.8 0.2 100.0
Employment
N Bulgaria 532 745 499 032 499 464 1 531 198 533 429 2 064 627
% Bulgaria 25.8 24.2 24.2 74.2 25.8 100.0
% ЕU-27 29.7 20.7 17.0 67.4 32.6 100.0
Occupied persons per enterprise
Bulgaria 2.2 20.0 98.3 5.5 689.2 7.5
ЕU-27 2.1 19.4 100.3 4.3 1009.6 6.4 SOURCE: NSI, own calculations, EIM Business and Policy Research.
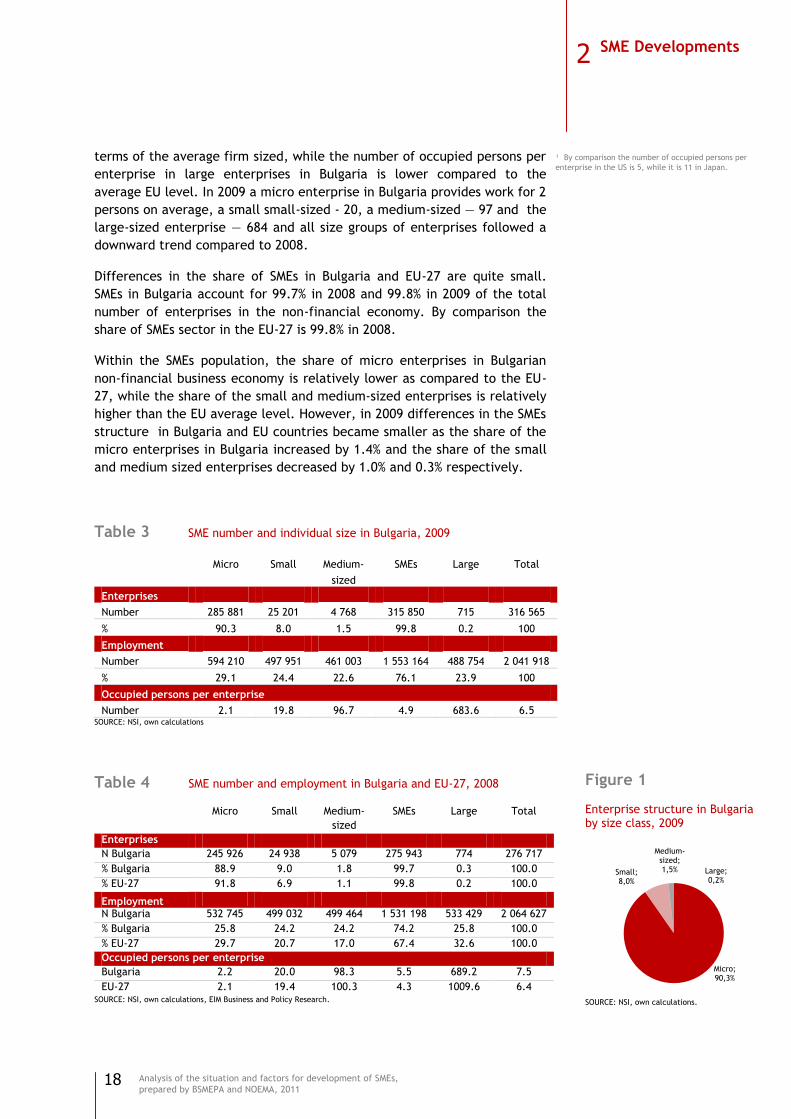
Figure 1
Enterprise structure in Bulgaria by size class, 2009
SOURCE: NSI, own calculations.
Micro; 90,3%
Small; 8,0%
Medium-sized; 1,5% Large;
0,2%
¹ By comparison the number of occupied persons per
enterprise in the US is 5, while it is 11 in Japan.
2 SME Developments
19
Analysis of the situation and factors for development of SMEs,
prepared by BSMEPA and NOEMA, 2011
Distribution of enterprises by size class and economic activities
The distribution of enterprises shows the largest conribution to the SMEs
growth in 2009 made „Trade―¹ and „Accommodation and food service ―.
The number of enterprises there increased by 15% and 17% respectively
and mainly contributed to the SMEs growth. These two sectors of industry
with the largest number of enterprises are typical small scaled sectors in
terms of average firm size — 4 and 5 persons on average respectively.
„Transport―² and „Construction― contirbuted positively on SMEs
development as well reporting a growth rate of 14% and 10% respectively.
The average firm size there is relatively low — 8 and 10 persons.
In 2009 there were some changes in SMEs structure in terms of economic
acticities, although the SMEs sector maintain its share at the level of 2008.
First of all, there is an increase in the share of SMEs in the ―Electricity‖³
and ―Mining‖. Second, micro enterprises, which traditionally belong to the
service sector increased their share in ―Manufacturing‖ from 69% in 2008 to
74% in 2009. Finally, the share of small, medium and large-sized enterpises
reported a decline compared to 2008 in all economic activities.
Enterprises in Bulgarian non-financial business economy are distributed
unevenly over the sectors of industry. ―Trade‖ sector with the largest
number of enterprises (143 190) is a typical small scaled sector in terms of
average firm size (4 persons), while ―Mining‖ is represented mainly by
medium-sized enterprises with an average number of occupied persons
amounted to 71.
Table 5 Enterprises in Bulgaria by sector and individual size, 2009
SMEs Large Total Occupied
persons per
enterprise
Sector by NACE.BG-2008 315 850 715 316 565 6.5
Mining and quarrying 355 18 373 71.3
Manufacturing 31 860 317 32 177 17.9
Electricity, gas, steam¹ 900 21 921 38.7
Water supply² 586 41 627 51.2
Construction 23 521 85 23 606 10.1
Wholesale and retail trade³ 143 190 68 143 258 3.8
Accommodation and food service activities 25 938 24 25 962 5.4
Transporting and storage 19 258 48 19 306 8.3
Information and communication 7 894 21 7 915 8.4
Real estate activities 16 958 6 16 964 2.1
Professional, scientific and technical activities 34 348 5 34 353 2.6
Administrative and support service activities 7 654 61 7 715 12.1
Repair of computers4 3 388 0 3 388 1.8
SOURCE: NSI; own calculations.
¹ Full name of the economic activity according to NACE.BG-2008 is „Electricity, gas, steam and air conditioning supply‖.
² Full name of the economic activity according to NACE.BG-2008 is „Water supply; sewerage; waste management and remediation activities‖.
³ Full name of the economic activity according to NACE.BG-2008 is ―Wholesale and retail trade; repair of motor vehicles and motorcycles‖. 4 Full name of the economic activity according to NACE.BG-2008 is „Repair of computers and personal and household goods‖.
2 SME Developments
20
Analysis of the situation and factors for development of SMEs,
prepared by BSMEPA and NOEMA, 2011
Distribution of enterprises by size class and economic regions
According to 2009 NSI data, in Southern Bulgaria operate twice as many
enterprises in Northern Bulgaria — 252,2 against 115,2 thousands.There are
over 130 thousands enterprises only in the Southwest region, which is the
largest one in terms of number of enterprises. The number of large-sized
enterprises there is the largest as well (327).
The smallest number of enterprises report North-West and North Central
Region regions - 29 and 35 thousands respectively, followed by North-East
and South-East regions - 51 and 53 thousands. The number of SMEs in South
Central region amounted to 66 thousands, which is twice less than the
leading Southwest region.
Enterprises in Bulgarian non-financial business economy are distributed
unevenly by statistical regions in 2005-2009. The region with the smallest
number of enterprises in 2009 (North-West Region) reported the highest
growth rate over the period. This, however, is largely determined by the
changes in the definition of planning regions (according to the new
methodology Lovech and Pleven are already included in the North-West
region).
Table 6 Enterprises in Bulgaria by region and individual size, 2009*
SMEs Large Total
North Bulgaria 115 225 234 115 459
North Western 29 145 56 29 201
North Central 33 290 87 33 383
North Eastern 50 660 91 50 751
South Bulgaria 252 238 532 252 770
South Eastern 52 542 87 52 629
South Central 65 877 118 65 995
South Western 133 819 327 134 146
SOURCE: NSI.
* Number of enterprises is based on ―Statistics of enterprises‖, which includes all sectors.
2 SME Developments
21
Analysis of the situation and factors for development of SMEs,
prepared by BSMEPA and NOEMA, 2011
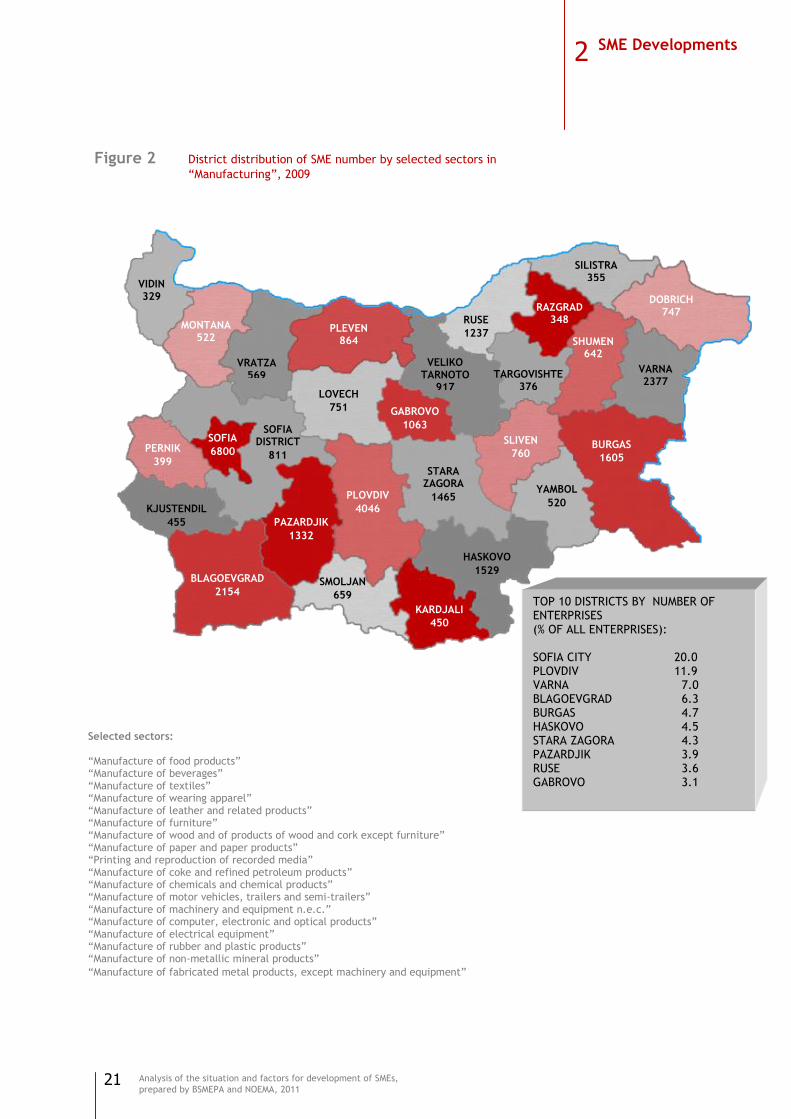
Figure 2 District distribution of SME number by selected sectors in
―Manufacturing‖, 2009
VIDIN 329
MONTANA 522
VRATZA 569
PLEVEN 864
VELIKO TARNOTO
917
RUSE
1237
SILISTRA 355
RAZGRAD 348
DOBRICH 747
VARNA 2377
SHUMEN 642
TARGOVISHTE 376
BURGAS
1605
YAMBOL
520
SLIVEN
760
HASKOVO
1529
STARA ZAGORA
1465 PLOVDIV
4046
PAZARDJIK
1332
GABROVO
1063
LOVECH
751
SOFIA DISTRICT
811
SOFIA
6800 PERNIK
399
KJUSTENDIL
455
BLAGOEVGRAD
2154 SMOLJAN
659
KARDJALI
450
TOP 10 DISTRICTS BY NUMBER OF ENTERPRISES (% OF ALL ENTERPRISES): SOFIA CITY 20.0 PLOVDIV 11.9 VARNA 7.0 BLAGOEVGRAD 6.3 BURGAS 4.7 HASKOVO 4.5 STARA ZAGORA 4.3 PAZARDJIK 3.9 RUSE 3.6 GABROVO 3.1
Selected sectors:
―Manufacture of food products‖ ―Manufacture of beverages‖ ―Manufacture of textiles‖ ―Manufacture of wearing apparel‖ ―Manufacture of leather and related products‖ ―Manufacture of furniture‖ ―Manufacture of wood and of products of wood and cork except furniture‖ ―Manufacture of paper and paper products‖ ―Printing and reproduction of recorded media‖ ―Manufacture of coke and refined petroleum products‖ ―Manufacture of chemicals and chemical products‖ ―Manufacture of motor vehicles, trailers and semi-trailers‖ ―Manufacture of machinery and equipment n.e.c.‖ ―Manufacture of computer, electronic and optical products‖ ―Manufacture of electrical equipment‖ ―Manufacture of rubber and plastic products‖ ―Manufacture of non-metallic mineral products‖
―Manufacture of fabricated metal products, except machinery and equipment‖
2 SME Developments
22
Analysis of the situation and factors for development of SMEs,
prepared by BSMEPA and NOEMA, 2011
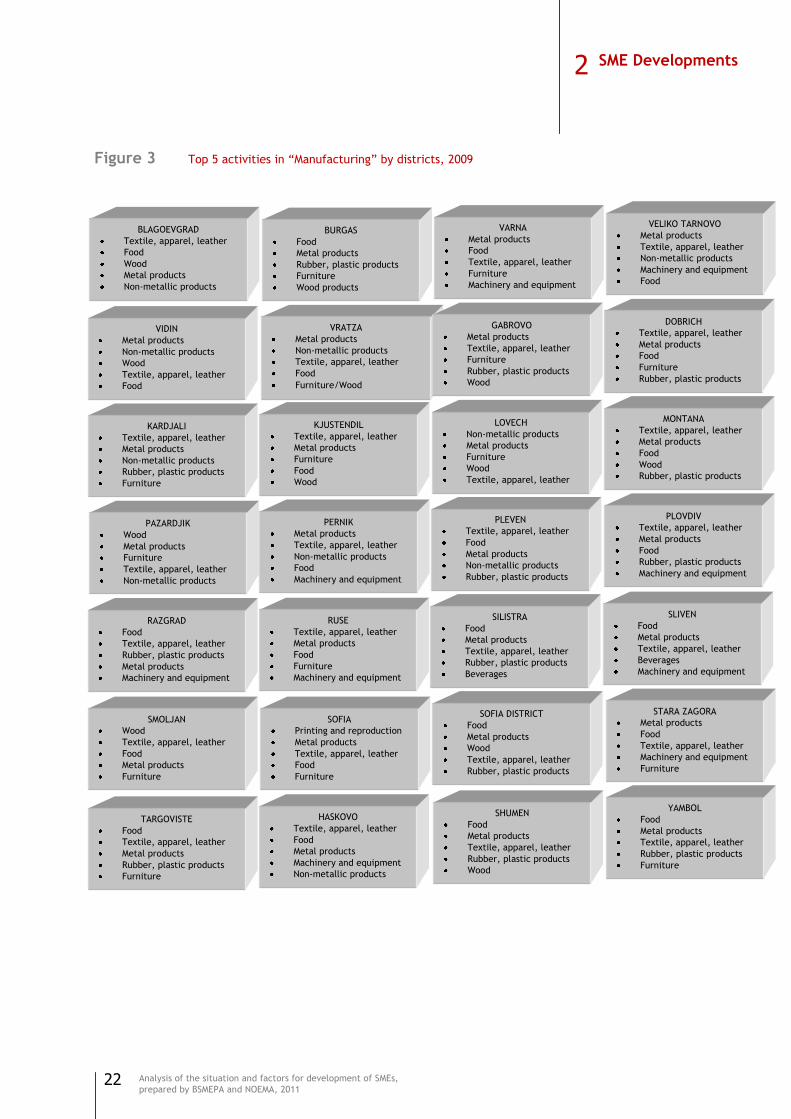
Figure 3 Top 5 activities in ―Manufacturing‖ by districts, 2009
2 SME Developments
BLAGOEVGRAD
Textile, apparel, leather
Food
Wood
Metal products
Non-metallic products
VIDIN
Metal products
Non-metallic products
Wood
Textile, apparel, leather
Food
BURGAS
Food
Metal products
Rubber, plastic products
Furniture
Wood products
VARNA
Metal products
Food
Textile, apparel, leather
Furniture
Machinery and equipment
VELIKO TARNOVO
Metal products
Textile, apparel, leather
Non-metallic products
Machinery and equipment
Food
KARDJALI
Textile, apparel, leather
Metal products
Non-metallic products
Rubber, plastic products
Furniture
PAZARDJIK
Wood
Metal products
Furniture
Textile, apparel, leather
Non-metallic products
RAZGRAD
Food
Textile, apparel, leather
Rubber, plastic products
Metal products
Machinery and equipment
SMOLJAN
Wood
Textile, apparel, leather
Food
Metal products
Furniture
TARGOVISTE
Food
Textile, apparel, leather
Metal products
Rubber, plastic products
Furniture
VRATZA
Metal products
Non-metallic products
Textile, apparel, leather
Food
Furniture/Wood
KJUSTENDIL
Textile, apparel, leather
Metal products
Furniture
Food
Wood
PERNIK
Metal products
Textile, apparel, leather
Non-metallic products
Food
Machinery and equipment
GABROVO
Metal products
Textile, apparel, leather
Furniture
Rubber, plastic products
Wood
DOBRICH
Textile, apparel, leather
Metal products
Food
Furniture
Rubber, plastic products
LOVECH
Non-metallic products
Metal products
Furniture
Wood
Textile, apparel, leather
MONTANA
Textile, apparel, leather
Metal products
Food
Wood
Rubber, plastic products
PLEVEN
Textile, apparel, leather
Food
Metal products
Non-metallic products
Rubber, plastic products
PLOVDIV
Textile, apparel, leather
Metal products
Food
Rubber, plastic products
Machinery and equipment
RUSE
Textile, apparel, leather
Metal products
Food
Furniture
Machinery and equipment
SILISTRA
Food
Metal products
Textile, apparel, leather
Rubber, plastic products
Beverages
SLIVEN
Food
Metal products
Textile, apparel, leather
Beverages
Machinery and equipment
SOFIA
Printing and reproduction
Metal products
Textile, apparel, leather
Food
Furniture
SOFIA DISTRICT
Food
Metal products
Wood
Textile, apparel, leather
Rubber, plastic products
STARA ZAGORA
Metal products
Food
Textile, apparel, leather
Machinery and equipment
Furniture
HASKOVO
Textile, apparel, leather
Food
Metal products
Machinery and equipment
Non-metallic products
SHUMEN
Food
Metal products
Textile, apparel, leather
Rubber, plastic products
Wood
YAMBOL
Food
Metal products
Textile, apparel, leather
Rubber, plastic products
Furniture

23
Analysis of the situation and factors for development of SMEs,
prepared by BSMEPA and NOEMA, 2011
Birth, death and surviving of SMEs
On average for the period 2006-2008 the number of newly established
enterprises in the economy amounted to 48 442, while their share in the
total number of economically active enterprises is 19%. The number of
persons employed in newly established businesses is 123 409 or 6.2% of the
total, indicating that start-ups during the period were characterized by
relatively low average number of employees — 3 persons. The coefficient
of enterprise deaths was 14.3%, which corresponds to 35 836 firms. Persons
employed in them amounted to 95 689 persons or 4.8%, which means that
on average in a closed enterprise had also worked 3 persons. The dynamics
of the considered indicators leads to an increase in the number of the
active companies with 12 605 on average for the period (net enterprise
birth), or 5% net increase. These indicators exceed the average EU-27 level
(for comparison, in 2005 the rate of enterprise births in the EU was 10.1%,
that of deaths — 9.1%, and net birth — 1%).
The structure of the newborn and the closed firms for 2006-2008 — in
respect with the size — indicates for a leading contribution of the micro-
enterprises. In firms with 1 to 9 employees rate of birth is about 11%,
while it is 2% for the companies with more than 10 employees, and rate of
death for these enterprises is respectively 5% and 1%.
Differences in the structure of the economic activities of newborn and
closed SMEs are also observed. For 2006-2008 in "Construction" and " Electricity, gas, steam and air conditioning supply‖ net enterprise birth
amounts to 20% and 16% respectively, while in the ―Mining and quarrying‖
this indicator is 7%. This dynamics is mainly explained by the lower rates
of deaths in these cases.
Least closed firms are found in the industries of "Electricity, gas, steam
and air conditioning supply‖ (9.2%), ―Mining and quarrying‖ (8.1%), and
―Construction‖ (2.3%)
Table 7 Enterprise birth and death in Bulgaria, 2006-2009
2006 2007 2008
Average
2006 /2008 2009**
Enterprise birth
Number 40 555 55 488 49 287 48 442 55 891
5 of active enterprises 17.5 22.2 18.2 18.2 18.0
Enterprise death
Number 35 602 36 191 35 716 35 836 43 470
% of active enterprises 15.4 14.5 13.2 13.2 14.0
Net enterprise birth*
Number 4 948 19 297 13 571 12 605 12 420
% of active enterprises 2.1 7.7 5.0 5.0 4.0
SOURCE: NSI, own calculations.
* Enterprise birth minus enterprise death. ** Estimation by Noema.
Figure 4
Average coefficient of birth, death and net birth, 2006-2008
SOURCE: Eurostat
12,3%11,2%
1,8%
9,3%
5,8%
0,6%2,1%4,5%
1,1%
Total Enterprises with 9 or less
employees
Enterprises with 10 or
more employees
Birth rate Death rate
Net birth rate
2 SME Developments
24
Analysis of the situation and factors for development of SMEs,
prepared by BSMEPA and NOEMA, 2011
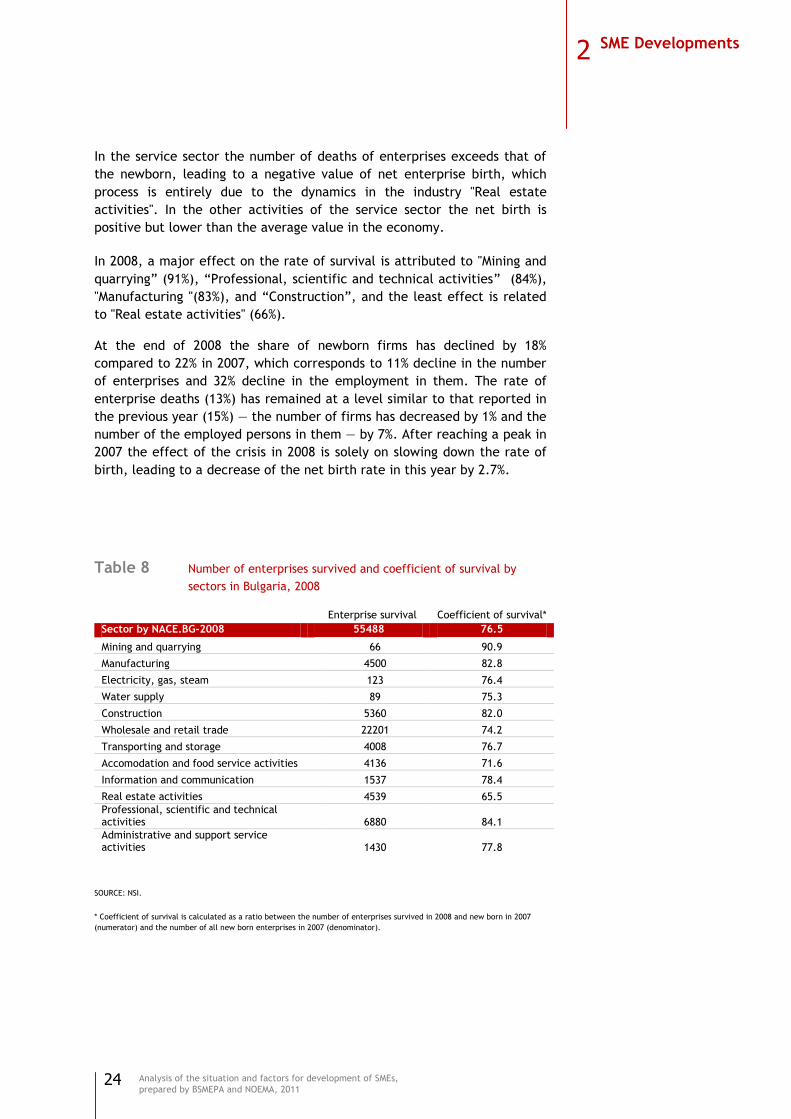
In the service sector the number of deaths of enterprises exceeds that of
the newborn, leading to a negative value of net enterprise birth, which
process is entirely due to the dynamics in the industry "Real estate
activities". In the other activities of the service sector the net birth is
positive but lower than the average value in the economy.
In 2008, a major effect on the rate of survival is attributed to "Mining and
quarrying‖ (91%), ―Professional, scientific and technical activities‖ (84%),
"Manufacturing "(83%), and ―Construction‖, and the least effect is related
to "Real estate activities" (66%).
At the end of 2008 the share of newborn firms has declined by 18%
compared to 22% in 2007, which corresponds to 11% decline in the number
of enterprises and 32% decline in the employment in them. The rate of
enterprise deaths (13%) has remained at a level similar to that reported in
the previous year (15%) — the number of firms has decreased by 1% and the
number of the employed persons in them — by 7%. After reaching a peak in
2007 the effect of the crisis in 2008 is solely on slowing down the rate of
birth, leading to a decrease of the net birth rate in this year by 2.7%.
Table 8 Number of enterprises survived and coefficient of survival by
sectors in Bulgaria, 2008
Enterprise survival Coefficient of survival*
Sector by NACE.BG-2008 55488 76.5
Mining and quarrying 66 90.9
Manufacturing 4500 82.8
Electricity, gas, steam 123 76.4
Water supply 89 75.3
Construction 5360 82.0
Wholesale and retail trade 22201 74.2
Transporting and storage 4008 76.7
Accomodation and food service activities 4136 71.6
Information and communication 1537 78.4
Real estate activities 4539 65.5
Professional, scientific and technical activities 6880 84.1
Administrative and support service activities 1430 77.8
SOURCE: NSI.
* Coefficient of survival is calculated as a ratio between the number of enterprises survived in 2008 and new born in 2007
(numerator) and the number of all new born enterprises in 2007 (denominator).
2 SME Developments
25
Analysis of the situation and factors for development of SMEs,
prepared by BSMEPA and NOEMA, 2011
The expectations for the business demography of the SMEs are associated
with a reduction of the rate of birth and an increase in the rate of
enterprise death. According to the estimations of the EC the rate of birth
has decreased significantly in 2009 in most EU countries, while the rate of
deaths has increased. Expectations for the development of these indicators
in the Bulgarian economy are similar. The basis for such assumption is
provided by the data on the dynamics in 2009 and 2010 of other indicators
related to the SMEs demography. On the one hand, SMEs profits are
significantly reduced, which directly affects the rate of deaths. On the
other hand, similar effects could be expected due to the dynamics on the
labor market — it indicates for continuing trend of reduction of
employment in the economy, thus raising the unemployment. However,
due to the late effects of the crisis on the domestic economy (as compared
to the EU economy), the expected decline in the net growth of the SMEs in
2009 is rather limited.
2 SME Developments
26
Analysis of the situation and factors for development of SMEs,
prepared by BSMEPA and NOEMA, 2011
Employment in the SME sector
Contribution of SMEs to the employment
Despite their small individual size, the most impressive fact for the SMEs is
their contribution to employment. Three quarters of the employees in
Bulgaria are in the SME sector. For comparison, at least two thirds of jobs
in EU countries are provided by the SMEs. In 2009, the SMEs in Bulgaria,
provide jobs for 76% of all employees in the country. In spite of the crisis,
the number of employees in the SMEs in 2009 increases compared to 2008
(by 22 000), while in the large enterprises it decreases (by 45 000).
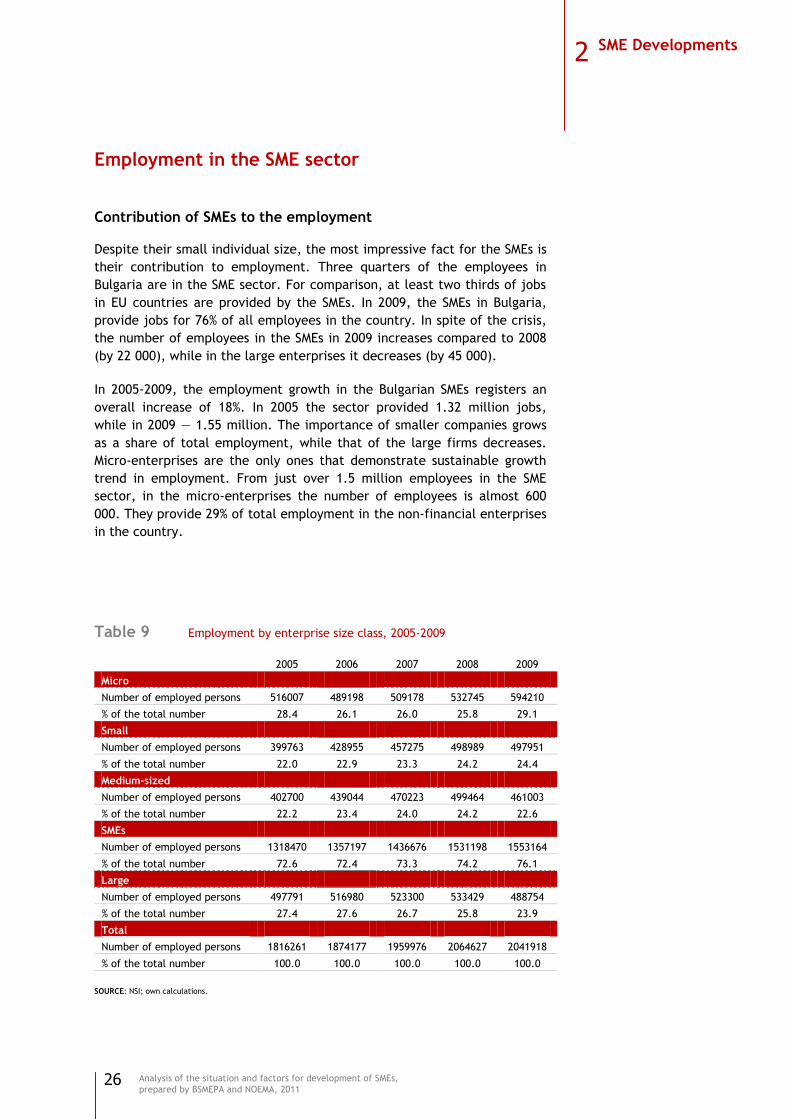
In 2005-2009, the employment growth in the Bulgarian SMEs registers an
overall increase of 18%. In 2005 the sector provided 1.32 million jobs,
while in 2009 — 1.55 million. The importance of smaller companies grows
as a share of total employment, while that of the large firms decreases.
Micro-enterprises are the only ones that demonstrate sustainable growth
trend in employment. From just over 1.5 million employees in the SME
sector, in the micro-enterprises the number of employees is almost 600
000. They provide 29% of total employment in the non-financial enterprises
in the country.
Table 9 Employment by enterprise size class, 2005-2009
2005 2006 2007 2008 2009
Micro
Number of employed persons 516007 489198 509178 532745 594210
% of the total number 28.4 26.1 26.0 25.8 29.1
Small
Number of employed persons 399763 428955 457275 498989 497951
% of the total number 22.0 22.9 23.3 24.2 24.4
Medium-sized
Number of employed persons 402700 439044 470223 499464 461003
% of the total number 22.2 23.4 24.0 24.2 22.6
SMEs
Number of employed persons 1318470 1357197 1436676 1531198 1553164
% of the total number 72.6 72.4 73.3 74.2 76.1
Large
Number of employed persons 497791 516980 523300 533429 488754
% of the total number 27.4 27.6 26.7 25.8 23.9
Total
Number of employed persons 1816261 1874177 1959976 2064627 2041918
% of the total number 100.0 100.0 100.0 100.0 100.0
SOURCE: NSI; own calculations.
2 SME Developments
27
Analysis of the situation and factors for development of SMEs,
prepared by BSMEPA and NOEMA, 2011
The crisis in the 2009 causes a total reduction in jobs of 1% compared to
2008. This total effect is relatively low due to the micro-enterprises, in
which employment significantly increases (11%). All other size groups of
enterprises are releasing employees, and the trend is even stronger for
larger SMEs. Accordingly, the lowest contraction is in the small firms (with
a decline of 0.2%), followed by the medium-sized enterprises (-8%). The
highest proportion of job losses is in the large companies (-9%).
In recent years the economic upturn the SME sector has a leading
contribution to the positive dynamics of in the number of employees. The
growth of employment in them is over three times higher than that in the
large enterprises. Regarding the size of the firms, the greatest growth of
employment was observed in the small and medium-sized enterprises —by
7.7% and 7.2% respectively for 2006-2008.
The key influence of the SME sector on the employment continues in 2009,
although the economic activity in the country significantly decreases. Even
at a slower rate, the number of people employed is still increasing (1.2%)
and to great extent compensates the considerable decline in employment
in the large enterprises (8.4%).
Structure of employment by economic activities
Considering the economic activities within the SMEs, the biggest dynamic is
observed in the industries "Construction" and "Real estate activities",
where the number of employees is amended by two-digit growth rates,
namely by 19% and 13% on average for the period 2006-2008. There is also
a significant influence if the industries " Wholesale and retail trade; repair
of motor vehicles and motorcycles " and "Accommodation and food service
activities ", in which the value of this indicator amounts to 5% and 3%.
In 2009, in the small enterprises the number of employees barely changes
on a yearly basis (-0.2%), but the branch structure of employment shows
some dynamics. The growth of employment in the industry
"Accommodation and food service activities‖ (15%) and ―Wholesale and
retail trade; repair of motor vehicles and motorcycles‖ (2%) is significant;
however it is not sufficient to compensate for the drop in employment in
―Manufacturing‖ and ―Construction‖ (5% and 8% respectively).
Only the number of employees in the micro-enterprises is characterized by
positive developments in all economic activities. For the period 2006-2009
the employment growth for the entire economy is 12% with a major
influence of the industries "Wholesale and retail trade; repair of motor
vehicles and motorcycles" (12%), "Accommodation and food service
activities‖ (16%), ―Transporting and storage‖ (11%), and ―Construction‖
(7%).
For the period
2005-2009, the
employment in
the SMEs increases
by 18%, while in
the large
enterprises — it
dicreases by 2%.
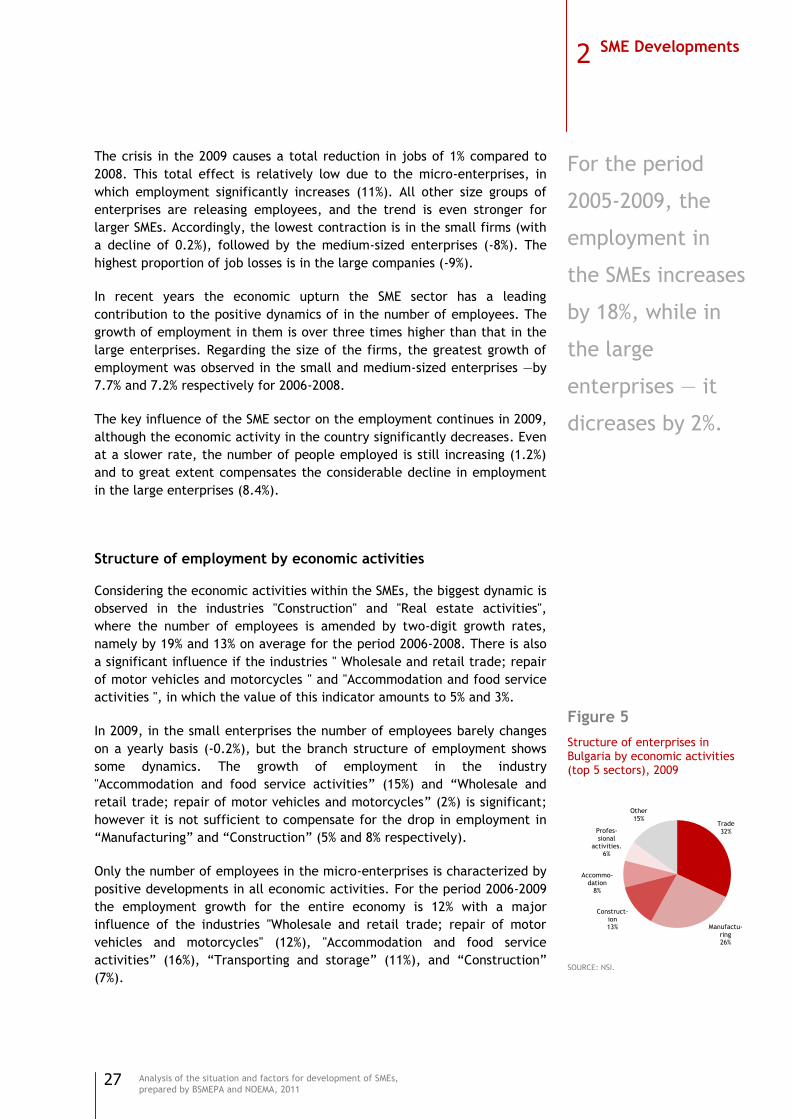
Figure 5 Structure of enterprises in Bulgaria by economic activities (top 5 sectors), 2009
SOURCE: NSI.
Trade32%
Manufactu-ring26%
Construct-ion13%
Accommo-dation
8%
Profes-sional
activities.6%
Other15%
2 SME Developments
28
Analysis of the situation and factors for development of SMEs,
prepared by BSMEPA and NOEMA, 2011
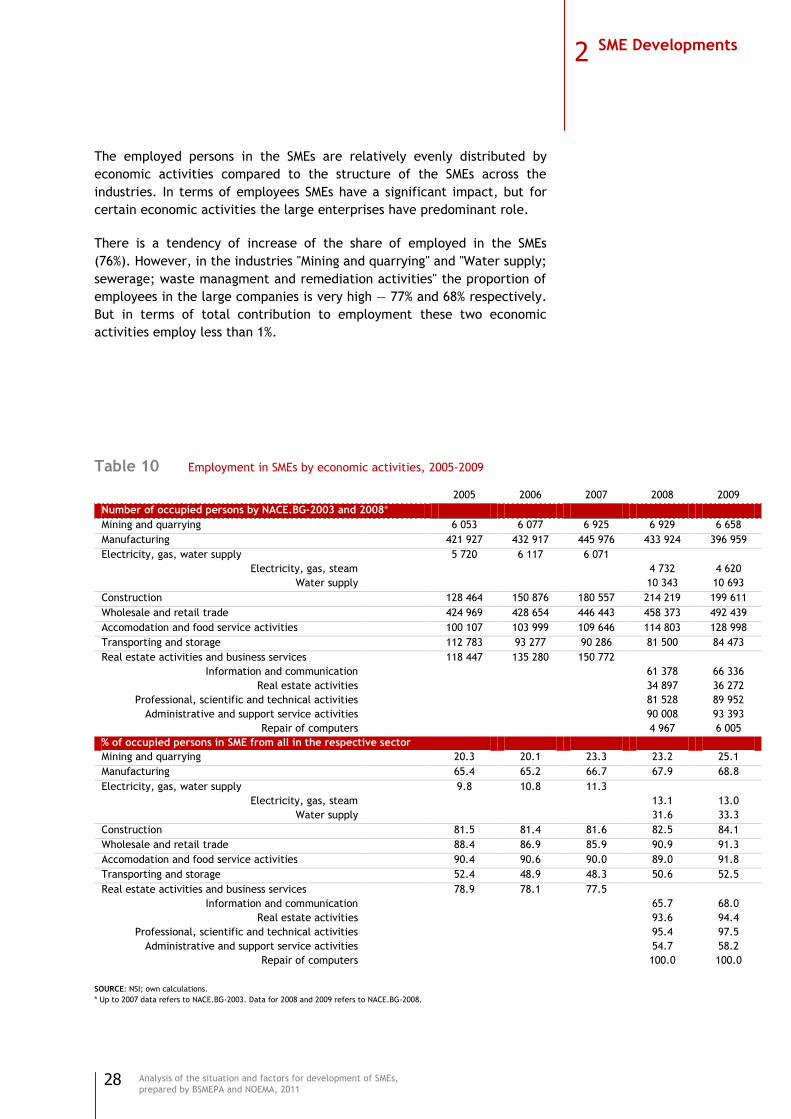
The employed persons in the SMEs are relatively evenly distributed by
economic activities compared to the structure of the SMEs across the
industries. In terms of employees SMEs have a significant impact, but for
certain economic activities the large enterprises have predominant role.
There is a tendency of increase of the share of employed in the SMEs
(76%). However, in the industries "Mining and quarrying" and "Water supply;
sewerage; waste managment and remediation activities" the proportion of
employees in the large companies is very high — 77% and 68% respectively.
But in terms of total contribution to employment these two economic
activities employ less than 1%.
Table 10 Employment in SMEs by economic activities, 2005-2009
2005 2006 2007 2008 2009
Number of occupied persons by NACE.BG-2003 and 2008*
Mining and quarrying 6 053 6 077 6 925 6 929 6 658
Manufacturing 421 927 432 917 445 976 433 924 396 959
Electricity, gas, water supply 5 720 6 117 6 071
Electricity, gas, steam 4 732 4 620
Water supply 10 343 10 693
Construction 128 464 150 876 180 557 214 219 199 611
Wholesale and retail trade 424 969 428 654 446 443 458 373 492 439
Accomodation and food service activities 100 107 103 999 109 646 114 803 128 998
Transporting and storage 112 783 93 277 90 286 81 500 84 473
Real estate activities and business services 118 447 135 280 150 772
Information and communication 61 378 66 336
Real estate activities 34 897 36 272
Professional, scientific and technical activities 81 528 89 952
Administrative and support service activities 90 008 93 393
Repair of computers 4 967 6 005
% of occupied persons in SME from all in the respective sector
Mining and quarrying 20.3 20.1 23.3 23.2 25.1
Manufacturing 65.4 65.2 66.7 67.9 68.8
Electricity, gas, water supply 9.8 10.8 11.3
Electricity, gas, steam 13.1 13.0
Water supply 31.6 33.3
Construction 81.5 81.4 81.6 82.5 84.1
Wholesale and retail trade 88.4 86.9 85.9 90.9 91.3
Accomodation and food service activities 90.4 90.6 90.0 89.0 91.8
Transporting and storage 52.4 48.9 48.3 50.6 52.5
Real estate activities and business services 78.9 78.1 77.5
Information and communication 65.7 68.0
Real estate activities 93.6 94.4
Professional, scientific and technical activities 95.4 97.5
Administrative and support service activities 54.7 58.2
Repair of computers 100.0 100.0
SOURCE: NSI; own calculations.
* Up to 2007 data refers to NACE.BG-2003. Data for 2008 and 2009 refers to NACE.BG-2008.
2 SME Developments
29
Analysis of the situation and factors for development of SMEs,
prepared by BSMEPA and NOEMA, 2011
Two of the economic activities form almost 58% of the employment in the
SMEs — ―Wholesale and retail trade; repair of motor vehicles and
motorcycles‖ (32%) and "Manufacturing" (26%). In the first industry the
employment is significantly higher compared to the national average (91%),
and in the second — slightly lower (68%). Other industries in which SMEs
have dominant contribution in providing jobs are "Real estate activities",
"Professional, scientific and technical activities" and "Accommodation and
food service activities‖ — 98%, 95% and 89% respectively.
In five of industries the micro-enterprises have a high share in employment
which significantly exceeds the average level for the SMEs sector of 29%.
These are "Repair of computers‖ (84%), ―Professional, scientific and
technical activities‖ (65%),"Real estate activities‖ (58%), "Wholesale and
retail trade; repair of motor vehicles and motorcycles" (51%), and
―Accommodation and food service activities‖ (41%).
Small companies have a key role in the structure of employment only in
―Construction‖ (32%), where, however, their share is equal to that of
medium-sized enterprises. Medium-sized enterprises are leading in
employment only in "Manufacturing" (33%), and their share is close to that
of large enterprises (31%). Medium-sized enterprises have important role in
employment in four economic activities (immediately after the large
enterprises in the sector): "Mining and quarrying‖ (15%), ―Water supply;
sewerage; waste management and remediation activities‖ (22%)," Information and communication‖ (25%), and "Administrative and support
service activities‖ (27%). Large companies dominate in the industry
"Electricity, gas, steam and air conditioning supply‖, giving 87% of the
jobs.
Structure of employment by economic regions
A significant share of the employment in the non-financial enterprises in
the country is provided by the South Western planning region — the region
in which the capital is located (39%). Next in line is the South Central
region (17%) and South Eastern region (14%), while the lowest share of the
employment is in the North Western region (8%), where the population
density in the country is also the lowest.
The employment structure is quite uneven across the regions. The South
Western region provides at least a third of the employees in all economic
activities except for "Manufacturing", and in certain industries — nearly
two thirds (―Professional, scientific and technical activities" and
"Administrative and support service activities‖). The region provides 80% of
the employees in "Information and communication‖. The South Central
region has a leading presence in the "Manufacturing" (24%). The South
Eastern region has more than one third of employees in ―Mining and
quarrying‖ (36%). Relatively evenly distributed is the employment in
"Manufacturing" and "Water supply; sewerage; waste management and
2 SME Developments
30
Analysis of the situation and factors for development of SMEs,
prepared by BSMEPA and NOEMA, 2011
remediation activities" followed by "Accommodation and food service
activities‖, ―Construction‖, ―Transporting and storage‖ and ―Repair of
computers‖. For all of the activities the share of employment in the South
Western region is relatively high, while this share is relatively low in the
North Western region.
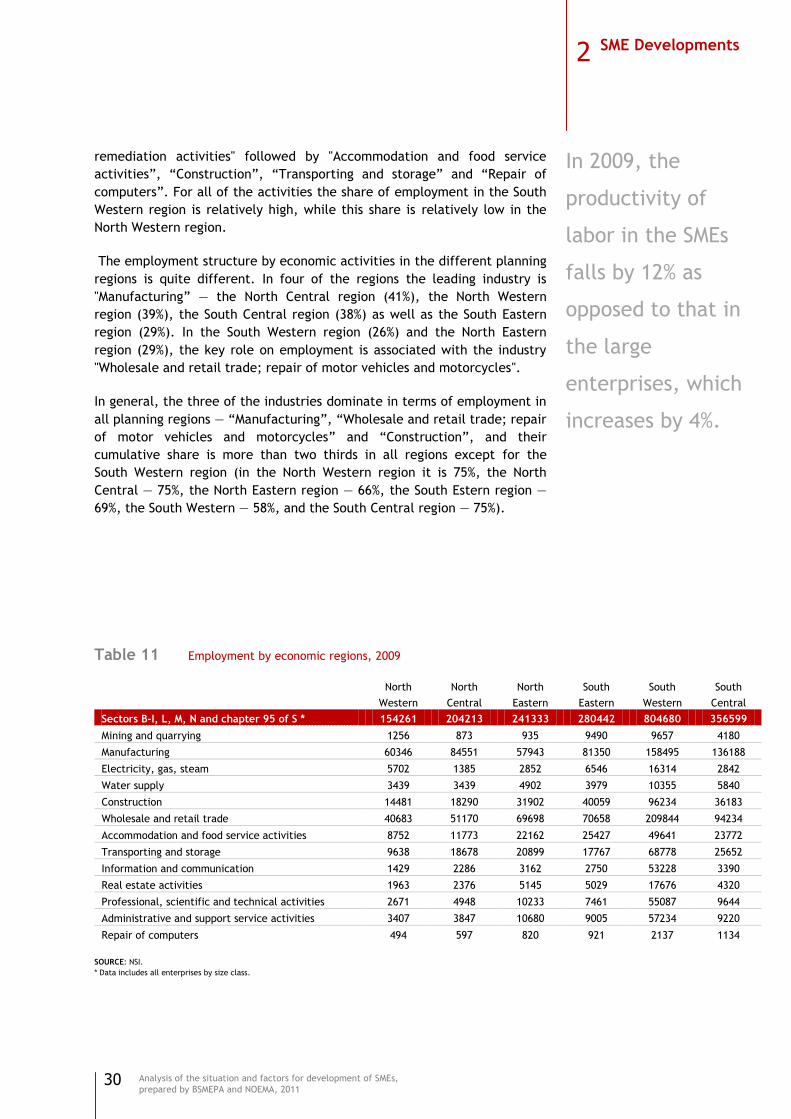
The employment structure by economic activities in the different planning
regions is quite different. In four of the regions the leading industry is
"Manufacturing‖ — the North Central region (41%), the North Western
region (39%), the South Central region (38%) as well as the South Eastern
region (29%). In the South Western region (26%) and the North Eastern
region (29%), the key role on employment is associated with the industry
"Wholesale and retail trade; repair of motor vehicles and motorcycles".
In general, the three of the industries dominate in terms of employment in
all planning regions — ―Manufacturing‖, ―Wholesale and retail trade; repair
of motor vehicles and motorcycles‖ and ―Construction‖, and their
cumulative share is more than two thirds in all regions except for the
South Western region (in the North Western region it is 75%, the North
Central — 75%, the North Eastern region — 66%, the South Estern region —
69%, the South Western — 58%, and the South Central region — 75%).
Table 11 Employment by economic regions, 2009
North
Western
North
Central
North
Eastern
South
Eastern
South
Western
South
Central
Sectors В-I, L, M, N and chapter 95 of S * 154261 204213 241333 280442 804680 356599
Mining and quarrying 1256 873 935 9490 9657 4180
Manufacturing 60346 84551 57943 81350 158495 136188
Electricity, gas, steam 5702 1385 2852 6546 16314 2842
Water supply 3439 3439 4902 3979 10355 5840
Construction 14481 18290 31902 40059 96234 36183
Wholesale and retail trade 40683 51170 69698 70658 209844 94234
Accommodation and food service activities 8752 11773 22162 25427 49641 23772
Transporting and storage 9638 18678 20899 17767 68778 25652
Information and communication 1429 2286 3162 2750 53228 3390
Real estate activities 1963 2376 5145 5029 17676 4320
Professional, scientific and technical activities 2671 4948 10233 7461 55087 9644
Administrative and support service activities 3407 3847 10680 9005 57234 9220
Repair of computers 494 597 820 921 2137 1134
SOURCE: NSI.
* Data includes all enterprises by size class.
In 2009, the
productivity of
labor in the SMEs
falls by 12% as
opposed to that in
the large
enterprises, which
increases by 4%.
2 SME Developments

31
Analysis of the situation and factors for development of SMEs,
prepared by BSMEPA and NOEMA, 2011
Structure of production and labour productivity
In 2009, the turnover of the nonfinancial sector amounted to 179 279
million leva, or an average of 566.5 thousand leva per enterprise. The
share of the SMEs in total turnover in the economy is 69%. Regarding the
size of enterprises, there is a rather even distribution among them but the
dominant role is for the large companies (31%). During the period the gross
value added created by the non-financial enterprises amounted to 32 465
million leva, but in this case the contribution of SMEs is slightly lower
(62%). The most significant share is that of the large enterprises (38%),
followed by the medium-sized (24%), small (21%) and micro-enterprises
(17%).
Since 2006, a tendency for gradually increasing the share of SMEs in terms
of turnover is observed. It continues in 2009 as well. The indicator
increases from 66% to 69%, and this trend is typical for the majority of the
economic activities, except for ―Mining and quarrying‖.
The positive dynamics of these indicators in the SMEs is determined by the
faster growth rate in the sector (compared to that of the large enterprises)
in the previous two years. In 2009, the SMEs continue to increase their
share in total turnover, although their turnover decreases on annual basis
by 10%. However, this decline was significantly lower than the one
reported in the large enterprises (19%).
For the period 2006-2008, the structural changes in the value added are
similar to those of turnover. The share of the SMEs steadily increases from
54% to 64%, due to the growth rate of this indicator (30%), which is over
two times higher than that of the large enterprises (12%). These positive
trend is interrupted in 2009, when some different dynamics of turnover is
observed —the decline in value added in the SMEs sector is 10% compared
to 4% in the large enterprises. This, in turn, determines the decline in the
share of the SMEs in the total value added of the economy.
The lower contribution of the SMEs sector in the value added also
determines the lower level of labor productivity. The dynamics of the
indicators under consideration in the recent years reveals a positive
correlation between the enterprise size and the value added per
employee. For all economic activity, the labour productivity in the SMEs is
lower compared to the average level of the labour productivity for the
entire economy.
This tendency is confirmed at the data for the various economic activities.
In the industries such as ―Accommodation and food service activities‖,
―Wholesale and retail trade; repair of motor vehicles and motorcycles‖
and ―Construction‖, in which the contribution of the SMEs to employment
is significant, the labor productivity is traditionally lower. A possible
explanation for this tendency is that the SMEs are characterized by
relatively small economies of scale, are less capital intensive, and have
Figure 6
Dynamics of turnover by enterprise size class, 2006-2009
SOURCE: NSI, own calculations.
Figure 7
Dynamics of value added by enterprise size class, 2006-2009
SOURCE: NSI, own calculations.
63,9% 65,9% 65,8% 68,9%
15,7%
24,1%18,7%
-9,5%
27,6%
13,7% 15,8%
-19,2%-30%-20%-10%
0%10%20%30%40%50%60%70%80%
2006 2007 2008 2009
Share of SME in total turnover
Nominal change of SME turnover
Nominal change of large enterprises turnover
54,2%58,4%
64,0% 62,4%
22,3%
41,8%
26,9%
-10,2%
17,4%
19,6%
0,0%-4,4%
-20%-10%
0%10%20%30%40%50%60%70%
2006 2007 2008 2009
Share of SME in total value added
Change in valued added of SMEs
Change in valued added of large enterprises
2 SME Developments
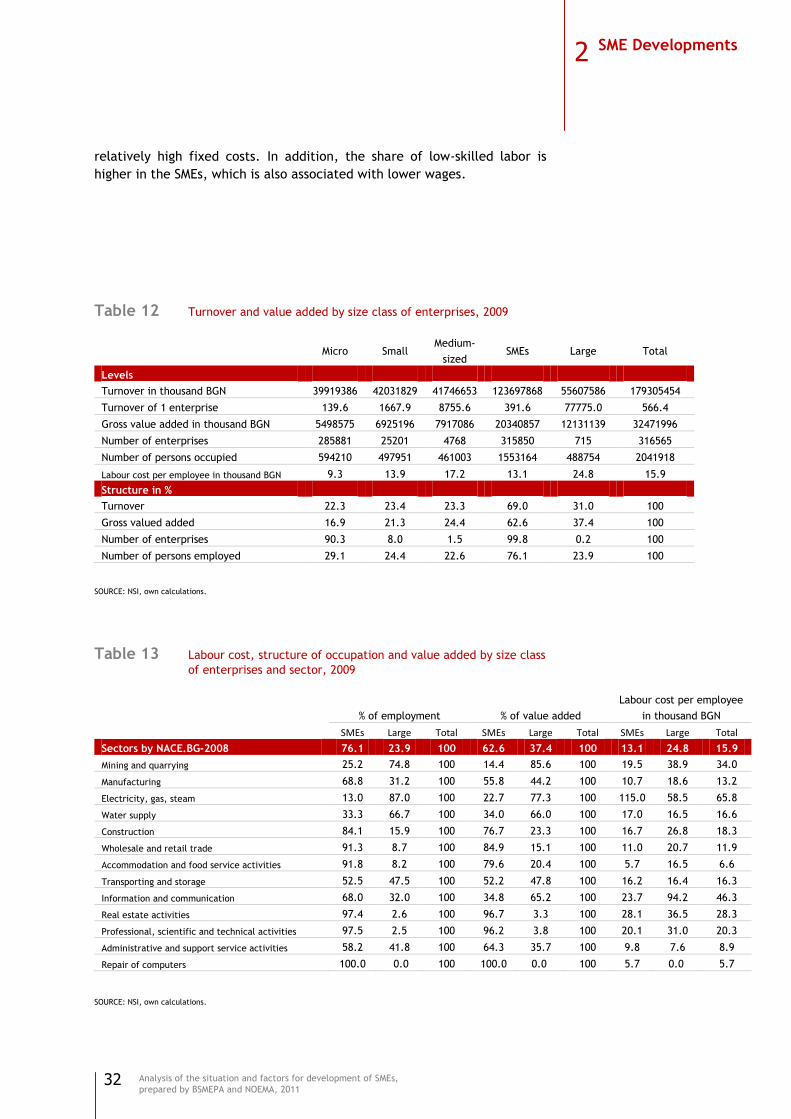
32
Analysis of the situation and factors for development of SMEs,
prepared by BSMEPA and NOEMA, 2011
relatively high fixed costs. In addition, the share of low-skilled labor is
higher in the SMEs, which is also associated with lower wages.
Table 12 Turnover and value added by size class of enterprises, 2009
Micro Small Medium-
sized SMEs Large Total
Levels
Turnover in thousand BGN 39919386 42031829 41746653 123697868 55607586 179305454
Turnover of 1 enterprise 139.6 1667.9 8755.6 391.6 77775.0 566.4
Gross value added in thousand BGN 5498575 6925196 7917086 20340857 12131139 32471996
Number of enterprises 285881 25201 4768 315850 715 316565
Number of persons occupied 594210 497951 461003 1553164 488754 2041918
Labour cost per employee in thousand BGN 9.3 13.9 17.2 13.1 24.8 15.9
Structure in %
Turnover 22.3 23.4 23.3 69.0 31.0 100
Gross valued added 16.9 21.3 24.4 62.6 37.4 100
Number of enterprises 90.3 8.0 1.5 99.8 0.2 100
Number of persons employed 29.1 24.4 22.6 76.1 23.9 100
SOURCE: NSI, own calculations.
Table 13 Labour cost, structure of occupation and value added by size class
of enterprises and sector, 2009
% of employment % of value added
Labour cost per employee
in thousand BGN
SMEs Large Total SMEs Large Total SMEs Large Total
Sectors by NACE.BG-2008 76.1 23.9 100 62.6 37.4 100 13.1 24.8 15.9
Mining and quarrying 25.2 74.8 100 14.4 85.6 100 19.5 38.9 34.0
Manufacturing 68.8 31.2 100 55.8 44.2 100 10.7 18.6 13.2
Electricity, gas, steam 13.0 87.0 100 22.7 77.3 100 115.0 58.5 65.8
Water supply 33.3 66.7 100 34.0 66.0 100 17.0 16.5 16.6
Construction 84.1 15.9 100 76.7 23.3 100 16.7 26.8 18.3
Wholesale and retail trade 91.3 8.7 100 84.9 15.1 100 11.0 20.7 11.9
Accommodation and food service activities 91.8 8.2 100 79.6 20.4 100 5.7 16.5 6.6
Transporting and storage 52.5 47.5 100 52.2 47.8 100 16.2 16.4 16.3
Information and communication 68.0 32.0 100 34.8 65.2 100 23.7 94.2 46.3
Real estate activities 97.4 2.6 100 96.7 3.3 100 28.1 36.5 28.3
Professional, scientific and technical activities 97.5 2.5 100 96.2 3.8 100 20.1 31.0 20.3
Administrative and support service activities 58.2 41.8 100 64.3 35.7 100 9.8 7.6 8.9
Repair of computers 100.0 0.0 100 100.0 0.0 100 5.7 0.0 5.7
SOURCE: NSI, own calculations.
2 SME Developments

33
Analysis of the situation and factors for development of SMEs,
prepared by BSMEPA and NOEMA, 2011
The dynamics of the labor productivity over the recent years can be
differentiated into two periods. In 2006 and 2007, the value added per
employee in the SMEs is characterized by anticipating growth compared to
that of the large enterprises — 26% and 15% respectively. In 2008, there is
a gradual slow down of the indicator for all SMEs, while for large
companies — there is a decline of 1.7%.
In 2009, the labor productivity in the large enterprises increases by 4%,
which is evidence for the process of adaptation to changes in the economic
environment created by the crisis. In contrast, in the SMEs, which are
affected by the external environment later, the labor productivity
decreases by 12%. This indicates that the process of adjusting employment
to lower income in the SMEs are lagging behind.
The labour
productivity in the
SMEs is lower than
the average for the
entire economy.
2 SME Developments
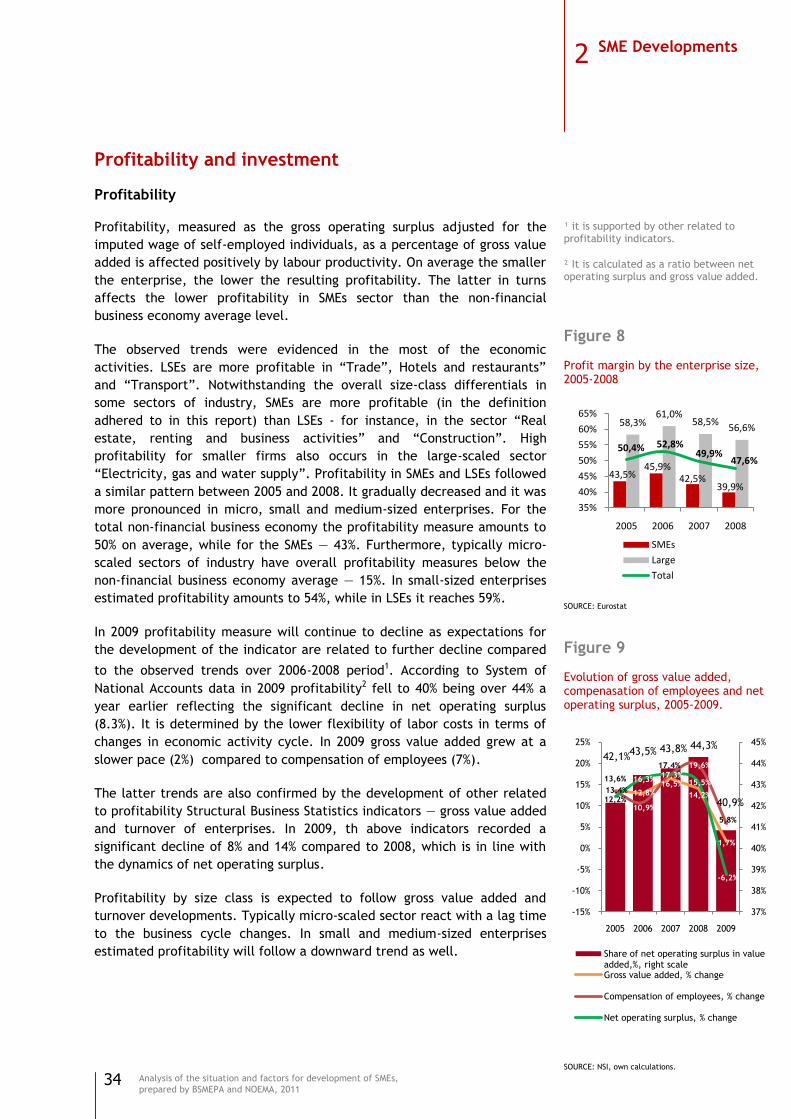
34
Analysis of the situation and factors for development of SMEs,
prepared by BSMEPA and NOEMA, 2011
Profitability and investment
Profitability
Profitability, measured as the gross operating surplus adjusted for the
imputed wage of self-employed individuals, as a percentage of gross value
added is affected positively by labour productivity. On average the smaller
the enterprise, the lower the resulting profitability. The latter in turns
affects the lower profitability in SMEs sector than the non-financial
business economy average level.
The observed trends were evidenced in the most of the economic
activities. LSEs are more profitable in ―Trade‖, Hotels and restaurants‖
and ―Transport‖. Notwithstanding the overall size-class differentials in
some sectors of industry, SMEs are more profitable (in the definition
adhered to in this report) than LSEs - for instance, in the sector ―Real
estate, renting and business activities‖ and ―Construction‖. High
profitability for smaller firms also occurs in the large-scaled sector
―Electricity, gas and water supply‖. Profitability in SMEs and LSEs followed
a similar pattern between 2005 and 2008. It gradually decreased and it was
more pronounced in micro, small and medium-sized enterprises. For the
total non-financial business economy the profitability measure amounts to
50% on average, while for the SMEs — 43%. Furthermore, typically micro-
scaled sectors of industry have overall profitability measures below the
non-financial business economy average — 15%. In small-sized enterprises
estimated profitability amounts to 54%, while in LSEs it reaches 59%.
In 2009 profitability measure will continue to decline as expectations for
the development of the indicator are related to further decline compared
to the observed trends over 2006-2008 period1. According to System of
National Accounts data in 2009 profitability2 fell to 40% being over 44% a
year earlier reflecting the significant decline in net operating surplus
(8.3%). It is determined by the lower flexibility of labor costs in terms of
changes in economic activity cycle. In 2009 gross value added grew at a
slower pace (2%) compared to compensation of employees (7%).
The latter trends are also confirmed by the development of other related
to profitability Structural Business Statistics indicators — gross value added
and turnover of enterprises. In 2009, th above indicators recorded a
significant decline of 8% and 14% compared to 2008, which is in line with
the dynamics of net operating surplus.
Profitability by size class is expected to follow gross value added and
turnover developments. Typically micro-scaled sector react with a lag time
to the business cycle changes. In small and medium-sized enterprises
estimated profitability will follow a downward trend as well.
¹ it is supported by other related to profitability indicators.
² It is calculated as a ratio between net operating surplus and gross value added.
Figure 8
Profit margin by the enterprise size, 2005-2008
SOURCE: Eurostat
Figure 9
Evolution of gross value added, compenasation of employees and net operating surplus, 2005-2009.
SOURCE: NSI, own calculations.
43,5%45,9%
42,5%39,9%
58,3%61,0%
58,5%56,6%
50,4% 52,8%49,9%
47,6%
35%
40%
45%
50%
55%
60%
65%
2005 2006 2007 2008
SMEs
Large
Total
42,1%43,5% 43,8% 44,3%
40,9%
13,6%
12,8%16,5%
14,2%
1,7%
13,4%
10,9%
17,4% 19,6%
5,8%
12,2%
16,3%17,3%
15,5%
-6,2%
37%
38%
39%
40%
41%
42%
43%
44%
45%
-15%
-10%
-5%
0%
5%
10%
15%
20%
25%
2005 2006 2007 2008 2009
Share of net operating surplus in value added,%, right scaleGross value added, % change
Compensation of employees, % change
Net operating surplus, % change
2 SME Developments
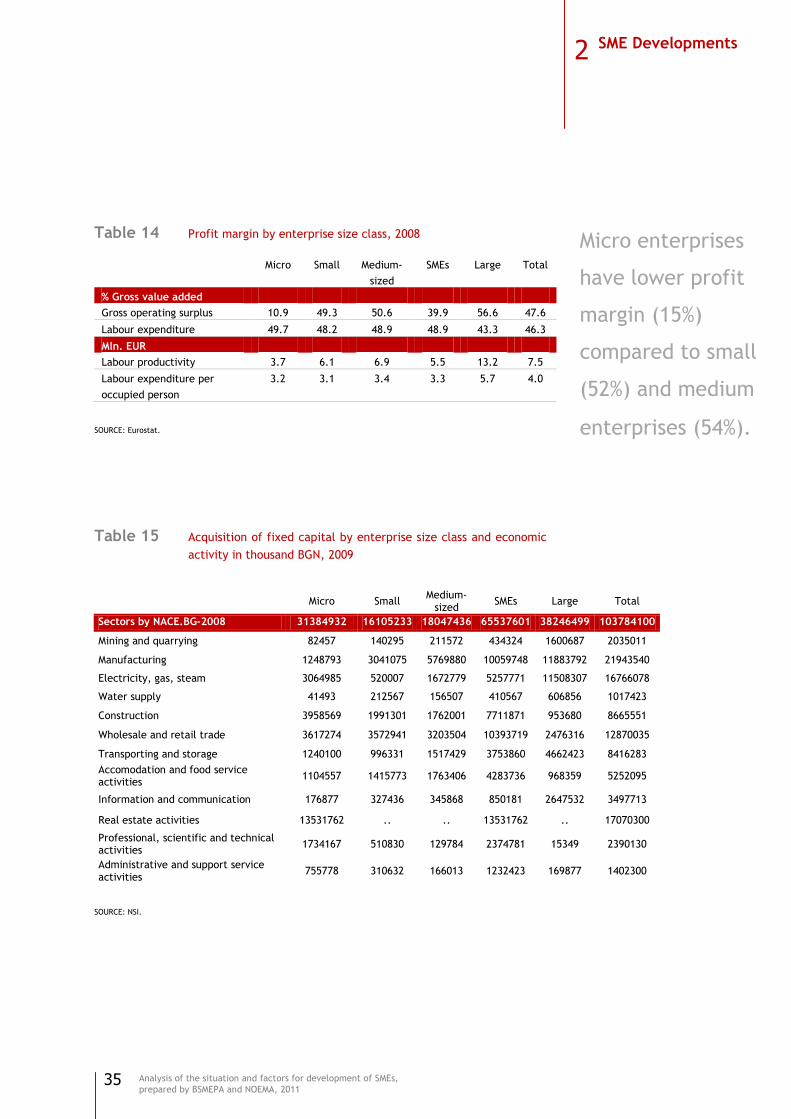
35
Analysis of the situation and factors for development of SMEs,
prepared by BSMEPA and NOEMA, 2011
Table 14 Profit margin by enterprise size class, 2008
Micro Small Medium-
sized
SMEs Large Total
% Gross value added
Gross operating surplus 10.9 49.3 50.6 39.9 56.6 47.6
Labour expenditure 49.7 48.2 48.9 48.9 43.3 46.3
Mln. EUR
Labour productivity 3.7 6.1 6.9 5.5 13.2 7.5
Labour expenditure per
occupied person
3.2 3.1 3.4 3.3 5.7 4.0
SOURCE: Eurostat.
Table 15 Acquisition of fixed capital by enterprise size class and economic
activity in thousand BGN, 2009
Micro Small Medium-
sized SMEs Large Total
Sectors by NACE.BG-2008 31384932 16105233 18047436 65537601 38246499 103784100
Mining and quarrying 82457 140295 211572 434324 1600687 2035011
Manufacturing 1248793 3041075 5769880 10059748 11883792 21943540
Electricity, gas, steam 3064985 520007 1672779 5257771 11508307 16766078
Water supply 41493 212567 156507 410567 606856 1017423
Construction 3958569 1991301 1762001 7711871 953680 8665551
Wholesale and retail trade 3617274 3572941 3203504 10393719 2476316 12870035
Transporting and storage 1240100 996331 1517429 3753860 4662423 8416283
Accomodation and food service activities
1104557 1415773 1763406 4283736 968359 5252095
Information and communication 176877 327436 345868 850181 2647532 3497713
Real estate activities 13531762 .. .. 13531762 .. 17070300
Professional, scientific and technical activities
1734167 510830 129784 2374781 15349 2390130
Administrative and support service activities
755778 310632 166013 1232423 169877 1402300
SOURCE: NSI.
Micro enterprises
have lower profit
margin (15%)
compared to small
(52%) and medium
enterprises (54%).
2 SME Developments
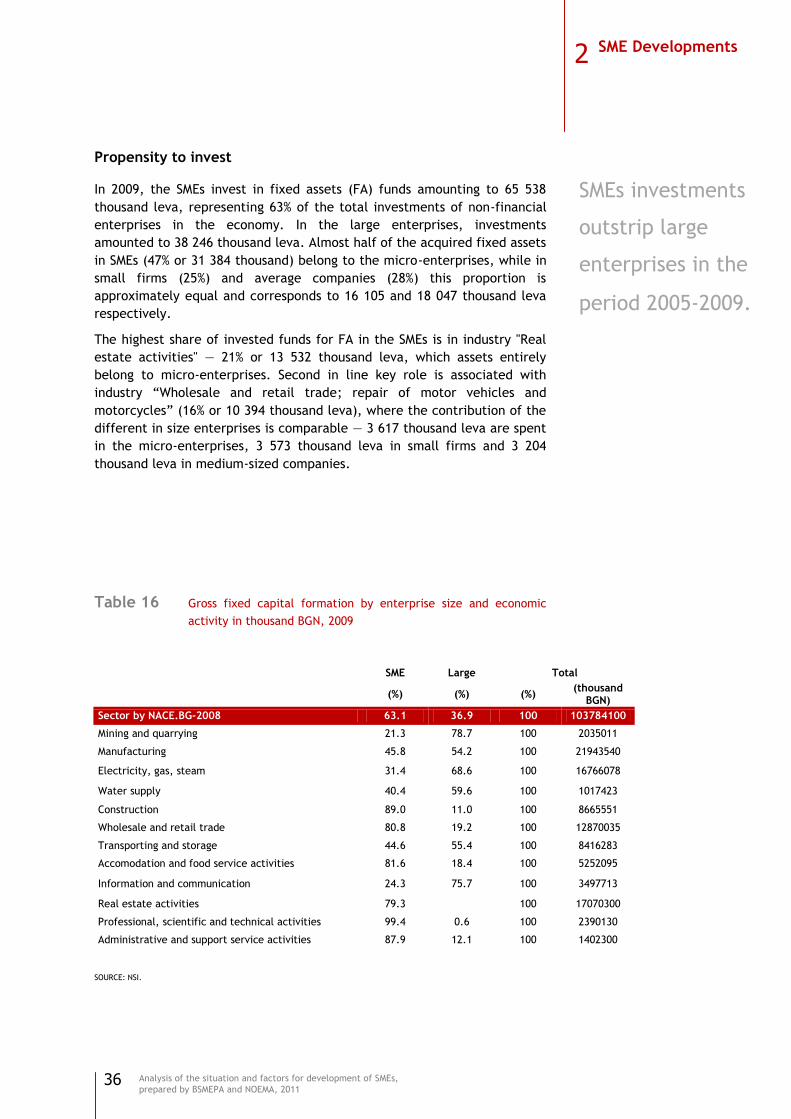
36
Analysis of the situation and factors for development of SMEs,
prepared by BSMEPA and NOEMA, 2011
Propensity to invest
In 2009, the SMEs invest in fixed assets (FA) funds amounting to 65 538
thousand leva, representing 63% of the total investments of non-financial
enterprises in the economy. In the large enterprises, investments
amounted to 38 246 thousand leva. Almost half of the acquired fixed assets
in SMEs (47% or 31 384 thousand) belong to the micro-enterprises, while in
small firms (25%) and average companies (28%) this proportion is
approximately equal and corresponds to 16 105 and 18 047 thousand leva
respectively.
The highest share of invested funds for FA in the SMEs is in industry "Real
estate activities" — 21% or 13 532 thousand leva, which assets entirely
belong to micro-enterprises. Second in line key role is associated with
industry ―Wholesale and retail trade; repair of motor vehicles and
motorcycles‖ (16% or 10 394 thousand leva), where the contribution of the
different in size enterprises is comparable — 3 617 thousand leva are spent
in the micro-enterprises, 3 573 thousand leva in small firms and 3 204
thousand leva in medium-sized companies.
Table 16 Gross fixed capital formation by enterprise size and economic
activity in thousand BGN, 2009
SME Large Total
(%) (%) (%) (thousand
BGN)
Sector by NACE.BG-2008 63.1 36.9 100 103784100
Mining and quarrying 21.3 78.7 100 2035011
Manufacturing 45.8 54.2 100 21943540
Electricity, gas, steam 31.4 68.6 100 16766078
Water supply 40.4 59.6 100 1017423
Construction 89.0 11.0 100 8665551
Wholesale and retail trade 80.8 19.2 100 12870035
Transporting and storage 44.6 55.4 100 8416283
Accomodation and food service activities 81.6 18.4 100 5252095
Information and communication 24.3 75.7 100 3497713
Real estate activities 79.3 100 17070300
Professional, scientific and technical activities 99.4 0.6 100 2390130
Administrative and support service activities 87.9 12.1 100 1402300
SOURCE: NSI.
SMEs investments
outstrip large
enterprises in the
period 2005-2009.
2 SME Developments
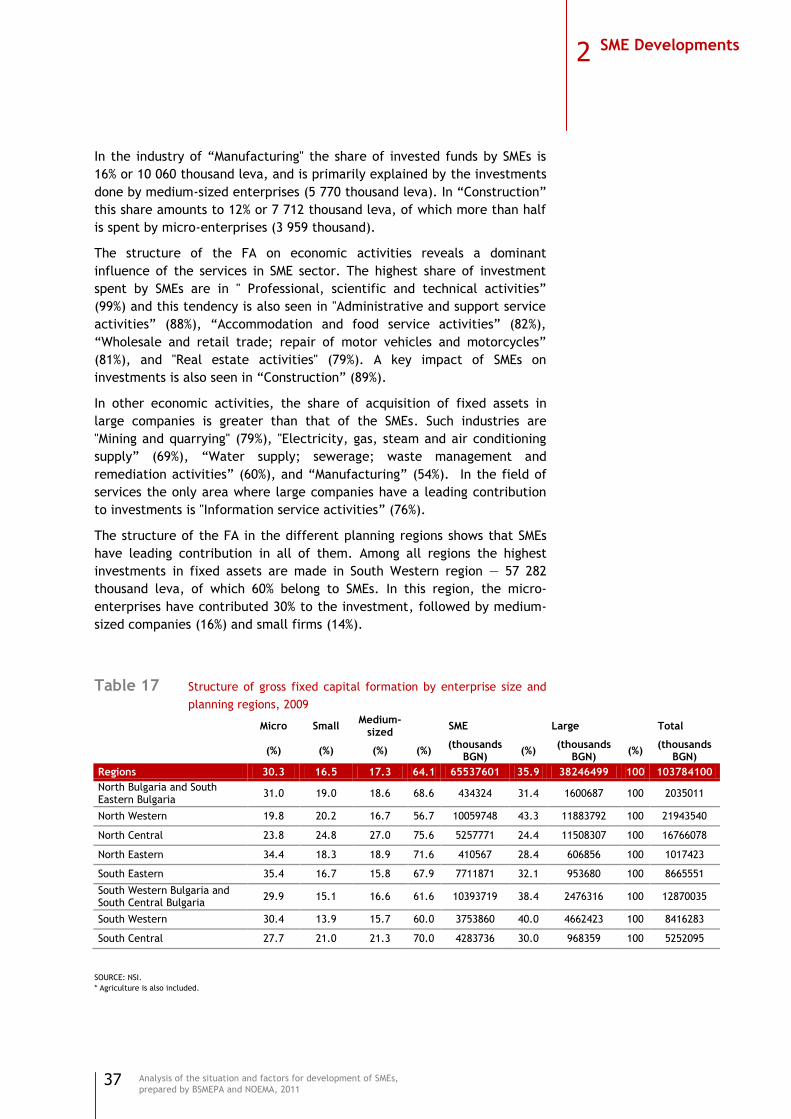
37
Analysis of the situation and factors for development of SMEs,
prepared by BSMEPA and NOEMA, 2011
In the industry of ―Manufacturing" the share of invested funds by SMEs is
16% or 10 060 thousand leva, and is primarily explained by the investments
done by medium-sized enterprises (5 770 thousand leva). In ―Construction‖
this share amounts to 12% or 7 712 thousand leva, of which more than half
is spent by micro-enterprises (3 959 thousand).
The structure of the FA on economic activities reveals a dominant
influence of the services in SME sector. The highest share of investment
spent by SMEs are in " Professional, scientific and technical activities‖
(99%) and this tendency is also seen in "Administrative and support service
activities‖ (88%), ―Accommodation and food service activities‖ (82%),
―Wholesale and retail trade; repair of motor vehicles and motorcycles‖
(81%), and "Real estate activities" (79%). A key impact of SMEs on
investments is also seen in ―Construction‖ (89%).
In other economic activities, the share of acquisition of fixed assets in
large companies is greater than that of the SMEs. Such industries are
"Mining and quarrying" (79%), "Electricity, gas, steam and air conditioning
supply‖ (69%), ―Water supply; sewerage; waste management and
remediation activities‖ (60%), and ―Manufacturing‖ (54%). In the field of
services the only area where large companies have a leading contribution
to investments is "Information service activities‖ (76%).
The structure of the FA in the different planning regions shows that SMEs
have leading contribution in all of them. Among all regions the highest
investments in fixed assets are made in South Western region — 57 282
thousand leva, of which 60% belong to SMEs. In this region, the micro-
enterprises have contributed 30% to the investment, followed by medium-
sized companies (16%) and small firms (14%).
Table 17 Structure of gross fixed capital formation by enterprise size and
planning regions, 2009
Micro Small Medium-
sized SME Large Total
(%) (%) (%) (%) (thousands
BGN) (%)
(thousands BGN)
(%) (thousands
BGN)
Regions 30.3 16.5 17.3 64.1 65537601 35.9 38246499 100 103784100
North Bulgaria and South Eastern Bulgaria
31.0 19.0 18.6 68.6 434324 31.4 1600687 100 2035011
North Western 19.8 20.2 16.7 56.7 10059748 43.3 11883792 100 21943540
North Central 23.8 24.8 27.0 75.6 5257771 24.4 11508307 100 16766078
North Eastern 34.4 18.3 18.9 71.6 410567 28.4 606856 100 1017423
South Eastern 35.4 16.7 15.8 67.9 7711871 32.1 953680 100 8665551
South Western Bulgaria and South Central Bulgaria
29.9 15.1 16.6 61.6 10393719 38.4 2476316 100 12870035
South Western 30.4 13.9 15.7 60.0 3753860 40.0 4662423 100 8416283
South Central 27.7 21.0 21.3 70.0 4283736 30.0 968359 100 5252095
SOURCE: NSI.
* Agriculture is also included.
2 SME Developments
38
Analysis of the situation and factors for development of SMEs,
prepared by BSMEPA and NOEMA, 2011
The value of acquisition of fixed assets in the South Eastern region and the
North Eastern region is significantly lower — 14 714 and 12 481 thousand
leva respectively, where the share of SMEs in investments is 62% and 68%.
In South Central region the investments in FA amounts to 11 053 thousand
leva, of which 70% are spent by SMEs, and the contribution of different-
sized enterprises is comparable — 28% (for micro-enterprises), 21% (small
firms) and 21% (medium-sized companies). In the other two planning
regions — the North Central and North Eastern region invested funds are
very low — approximately 5.4% or 58 154 and 57 606 thousand leva
respectively. In the North Central region SMEs have the highest proportion
(76%) of which 28% belong to micro-enterprises, 21% — to small firms, and
21% — to medium-sized companies. A significant share of investments done
by SMEs is seen in the North East region as well (72%), where micro-
enterprises have a dominant influence (34%).

39
Analysis of the situation and factors for development of SMEs,
prepared by BSMEPA and NOEMA, 2011
External trade
In recent years, external trade data shows that there was growth in the
level of Bulgarian imports and exports of goods and services, particularly
pronounced in the period 2005-2008 (on average 20% and 17% in nominal
terms respectively over the period). The trade balance (the value of
exports minus imports) became a progressively larger deficit through to
2008, reflecting to some degree higher demand and higher international
prices. The weak economic activity in 2009 in our main trading partners
has an adverse impact on the dynamics of imports and exports, which led
to rapid adjustments in the balance of trade. The latter reached its 2005
level. In 2009, both exports and imports decreased by 23% and 33%
respectively in nominal terms compared to 2008.
The most important destination for Bulgarian external trade was the EU
countries, which accounted for 80-85% of the total. The proportion of
exports that were destined for the EU-27 was 65% in 2009. The Balkan
countries are the second largest market (14%), despite their gradually
falling share in total exports in recent years. The declining share of the
latter was offset by the growing importance of trade with the Asian
countries, whose market share rose to 8% by 2009.
The relatively slow change in the structure of exports by groups of
countries was in line with developments as regards the origin of imports.
The EU-27 countries can be defined as major importers, with a share
amounted to about 54% in 2009. There were certain differences,
concerning the higher proportion of imports, destined to other EU
countries¹, followed by Asian and Balkan trading partners.
Figure 10 Dymanics of external trade in mln. BGN, 2005-2010
SOURCE: NSI.
18514.6
23493.226426.9
29736.1
22881.8
30488.128687.6
36142.4
42756.9
49078.7
33006.0
37476.5-10 173.0
-12 649.2
-16 330.0
-19 342.6
-10 124.2
-6 988.4
-25000,0
-20000,0
-15000,0
-10000,0
-5000,0
0,0
0,0
10000,0
20000,0
30000,0
40000,0
50000,0
60000,0
2005 2006 2007 2008 2009 2010
Exports Imports Balance
¹ The following countries are included here: Russia, Ukrain, Switzerland, Giblartar, Molodva, Belarus,
Norway, Lihtenstein, San Marino, Iceland and Monaco.
2 SME Developments
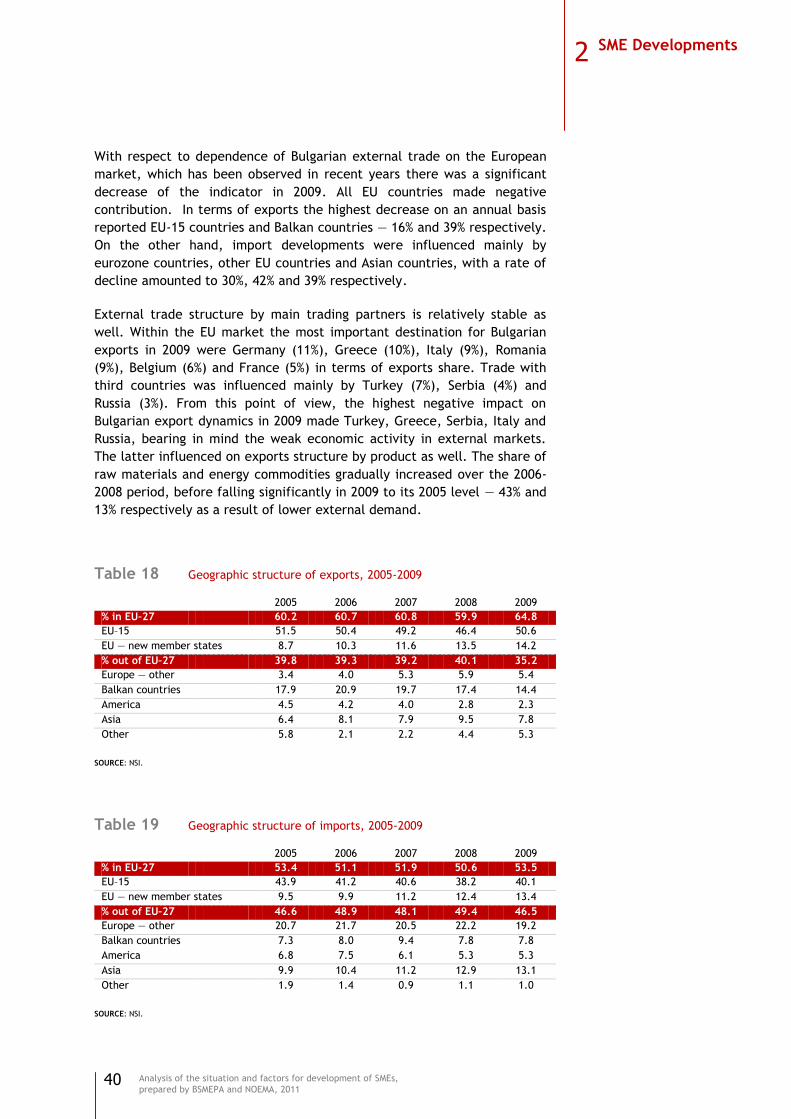
40
Analysis of the situation and factors for development of SMEs,
prepared by BSMEPA and NOEMA, 2011
With respect to dependence of Bulgarian external trade on the European
market, which has been observed in recent years there was a significant
decrease of the indicator in 2009. All EU countries made negative
contribution. In terms of exports the highest decrease on an annual basis
reported EU-15 countries and Balkan countries — 16% and 39% respectively.
On the other hand, import developments were influenced mainly by
eurozone countries, other EU countries and Asian countries, with a rate of
decline amounted to 30%, 42% and 39% respectively.
External trade structure by main trading partners is relatively stable as
well. Within the EU market the most important destination for Bulgarian
exports in 2009 were Germany (11%), Greece (10%), Italy (9%), Romania
(9%), Belgium (6%) and France (5%) in terms of exports share. Trade with
third countries was influenced mainly by Turkey (7%), Serbia (4%) and
Russia (3%). From this point of view, the highest negative impact on
Bulgarian export dynamics in 2009 made Turkey, Greece, Serbia, Italy and
Russia, bearing in mind the weak economic activity in external markets.
The latter influenced on exports structure by product as well. The share of
raw materials and energy commodities gradually increased over the 2006-
2008 period, before falling significantly in 2009 to its 2005 level — 43% and
13% respectively as a result of lower external demand.
Table 18 Geographic structure of exports, 2005-2009
2005 2006 2007 2008 2009
% in EU–27 60.2 60.7 60.8 59.9 64.8
EU–15 51.5 50.4 49.2 46.4 50.6
EU — new member states 8.7 10.3 11.6 13.5 14.2
% out of EU–27 39.8 39.3 39.2 40.1 35.2
Europe — other 3.4 4.0 5.3 5.9 5.4
Balkan countries 17.9 20.9 19.7 17.4 14.4
America 4.5 4.2 4.0 2.8 2.3
Asia 6.4 8.1 7.9 9.5 7.8
Other 5.8 2.1 2.2 4.4 5.3
SOURCE: NSI.
Table 19 Geographic structure of imports, 2005-2009
2005 2006 2007 2008 2009
% in EU-27 53.4 51.1 51.9 50.6 53.5
EU–15 43.9 41.2 40.6 38.2 40.1
EU — new member states 9.5 9.9 11.2 12.4 13.4
% out of EU–27 46.6 48.9 48.1 49.4 46.5
Europe — other 20.7 21.7 20.5 22.2 19.2
Balkan countries 7.3 8.0 9.4 7.8 7.8
America 6.8 7.5 6.1 5.3 5.3
Asia 9.9 10.4 11.2 12.9 13.1
Other 1.9 1.4 0.9 1.1 1.0
SOURCE: NSI.
2 SME Developments

41
Analysis of the situation and factors for development of SMEs,
prepared by BSMEPA and NOEMA, 2011
Raw materials and mineral fuels, oils and electricity made the biggest
contribution to the negative export developments, with a rate of decline
amounted to 26% and 40% in nominal terms as compared to 2008
respectively. Exports volume of investments goods decreased as well (by
25% on an annual basis), however their share in total exports remain close
to 2008 level. Consumer goods accounting for a more than a quarter (28%)
of the total, decreased only by 4% in nominal terms. The latter were at
least affected by the external environment.
Export structure by products and by main trading partners determined the
country‘s export potential. From the point of view of export structure by
SITC lower demand in raw materials accounted for a half of the total
export decline in 2009. Exports volume of raw materials decreased by 26%
in nominal terms, being influenced mainly by the weak activity in
European countries including Greece, Belgium, Italy and Romania. Raw
materials development was also negative affected by the lower exports
volume, destined to the third countries, with the biggest contribution
made by Turkey. EU-27 countries (Italy, France and Greece) made a
significant impact on the decline in exports of chemicals and related
products. In 2009 the latter amounted to 30% on an annual basis and was
also influenced by the lower exports volume to Turkey (from the third
countries). In terms of decreasing exports of mineral fuels, lubricants and
related materials and machinery and transport equipment the highest
contribution reported the third countries. In 2009 the latter groups
decreased by 37% and 15% in nominal terms compared to the previous year
respectively. Considerable reduction in exports volume from Serbia,
Turkey and Greece made the negative impact on the first group export
dynamics, while the second one was influenced primarily by Russia and
France.
Figure 11 Goods structure of exports, 2005-2009
SOURCE: NSI.
29%
25% 24% 22%
28%
43%46% 45% 44%
43%
15% 14% 16% 17% 16%13%
15% 15%16%
13%
2005 2006 2007 2008 2009
Consumer goods Row materials Investment goods Energy sources
2 SME Developments
42
Analysis of the situation and factors for development of SMEs,
prepared by BSMEPA and NOEMA, 2011
In 2009, foods, beverages and tobacco were the only group to report a
positive dynamics, with an export growth rate of 9% in nominal terms
compared to 2008. It was due to increased trade with European countries,
including Belgium, Italy and Greece.
Negative export developments in 2009 were influenced mainly by the
lower export prices, rather than declining real volumes. It is evidenced in
exports of animal and vegetable oils, fats and waxes, which reported 30%
decrease in export prices and 12% in real volumes on an annual basis. A
similar pattern was observed in other manufactured goods, mineral fuels,
lubricants and related products, with a rate of decline amounted to 31%
and 23% respectively. Notably, they were characterized by a real increase
in the exported volumes, but it was not enough to offset the falling prices.
In beverages and tobacco, machinery and equipment, there is price rise
(19% and 4% respectively), coupled with decline in real volumes (5% and
16% respectively).
In export of food and live animals both export prices and real volumes
decreased.
2 SME Developments
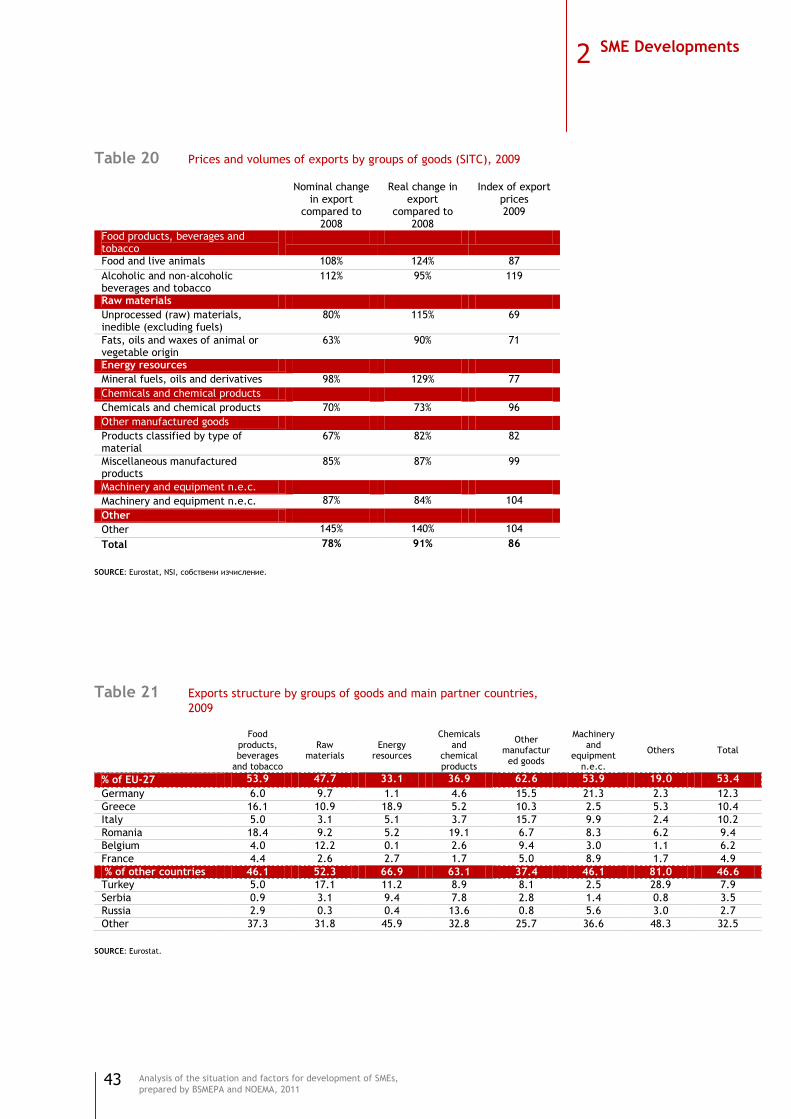
43
Analysis of the situation and factors for development of SMEs,
prepared by BSMEPA and NOEMA, 2011
Table 20 Prices and volumes of exports by groups of goods (SITC), 2009
Nominal change in export
compared to 2008
Real change in export
compared to 2008
Index of export prices 2009
Food products, beverages and tobacco
Food and live animals 108% 124% 87
Alcoholic and non-alcoholic beverages and tobacco
112% 95% 119
Raw materials
Unprocessed (raw) materials, inedible (excluding fuels)
80% 115% 69
Fats, oils and waxes of animal or vegetable origin
63% 90% 71
Energy resources
Mineral fuels, oils and derivatives 98% 129% 77
Chemicals and chemical products
Chemicals and chemical products 70% 73% 96
Other manufactured goods
Products classified by type of material
67% 82% 82
Miscellaneous manufactured products
85% 87% 99
Machinery and equipment n.e.c.
Machinery and equipment n.e.c. 87% 84% 104
Other
Other 145% 140% 104
Total 78% 91% 86
SOURCE: Eurostat, NSI, собствени изчисление.
Table 21 Exports structure by groups of goods and main partner countries,
2009
Food products, beverages
and tobacco
Raw materials
Energy resources
Chemicals and
chemical products
Other manufactur
ed goods
Machinery and
equipment n.e.c.
Others Total
% of EU-27 53.9 47.7 33.1 36.9 62.6 53.9 19.0 53.4
Germany 6.0 9.7 1.1 4.6 15.5 21.3 2.3 12.3
Greece 16.1 10.9 18.9 5.2 10.3 2.5 5.3 10.4
Italy 5.0 3.1 5.1 3.7 15.7 9.9 2.4 10.2
Romania 18.4 9.2 5.2 19.1 6.7 8.3 6.2 9.4
Belgium 4.0 12.2 0.1 2.6 9.4 3.0 1.1 6.2
France 4.4 2.6 2.7 1.7 5.0 8.9 1.7 4.9
% of other countries 46.1 52.3 66.9 63.1 37.4 46.1 81.0 46.6
Turkey 5.0 17.1 11.2 8.9 8.1 2.5 28.9 7.9
Serbia 0.9 3.1 9.4 7.8 2.8 1.4 0.8 3.5
Russia 2.9 0.3 0.4 13.6 0.8 5.6 3.0 2.7
Other 37.3 31.8 45.9 32.8 25.7 36.6 48.3 32.5
SOURCE: Eurostat.
2 SME Developments
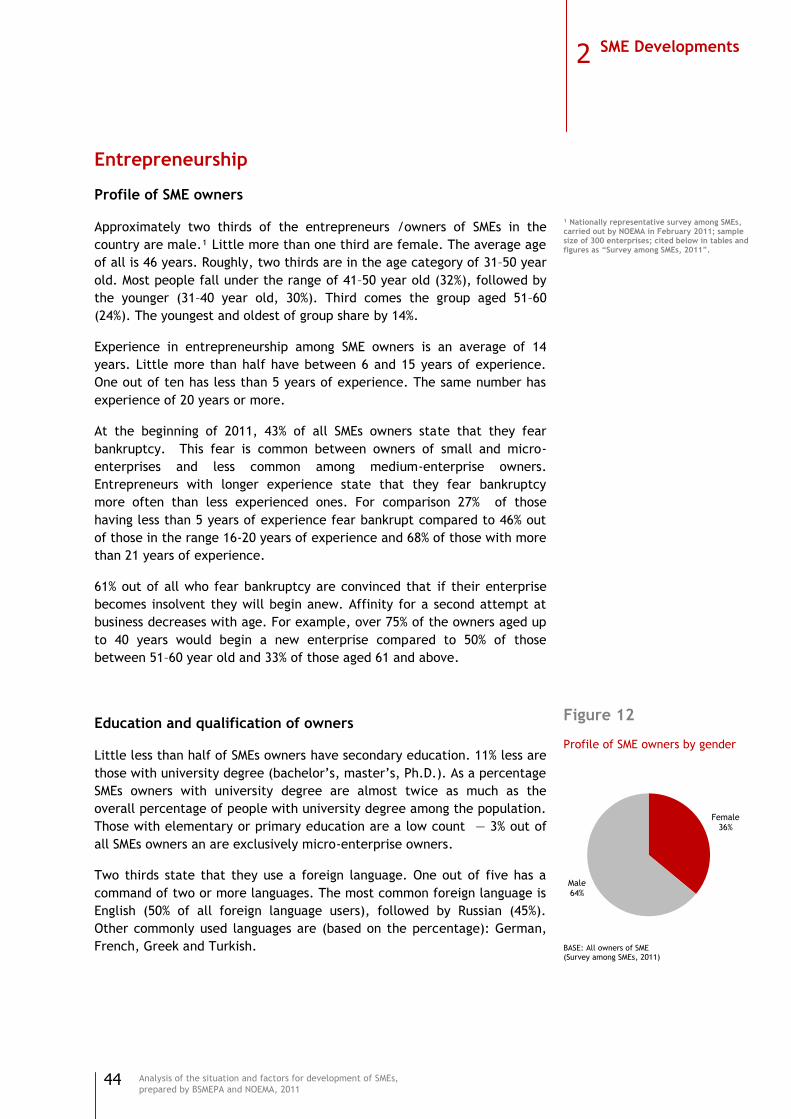
44
Analysis of the situation and factors for development of SMEs,
prepared by BSMEPA and NOEMA, 2011
Entrepreneurship
Profile of SME owners
Approximately two thirds of the entrepreneurs /owners of SMEs in the
country are male.¹ Little more than one third are female. The average age
of all is 46 years. Roughly, two thirds are in the age category of 31–50 year
old. Most people fall under the range of 41–50 year old (32%), followed by
the younger (31–40 year old, 30%). Third comes the group aged 51–60
(24%). The youngest and oldest of group share by 14%.
Experience in entrepreneurship among SME owners is an average of 14
years. Little more than half have between 6 and 15 years of experience.
One out of ten has less than 5 years of experience. The same number has
experience of 20 years or more.
At the beginning of 2011, 43% of all SMEs owners state that they fear
bankruptcy. This fear is common between owners of small and micro-
enterprises and less common among medium-enterprise owners.
Entrepreneurs with longer experience state that they fear bankruptcy
more often than less experienced ones. For comparison 27% of those
having less than 5 years of experience fear bankrupt compared to 46% out
of those in the range 16-20 years of experience and 68% of those with more
than 21 years of experience.
61% out of all who fear bankruptcy are convinced that if their enterprise
becomes insolvent they will begin anew. Affinity for a second attempt at
business decreases with age. For example, over 75% of the owners aged up
to 40 years would begin a new enterprise compared to 50% of those
between 51–60 year old and 33% of those aged 61 and above.
Education and qualification of owners
Little less than half of SMEs owners have secondary education. 11% less are
those with university degree (bachelor‘s, master‘s, Ph.D.). As a percentage
SMEs owners with university degree are almost twice as much as the
overall percentage of people with university degree among the population.
Those with elementary or primary education are a low count — 3% out of
all SMEs owners an are exclusively micro-enterprise owners.
Two thirds state that they use a foreign language. One out of five has a
command of two or more languages. The most common foreign language is
English (50% of all foreign language users), followed by Russian (45%).
Other commonly used languages are (based on the percentage): German,
French, Greek and Turkish.
¹ Nationally representative survey among SMEs, carried out by NOEMA in February 2011; sample size of 300 enterprises; cited below in tables and figures as “Survey among SMEs, 2011”.
Figure 12
Profile of SME owners by gender
BASE: All owners of SME (Survey among SMEs, 2011)
Female36%
Male64%
2 SME Developments
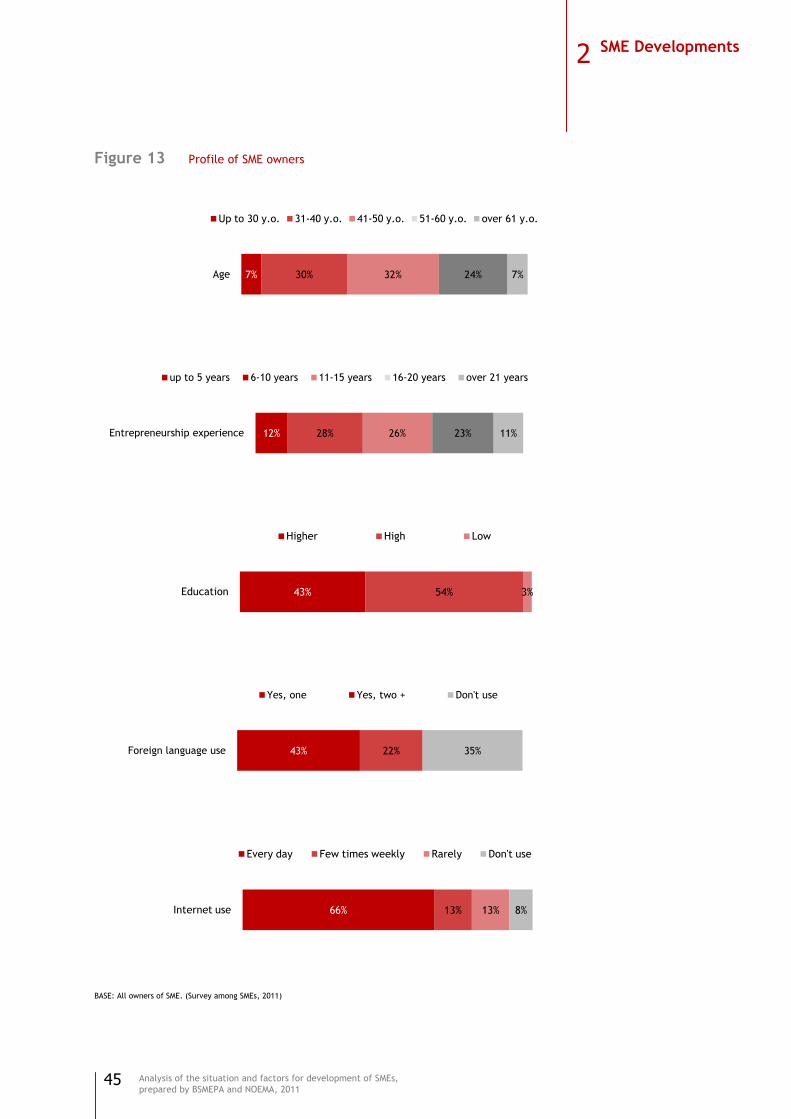
45
Analysis of the situation and factors for development of SMEs,
prepared by BSMEPA and NOEMA, 2011
Figure 13 Profile of SME owners
BASE: All owners of SME. (Survey among SMEs, 2011)
7% 30% 32% 24% 7%Age
Up to 30 y.o. 31-40 y.o. 41-50 y.o. 51-60 y.o. over 61 y.o.
12% 28% 26% 23% 11%Entrepreneurship experience
up to 5 years 6-10 years 11-15 years 16-20 years over 21 years
43% 54% 3%Education
Higher High Low
43% 22% 35%Foreign language use
Yes, one Yes, two + Don't use
66% 13% 13% 8%Internet use
Every day Few times weekly Rarely Don't use
2 SME Developments
46
Analysis of the situation and factors for development of SMEs,
prepared by BSMEPA and NOEMA, 2011
Two thirds of all interviewed entrepreneurs use the Internet on a daily
basis. Half of them state that they are constantly on the web and the other
half — one to several times a day. Younger and more educated SMEs owner
are to surf more often. Women surf more often than men which is due to
their preferred field of business — more often than not are
services/computer based work.
Entrepreneurship among women
The image of female entrepreneurs is definitely different than that of
male ones. Above all more of them are well educated and use foreign
languages than male SMEs owners. For example, 75% of the female SMEs
owners state that they use foreign languages, compared to 61% of the male
SMEs owners.
Women begin business undertakings later than men. This is determined, on
one hand, by the lower average age (44 years for women and 47 years for
men) and, on the other hand by their fewer years of experience in
entrepreneurship (an average of 12 years for women and an average of 15
years for men).
The generations of 51-60 year old and over the age of 61 among the
entrepreneurs are represented exclusively by men — 4 out of 5 owners of
SMEs in these age categories are male. Female SMEs owners are
significantly more often found in the lower age groups.
A half of all female entrepreneurs work in the field of services. That is 12%
more than men in this field. However only 1% of the women own SMEs that
deal with construction work (compared to 9% of men).
Typically companies of female entrepreneurs are micro-enterprises. Small
and medium size enterprises are generally characteristic for male
entrepreneurs.
Female entrepreneurs tend to show a lower degree of fear of bankruptcy
and a higher degree of willingness to start a new enterprise if their
company becomes insolvent. For comparison, 39% fear bankruptcy
compared to 445 of men. Willingness to start anew is present among 65% of
women against 59% of men.
Entrepreneurship among young owners up to 40
Men are predominant among SMEs owners aged up to 40 years, although
women are found slightly more often in this age group compared to the
average allocation for all (for comparison, the ratio is 59% men to 41%
women entrepreneurs, versus 64% to 36% among all). Over 80% of all
owners are aged between 31 and 40 years, 39% among them with 6 to 10
years of experience in entrepreneurship.
2 SME Developments
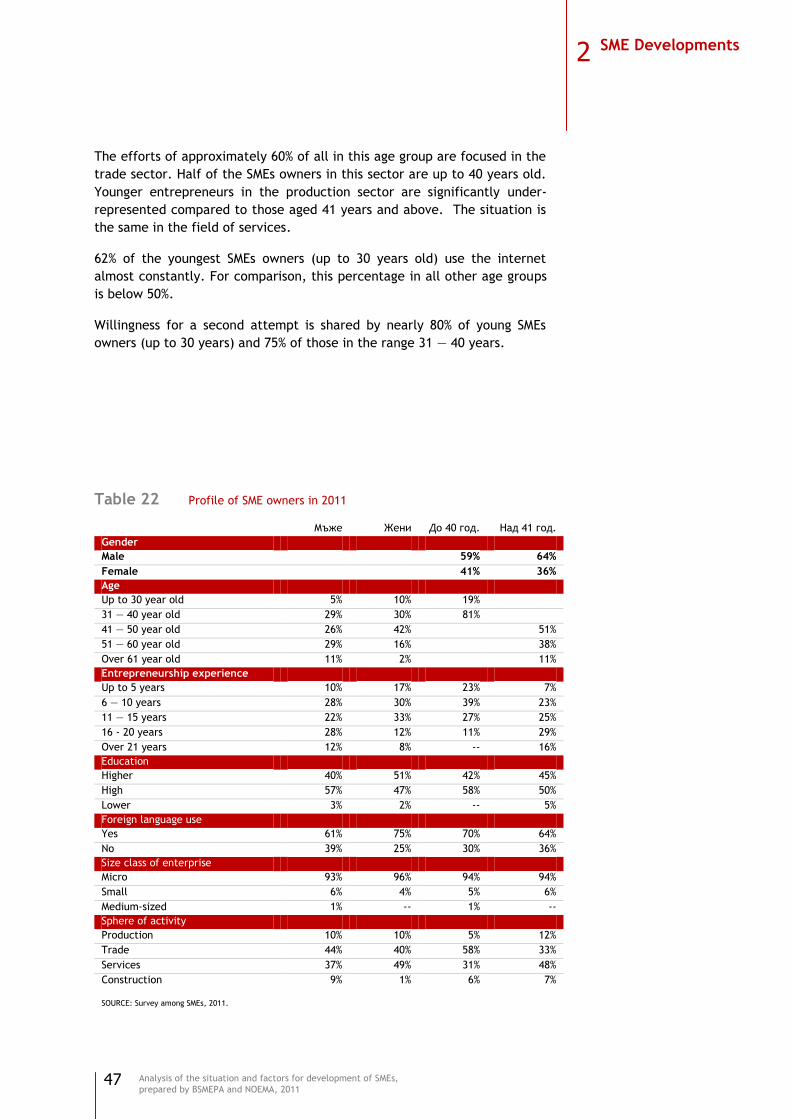
47
Analysis of the situation and factors for development of SMEs,
prepared by BSMEPA and NOEMA, 2011
The efforts of approximately 60% of all in this age group are focused in the
trade sector. Half of the SMEs owners in this sector are up to 40 years old.
Younger entrepreneurs in the production sector are significantly under-
represented compared to those aged 41 years and above. The situation is
the same in the field of services.
62% of the youngest SMEs owners (up to 30 years old) use the internet
almost constantly. For comparison, this percentage in all other age groups
is below 50%.
Willingness for a second attempt is shared by nearly 80% of young SMEs
owners (up to 30 years) and 75% of those in the range 31 — 40 years.
Table 22 Profile of SME owners in 2011
Мъже Жени До 40 год. Над 41 год.
Gender
Male 59% 64%
Female 41% 36%
Age
Up to 30 year old 5% 10% 19%
31 — 40 year old 29% 30% 81%
41 — 50 year old 26% 42% 51%
51 — 60 year old 29% 16% 38%
Over 61 year old 11% 2% 11%
Entrepreneurship experience
Up to 5 years 10% 17% 23% 7%
6 — 10 years 28% 30% 39% 23%
11 — 15 years 22% 33% 27% 25%
16 - 20 years 28% 12% 11% 29%
Over 21 years 12% 8% -- 16%
Education
Higher 40% 51% 42% 45%
High 57% 47% 58% 50%
Lower 3% 2% -- 5%
Foreign language use
Yes 61% 75% 70% 64%
No 39% 25% 30% 36%
Size class of enterprise
Micro 93% 96% 94% 94%
Small 6% 4% 5% 6%
Medium-sized 1% -- 1% --
Sphere of activity
Production 10% 10% 5% 12%
Trade 44% 40% 58% 33%
Services 37% 49% 31% 48%
Construction 9% 1% 6% 7%
SOURCE: Survey among SMEs, 2011.
2 SME Developments
48
Analysis of the situation and factors for development of SMEs,
prepared by BSMEPA and NOEMA, 2011
Key points
In 2009, the number of SMEs amounts at 315 850, which represent
99.8% of the non-financial enterpris population. In 2005-2009, the
number of SMEs has increased with 32%, while of large enterpises —
with 5%. After 2007, the annual growth rate of SMEs has accelerated
to 14.5% in 2009. In 2009, the share of micro firms has increased, at
the expense of small and medium-sized enterprises, and accounts to
90.3% of all SMEs.
In 2009, the number of occupied persons in SMEs amounts at
1 553 164. 76% of all working jobs are in SMEs, and 24% - in large
companies. In 2005-2009, the employment in the SME sector has
increased with 18%, while in the large enterprises has decreased with
2%. In 2009, one SME ensures the average of 5 jobs. In the crisis 2009,
only the micro enterprises show a growth of the employed.
Labour productivity in the SME sector is lower than the average for
the country. In 2006 and 2007, the value added per one occupied
person is typical with a growth rate that goes ahead the one of large
enterprises — 26% and 15% respectively. In 2009, labour productivity
in SMEs fall with 12%, unlike the increase of 4% in large firms.
In 2009, the turnover of SMEs represents 63 437 mln. EUR. Average for
the period of 2005-2008, lowest is the profit margin in micro
companies — 15%. With the increase of enterprise individual size, the
profitability is increasing —52% is the profit margin of small and 54% -
of medium-sized enterprises. In 2009, net operating surplus for the
whole economy has decreased with 8.3% compared to the previous
year, which reflects on the financial indictors of the SME sector.
In the last few years, there has been a tendency of anticipating
contribution of SMEs in investments. In 2009, their investments
amount to 63.1%. Almost the half of acquired fixed assets are owned
by micro enterprises (47.2%). For small and medium-sized enterprises
the indicator is 24.6% and 27.5% respectively.
2 SME Developments
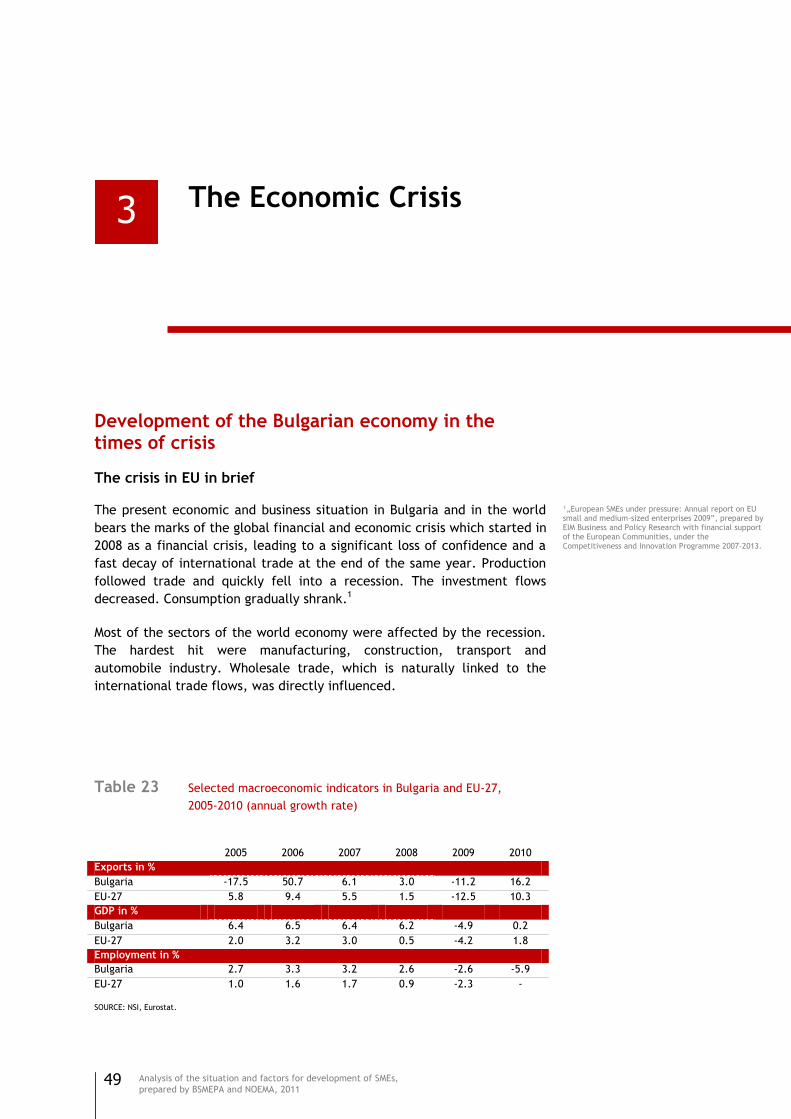
49
Analysis of the situation and factors for development of SMEs,
prepared by BSMEPA and NOEMA, 2011
The Economic Crisis
Development of the Bulgarian economy in the times of crisis
The crisis in EU in brief
The present economic and business situation in Bulgaria and in the world
bears the marks of the global financial and economic crisis which started in
2008 as a financial crisis, leading to a significant loss of confidence and a
fast decay of international trade at the end of the same year. Production
followed trade and quickly fell into a recession. The investment flows
decreased. Consumption gradually shrank.1
Most of the sectors of the world economy were affected by the recession.
The hardest hit were manufacturing, construction, transport and
automobile industry. Wholesale trade, which is naturally linked to the
international trade flows, was directly influenced.
Table 23 Selected macroeconomic indicators in Bulgaria and EU-27,
2005-2010 (annual growth rate)
2005 2006 2007 2008 2009 2010
Exports in %
Bulgaria -17.5 50.7 6.1 3.0 -11.2 16.2
EU-27 5.8 9.4 5.5 1.5 -12.5 10.3
GDP in %
Bulgaria 6.4 6.5 6.4 6.2 -4.9 0.2
EU-27 2.0 3.2 3.0 0.5 -4.2 1.8
Employment in %
Bulgaria 2.7 3.3 3.2 2.6 -2.6 -5.9
EU-27 1.0 1.6 1.7 0.9 -2.3 -
SOURCE: NSI, Eurostat.
3
¹„European SMEs under pressure: Annual report on EU small and medium-sized enterprises 2009‖, prepared by EIM Business and Policy Research with financial support of the European Communities, under the Competitiveness and Innovation Programme 2007-2013.
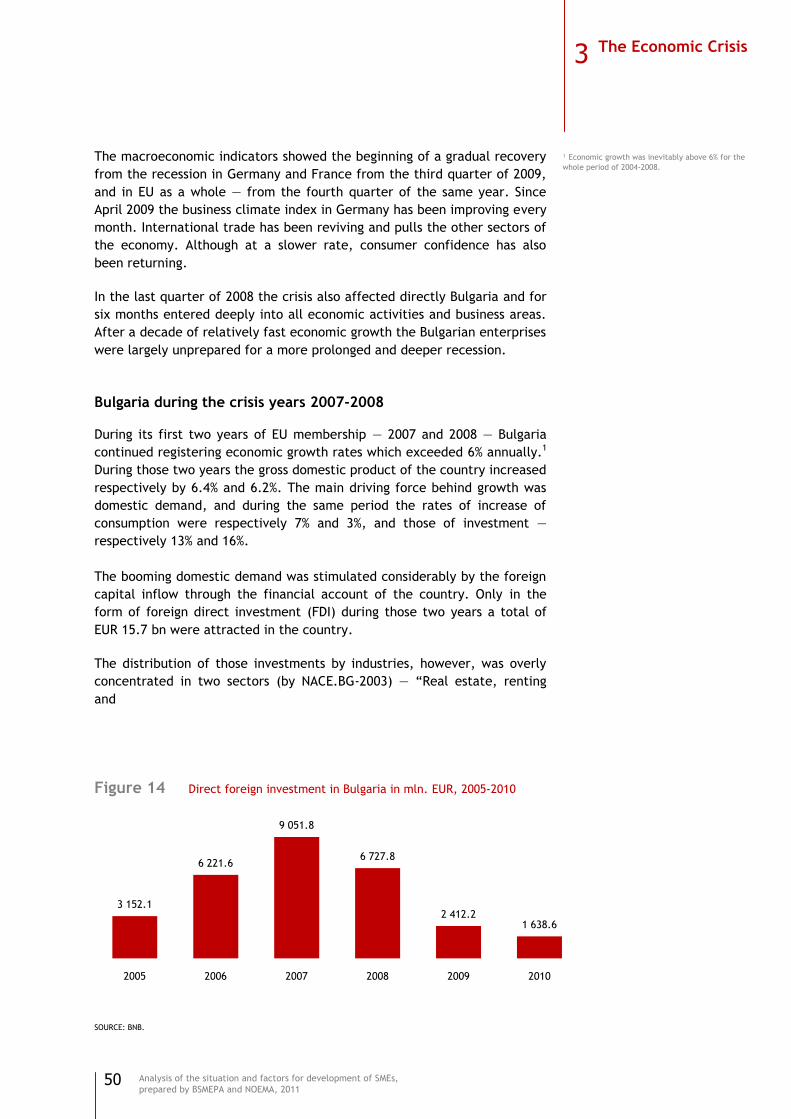
50
Analysis of the situation and factors for development of SMEs,
prepared by BSMEPA and NOEMA, 2011
The macroeconomic indicators showed the beginning of a gradual recovery
from the recession in Germany and France from the third quarter of 2009,
and in EU as a whole — from the fourth quarter of the same year. Since
April 2009 the business climate index in Germany has been improving every
month. International trade has been reviving and pulls the other sectors of
the economy. Although at a slower rate, consumer confidence has also
been returning.
In the last quarter of 2008 the crisis also affected directly Bulgaria and for
six months entered deeply into all economic activities and business areas.
After a decade of relatively fast economic growth the Bulgarian enterprises
were largely unprepared for a more prolonged and deeper recession.
Bulgaria during the crisis years 2007-2008
During its first two years of EU membership — 2007 and 2008 — Bulgaria
continued registering economic growth rates which exceeded 6% annually.1
During those two years the gross domestic product of the country increased
respectively by 6.4% and 6.2%. The main driving force behind growth was
domestic demand, and during the same period the rates of increase of
consumption were respectively 7% and 3%, and those of investment —
respectively 13% and 16%.
The booming domestic demand was stimulated considerably by the foreign
capital inflow through the financial account of the country. Only in the
form of foreign direct investment (FDI) during those two years a total of
EUR 15.7 bn were attracted in the country.
The distribution of those investments by industries, however, was overly
concentrated in two sectors (by NACE.BG-2003) — ―Real estate, renting
and
Figure 14 Direct foreign investment in Bulgaria in mln. EUR, 2005-2010
SOURCE: BNB.
3 152.1
6 221.6
9 051.8
6 727.8
2 412.21 638.6
2005 2006 2007 2008 2009 2010
¹ Economic growth was inevitably above 6% for the
whole period of 2004-2008.
3 The Economic Crisis

51
Analysis of the situation and factors for development of SMEs,
prepared by BSMEPA and NOEMA, 2011
business activities‖ (with a share of about 30% of total FDI) and ―Financial
intermediation‖ (with a share of about 25% of total FDI). As a result of
this, a number of economic activities started developing at unsustainably
high rates. Typical examples of this were construction and bank lending.
The construction production index increased by 17% in 2007, and in 2008 it
increased by 19%. The credit to households and to non-financial enterprises
increased on average by approximately 64% in 2007 and by another 33% in
2008.
The unsustainable development of a part of the industries led to an
unbalanced structure of economic growth, which in its turn caused
negative effects with respect to other key macroeconomic indicators. In
the first place, labor demand increased quickly and substantially which led
to the scarcity of sufficient qualified labor in many sectors. Employment
increased in 2007 and 2008 by a total of 251 thousand persons, and the
unemployment ratio in 2008 reached the record-low value of 5.6%. The
direct effect of this was an excessively high growth of wages. In 2007 the
average wage in the country increased by almost 20%, and in 2008 the
increase continued by another 27%.
The high rates of growth of wages contributed significantly to the
acceleration of the inflation rate. At the end of 2007 the consumer price
index increased yoy by 13%, and the annual average inflation rate for the
same year reached 8%. During the following year, at the end of December
the inflation rate was 8%, and the annual average value peaked to 12%.
The high domestic demand was also paired with a strong increase of
imports which made the trade balance, and therefore the current account
balance, highly negative. In 2007 the current account deficit reached a
record high value of 25% of GDP, and in 2008 the situation was similar — a
deficit of 23%.
Figure 15 Employment and unemployment, 2005-2010
SOURCE: NSI.
2980.0
3110.0
3252.6
3360.7
3253.6
3052.8
10,1%
9,0%
6,9%
5,6%
6,8%
10,2%
0%
2%
4%
6%
8%
10%
12%
2700
2800
2900
3000
3100
3200
3300
3400
2005 2006 2007 2008 2009 2010
Employment (thousand persons) Coeffient of unemployment (%, right scale)
3 The Economic Crisis

52
Analysis of the situation and factors for development of SMEs,
prepared by BSMEPA and NOEMA, 2011
Bulgaria in crisis, 2009-2010
The first signals that the world financial and economic crisis affected the
Bulgarian economy appeared during the last quarter of 2008. The growth
rate of exports of goods fell sharply by more than 10% yoy, while during
the preceding three quarters the rates were positive at respectively about
26%, 22% and 16%. Nevertheless, the rate of GDP growth remained positive
for the same quarter — 3.4% yoy.
The decline of GDP was first seen in the first quarter of 2009 — 4.9% yoy. It
was caused by a sharp downward correction in consumption and
investment in the country. During the following three quarters of the year
the GDP of the country continued recording declines — respectively 4.1%,
5.0% and 7.6%. For the whole year the economy of the country contracted
by 5.5%. The fall of consumption was 7.3% and that of investment— 24.9%.
Figure 16 Inflation rate, 2005-2010
SOURCE: NSI.
Figure 17 Current account balance, 2005-2010
SOURCE: NSI, BNB.
6,5%
6,5%
12,5%
7,8%
0,6%
4,5%
5,0%
7,3%
8,4%
12,3%
2,8%
2,4%0%
2%
4%
6%
8%
10%
12%
14%
2005 2006 2007 2008 2009 2010
Inflation (%, in the end of period) Inflation (%, annual)
-2 705.8
-4 647.6
-7 755.2-8 191.0
-3 477.0
-282.6
-11,6%
-17,6%
-25,2%-23,1%
-9,9%
-0,8%
-30%
-25%
-20%
-15%
-10%
-5%
0%
-9 000
-8 000
-7 000
-6 000
-5 000
-4 000
-3 000
-2 000
-1 000
0
2005 2006 2007 2008 2009 2010
mln.EUR % of GDP (right scale)
3 The Economic Crisis

53
Analysis of the situation and factors for development of SMEs,
prepared by BSMEPA and NOEMA, 2011
The decrease of foreign direct investment in the country was also
indicative of the overall investment dynamics. For the whole 2009 the
investments that were attracted were more than two times less than in
2008 — about EUR bn. The decrease of the FDI in the sector (NACE.BG-
2003) ―Real estate, renting and business activities‖ was approximately
75%, and that in ―Financial intermediation‖ was about 140% (there was an
outflow of capital).
Although the crisis in Bulgaria was already in place in the beginning of
2009, its effects on some indicators were felt with a delay. This was most
clearly displayed with respect to the labor market. The initial expectations
of the entrepreneurs for a shorter duration of the economic crisis did not
bring incentives to optimize the number of employees since the eventual
layoffs of workers and the following hiring of new personnel after a few
months would mean additional expenses in terms of time, resources for
initial training and adaptation, etc.
This is why, despite the decreased economic activity, respectively falling
turnover and profit, during the first two quarters of 2009 no significant
decline of employment was observed, respectively no significant increase
of unemployment. During those two quarters the employment numbers
decreased respectively by only 0.8% and 2.1% yoy, and the unemployment
rate was at the level of 6.3-6.4%. During the second half of the year the
mismatch between expectations and reality reasonably led to a more
substantial number of layoffs. For the last six months of 2009 the number
of employed persons decreased by 120 thousand, and the unemployment
rate reached 7.9%.
The ―cooling-off‖ of the labor market and of economic activity as a whole
contributed for a tangible normalization of the inflation rate in 2009. At
the end of the year its value was only 0.6%, and its annual average level
amounted to 2.8%.
Normalization was also seen in the external sector of the Bulgarian
economy. The decline of domestic demand automatically led to a decline
in imports which even exceeded that of exports. As a result of this, at the
end of 2009 the trade deficit of the country shrank almost two times and
reached EUR 4.2 bn, with EUR 8.6 bn a year earlier. The current account of
the balance of payments also registered a considerably improved deficit —
10% of GDP.
During the past 2010 the manifestation of the crisis effects on the
Bulgarian economy continued despite the signals for recovery and the
following minor growth of GDP of 0.2%. Consumption and investment
continued declining in real terms, although the rates of decrease slowed
down. As a whole domestic demand remained depressed as a result of the
labor market condition, the level of incomes, and the opportunities for
credit financing.
3 The Economic Crisis

54
Analysis of the situation and factors for development of SMEs,
prepared by BSMEPA and NOEMA, 2011
During the first quarter of 2010 unemployment increased additionally
reaching about 10%, and this level remained unchanged for the next two
quarters. In the fourth quarter the unemployment rate increased again to
11.2% — to confirm the above-mentioned fact that the issues related to
domestic demand continue being the main risk before the sustainable
recovery of the Bulgarian economy.
Following the high prices of foods and energy (mainly oil) at the
international markets, in the second half of 2010 the inflation rate
accelerated considerably, and at the end of the year it reached 4.5%,
while the annual average inflation rate amounted to 2.4%. The higher
inflation rate caused additional negative effects related to the decrease of
real incomes, and therefore of the purchasing power of the population.
The minor economic growth observed in 2010 was mainly the result of the
external sector developments. The exports of goods and services increased
during the whole year, and in the third quarter its rate of nominal growth
even exceeded 40%. The recovery of exports was full, and even the pre-
crisis levels were outperformed. At the same time imports continued being
weak which led to an improvement of the current account balance, and at
the end of the year the deficit was only 1% of GDP.
Foreign direct investment in Bulgaria continued falling and their amount in
2010 was at the modest EUR 1.6 bn. Generally speaking, the foreign
financing inflow was weak, and for the whole year the financial account
balance remained negative, which is the reason behind the stagnation of
credit activity. The loans to non-financial enterprises and households
increased nominally by 1.2% but even this growth is not genuine since it
was due to the repurchase of loan portfolios by the banks during the
second half of the year.
Figure 18 GDP growth rate, 2002-2010
SOURCE: NSI.
4,5%5,0%
6,6% 6,2% 6,3% 6,4% 6,2%
-5,5%
0,2%
2002 2003 2004 2005 2006 2007 2008 2009 2010
3 The Economic Crisis
55
Analysis of the situation and factors for development of SMEs,
prepared by BSMEPA and NOEMA, 2011
Banking system
The banking system faced the beginning of the economic crisis in a very
solid condition. Its total assets at the end of 2008 amounted to about BGN
69,6 bn (an increase of about 18% compared to the end of 2007). In spite
of the deceleration of credit growth due to the first manifestations of the
crisis in the fourth quarter of 2008, it remained high (slightly above 30%
yoy). The level of provisioning of problematic loans amounted to 115%, the
liquid assets ratio amounted to almost 22%, and the overall capital
adequacy of the system was 15%. For the same year the profit of the banks
increased by BGN 243 mn and reached the record-high BGN 1,4 bn.
The decline of GDP realized in the beginning of 2009, respectively the
deterioration of the overall economic situation, was almost not reflected
on the condition of the banking system. During the first half of 2009 the
assets of the system decreased by only about BGN 90 mn. At the same
time, however, the level perceived risks in the economy increased which
led to reconsidering bank policies, respectively to substantial tightening of
lending conditions. The deterioration of borrowers‘ expectations also
affected the propensity of businesses and households to assume new
liabilities. As a result of those effects the credit growth decelerated
considerably, and on a yearly basis the rate of growth of loans to corporate
and individual clients fell below 2%. Due to the fact that the labor market
reacted with some delay to the deterioration of the economic
environment, and also due to the relatively slower manifestation of the
effect of decline in sales on the ability of the businesses to service their
liabilities, the bad and restructured loans did not increase significantly,
and as of the end of June 2009 their share in total assets was only 6.6%.
At the end of 2009, the assets of the banking system amounted to almost
BGN 71 bn. The increase compared to the end of 2008 was about BGN 1.3
bn. The capital adequacy of the system reached 17%, but at the same
time, due to the abrupt increase of unemployment and the decline of sales
both for exports and for the domestic market, the share of bad and
restructured loans increased considerably to 13.6% of total assets.
However, the system had accumulated a buffer of BGN 2,8 bn which it
could use to cover the writing off of assets if necessary.
In 2010 the weak signs of economic recovery were reflected in the
dynamics of the banking sector. The growth of credit remained feeble but
positive (0.7%).1 The share of bad loans reached almost 12%, and the cost
of asset devaluation increased compared to the end of 2009 by 27%.
Nevertheless, the banks managed to maintain the stability of their
indicators, and their capital adequacy ratio amounted to 17.5% as of the
end of 2010. The profit of the system amounted to BGN 617 mn — by about
BGN 160 mn less compared to a year earlier — but despite all remained a
good testimonial for the condition of the financial sector in the country.
¹ However, it should be born in mind that in the second half of the year a number of banks repurchased credit portfolios from abroad, which artificially increased the amount of loans.
3 The Economic Crisis

56
Analysis of the situation and factors for development of SMEs,
prepared by BSMEPA and NOEMA, 2011
Trends in the development of SMEs in EU The European Commission‘s (EC) report on SMEs in the EU for 2009¹
recognizes that in recent years, these companies recorded significant
growth. But the trend seems interrupted by the economic crisis, although
in the first stages of the crisis SMEs show a good stability. Below are
summarized some of the basic observations of the report.
The number of SMEs increases with 13% (2,4 million) for the period
2002-2008, as they are among the main drivers of employment growth
in many EU countries. For the period their number increases with 13%
(2,4 million), while the number of large companies increases with only
5% (2 thousand). This leads to an increase in employment in SMEs per
year with a rate that is twice as high as the growth rate of
employment in large enterprises.
The dynamic development of the SME sector in 2002-2008 was a
widespread phenome non across the EU, including old and new Member
States. In fact, during that period there was a convergence process
between both groups of countries as regards the structure of their SME
sectors. The remaining differences between old and new Member
States appear to be increasingly less significant than those between
individual countries of the EU-15 and EU-12 grouping. In 2008, average
enterprise size was 6.5 in the former and 6.0 in the latter region.
However, the discrepancy in average enterprise size across countries
within both groups is large (varying between 3 and 12 occupied persons
per enterprise in EU-15, and between 3 and 18 in EU-12).
With the onset of the financial and economic crisis in 2008, there is
evidence that the above cited positive developments have — at least —
temporarily come to a halt. While 2008 already showed a deceleration,
preliminary estimations point at a stagnating development as regards,
e.g. the number of SMEs in 2009. Also, the estimates for EU-27 SMEs‘
production in 2009 hint at a decline by 5.5 % as compared to 2008. In
2009, this happened mostly in large and medium-sized enterprises,
while for micro and small enterprises this decline is estimated to be
less pronounced and, hence, presumed to be associated with relatively
fewer jobs. In 2010, even though production growth is expected to
gradually pick up again, lagged adjustment of the workforce to the
reduced level of actual production is predicted to cause a relatively
large decline of employment in micro and small enterprises. Over 2009
and 2010, the EU-27 SMEs are estimated to shed a total of 3,25 million
jobs.
Partner countries, however, are hit hard and fast by the crisis, too. In
the United States, for instance, the number of businesses is estimated
to have declined by 0.6 % in 2008 and by 2.2 % in 2009. While for
Japan, no comparable data more recent than 2006 exists, the number
¹„European SMEs under pressure: Annual report on EU small and medium-sized enterprises 2009‖, prepared by EIM Business and Policy Research with financial support of the European Communities, under the Competitiveness and Innovation Programme 2007-2013.
3 The Economic Crisis
57
Analysis of the situation and factors for development of SMEs,
prepared by BSMEPA and NOEMA, 2011
of businesses dropped already then by 1.8 % and is unlikely to have
recovered during the current crisis. On the back of this evidence the
EU´s SME sector looked comparatively resilient — at least in the initial
phase of the crisis. However, it remains to be seen whether it will be
able to match the rebound pace of the partner countries´ SMEs once
the crisis gives way to a recovery. This, in turn, will very much depend
on how efficiently the specific challenges SMEs are facing are dealt
with. European Central Bank (ECB)-survey data showed the former
being cited by 28 % of the responding SMEs, while the latter only by
19%. The seriousness of the second challenge does not seem to be an
equally pressing issue in all countries, sectors or size-classes. Either
way, now is a period when well-timed and calibrated policy
interventions matter more than ever. This refers not just to the two
areas mentioned, but to the whole gamut of measures that SME
policies typically comprise of. In this respect, the Small Business Act
(SBA) is intended to become an important tool for supporting SMEs
businesses in preserving or regaining their competitiveness. It consists
of comprehensive list of concrete measures in some 10 principle areas
to be implemented by the Commission and Member States
SMEs continue to battle with some intrinsic challenges: For instance,
on average SMEs have a lower labour productivity than large
enterprises. In 2008, gross value added at factor cost per occupied
person was EUR 39 000 for SMEs and EUR 59 000 for large enterprises.
Within the SME sector the corresponding figures are EUR 32 000 for
micro enterprises, EUR 42 000 for small enterprises and EUR 49 000 for
medium-sized enterprises. Similar differentials can be found in all
other years for which data are available (2002-2007), and for almost
every individual country in the EU. These differences in labour
productivity are explained by differences in sectoral orientation
between micro, small, medium-sized and large enterprises, in capital
intensity, the degree to which firms can reap scale economies as well
as difference in the qualification and skill levels of the personnel of
smaller and larger enterprises.
SMEs‘ on average lower average labour productivity also explains their
— on average — lower profitability as compared to large enterprises
(especially as regards micro enterprises). The fact that on average
SMEs pay lower wages (average labour costs per employee are EUR 29
000 for SMEs and EUR 38 000 for LSEs) does apparently not suffice to
compensate for this productivity differential. However, there are also
areas where SMEs do, even though surprisingly so, outperform LSEs:
this is the case as regards the propensity to invest which is — for the
EU non-financial business economy as a whole — highest for micro
firms. For micro enterprises, gross investment in tangible goods
amounts to 24 % of value added, compared to 19 % for all firms.
The last available projections by the OECD predict a somewhat
stronger recovery in 2010 and 2011 compared with earlier forecasts,
but also pay attention to downward risks. Generally speaking, and
3 The Economic Crisis
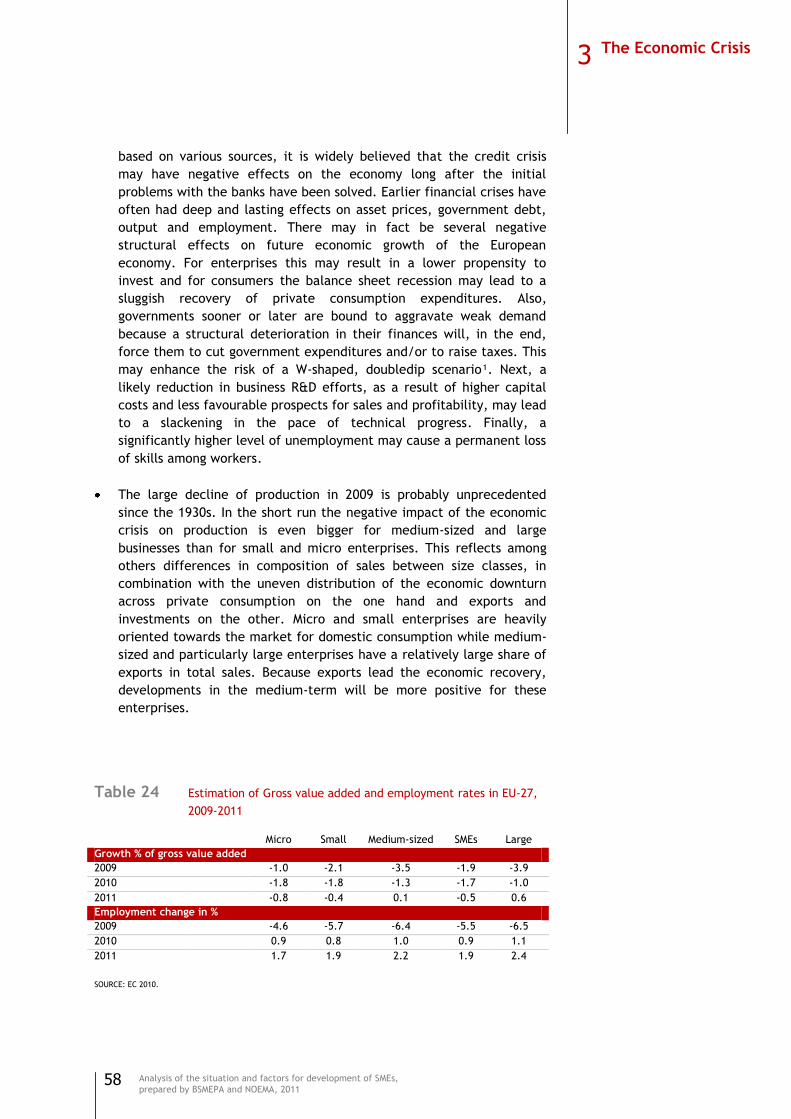
58
Analysis of the situation and factors for development of SMEs,
prepared by BSMEPA and NOEMA, 2011
based on various sources, it is widely believed that the credit crisis
may have negative effects on the economy long after the initial
problems with the banks have been solved. Earlier financial crises have
often had deep and lasting effects on asset prices, government debt,
output and employment. There may in fact be several negative
structural effects on future economic growth of the European
economy. For enterprises this may result in a lower propensity to
invest and for consumers the balance sheet recession may lead to a
sluggish recovery of private consumption expenditures. Also,
governments sooner or later are bound to aggravate weak demand
because a structural deterioration in their finances will, in the end,
force them to cut government expenditures and/or to raise taxes. This
may enhance the risk of a W-shaped, doubledip scenario¹. Next, a
likely reduction in business R&D efforts, as a result of higher capital
costs and less favourable prospects for sales and profitability, may lead
to a slackening in the pace of technical progress. Finally, a
significantly higher level of unemployment may cause a permanent loss
of skills among workers.
The large decline of production in 2009 is probably unprecedented
since the 1930s. In the short run the negative impact of the economic
crisis on production is even bigger for medium-sized and large
businesses than for small and micro enterprises. This reflects among
others differences in composition of sales between size classes, in
combination with the uneven distribution of the economic downturn
across private consumption on the one hand and exports and
investments on the other. Micro and small enterprises are heavily
oriented towards the market for domestic consumption while medium-
sized and particularly large enterprises have a relatively large share of
exports in total sales. Because exports lead the economic recovery,
developments in the medium-term will be more positive for these
enterprises.
Table 24 Estimation of Gross value added and employment rates in EU-27,
2009-2011
Micro Small Medium-sized SMEs Large
Growth % of gross value added
2009 -1.0 -2.1 -3.5 -1.9 -3.9
2010 -1.8 -1.8 -1.3 -1.7 -1.0
2011 -0.8 -0.4 0.1 -0.5 0.6
Employment change in %
2009 -4.6 -5.7 -6.4 -5.5 -6.5
2010 0.9 0.8 1.0 0.9 1.1
2011 1.7 1.9 2.2 1.9 2.4
SOURCE: EC 2010.
3 Economic crisis
3 The Economic Crisis
59
Analysis of the situation and factors for development of SMEs,
prepared by BSMEPA and NOEMA, 2011
Some businesses consider a recession as an outright opportunity to
establish an advantage over weaker competitors or embark on new
entrepreneurial ventures. More generally, the economic crisis may
cause a trend break in the minds of people, rendering society more
open to change. This mental shift will stimulate the development of
ideas for new products and production methods.¹ 18 of the 30
companies that presently make up the Dow Jones Industrial Average
were launched in recessions or in bear stock markets. While business
closures create societal costs, particularly in the case of bankruptcies,
the opposite side of the coin may be quite positive as exits will
concentrate on the least efficient enterprises. This creates more room
in the market for new business start-ups as well as for new business
development by incumbent firms.¹
¹ Shane, 2003; De Jong and Marsili, 2010.
3 The Economic Crisis

60
Analysis of the situation and factors for development of SMEs,
prepared by BSMEPA and NOEMA, 2011
Impact of the crisis upon SMEs in Bulgaria
Initial reaction to the crisis
The assumption that the crisis will pass quickly and ‗things will again be as
they were before’, is a common view among entrepreneurs in Bulgaria
during the first few months of the crisis in the Bulgarian economy. A
significant number of companies choose the passive strategy of waiting. A
study among 1000 companies, that took place in the mid 2009, showed
that 44% of all interviewed do not intend to take serious actions towards a
change although they stated to feel affected by the crisis.¹ One year later,
in 2010, this share is only 4% lower (40%).²
Other companies take a more active position by focusing on ‗cutting costs‘.
A common case of the implementation of this strategy is the reduction of
the compensation of employees. This was achieved by exemption of
employees and /or reduction the amount of remunerations. A survey
among companies in the sector ―Manufacturing of food products‖ (Jan,
2010)³ indicates that during 2009 33% of enterprises have reduced their
personnel, while 15% did a reduction of their employees‘ salaries. Loss of
markets forced 18% to reduce the working hours, which indirectly implies
lower wage costs.
A third strategy is entrepreneurship, aimed at increasing market share
through active behavior of perceiving the crisis as ‗an opportunity‘ —
launching of new combinations of products and services, lowering prices,
increasing staff etc. Between 15% and 20 % (by various indicators) of the
Figure 19 Policies related to enterprise personnel in 2009
BASE: All respondents. „Yes‖ answers.(Survey among the sector of „Manufacturing of food products‖, 2010)
56%
33%
29%
29%
29%
28%
24%
18%
15%
Company introduced higher control over personnel performance
Company was forced to reduce employees
Company has restructured the human resources
Motivation of employees has decreased
Company has stopped recruiting new employees
Company cannot pay salaries regularly
Motivation of employees has increased
Working hours have been reduced
Company has decreased salary levels
¹ National representative survey among non-financial enterprises in Bulgaria, carried out by NOEMA in June 2009; sample size of 1000.
² National representative survey among non-financial enterprises in Bulgaria, carried out by NOEMA in May 2010; sample size of 1000.
³ National representative survey among enterprises in the sector ―Manufacturing of food products‖, carried out by NOEMA and Job Tiger in January 2010; sample
size of 300.
3 The Economic Crisis
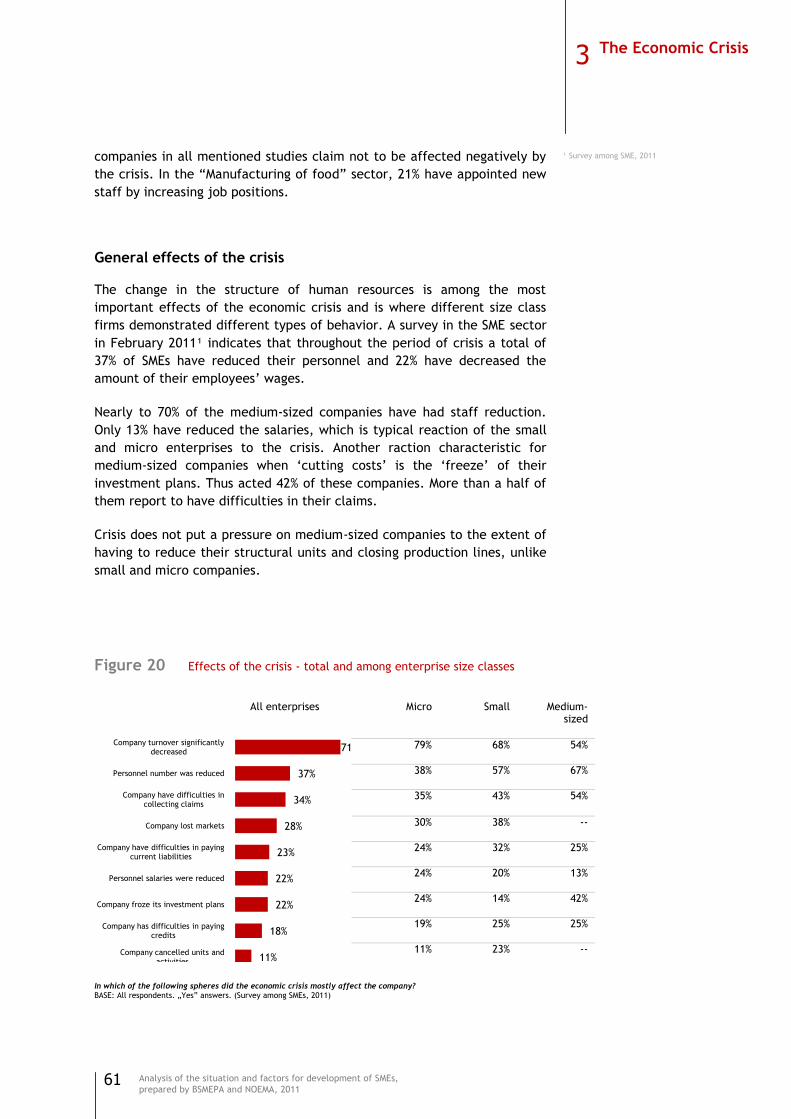
61
Analysis of the situation and factors for development of SMEs,
prepared by BSMEPA and NOEMA, 2011
companies in all mentioned studies claim not to be affected negatively by
the crisis. In the ―Manufacturing of food‖ sector, 21% have appointed new
staff by increasing job positions.
General effects of the crisis
The change in the structure of human resources is among the most
important effects of the economic crisis and is where different size class
firms demonstrated different types of behavior. A survey in the SME sector
in February 2011¹ indicates that throughout the period of crisis a total of
37% of SMEs have reduced their personnel and 22% have decreased the
amount of their employees‘ wages.
Nearly to 70% of the medium-sized companies have had staff reduction.
Only 13% have reduced the salaries, which is typical reaction of the small
and micro enterprises to the crisis. Another raction characteristic for
medium-sized companies when ‗cutting costs‘ is the ‗freeze‘ of their
investment plans. Thus acted 42% of these companies. More than a half of
them report to have difficulties in their claims.
Crisis does not put a pressure on medium-sized companies to the extent of
having to reduce their structural units and closing production lines, unlike
small and micro companies.
Figure 20 Effects of the crisis - total and among enterprise size classes
In which of the following spheres did the economic crisis mostly affect the company?
BASE: All respondents. „Yes‖ answers. (Survey among SMEs, 2011)
¹ Survey among SME, 2011
All enterprises
71%
37%
34%
28%
23%
22%
22%
18%
11%
Company turnover significantly decreased
Personnel number was reduced
Company have difficulties in collecting claims
Company lost markets
Company have difficulties in paying current liabilities
Personnel salaries were reduced
Company froze its investment plans
Company has difficulties in paying credits
Company cancelled units and activities
Micro Small Medium- sized
79% 68%
54%
38% 57%
67%
35% 43% 54%
30% 38%
--
24% 32%
25%
24% 20%
13%
24% 14%
42%
19% 25%
25%
11% 23%
--
3 The Economic Crisis
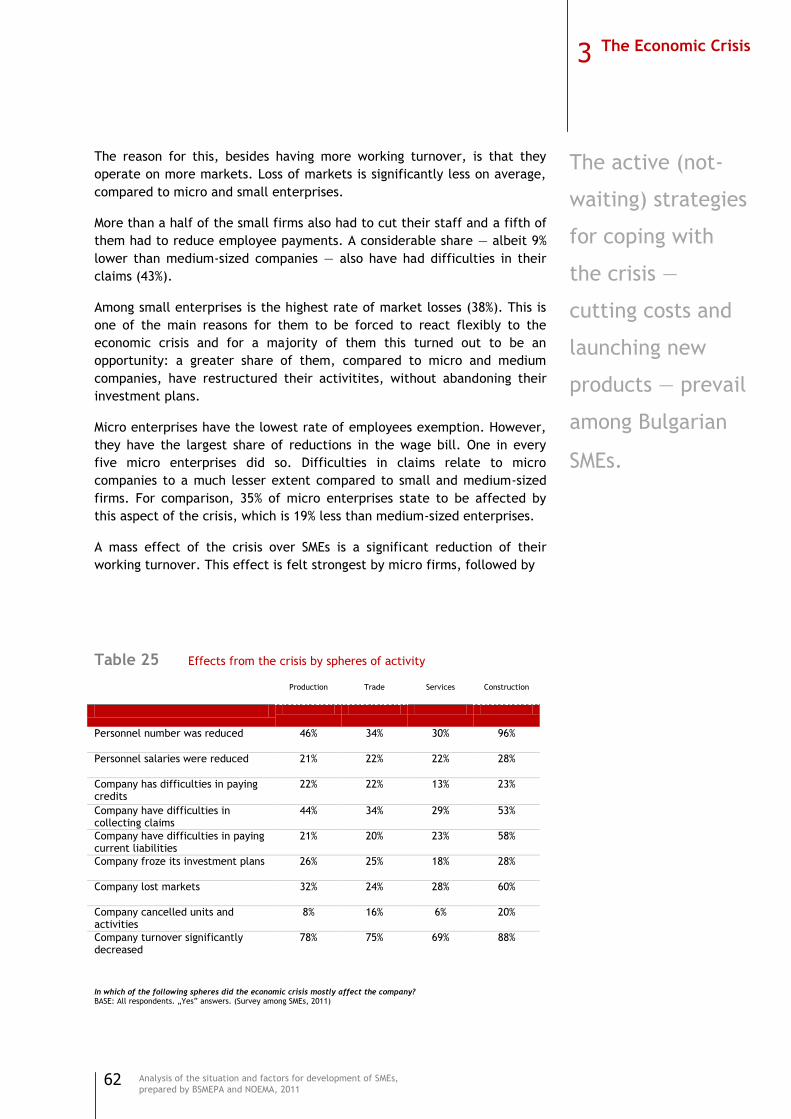
62
Analysis of the situation and factors for development of SMEs,
prepared by BSMEPA and NOEMA, 2011
The reason for this, besides having more working turnover, is that they
operate on more markets. Loss of markets is significantly less on average,
compared to micro and small enterprises.
More than a half of the small firms also had to cut their staff and a fifth of
them had to reduce employee payments. A considerable share — albeit 9%
lower than medium-sized companies — also have had difficulties in their
claims (43%).
Among small enterprises is the highest rate of market losses (38%). This is
one of the main reasons for them to be forced to react flexibly to the
economic crisis and for a majority of them this turned out to be an
opportunity: a greater share of them, compared to micro and medium
companies, have restructured their activitites, without abandoning their
investment plans.
Micro enterprises have the lowest rate of employees exemption. However,
they have the largest share of reductions in the wage bill. One in every
five micro enterprises did so. Difficulties in claims relate to micro
companies to a much lesser extent compared to small and medium-sized
firms. For comparison, 35% of micro enterprises state to be affected by
this aspect of the crisis, which is 19% less than medium-sized enterprises.
A mass effect of the crisis over SMEs is a significant reduction of their
working turnover. This effect is felt strongest by micro firms, followed by
Table 25 Effects from the crisis by spheres of activity
Production Trade Services Construction
Personnel number was reduced
46% 34% 30% 96%
Personnel salaries were reduced
21% 22% 22% 28%
Company has difficulties in paying credits
22% 22% 13% 23%
Company have difficulties in collecting claims
44% 34% 29% 53%
Company have difficulties in paying current liabilities
21% 20% 23% 58%
Company froze its investment plans
26% 25% 18% 28%
Company lost markets
32% 24% 28% 60%
Company cancelled units and activities
8% 16% 6% 20%
Company turnover significantly decreased
78% 75% 69% 88%
In which of the following spheres did the economic crisis mostly affect the company? BASE: All respondents. „Yes‖ answers. (Survey among SMEs, 2011)
The active (not-
waiting) strategies
for coping with
the crisis —
cutting costs and
launching new
products — prevail
among Bulgarian
SMEs.
3 The Economic Crisis
63
Analysis of the situation and factors for development of SMEs,
prepared by BSMEPA and NOEMA, 2011
the small firms. It is weakest in medium companies, strong enough,
however, to affect more than half of them.
Construction is undoubtedly the most affected, compared to production,
trade and services. Staff exemptions have been made by 96% of all
companies and approximately 60% of them report to have difficulties
paying their current obligations to their suppliers and staff.
Companies, which primary activity is production, are greatly affected too,
46% of them being forced to reduce personnel and 44% having trouble
claiming obligations from contractors and partners. One out of three
companies reports to have loss of markets.
SMEs in the trade sector differ from those in the production and services
by the fact that they have been forced to take redundancy of activities
and structural units to a greater extent, compared to the rest. SMEs in the
services sector have more difficulties paying off their current obligations
than production and trade sectors.
Crisis as an opportunity
In 2009, only 8% of the SMEs in the country state not to be affected by the
crisis.¹ In 2010, this proportion is twice as high — 17%.² Various studies,
conducted in 2009 and 2010, show that between 3% and 5% of all SMEs
claim their activities to be positively affected by the crisis.
The study in the food manufacturing sector³ indicates that, compared to
2008, in 2009 39% have had an increase in their sales (compared to 55%
who did not), 27% have increased their earnings (22% have registered
losses), 28% have increased their investments (this share was 43% in 2008),
25% have made a significant purchase of assets (compared to 42% in 2008),
20% have increased the number of their personnel (25% did so in 2008).
Restructuring of human resources is one of the most important responses
to crisis from Bulgarian companies. The economic crisis is also a chance for
a lot of companies to optimize their work efficiency. More than half of all
companies in the Food Production sector state that the radical
reconstruction of their human resources in 2009 have increased the control
over their employees‘ performance.
Crisis in 2009 allows not only an increase of employee performance, but
promotes an overall improvement of company activities by optimization of
internal business procedures. In the Food Production sector 65% state to
have made improvements for more accurate accounting of their inventory,
62% have more accurate accounting of costs for their units and activities
while 60% have increased accuracy of accounts concerning their payment
of obligations.
3 The Economic Crisis
¹ National representative survey among non-financial enterprises in Bulgaria, carried out by NOEMA in June 2009; sample size of 1000.
² National representative survey among non-financial enterprises in Bulgaria, carried out by NOEMA in May 2010; sample size of 1000.
³ National representative survey among enterprises in the sector ―Manufacturing of food‖, carried out by NOEMA and Job Tiger in January 2010; sample size of 300.
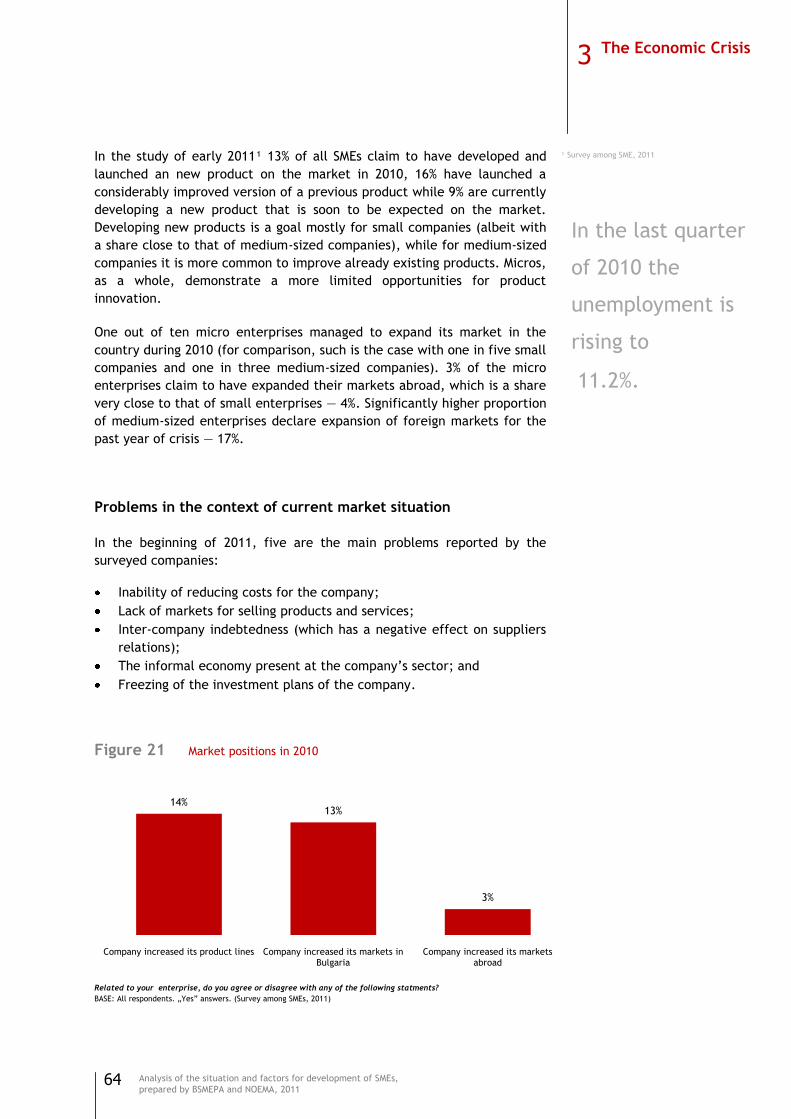
64
Analysis of the situation and factors for development of SMEs,
prepared by BSMEPA and NOEMA, 2011
In the study of early 2011¹ 13% of all SMEs claim to have developed and
launched an new product on the market in 2010, 16% have launched a
considerably improved version of a previous product while 9% are currently
developing a new product that is soon to be expected on the market.
Developing new products is a goal mostly for small companies (albeit with
a share close to that of medium-sized companies), while for medium-sized
companies it is more common to improve already existing products. Micros,
as a whole, demonstrate a more limited opportunities for product
innovation.
One out of ten micro enterprises managed to expand its market in the
country during 2010 (for comparison, such is the case with one in five small
companies and one in three medium-sized companies). 3% of the micro
enterprises claim to have expanded their markets abroad, which is a share
very close to that of small enterprises — 4%. Significantly higher proportion
of medium-sized enterprises declare expansion of foreign markets for the
past year of crisis — 17%.
Problems in the context of current market situation
In the beginning of 2011, five are the main problems reported by the
surveyed companies:
Inability of reducing costs for the company;
Lack of markets for selling products and services;
Inter-company indebtedness (which has a negative effect on suppliers
relations);
The informal economy present at the company‘s sector; and
Freezing of the investment plans of the company.
Figure 21 Market positions in 2010
Related to your enterprise, do you agree or disagree with any of the following statments?
BASE: All respondents. „Yes‖ answers. (Survey among SMEs, 2011)
14%13%
3%
Company increased its product lines Company increased its markets in Bulgaria
Company increased its markets abroad
¹ Survey among SME, 2011
In the last quarter
of 2010 the
unemployment is
rising to
11.2%.
3 The Economic Crisis

65
Analysis of the situation and factors for development of SMEs,
prepared by BSMEPA and NOEMA, 2011
These five issues are actually the main barriers to growth and
competitiveness of Bulgarian companies in the sector. In the context of the
principles of SBA of EU they can be interpreted as problems of the business
environment, financial security and stability, insufficient access to the EU
unified market. The top issue of ‗Inability of reducing costs for the
company‘ is not only a consequence of all other problems but also a signal
for poor profitability and low efficiency.
From the fact that micro enterprises are predominant SMEs is logically
derived that the main obstacles that lay in front of them are also the main
obstacles to all SMEs. An exeption from this is the inter-company
indebtedness that concerns them far less, compared to small and
especially medium-sized companies.
Medium-sized enterprises define as their most pressing issues inter-
company indebtedness and relations with suppliers. Next come lack of
markets, company‘s organizational efficiency and the informal sector of
economy. Given the fact that, in the context of the crisis the middle-sized
companies are the least affected from loss of markets, access to EU
market is an important prerequisite for their growth. On the other hand,
although stated mainly among the medium-sized companies, this issue
concerns small and micro enterprises too.
The most pressing issues for small enterprises in the context of the crisis
and general market conditions are inter-company indebtedness and lack of
markets. Second is the inability to reduce costs and freezing investment
Figure 22 Problems coming from the general market situation and economic
crisis - by enterprise size class
In the context of general market situation and economic crisis, which are the most serious problems facing your company? BASE: All respondents. „Yes‖ answers. (Survey among SMEs, 2011)
All enterprises
92%
42%
41%
28%
27%
22%
19%
14%
7%
General impact of the crisis over the sector
Impossibility to reduce company expenses
Lack of markets to realize company production
Inter-company indebtedness
Incidence of large grey part in the sector
Freeze of company investments
Relationship with suppliers
Reduced motivation of employees
Organizational effectiveness of the company
Micro Small Medium-sized
93%
87% 79%
43% 38%
20%
40% 43% 38%
26% 44%
54%
28% 16%
25%
21% 36%
17%
18% 14%
50%
14% 13%
17%
6% 11%
29%
3 The Economic Crisis

66
Analysis of the situation and factors for development of SMEs,
prepared by BSMEPA and NOEMA, 2011
plans. The latter is much more pronounced with small enterprises
compared to micro and medium-sized ones.
A typical issue for companies in the construction sector is the lack of
markets. This problem is characteristic for companies in the trade sector
too, along with organizational efficacy. Inter-company indebtedness and
supplier relations, as well as high costs for the company are among the
most pressing issues for the companies in the production sector.
Table 26 Problems coming from the general market situation and economic
crisis - by sphere of activity
Production Trade Services Construction
General impact of the crisis over the sector
95% 89% 94% 96%
Impossibility to reduce company expenses
44% 39% 41% 55%
Lack of markets to realize company production
38% 39% 36% 77%
Inter-company indebtedness
41% 26% 22% 42%
Incidence of large grey part in the sector
49% 20% 23% 52%
Freeze of company investments
24% 24% 17% 44%
Relationship with suppliers
24% 21% 13% 27%
Reduced motivation of employees
21% 11% 11% 30%
Organizational effectiveness of the company
5% 10% 3% 15%
In the context of general market situation and economic crisis, which are the most serious problems facing your
company? BASE: All respondents. „Yes‖ answers. (Survey among SMEs, 2011)
3 The Economic Crisis
67
Analysis of the situation and factors for development of SMEs,
prepared by BSMEPA and NOEMA, 2011
Key points
In the first two years after becoming an EU member state (2007-
2008), Bulgaria continues to register high rates of economic growth. In
the form of direct foreign investments, the country has attracted 15,7
billion EUR in the two years. However, distribution of these
investments by industries is quite uneven. As a result, many economic
activities were developing with unsustainably high rates, like
construction and credit activities of banks.
In 2007 and 2008, the labour demand is increasing rapidly and
significantly leading to a shortage of skilled workers in many sectors.
In 2007, the average wage in the country has increased with almost
20%, and in 2008 — with another 27%.
The first signs of impact of the global financial and economic crisis
occurned in late 2008 with decreasing growth rate of exports — with
slightly over 10% on annual base. In early 2009, there was a decline in
GDP of 4.9% due to a rare downward adjustment in consumption and
investment. In 2009, the economy shrank by 5.5%. The decline in
consumption was 7.3%, while in investment — 24.9%. For the last six
months of 2009, the number of employees has decreased by 120
thousand.
By the end of 2009, the macroeconomic indicators showed a gradual
exit from recession in EU.
In 2010, the effects of the crisis in Bulgaria have continued despite
signs of recovery and the subsequent insignificant GDP growth of
0.2%. Consumption and investments continued declining. At the end of
the year, the unemployment reached 11.2%, while the inflation —
4.5% (the average annual inflation amounted to 2.4%). In general, the
domestic demand remained depressed as a result of the situation of
labour market, incomes and credit financing.
3 The Economic Crisis
68
Analysis of the situation and factors for development of SMEs,
prepared by BSMEPA and NOEMA, 2011
The banking system in Bulgaria faced the beginning of the economic
crisis in a very good condition. In 2010 however, the tentative signs of
economic recovery affected the dynamics of banking sector, so that
the proportion of bad loans reached almost 12%. Still, banks managed
to preserve stability of their performance and capital adequacy
amounted at 17.5% by the end of 2010.
The dynamic development of SMEs is inherent in all EU countries —
both old and new member states. At the beginning of the financial
and economic crisis, the upward development of the sector is
interrupted. Estimates of the loss of jobs in SMEs in the countries of
EU-27 are 3,25 million for 2009 and 2010.
In 2011, only 8% of SMEs in the country state they are not affected by
the crisis, unlike to previous year when this proportion was twice
higher — 17%. The main problems of SMEs are, as follows: (1)
impossibility to reduce costs, (2) lack of markets, (3) intercompany
indebtness, (4) presence of a large part of unrecorded activities, and
и (5) freeze of investment plans. Throughout the crisis, 37% of the
firms have reduced the number of their staff. 96% of businesses in the
field of construction have released employees and 60% have
difficulties in paying currnet liability.
56% of all SMEs take an active position in relation to the crisis, while
44% do not take any action to deal with it, and take a rather passive,
awaiting attitude. Three quarter of the active firms have undertaken
a strategy for cutting costs. The remaing quarter rely on innovative
strategies — for increasing market share through launching new or
improved products.
3 The Economic Crisis
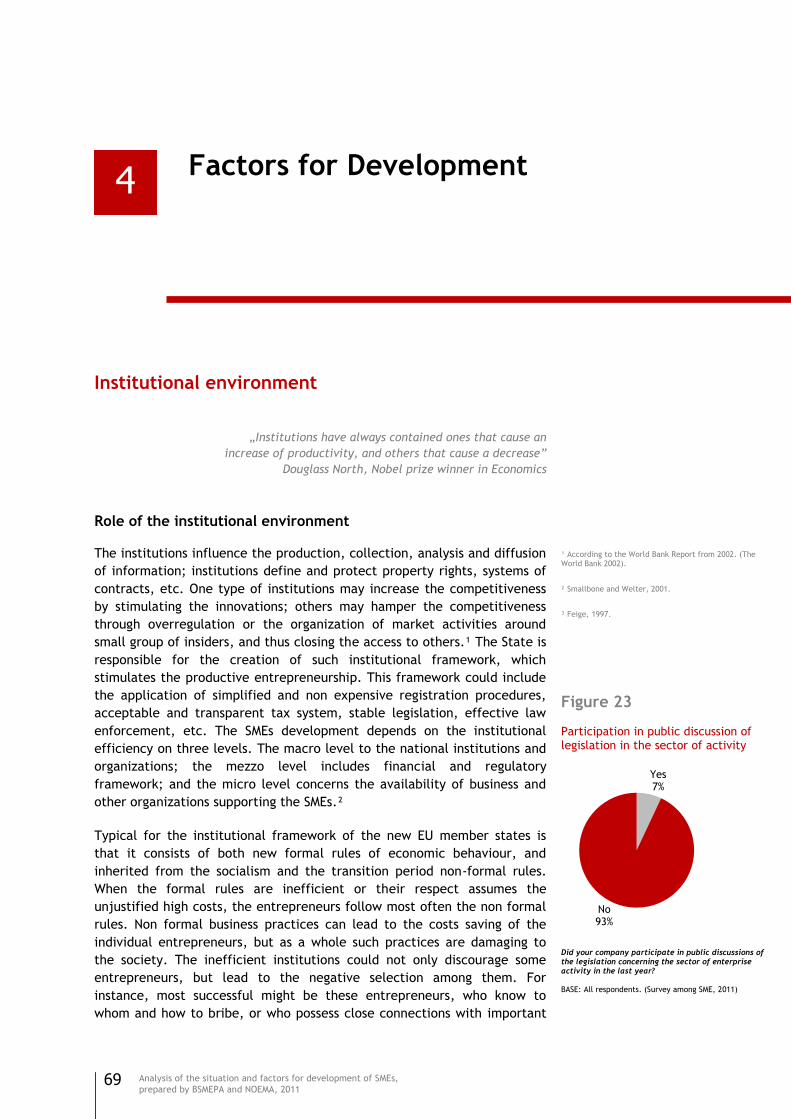
69
Analysis of the situation and factors for development of SMEs,
prepared by BSMEPA and NOEMA, 2011
Factors for Development
Institutional environment
„Institutions have always contained ones that cause an
increase of productivity, and others that cause a decrease”
Douglass North, Nobel prize winner in Economics
Role of the institutional environment
The institutions influence the production, collection, analysis and diffusion
of information; institutions define and protect property rights, systems of
contracts, etc. One type of institutions may increase the competitiveness
by stimulating the innovations; others may hamper the competitiveness
through overregulation or the organization of market activities around
small group of insiders, and thus closing the access to others.¹ The State is
responsible for the creation of such institutional framework, which
stimulates the productive entrepreneurship. This framework could include
the application of simplified and non expensive registration procedures,
acceptable and transparent tax system, stable legislation, effective law
enforcement, etc. The SMEs development depends on the institutional
efficiency on three levels. The macro level to the national institutions and
organizations; the mezzo level includes financial and regulatory
framework; and the micro level concerns the availability of business and
other organizations supporting the SMEs.²
Typical for the institutional framework of the new EU member states is
that it consists of both new formal rules of economic behaviour, and
inherited from the socialism and the transition period non-formal rules.
When the formal rules are inefficient or their respect assumes the
unjustified high costs, the entrepreneurs follow most often the non formal
rules. Non formal business practices can lead to the costs saving of the
individual entrepreneurs, but as a whole such practices are damaging to
the society. The inefficient institutions could not only discourage some
entrepreneurs, but lead to the negative selection among them. For
instance, most successful might be these entrepreneurs, who know to
whom and how to bribe, or who possess close connections with important
4
¹ According to the World Bank Report from 2002. (The World Bank 2002).
² Smallbone and Welter, 2001.
³ Feige, 1997.
Figure 23
Participation in public discussion of legislation in the sector of activity
Did your company participate in public discussions of the legislation concerning the sector of enterprise activity in the last year? BASE: All respondents. (Survey among SME, 2011)
Yes7%
No93%
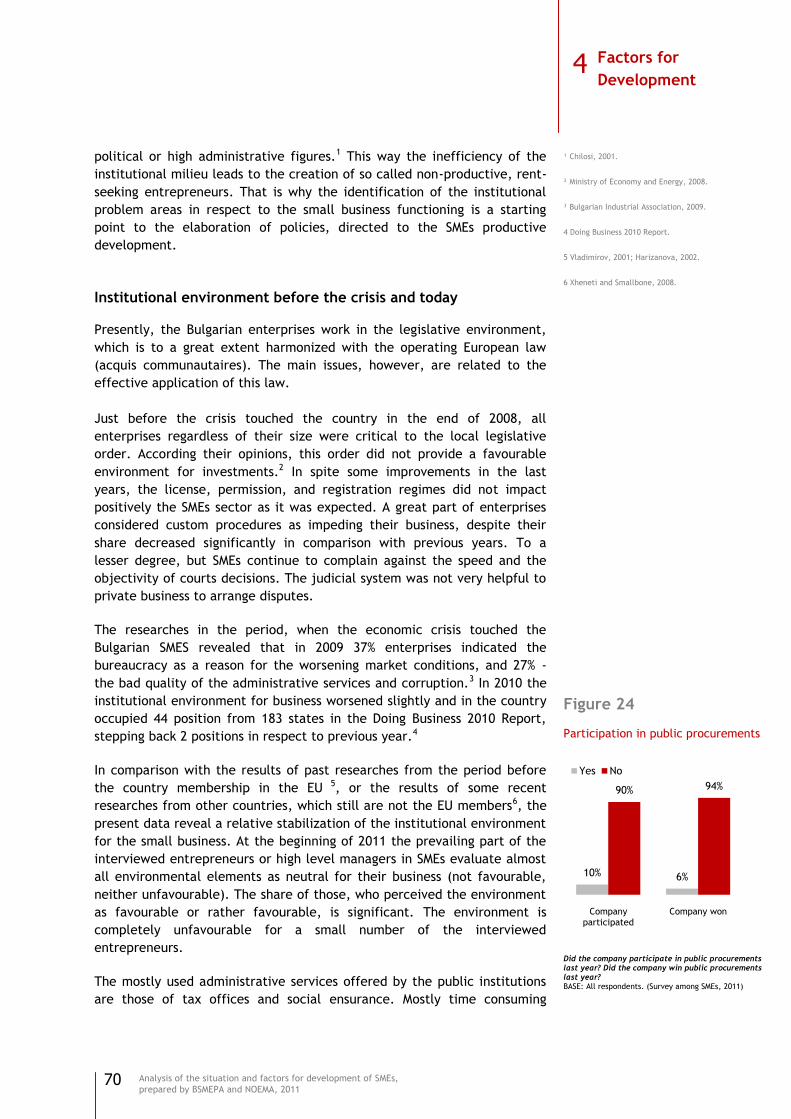
70
Analysis of the situation and factors for development of SMEs,
prepared by BSMEPA and NOEMA, 2011
political or high administrative figures.1 This way the inefficiency of the
institutional milieu leads to the creation of so called non-productive, rent-
seeking entrepreneurs. That is why the identification of the institutional
problem areas in respect to the small business functioning is a starting
point to the elaboration of policies, directed to the SMEs productive
development.
Institutional environment before the crisis and today
Presently, the Bulgarian enterprises work in the legislative environment,
which is to a great extent harmonized with the operating European law
(acquis communautaires). The main issues, however, are related to the
effective application of this law.
Just before the crisis touched the country in the end of 2008, all
enterprises regardless of their size were critical to the local legislative
order. According their opinions, this order did not provide a favourable
environment for investments.2 In spite some improvements in the last
years, the license, permission, and registration regimes did not impact
positively the SMEs sector as it was expected. A great part of enterprises
considered custom procedures as impeding their business, despite their
share decreased significantly in comparison with previous years. To a
lesser degree, but SMEs continue to complain against the speed and the
objectivity of courts decisions. The judicial system was not very helpful to
private business to arrange disputes.
The researches in the period, when the economic crisis touched the
Bulgarian SMES revealed that in 2009 37% enterprises indicated the
bureaucracy as a reason for the worsening market conditions, and 27% -
the bad quality of the administrative services and corruption.3 In 2010 the
institutional environment for business worsened slightly and in the country
occupied 44 position from 183 states in the Doing Business 2010 Report,
stepping back 2 positions in respect to previous year.4
In comparison with the results of past researches from the period before
the country membership in the EU 5, or the results of some recent
researches from other countries, which still are not the EU members6, the
present data reveal a relative stabilization of the institutional environment
for the small business. At the beginning of 2011 the prevailing part of the
interviewed entrepreneurs or high level managers in SMEs evaluate almost
all environmental elements as neutral for their business (not favourable,
neither unfavourable). The share of those, who perceived the environment
as favourable or rather favourable, is significant. The environment is
completely unfavourable for a small number of the interviewed
entrepreneurs.
The mostly used administrative services offered by the public institutions
are those of tax offices and social ensurance. Mostly time consuming
¹ Chilosi, 2001.
² Ministry of Economy and Energy, 2008.
³ Bulgarian Industrial Association, 2009.
4 Doing Business 2010 Report.
5 Vladimirov, 2001; Harizanova, 2002.
6 Xheneti and Smallbone, 2008.
Figure 24
Participation in public procurements
Did the company participate in public procurements last year? Did the company win public procurements last year? BASE: All respondents. (Survey among SMEs, 2011)
10% 6%
90% 94%
Company participated
Company won
Yes No
Yes9%
No91%
4 Factors for
Development
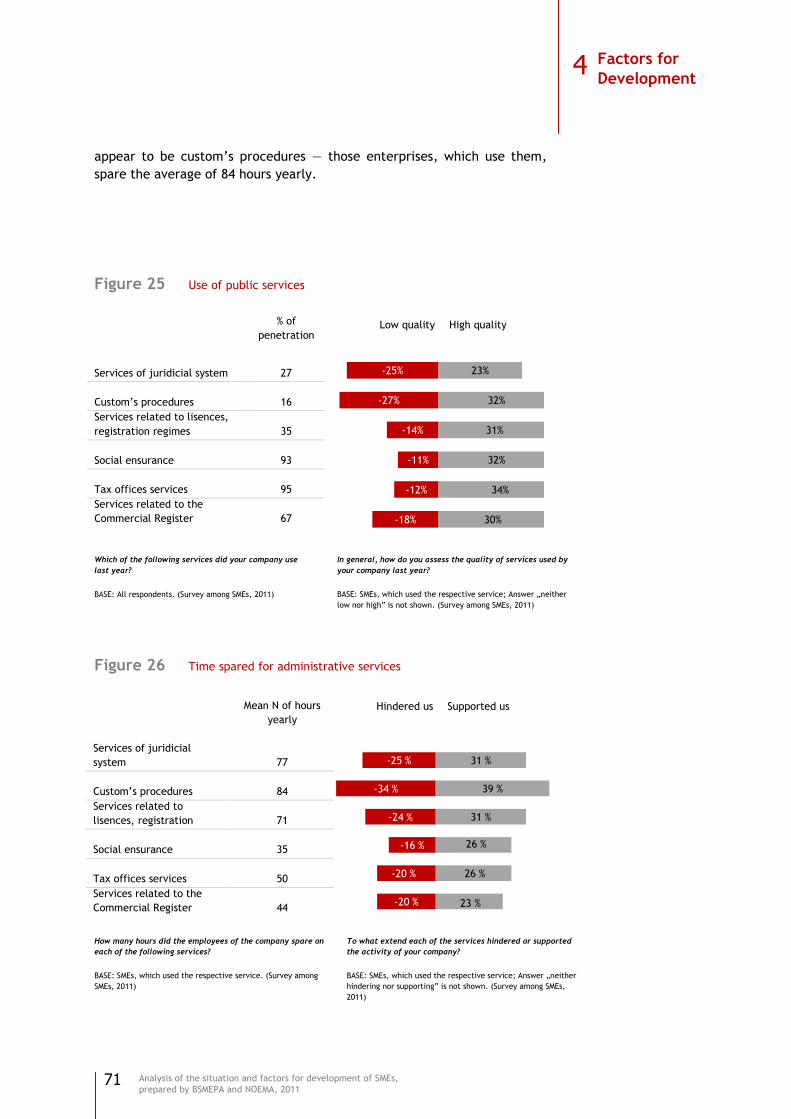
71
Analysis of the situation and factors for development of SMEs,
prepared by BSMEPA and NOEMA, 2011
appear to be custom‘s procedures — those enterprises, which use them,
spare the average of 84 hours yearly.
Figure 25 Use of public services
Which of the following services did your company use
last year?
BASE: All respondents. (Survey among SMEs, 2011)
In general, how do you assess the quality of services used by
your company last year?
BASE: SMEs, which used the respective service; Answer „neither
low nor high‖ is not shown. (Survey among SMEs, 2011)
Figure 26 Time spared for administrative services
How many hours did the employees of the company spare on
each of the following services?
BASE: SMEs, which used the respective service. (Survey among
SMEs, 2011)
To what extend each of the services hindered or supported
the activity of your company?
BASE: SMEs, which used the respective service; Answer „neither
hindering nor supporting‖ is not shown. (Survey among SMEs,
2011)
Low quality High quality
23%
32%
31%
32%
34%
30%
-25%
-27%
-14%
-11%
-12%
-18%
% of
penetration
Services of juridicial system
27
Custom‘s procedures
16
Services related to lisences,
registration regimes
35
Social ensurance
93
Tax offices services
95
Services related to the
Commercial Register
67
Hindered us Supported us
31 %
39 %
31 %
26 %
26 %
23 %
-25 %
-34 %
-24 %
-16 %
-20 %
-20 %
Mean N of hours
yearly
Services of juridicial
system
77
Custom‘s procedures
84
Services related to
lisences, registration
71
Social ensurance
35
Tax offices services
50
Services related to the
Commercial Register
44
4 Factors for
Development

72
Analysis of the situation and factors for development of SMEs,
prepared by BSMEPA and NOEMA, 2011
Approximately one third of the enterprises evaluate the service quality of
public institutions as high (except for the services of the judicial system
which are valued of high quality by one fifth of the respondents). Every
fourth company believes that the service quality of the customs and the
judicial system is low. However, there is a clear polarized opinion on the
activities of these institutions — there is considerable formation of SMEs
claiming that these institutions support their activities, while it is observed
that a significant proportion of firms say that the customs and the judicial
system are definitely causing difficulties.
13% of the enterprises have experienced personally corruption, but the
share of those which have had such experience with the customs and the
tax administration — respectively 35% and 30% — significantly exceeds the
average for all surveyed institutions. The lowest reported corruption is in
the administration associated with the Commercial Register.
One of the 10 principles of the SBA is connected with support from the
state as well as ease of access to public procurement for SMEs. High
proportion of owners and senior managers of SMEs in the sector of
Manufacture of food products¹ shared perceptions that corruption in the
public procurement is widespread and that they had not been winning
tender procedures for that reason (28%). This attitude definitely
discourages large proportion of SMEs to apply in public procurement
procedures and to expect a support from the state.
In spite of the efforts of the state to support the SMEs with information
through the web portal for consultations www.strategy.bg only 9% of the
companies knows it.
Figure 28 Areas /institutions with corruption
In which of the following areas did you witness corruption practices last year? BASE: Respondents who declare that have witnessed corruption. (Survey among SMEs, 2011)
35%
30%27%
24%
12%
5%
31%
Cust
om
's o
ffic
es
Tax o
ffic
es
Lic
ense
/re
gis
trati
on
regim
es
Judic
ial sy
stem
Socia
l ensu
rance
Com
merc
ial
regis
ter
Oth
er
are
as
¹ National representative survey among enterprises in the sector ―Manufacturing of food products‖, carried out by NOEMA and Job Tiger in January 2010; sample size of 300.
Figure 29
Witnessing of corruption practices
Did you witness corruption practices in the frame of your business activity? БАЗА: All respondents. (Survey among SMEs, 2011)
Yes13%
No87%
4 Factors for
Development

73
Analysis of the situation and factors for development of SMEs,
prepared by BSMEPA and NOEMA, 2011
Index of the institutional environment
For the purposes of this analysis, the institutional environment is
considered as equivalent to the environment provided by public
institutions through formulating and implementing of a framework of
administrative procedures and regulations. The image of the institutional
environment is based on the opinion of the interviewed entrepreneurs
about the extent of usage and quality assessment of a number of
administrative services. Evaluating administrative services through an
index allows looking from above on problematic areas in the process of
communication, cooperation and support between SMEs and the
Government.
The index for the institutional environment measures the extent to which firms perceive the institutional environment as favorable for the development of their business.
Favorable institutional environment is defined as an environment which:
Supports the entrepreneurs to a maximum degree;
Provides services which have high quality;
Requires the companies to devote relatively little time for the use
of administrative services.
The index is calculated for six types of administrative services and
procedures, as it included the following three equal components:
The extent to which entrepreneurs are supported / hindered by
the administrative services;
The assessment of the service quality provided by the institutions;
Relative time commitment by the entrepreneurs for use of
administrative services.
The index is calculated for each company included in the survey, and then
it is summarized by size of enterprises, by field of activity, and by planning
regions. (For more information on the methodology of the index see the
Annex).
To what extent the institutional environment is favourable for the SMEs?
Businesses classified as favorable or unfavorable the different types of
administrative services as follows:
The judicial system provides a rather favorable or favorable
environment for nearly half of the entrepreneurs, while its services are
rather unfavorable or unfavorable for a little more than a fifth of
them (in this case there is a well-defined group of SMEs for which the
environment is definitely unfavorable — 7%).
The customs procedures offer rather unfavorable environment for
36% of the enterprises, which is the largest observed disapproval of
The institutional
environment for the
SMEs has improved
over the last years
mainly due to the
availability of the
trade register as
well as the
reduction of weight
in the registration
procedures.
4 Factors for
Development
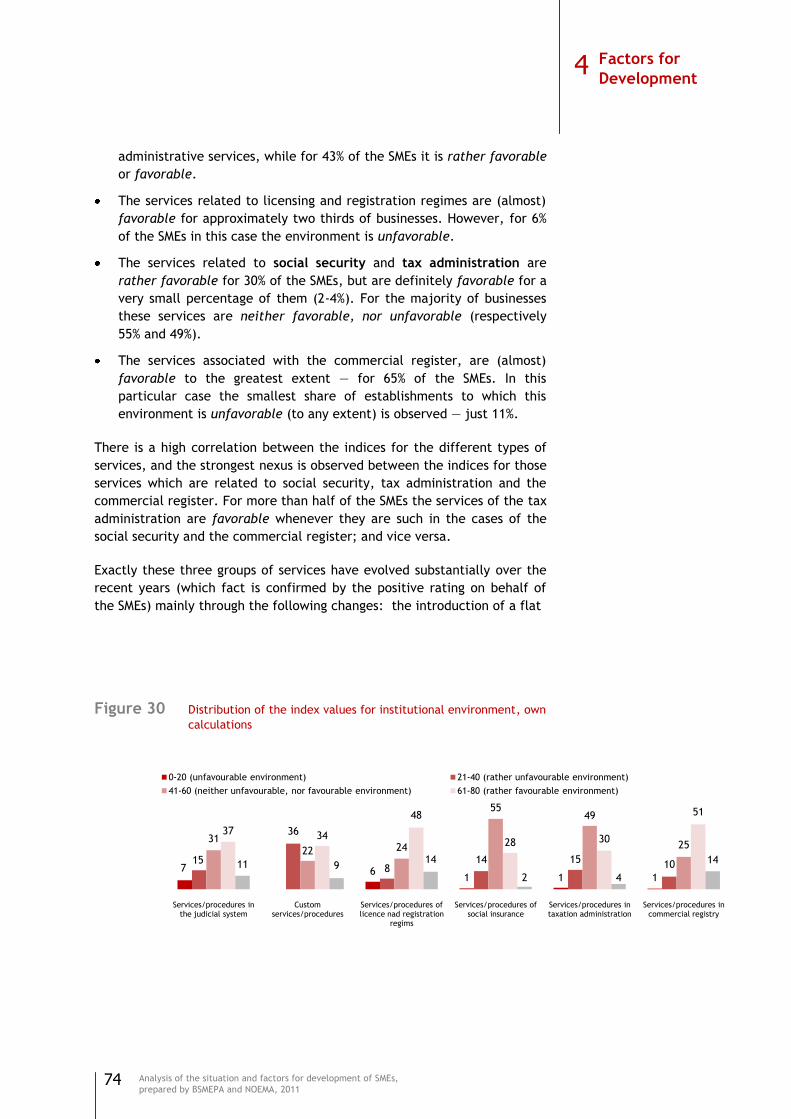
74
Analysis of the situation and factors for development of SMEs,
prepared by BSMEPA and NOEMA, 2011
administrative services, while for 43% of the SMEs it is rather favorable
or favorable.
The services related to licensing and registration regimes are (almost)
favorable for approximately two thirds of businesses. However, for 6%
of the SMEs in this case the environment is unfavorable.
The services related to social security and tax administration are
rather favorable for 30% of the SMEs, but are definitely favorable for a
very small percentage of them (2-4%). For the majority of businesses
these services are neither favorable, nor unfavorable (respectively
55% and 49%).
The services associated with the commercial register, are (almost)
favorable to the greatest extent — for 65% of the SMEs. In this
particular case the smallest share of establishments to which this
environment is unfavorable (to any extent) is observed — just 11%.
There is a high correlation between the indices for the different types of
services, and the strongest nexus is observed between the indices for those
services which are related to social security, tax administration and the
commercial register. For more than half of the SMEs the services of the tax
administration are favorable whenever they are such in the cases of the
social security and the commercial register; and vice versa.
Exactly these three groups of services have evolved substantially over the
recent years (which fact is confirmed by the positive rating on behalf of
the SMEs) mainly through the following changes: the introduction of a flat
Figure 30 Distribution of the index values for institutional environment, own
calculations
7 61 1 1
15
36
814 15 10
3122 24
5549
25
37 34
48
28 30
51
11 914
2 4
14
-20
40
100
Services/procedures in the judicial system
Custom services/procedures
Services/procedures of licence nad registration
regims
Services/procedures of social insurance
Services/procedures in taxation administration
Services/procedures in commercial registry
0-20 (unfavourable environment) 21-40 (rather unfavourable environment)
41-60 (neither unfavourable, nor favourable environment) 61-80 (rather favourable environment)
4 Factors for
Development
75
Analysis of the situation and factors for development of SMEs,
prepared by BSMEPA and NOEMA, 2011
tax rate, the insignificant increase in social security payments aimed at a
more even distribution of costs between employer and employee, and the
effects of the introduction of the commercial register on the reduction of
the number of the fictitious companies or those from the informal sector.
There is a clear pattern showing that the institutional environment is more
conducive to larger enterprises and the least favorable for micro
enterprises in all types of administrative services.
Micro enterprises are placed in the most favorable environment in the case
of services associated with the commercial register, and in the worst — in
the case of the customs procedures. For small enterprises the most
favorable environment is observed in the case of services related to
registration and the commercial register, and the worst one — in the case
of services related to social security. For medium-sized enterprises there is
almost uniformly favorable environment for most of the services. Here,
however, the services related to social security and tax administration,
appear to be favorable to the least extent.
For the companies in the field of production only the customs services are
rather favorable. Here the services related to social security are the most
unfavorable.
The services related to licensing and registration regimes and those
associated with the commercial register are rather favorable to SMEs in
the spherers of trade and services. In these two fields the customs
procedures appear to be the most unfavorable.
For businesses operating in the field of construction, most of the
administrative services (namely, those associated with the judiciary, the
customs, licensing and registration regimes and the commercial register)
are rather favorable. The most unfavorable environment here is observed
in the services related to social security and tax administration.
In most of the planning regions the assessment of the services of state
institutions are similar (with the exception of the services of the judicial
system and the customs). Most favorable institutional environment for
business is that in the South Central and the North Central Region. The
North Western region stands out clearly from the rest — in this case the
environment is most unfavorable and the average score for any state
institution does not signal the presence of favorable conditions.
Determinants of the institutional environment
Based on statistical and econometric analysis an identification of the
determinants that currently have a statistically significant effect on
whether the institutional environment is favorable or not for a given entity
is done.
The judicial system
and the customs
have the most
adverse effects on
the environment,
especially for the
smaller companies
and those in the
larger towns and
cities.
The judicial system
and the customs
have the most
adverse effects on
the environment,
especially for the
smaller companies
and those in the
larger towns and
cities.
4 Factors for
Development

76
Analysis of the situation and factors for development of SMEs,
prepared by BSMEPA and NOEMA, 2011
Reported main determinants of the degree the environment is favorable in
the different administrative services are as follows:¹
(1) The size of the settlement: in smaller towns the customs
services and the judiciary are more favorable to the SMEs than in
larger towns and cities where they are less favorable.
(2) The size of the enterprise: the customs services are more
favorable for larger companies and less favorable to smaller
businesses.
(3) The average age of employees in the company: the services
of the judiciary and the commercial register are more favorable
for companies with older workers and less favorable for those with
younger employees.
(4) Educational attainment of the entrepreneur: The services of
the commercial register are more favorable for entrepreneurs with
low education than for those with higher education.
1 These results are based on estimated regressions and each of the listed factors is significant at p <0.05.
4 Factors for
Development
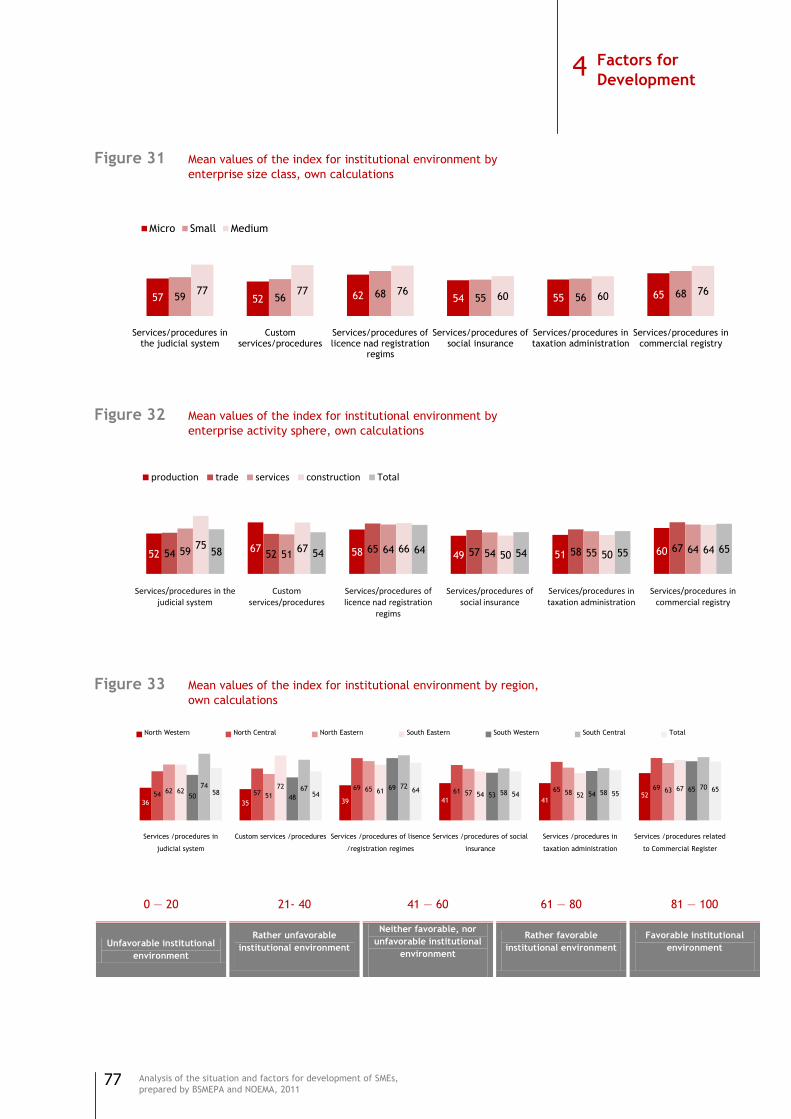
77
Analysis of the situation and factors for development of SMEs,
prepared by BSMEPA and NOEMA, 2011
Figure 31 Mean values of the index for institutional environment by
enterprise size class, own calculations
Figure 32 Mean values of the index for institutional environment by
enterprise activity sphere, own calculations
Figure 33 Mean values of the index for institutional environment by region,
own calculations
0 — 20 21- 40 41 — 60 61 — 80 81 — 100
Unfavorable institutional
environment
Rather unfavorable
institutional environment
Neither favorable, nor
unfavorable institutional
environment
Rather favorable
institutional environment
Favorable institutional
environment
57 52 62 54 55 6559 56 68 55 56 6877 77 7660 60
76
Services/procedures in the judicial system
Custom services/procedures
Services/procedures of licence nad registration
regims
Services/procedures of social insurance
Services/procedures in taxation administration
Services/procedures in commercial registry
Micro Small Medium
5267 58 49 51 6054 52
65 57 58 6759 51 64 54 55 6475 67 6650 50 6458 54 64 54 55 65
Services/procedures in the judicial system
Custom services/procedures
Services/procedures of licence nad registration
regims
Services/procedures of social insurance
Services/procedures in taxation administration
Services/procedures in commercial registry
production trade services construction Total
36 35 39 41 415254 57
6961 65 6962
5165
57 58 636272
6154 52
6750 48
6953 54
6574 67 72
58 5870
58 5464
54 5565
Services /procedures in
judicial system
Custom services /procedures Services /procedures of lisence
/registration regimes
Services /procedures of social
insurance
Services /procedures in
taxation administration
Services /procedures related
to Commercial Register
North Western North Central North Eastern South Eastern South Western South Central Total
4 Factors for
Development
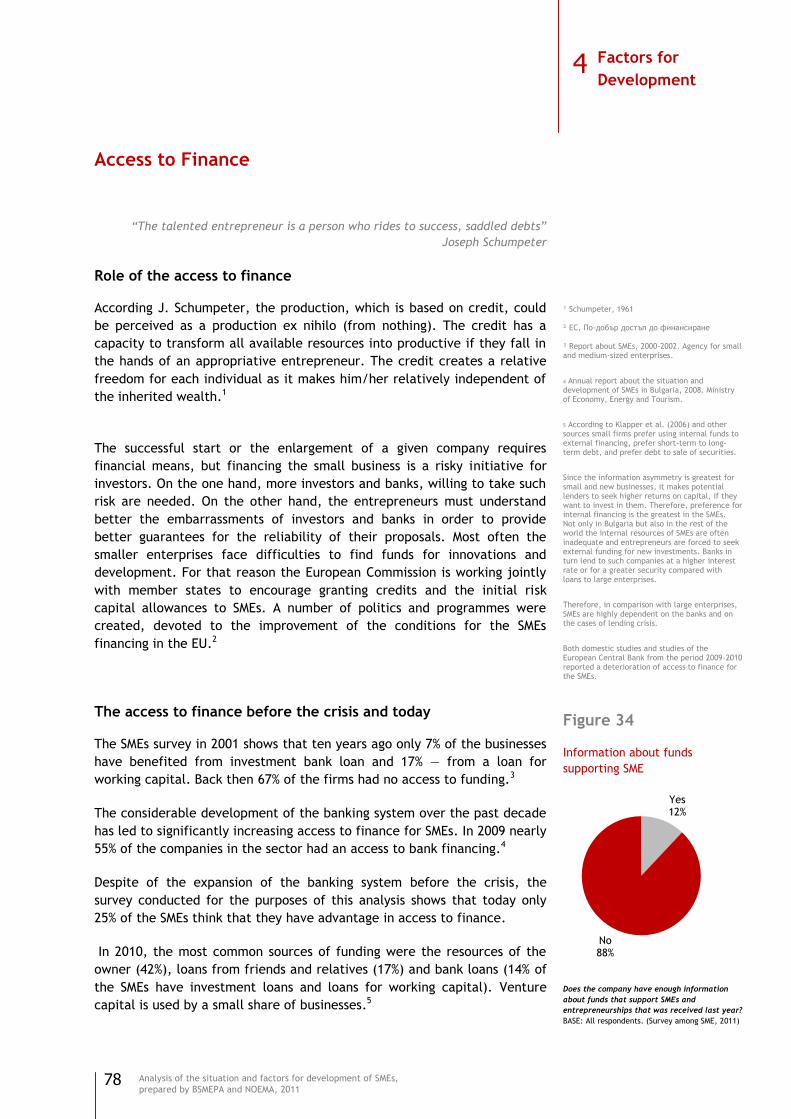
78
Analysis of the situation and factors for development of SMEs,
prepared by BSMEPA and NOEMA, 2011
Access to Finance
“The talented entrepreneur is a person who rides to success, saddled debts”
Joseph Schumpeter
Role of the access to finance
According J. Schumpeter, the production, which is based on credit, could
be perceived as a production ex nihilo (from nothing). The credit has a
capacity to transform all available resources into productive if they fall in
the hands of an appropriative entrepreneur. The credit creates a relative
freedom for each individual as it makes him/her relatively independent of
the inherited wealth.1
The successful start or the enlargement of a given company requires
financial means, but financing the small business is a risky initiative for
investors. On the one hand, more investors and banks, willing to take such
risk are needed. On the other hand, the entrepreneurs must understand
better the embarrassments of investors and banks in order to provide
better guarantees for the reliability of their proposals. Most often the
smaller enterprises face difficulties to find funds for innovations and
development. For that reason the European Commission is working jointly
with member states to encourage granting credits and the initial risk
capital allowances to SMEs. A number of politics and programmes were
created, devoted to the improvement of the conditions for the SMEs
financing in the EU.2
The access to finance before the crisis and today
The SMEs survey in 2001 shows that ten years ago only 7% of the businesses
have benefited from investment bank loan and 17% — from a loan for
working capital. Back then 67% of the firms had no access to funding.3
The considerable development of the banking system over the past decade
has led to significantly increasing access to finance for SMEs. In 2009 nearly
55% of the companies in the sector had an access to bank financing.4
Despite of the expansion of the banking system before the crisis, the
survey conducted for the purposes of this analysis shows that today only
25% of the SMEs think that they have advantage in access to finance.
In 2010, the most common sources of funding were the resources of the
owner (42%), loans from friends and relatives (17%) and bank loans (14% of
the SMEs have investment loans and loans for working capital). Venture
capital is used by a small share of businesses.5
4
¹ Schumpeter, 1961 ² EC, По-добър достъп до финансиране ³ Report about SMEs, 2000-2002. Agency for small and medium-sized enterprises.
4 Annual report about the situation and development of SMEs in Bulgaria, 2008. Ministry of Economy, Energy and Tourism.
5 According to Klapper et al. (2006) and other sources small firms prefer using internal funds to external financing, prefer short-term to long-term debt, and prefer debt to sale of securities.
Since the information asymmetry is greatest for small and new businesses, it makes potential lenders to seek higher returns on capital, if they want to invest in them. Therefore, preference for internal financing is the greatest in the SMEs. Not only in Bulgaria but also in the rest of the world the internal resources of SMEs are often inadequate and entrepreneurs are forced to seek external funding for new investments. Banks in turn lend to such companies at a higher interest rate or for a greater security compared with
loans to large enterprises.
Therefore, in comparison with large enterprises, SMEs are highly dependent on the banks and on the cases of lending crisis.
Both domestic studies and studies of the European Central Bank from the period 2009-2010 reported a deterioration of access to finance for the SMEs.
Figure 34
Information about funds
supporting SME
Does the company have enough information
about funds that support SMEs and
entrepreneurships that was received last year?
BASE: All respondents. (Survey among SME, 2011)
Yes12%
No88%
4 Factors for
Development
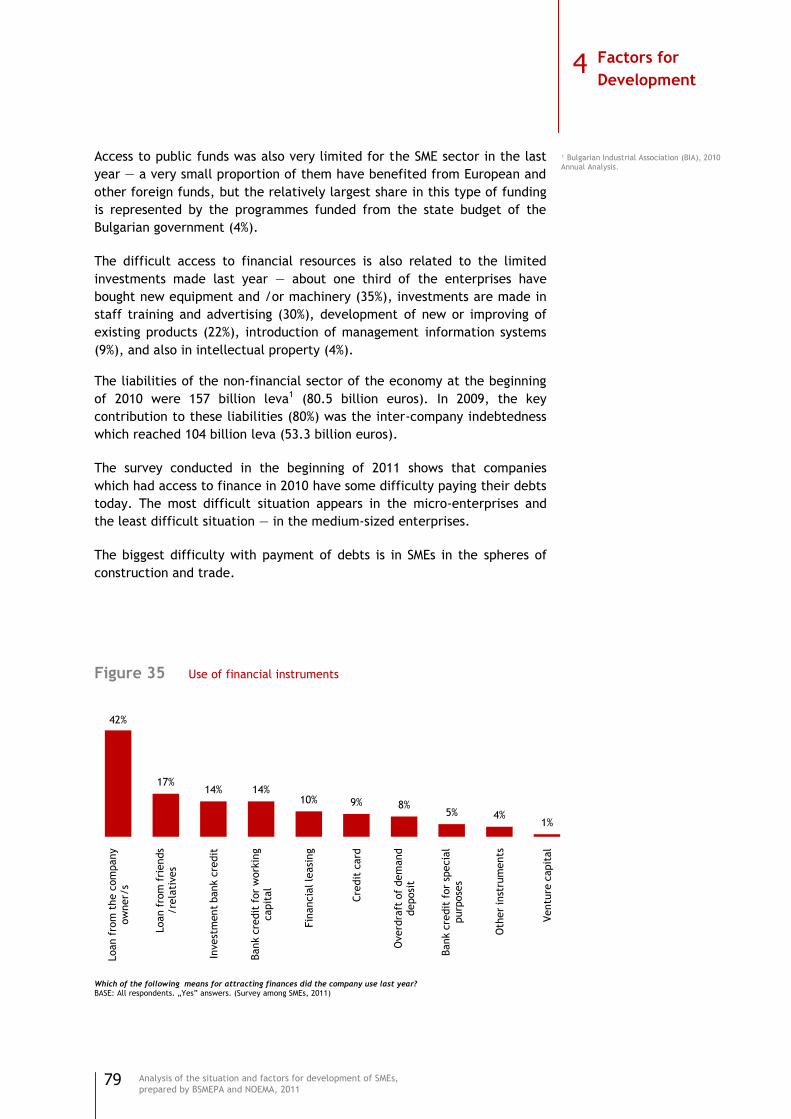
79
Analysis of the situation and factors for development of SMEs,
prepared by BSMEPA and NOEMA, 2011
Access to public funds was also very limited for the SME sector in the last
year — a very small proportion of them have benefited from European and
other foreign funds, but the relatively largest share in this type of funding
is represented by the programmes funded from the state budget of the
Bulgarian government (4%).
The difficult access to financial resources is also related to the limited
investments made last year — about one third of the enterprises have
bought new equipment and /or machinery (35%), investments are made in
staff training and advertising (30%), development of new or improving of
existing products (22%), introduction of management information systems
(9%), and also in intellectual property (4%).
The liabilities of the non-financial sector of the economy at the beginning
of 2010 were 157 billion leva1 (80.5 billion euros). In 2009, the key
contribution to these liabilities (80%) was the inter-company indebtedness
which reached 104 billion leva (53.3 billion euros).
The survey conducted in the beginning of 2011 shows that companies
which had access to finance in 2010 have some difficulty paying their debts
today. The most difficult situation appears in the micro-enterprises and
the least difficult situation — in the medium-sized enterprises.
The biggest difficulty with payment of debts is in SMEs in the spheres of
construction and trade.
Figure 35 Use of financial instruments
Which of the following means for attracting finances did the company use last year? BASE: All respondents. „Yes‖ answers. (Survey among SMEs, 2011)
42%
17%14% 14%
10% 9% 8%5% 4%
1%
Loan f
rom
the c
om
pany
ow
ner/
s
Loan f
rom
fri
ends
/re
lati
ves
Invest
ment
bank c
redit
Bank c
redit
for
work
ing
capit
al
Fin
ancia
l le
asi
ng
Cre
dit
card
Overd
raft
of
dem
and
deposi
t
Bank c
redit
for
specia
l purp
ose
s
Oth
er
inst
rum
ents
Ventu
re c
apit
al
¹ Bulgarian Industrial Association (BIA), 2010 Annual Analysis.
4 Factors for
Development
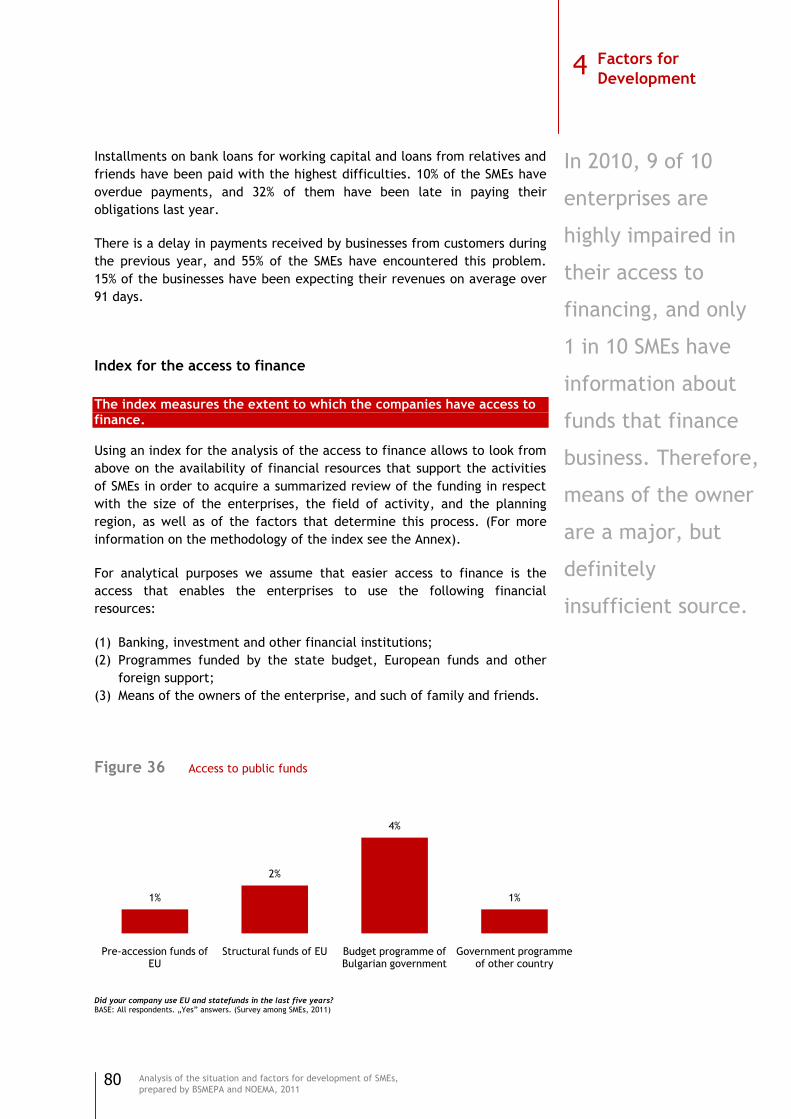
80
Analysis of the situation and factors for development of SMEs,
prepared by BSMEPA and NOEMA, 2011
Installments on bank loans for working capital and loans from relatives and
friends have been paid with the highest difficulties. 10% of the SMEs have
overdue payments, and 32% of them have been late in paying their
obligations last year.
There is a delay in payments received by businesses from customers during
the previous year, and 55% of the SMEs have encountered this problem.
15% of the businesses have been expecting their revenues on average over
91 days.
Index for the access to finance
The index measures the extent to which the companies have access to finance. Using an index for the analysis of the access to finance allows to look from
above on the availability of financial resources that support the activities
of SMEs in order to acquire a summarized review of the funding in respect
with the size of the enterprises, the field of activity, and the planning
region, as well as of the factors that determine this process. (For more
information on the methodology of the index see the Annex).
For analytical purposes we assume that easier access to finance is the
access that enables the enterprises to use the following financial
resources:
(1) Banking, investment and other financial institutions;
(2) Programmes funded by the state budget, European funds and other
foreign support;
(3) Means of the owners of the enterprise, and such of family and friends.
Figure 36 Access to public funds
Did your company use EU and statefunds in the last five years? BASE: All respondents. „Yes‖ answers. (Survey among SMEs, 2011)
1%
2%
4%
1%
Pre-accession funds of EU
Structural funds of EU Budget programme of Bulgarian government
Government programme of other country
In 2010, 9 of 10
enterprises are
highly impaired in
their access to
financing, and only
1 in 10 SMEs have
information about
funds that finance
business. Therefore,
means of the owner
are a major, but
definitely
insufficient source.
4 Factors for
Development
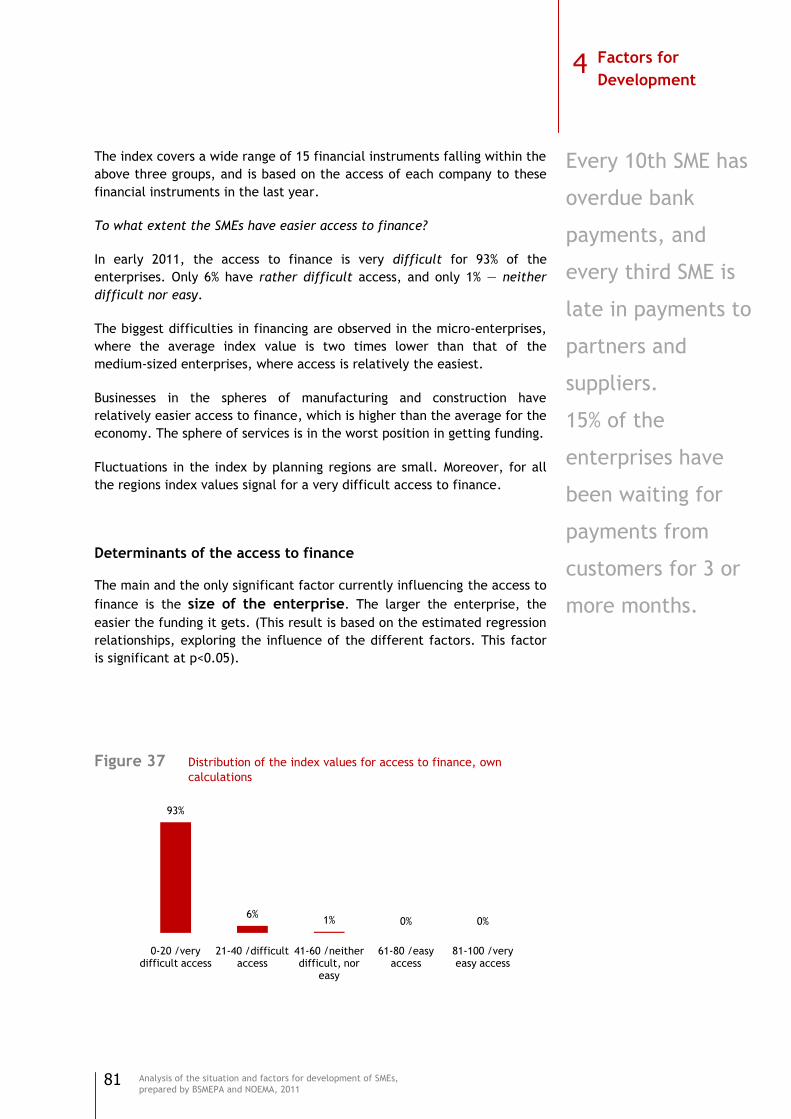
81
Analysis of the situation and factors for development of SMEs,
prepared by BSMEPA and NOEMA, 2011
The index covers a wide range of 15 financial instruments falling within the
above three groups, and is based on the access of each company to these
financial instruments in the last year.
To what extent the SMEs have easier access to finance?
In early 2011, the access to finance is very difficult for 93% of the
enterprises. Only 6% have rather difficult access, and only 1% — neither
difficult nor easy.
The biggest difficulties in financing are observed in the micro-enterprises,
where the average index value is two times lower than that of the
medium-sized enterprises, where access is relatively the easiest.
Businesses in the spheres of manufacturing and construction have
relatively easier access to finance, which is higher than the average for the
economy. The sphere of services is in the worst position in getting funding.
Fluctuations in the index by planning regions are small. Moreover, for all
the regions index values signal for a very difficult access to finance.
Determinants of the access to finance
The main and the only significant factor currently influencing the access to
finance is the size of the enterprise. The larger the enterprise, the
easier the funding it gets. (This result is based on the estimated regression
relationships, exploring the influence of the different factors. This factor
is significant at p<0.05).
Figure 37 Distribution of the index values for access to finance, own
calculations
93%
6%1% 0% 0%
0-20 /very difficult access
21-40 /difficult access
41-60 /neither difficult, nor
easy
61-80 /easy access
81-100 /very easy access
Every 10th SME has
overdue bank
payments, and
every third SME is
late in payments to
partners and
suppliers.
15% of the
enterprises have
been waiting for
payments from
customers for 3 or
more months.
4 Factors for
Development

82
Analysis of the situation and factors for development of SMEs,
prepared by BSMEPA and NOEMA, 2011
Figure 38 Mean values of the index for access to finance by enterprise size
class, own calculations
Figure 39 Mean values of the index for access to finance by enterprise
activity sphere, own calculations
Figure 40 Mean values of the index for access to finance by region, own
calculations
0 — 20 21- 40 41 — 60 61 — 80 81 — 100
Very difficult access Difficult access
Neither difficult, nor easy
access Easy access Very easy access
8
12
17
Average for the economy
Micro Small Medium
11
8
7
10Average for the
economy
Production Trade Services Construction
11
9
7
9
7
9
Average for the country
North Western North Central North Eastern South Eastern South Western South Central
Micro enterprises
and entrepreneurs
in sphere of services
are the most
affected by the lack
of funding.
4 Factors for
Development

83
Analysis of the situation and factors for development of SMEs,
prepared by BSMEPA and NOEMA, 2011
Innovation
„Innovation is the adoption of an idea or behavior, whether a system, policy, program, device, process, product or service, that is new to
the adopting organization” Fariborz Damanpour, Professor of Management at Rutgers University
Role of the innovations
The innovations are various — product, process, organizational, etc., and
can take different forms — from the traditional new products and services
creation to the generating of new business models, new marketing skills,
making important organizational changes, etc.1 many leading economist
have noted the significant role of innovations for the increasing of
competitiveness, profitability, and productivity.2 Today the innovation
becomes a critical resource for achieving a sustainable competitive
advantage.3 To gain the business today requires innovation.4
In general, the implementation of innovations aims at contributing to the
efficiency and better SMEs performance. Innovations contribute to the
higher degree for the economic growth and the welfare.5 The enterprise
level of innovation is one of the key conditions for greater competitiveness
and economic dynamics.6 More and more often the innovations, and not
the efficiency, are viewed as key factors for the enterprises‘ success or
failure.7
Figure 41 Innovation practices in SMEs
BASE: All respondents. „Yes‖ answers. (Survey among SMEs, 2011)
13%
9%
2% 1%
37%
27%
17%
Rela
tionsh
ip w
ith
univ
ers
itie
s
Join
t in
itia
tives
wit
h
educati
on
inst
ituti
ons
Renew
able
energ
y
Nano t
echnolo
gie
s
Inte
rnet
site
Ele
ctr
onic
sig
natu
re
of
managers
Opport
unit
y f
or
online s
ale
s
¹ ЕС, 2004.
² Porter, 1998; Senge and Carstedt, 2001.
³ McEvily et.al., 2004; Shoham and Fieganbaum, 2002.
4 Kanter, 1999.
5 Tidd et.al.q 1997; Porter, 1990; Freeman and Soete, 1997; Hurley et.al., 1998, and other.
6 Porter and Stern, 1999.
7 Hadjimanolis, 1999; Bilton and Cummings, 2010.
4 Factors for
Development
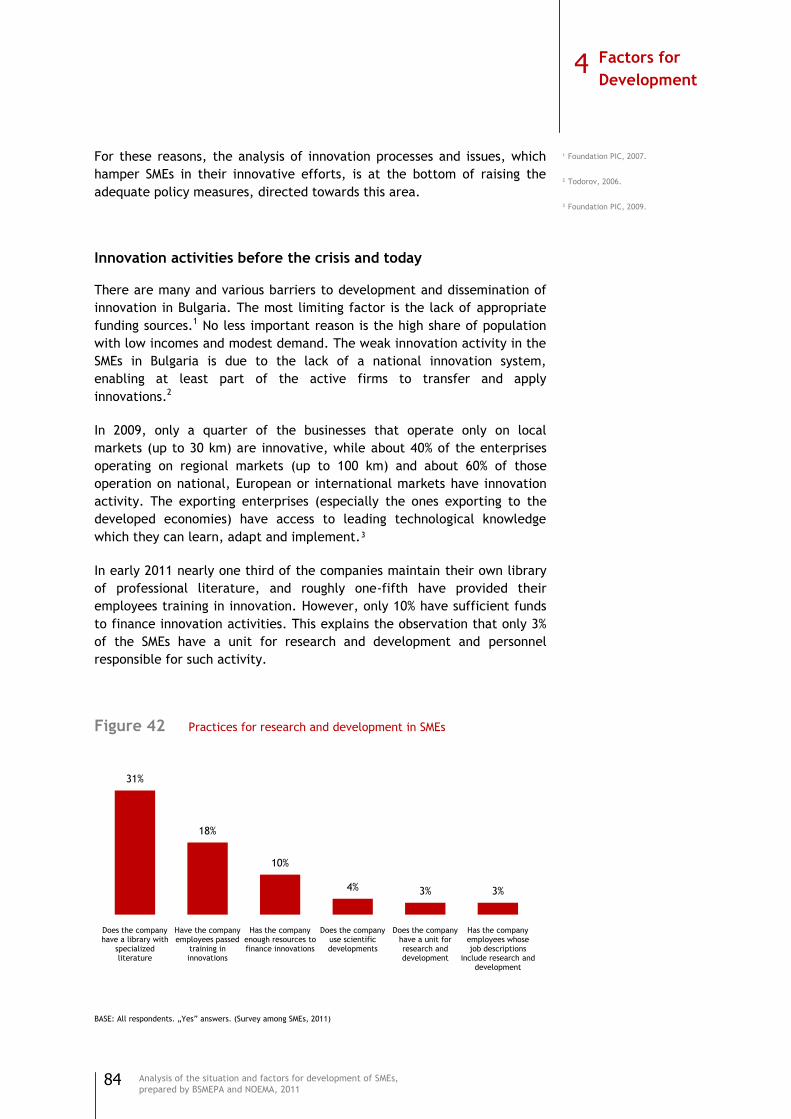
84
Analysis of the situation and factors for development of SMEs,
prepared by BSMEPA and NOEMA, 2011
For these reasons, the analysis of innovation processes and issues, which
hamper SMEs in their innovative efforts, is at the bottom of raising the
adequate policy measures, directed towards this area.
Innovation activities before the crisis and today
There are many and various barriers to development and dissemination of
innovation in Bulgaria. The most limiting factor is the lack of appropriate
funding sources.1 No less important reason is the high share of population
with low incomes and modest demand. The weak innovation activity in the
SMEs in Bulgaria is due to the lack of a national innovation system,
enabling at least part of the active firms to transfer and apply
innovations.2
In 2009, only a quarter of the businesses that operate only on local
markets (up to 30 km) are innovative, while about 40% of the enterprises
operating on regional markets (up to 100 km) and about 60% of those
operation on national, European or international markets have innovation
activity. The exporting enterprises (especially the ones exporting to the
developed economies) have access to leading technological knowledge
which they can learn, adapt and implement.³
In early 2011 nearly one third of the companies maintain their own library
of professional literature, and roughly one-fifth have provided their
employees training in innovation. However, only 10% have sufficient funds
to finance innovation activities. This explains the observation that only 3%
of the SMEs have a unit for research and development and personnel
responsible for such activity.
Figure 42 Practices for research and development in SMEs
BASE: All respondents. „Yes‖ answers. (Survey among SMEs, 2011)
31%
18%
10%
4% 3% 3%
Does the company have a library with
specialized literature
Have the company employees passed
training in innovations
Has the company enough resources to finance innovations
Does the company use scientific developments
Does the company have a unit for research and development
Has the company employees whose job descriptions
include research and development
4 Фактори за развитие
¹ Foundation PIC, 2007.
² Todorov, 2006.
³ Foundation PIC, 2009.
4 Factors for
Development

85
Analysis of the situation and factors for development of SMEs,
prepared by BSMEPA and NOEMA, 2011
The cooperation with scientific institutes, universities and academia is also
limited — 4% of the SMEs have used scientific research in their activities,
and approximately one-tenth of the companies have collaborated with
universities.
The usage of internet is observed in considerably higher share of the
companies, but their proportion seems to be insufficient (less than half of
the SMEs) in the context of the massive influx of World Wide Web in the
everyday life and business. 37% of the firms declare they have a website,
while 17% say they benefit from e-sales.
The distance between micro, small and medium-sized enterprises in using
Internet applications is significant. While over 80% of the medium-sized
enterprises and nearly 60% of the small firms have a website, only 33% of
the micro-enterprises have one. While one of two medium-sized and one of
three small companies has benefited from the opportunity for online sales,
only 15% of the micro-enterprises have done so.
Index for the innovation activity
The index measures the extent to which firms pursue innovation.
The innovation activity is defined as:
Establishment of innovative infrastructure in the enterprise;
Development of new products and launching them on the market.
The index contains the following two equal components:
Presence of innovation infrastructure in the enterprise;
Availability of development for new products.
The index is based on the reported innovation activities of the SMEs during
the previous and the last five years, and is calculated for each company
included in the survey, and then, it is summarized by size of enterprise, by
sphere of activity, and by planning region. (For more information on the
methodology of the index see the Annex).
What is the innovation activity of the SMEs?
In 80% of the SMEs the innovation activity is weak, in 11% of them — rather
weak; 5% have neither weak, nor advanced; 3% — rather advanced; and
only a negligible 1% of the businesses has advanced innovation activity.
The innovation activity in the medium-sized enterprises is over three times
higher, and in the small firms — almost twice higher, than the innovation
activity in the micro-enterprises. The mostly innovative companies are in
the sphere of production, while least innovative are in the field of trade.
1 of 5 SMEs
endeavor to develop
innovation.
1 in 10 companies
has sufficient funds
to finance its
innovation
activities.
Innovation activity
in medium-sized
enterprises is 3
times higher than
that in the micro-
enterprises.
4 Factors for
Development
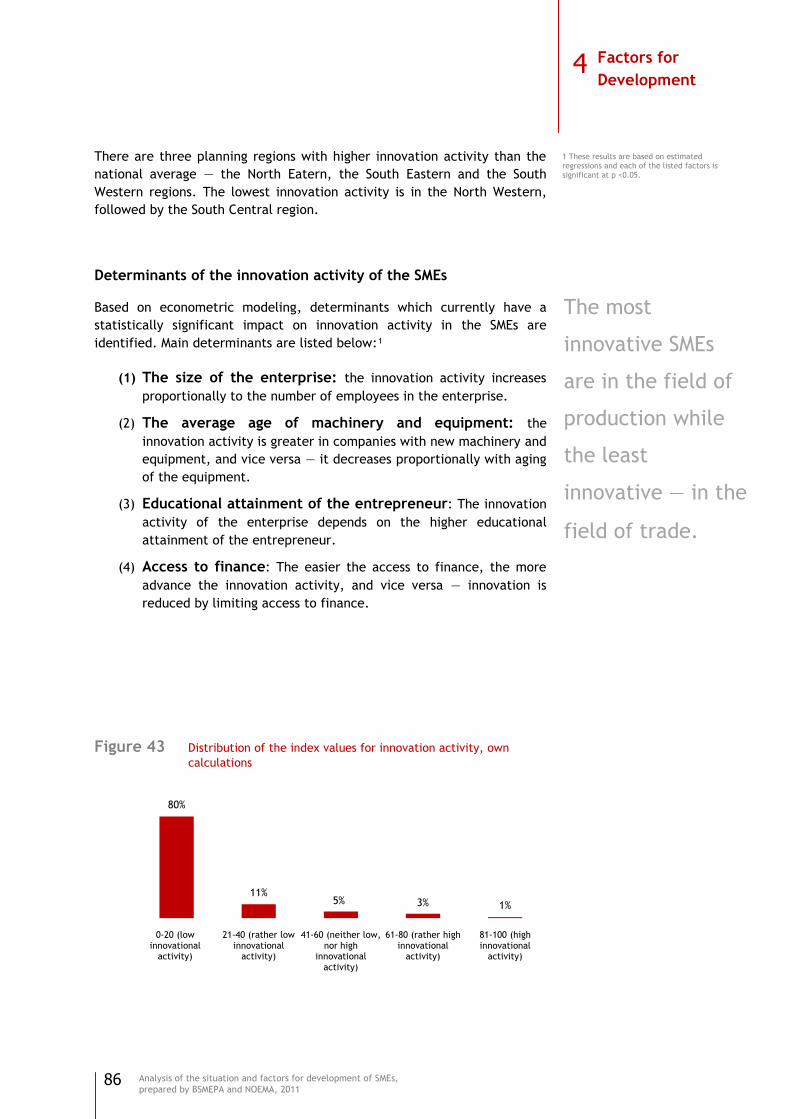
86
Analysis of the situation and factors for development of SMEs,
prepared by BSMEPA and NOEMA, 2011
There are three planning regions with higher innovation activity than the
national average — the North Eatern, the South Eastern and the South
Western regions. The lowest innovation activity is in the North Western,
followed by the South Central region.
Determinants of the innovation activity of the SMEs
Based on econometric modeling, determinants which currently have a
statistically significant impact on innovation activity in the SMEs are
identified. Main determinants are listed below:¹
(1) The size of the enterprise: the innovation activity increases
proportionally to the number of employees in the enterprise.
(2) The average age of machinery and equipment: the
innovation activity is greater in companies with new machinery and
equipment, and vice versa — it decreases proportionally with aging
of the equipment.
(3) Educational attainment of the entrepreneur: The innovation
activity of the enterprise depends on the higher educational
attainment of the entrepreneur.
(4) Access to finance: The easier the access to finance, the more
advance the innovation activity, and vice versa — innovation is
reduced by limiting access to finance.
Figure 43 Distribution of the index values for innovation activity, own
calculations
80%
11%5% 3% 1%
0-20 (low innovational
activity)
21-40 (rather low innovational
activity)
41-60 (neither low, nor high
innovational activity)
61-80 (rather high innovational
activity)
81-100 (high innovational
activity)
The most
innovative SMEs
are in the field of
production while
the least
innovative — in the
field of trade.
1 These results are based on estimated regressions and each of the listed factors is significant at p <0.05.
4 Factors for
Development

87
Analysis of the situation and factors for development of SMEs,
prepared by BSMEPA and NOEMA, 2011
Figure 44 Mean values of the index for innovation activity by enterprise size
class, own calculations
Figure 45 Mean values of the index for innovation activity by enterprise
activity sphere, own calculations
Figure 46 Mean values of the index for innovation activity by region, own
calculations
0 — 20 21- 40 41 — 60 61 — 80 81 — 100
Low innovation activity
Rather low innovation
activity
Neither low, nor high
innovation activity
Rather high innovation
activity High innovation activity
11
21
36
Average for the economy
Micro Small Medium
22
10 1215Average for the
economy
7
14
21
28
Production Trade Services Construction
6
11
20
1513
7
Average for the country
North Western North Central North Eastern South Eastern South Western South Central
4 Factors for
Development
Access to finance
directly affects the
innovation activities
in the SMEs.
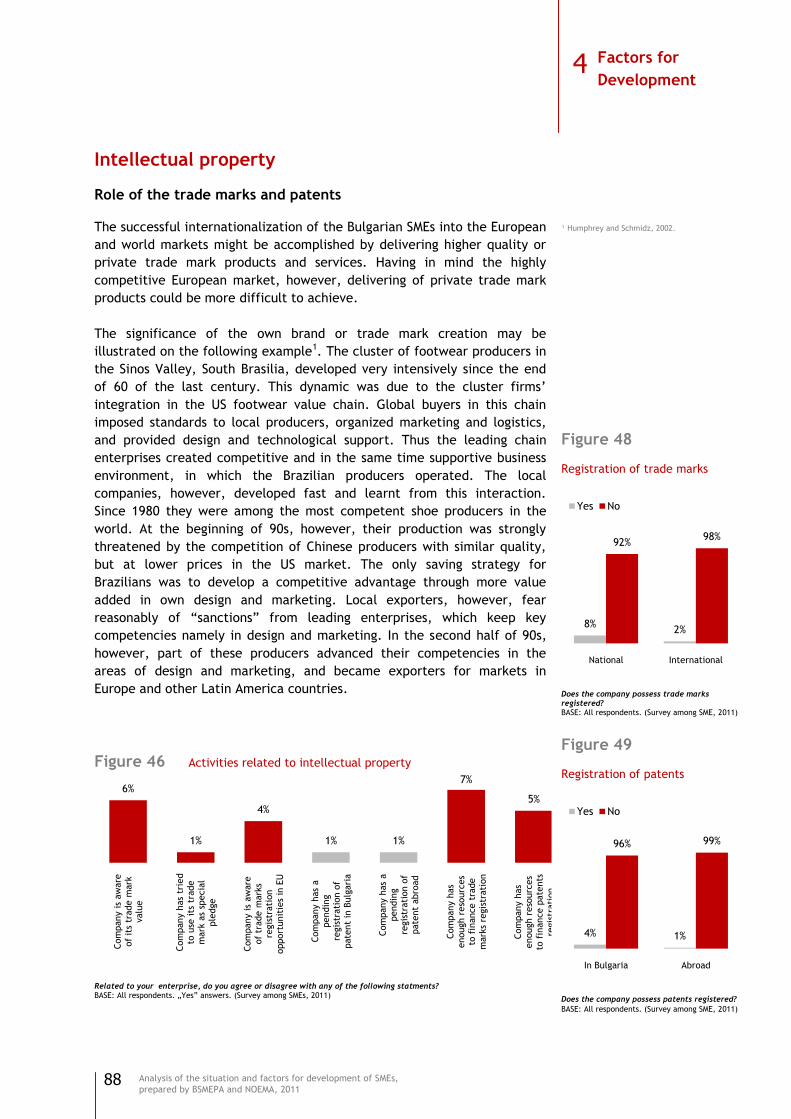
88
Analysis of the situation and factors for development of SMEs,
prepared by BSMEPA and NOEMA, 2011
Intellectual property
Role of the trade marks and patents
The successful internationalization of the Bulgarian SMEs into the European
and world markets might be accomplished by delivering higher quality or
private trade mark products and services. Having in mind the highly
competitive European market, however, delivering of private trade mark
products could be more difficult to achieve.
The significance of the own brand or trade mark creation may be
illustrated on the following example1. The cluster of footwear producers in
the Sinos Valley, South Brasilia, developed very intensively since the end
of 60 of the last century. This dynamic was due to the cluster firms‘
integration in the US footwear value chain. Global buyers in this chain
imposed standards to local producers, organized marketing and logistics,
and provided design and technological support. Thus the leading chain
enterprises created competitive and in the same time supportive business
environment, in which the Brazilian producers operated. The local
companies, however, developed fast and learnt from this interaction.
Since 1980 they were among the most competent shoe producers in the
world. At the beginning of 90s, however, their production was strongly
threatened by the competition of Chinese producers with similar quality,
but at lower prices in the US market. The only saving strategy for
Brazilians was to develop a competitive advantage through more value
added in own design and marketing. Local exporters, however, fear
reasonably of ―sanctions‖ from leading enterprises, which keep key
competencies namely in design and marketing. In the second half of 90s,
however, part of these producers advanced their competencies in the
areas of design and marketing, and became exporters for markets in
Europe and other Latin America countries.
Figure 46 Activities related to intellectual property
Related to your enterprise, do you agree or disagree with any of the following statments? BASE: All respondents. „Yes‖ answers. (Survey among SMEs, 2011)
6%
1%
4%
1% 1%
7%
5%
Com
pany is
aw
are
of
its
trade m
ark
valu
e
Com
pany h
as
trie
d
to u
se i
ts t
rade
mark
as
specia
l ple
dge
Com
pany is
aw
are
of
trade m
ark
s re
gis
trati
on
opport
unit
ies
in E
U
Com
pany h
as
a
pendin
g
regis
trati
on o
f pate
nt
in B
ulg
ari
a
Com
pany h
as
a
pendin
g
regis
trati
on o
f pate
nt
abro
ad
Com
pany h
as
enough r
eso
urc
es
to f
inance t
rade
mark
s re
gis
trati
on
Com
pany h
as
enough r
eso
urc
es
to f
inance p
ate
nts
re
gis
trati
on
¹ Humphrey and Schmidz, 2002.
Figure 48
Registration of trade marks
Does the company possess trade marks registered? BASE: All respondents. (Survey among SME, 2011)
Figure 49
Registration of patents
Does the company possess patents registered?
BASE: All respondents. (Survey among SME, 2011)
8%2%
92%98%
National International
Yes No
4% 1%
96% 99%
In Bulgaria Abroad
Yes No
4 Factors for
Development
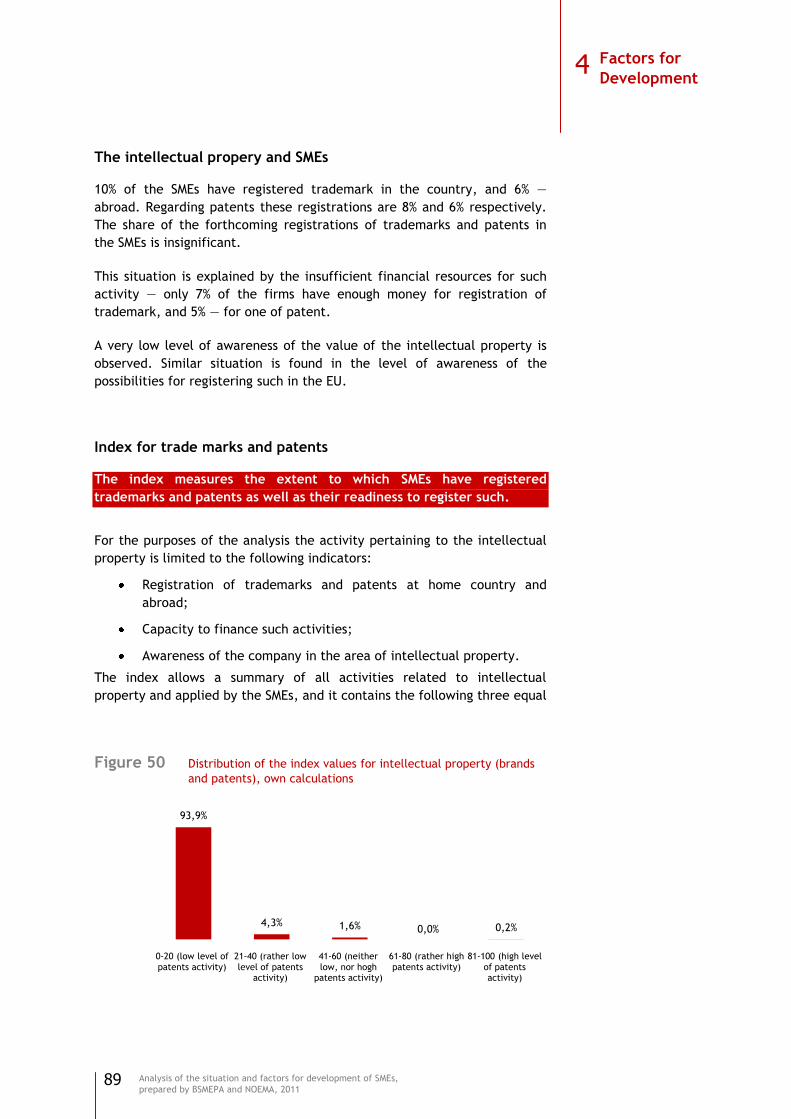
89
Analysis of the situation and factors for development of SMEs,
prepared by BSMEPA and NOEMA, 2011
The intellectual propery and SMEs
10% of the SMEs have registered trademark in the country, and 6% —
abroad. Regarding patents these registrations are 8% and 6% respectively.
The share of the forthcoming registrations of trademarks and patents in
the SMEs is insignificant.
This situation is explained by the insufficient financial resources for such
activity — only 7% of the firms have enough money for registration of
trademark, and 5% — for one of patent.
A very low level of awareness of the value of the intellectual property is
observed. Similar situation is found in the level of awareness of the
possibilities for registering such in the EU.
Index for trade marks and patents
The index measures the extent to which SMEs have registered
trademarks and patents as well as their readiness to register such.
For the purposes of the analysis the activity pertaining to the intellectual
property is limited to the following indicators:
Registration of trademarks and patents at home country and
abroad;
Capacity to finance such activities;
Awareness of the company in the area of intellectual property.
The index allows a summary of all activities related to intellectual
property and applied by the SMEs, and it contains the following three equal
Figure 50 Distribution of the index values for intellectual property (brands
and patents), own calculations
93,9%
4,3% 1,6% 0,0% 0,2%0,0%
10,0%20,0%30,0%40,0%50,0%60,0%70,0%80,0%90,0%
100,0%
0-20 (low level of patents activity)
21-40 (rather low level of patents
activity)
41-60 (neither low, nor hogh
patents activity)
61-80 (rather high patents activity)
81-100 (high level of patents activity)
4 Factors for
Development

90
Analysis of the situation and factors for development of SMEs,
prepared by BSMEPA and NOEMA, 2011
components:
Availability of trademarks and patents at home county and abroad
as well as forthcoming registrations of such;
Availability of sufficient financial resources in the enterprise for
registration of trademark, patent or other intellectual property;
Level of awareness of the entrepreneurs regarding the value and
opportunities of the brand, as well as the registration of such in
the EU.
For more information on the methodology of the index see the Annex.
Overview of the activities related to the intellectual property (patent
activity) in the SMEs and their readiness to have such
Almost all SMEs in the country (94%) have weak patent activity. Very small,
almost insignificant portion of them are relatively more active in this
direction — 4.3% of the firms have rather weak patent activity, and 2% —
neither weak, nor advanced. There are only isolated cases of advanced
patent activity.
The patent activity is most developed among the small enterprises where
it is almost twice higher than that in the micro-enterprises.
The fields of production and trade are most developed in terms of patent
activity.
The South Eastern planning region is a leader in this factor for sustainable
development of the SMEs sector.
Determinants of the patent activity of the SMEs
Based on econometric modeling factors that currently have a statistically
significant impact on patent activity in the enterprises are identified.
The estimated factors of significant importance are as follows:¹
(1) Size of the enterprise: on average the increase in the company
size leads to greater patent activity.
(2) Innovative activity: the patent activity is directly related to the
innovation activity in the enterprises. The more advanced the
innovation activities in the enterprises, the higher the activity
related to intellectual property.
(3) Best practices: On average the increase in application of best
practices leads to an increase in patent activity of enterprises.
1 of 10 SMEs has a
brand in the
country, while 1 of
20 — abroad.
1 These results are based on estimated regressions and each of these factors is significant at level p<0.05.
Фигура 29
Познаване на портала за обществени консултации на Министерски съвет
Познавате ли електронния протал на Министерски съвет за обществени консултации www.strategy.bg? БАЗА: Всички. (Изследване сред МСП, 2011 г.)
4 Factors for
Development
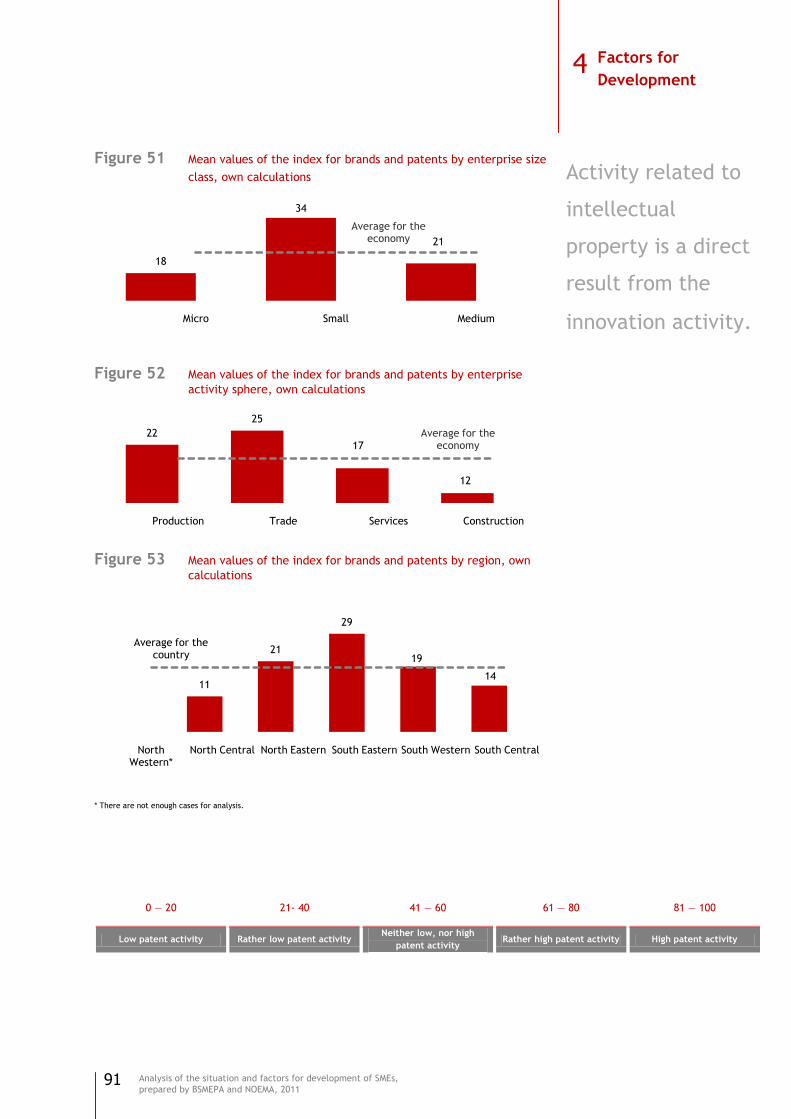
91
Analysis of the situation and factors for development of SMEs,
prepared by BSMEPA and NOEMA, 2011
Figure 51 Mean values of the index for brands and patents by enterprise size
class, own calculations
Figure 52 Mean values of the index for brands and patents by enterprise
activity sphere, own calculations
Figure 53 Mean values of the index for brands and patents by region, own
calculations
* There are not enough cases for analysis.
0 — 20 21- 40 41 — 60 61 — 80 81 — 100
Low patent activity Rather low patent activity Neither low, nor high
patent activity Rather high patent activity High patent activity
18
34
21
Average for the economy
10
15
20
25
30
35
Micro Small Medium
22
25
17
12
Average for the economy
10
15
20
25
Production Trade Services Construction
11
21
29
19
14
Average for the country
North Western*
North Central North Eastern South Eastern South Western South Central
Activity related to
intellectual
property is a direct
result from the
innovation activity.
4 Factors for
Development
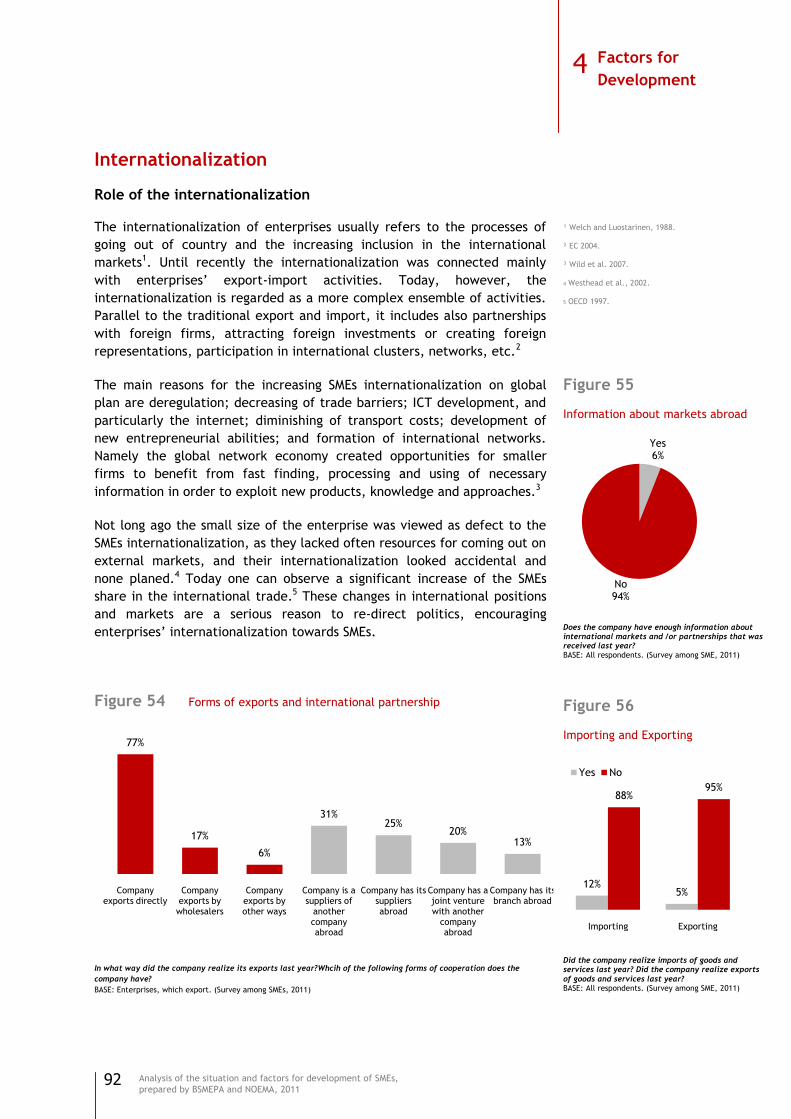
92
Analysis of the situation and factors for development of SMEs,
prepared by BSMEPA and NOEMA, 2011
Internationalization
Role of the internationalization
The internationalization of enterprises usually refers to the processes of
going out of country and the increasing inclusion in the international
markets1. Until recently the internationalization was connected mainly
with enterprises‘ export-import activities. Today, however, the
internationalization is regarded as a more complex ensemble of activities.
Parallel to the traditional export and import, it includes also partnerships
with foreign firms, attracting foreign investments or creating foreign
representations, participation in international clusters, networks, etc.2
The main reasons for the increasing SMEs internationalization on global
plan are deregulation; decreasing of trade barriers; ICT development, and
particularly the internet; diminishing of transport costs; development of
new entrepreneurial abilities; and formation of international networks.
Namely the global network economy created opportunities for smaller
firms to benefit from fast finding, processing and using of necessary
information in order to exploit new products, knowledge and approaches.3
Not long ago the small size of the enterprise was viewed as defect to the
SMEs internationalization, as they lacked often resources for coming out on
external markets, and their internationalization looked accidental and
none planed.4 Today one can observe a significant increase of the SMEs
share in the international trade.5 These changes in international positions
and markets are a serious reason to re-direct politics, encouraging
enterprises‘ internationalization towards SMEs.
Figure 54 Forms of exports and international partnership
In what way did the company realize its exports last year?Whcih of the following forms of cooperation does the
company have?
BASE: Enterprises, which export. (Survey among SMEs, 2011)
77%
17%
6%
31%25%
20%13%
Company exports directly
Company exports by wholesalers
Company exports by other ways
Company is a suppliers of
another company abroad
Company has its suppliers abroad
Company has a joint venture with another
company abroad
Company has its branch abroad
¹ Welch and Luostarinen, 1988. ² ЕС 2004. ³ Wild et al. 2007. 4 Westhead et al., 2002. 5 OECD 1997.
Figure 55
Information about markets abroad
Does the company have enough information about international markets and /or partnerships that was received last year? BASE: All respondents. (Survey among SME, 2011)
Figure 56
Importing and Exporting
Did the company realize imports of goods and services last year? Did the company realize exports
of goods and services last year? BASE: All respondents. (Survey among SME, 2011)
Yes6%
No94%
12%5%
88%95%
Importing Exporting
Yes No
4 Factors for
Development
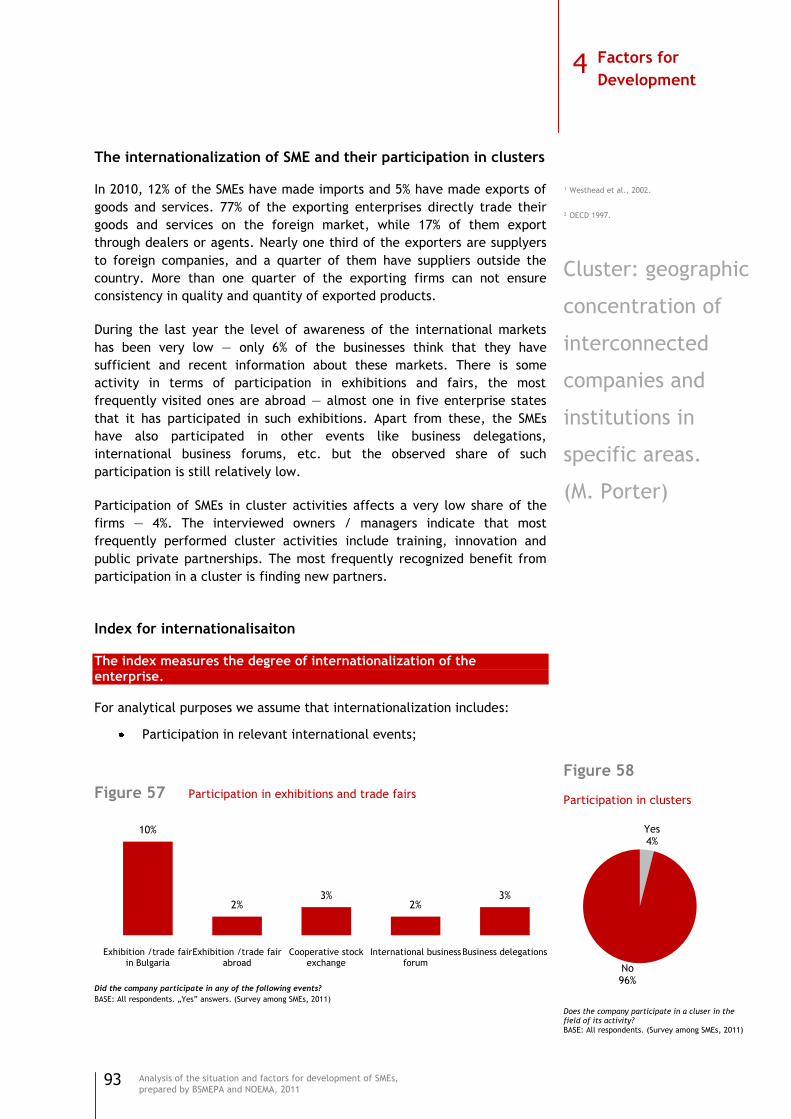
93
Analysis of the situation and factors for development of SMEs,
prepared by BSMEPA and NOEMA, 2011
The internationalization of SME and their participation in clusters
In 2010, 12% of the SMEs have made imports and 5% have made exports of
goods and services. 77% of the exporting enterprises directly trade their
goods and services on the foreign market, while 17% of them export
through dealers or agents. Nearly one third of the exporters are supplyers
to foreign companies, and a quarter of them have suppliers outside the
country. More than one quarter of the exporting firms can not ensure
consistency in quality and quantity of exported products.
During the last year the level of awareness of the international markets
has been very low — only 6% of the businesses think that they have
sufficient and recent information about these markets. There is some
activity in terms of participation in exhibitions and fairs, the most
frequently visited ones are abroad — almost one in five enterprise states
that it has participated in such exhibitions. Apart from these, the SMEs
have also participated in other events like business delegations,
international business forums, etc. but the observed share of such
participation is still relatively low.
Participation of SMEs in cluster activities affects a very low share of the
firms — 4%. The interviewed owners / managers indicate that most
frequently performed cluster activities include training, innovation and
public private partnerships. The most frequently recognized benefit from
participation in a cluster is finding new partners.
Index for internationalisaiton
The index measures the degree of internationalization of the enterprise.
For analytical purposes we assume that internationalization includes:
Participation in relevant international events;
Figure 57 Participation in exhibitions and trade fairs
Did the company participate in any of the following events?
BASE: All respondents. „Yes‖ answers. (Survey among SMEs, 2011)
10%
2%3%
2%3%
Exhibition /trade fair in Bulgaria
Exhibition /trade fair abroad
Cooperative stock exchange
International business forum
Business delegations
¹ Westhead et al., 2002.
² OECD 1997.
Cluster: geographic
concentration of
interconnected
companies and
institutions in
specific areas.
(M. Porter)
Figure 58
Participation in clusters
Does the company participate in a cluser in the field of its activity?
BASE: All respondents. (Survey among SMEs, 2011)
Yes4%
No96%
4 Factors for
Development
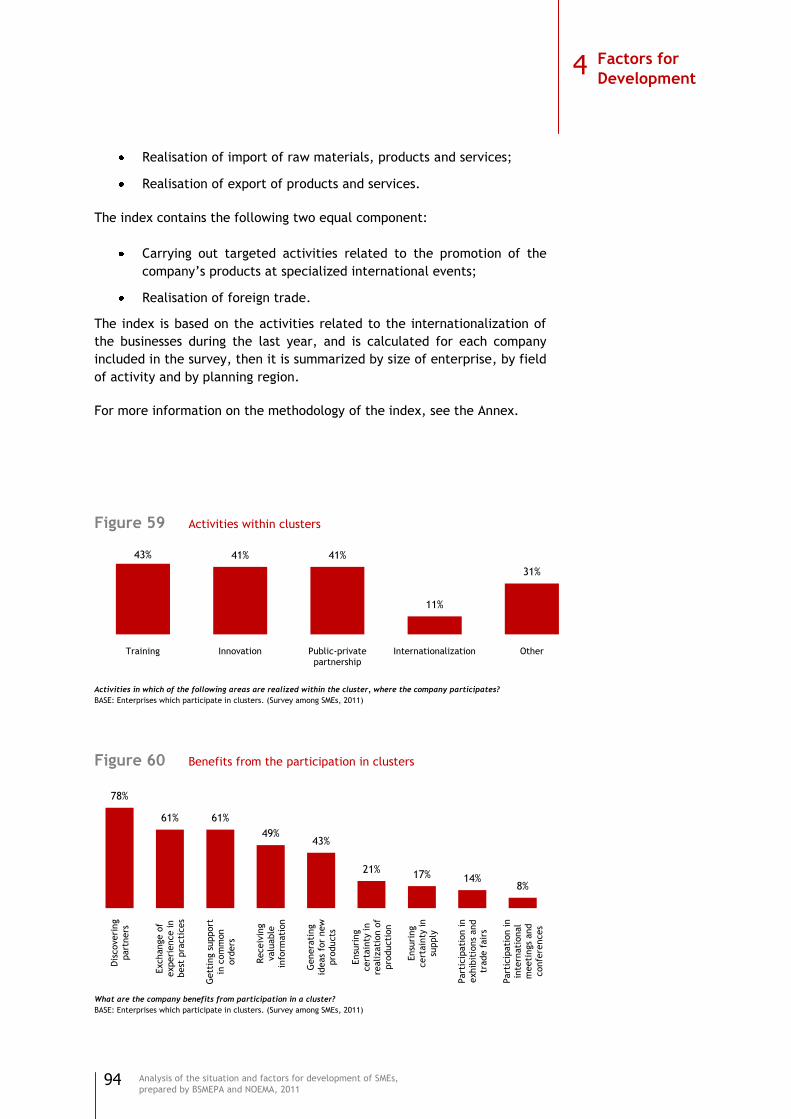
94
Analysis of the situation and factors for development of SMEs,
prepared by BSMEPA and NOEMA, 2011
Realisation of import of raw materials, products and services;
Realisation of export of products and services.
The index contains the following two equal component:
Carrying out targeted activities related to the promotion of the
company‘s products at specialized international events;
Realisation of foreign trade.
The index is based on the activities related to the internationalization of
the businesses during the last year, and is calculated for each company
included in the survey, then it is summarized by size of enterprise, by field
of activity and by planning region.
For more information on the methodology of the index, see the Annex.
Figure 59 Activities within clusters
Activities in which of the following areas are realized within the cluster, where the company participates?
BASE: Enterprises which participate in clusters. (Survey among SMEs, 2011)
Figure 60 Benefits from the participation in clusters
What are the company benefits from participation in a cluster?
BASE: Enterprises which participate in clusters. (Survey among SMEs, 2011)
43% 41% 41%
11%
31%
Training Innovation Public-private partnership
Internationalization Other
78%
61% 61%
49%43%
21%17% 14%
8%
Dis
coveri
ng
part
ners
Exchange o
f experi
ence in
best
pra
cti
ces
Gett
ing s
upport
in
com
mon
ord
ers
Receiv
ing
valu
able
in
form
ati
on
Genera
ting
ideas
for
new
pro
ducts
Ensu
ring
cert
ain
ty in
realizati
on o
f pro
ducti
on
Ensu
ring
cert
ain
ty in
supply
Part
icip
ati
on in
exhib
itio
ns
and
trade f
air
s
Part
icip
ati
on in
inte
rnati
onal
meeti
ngs
and
confe
rences
4 Factors for
Development
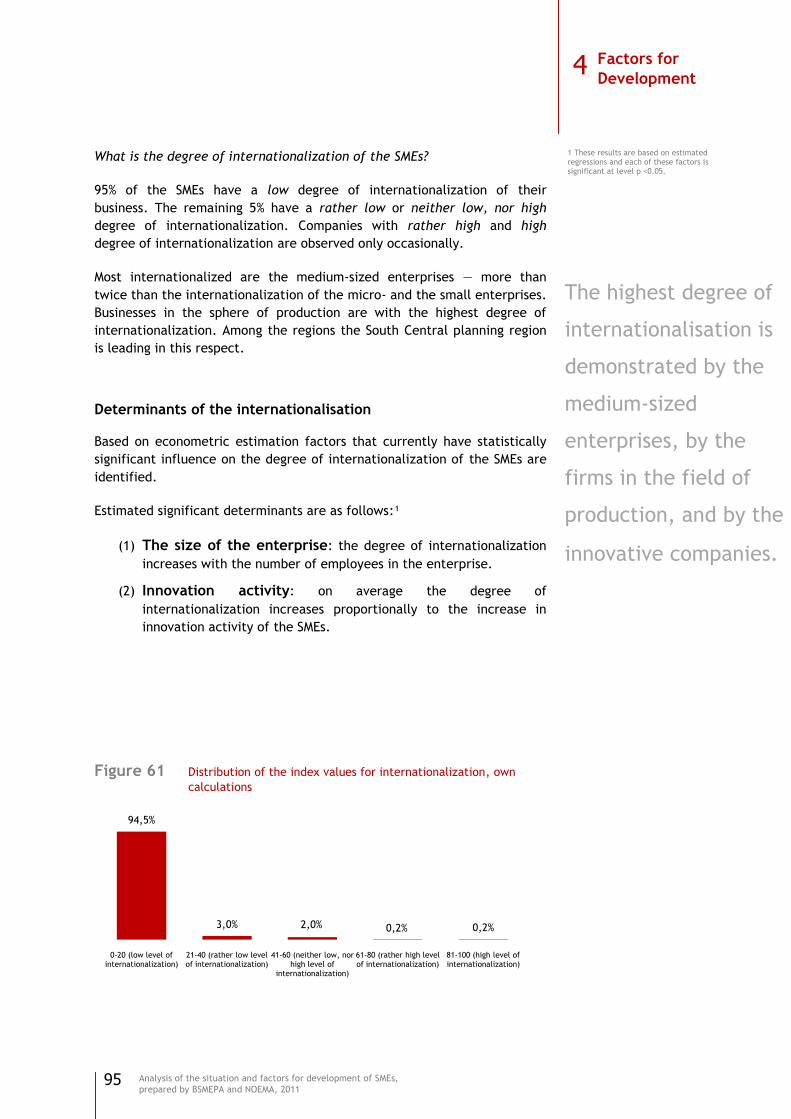
95
Analysis of the situation and factors for development of SMEs,
prepared by BSMEPA and NOEMA, 2011
What is the degree of internationalization of the SMEs?
95% of the SMEs have a low degree of internationalization of their
business. The remaining 5% have a rather low or neither low, nor high
degree of internationalization. Companies with rather high and high
degree of internationalization are observed only occasionally.
Most internationalized are the medium-sized enterprises — more than
twice than the internationalization of the micro- and the small enterprises.
Businesses in the sphere of production are with the highest degree of
internationalization. Among the regions the South Central planning region
is leading in this respect.
Determinants of the internationalisation
Based on econometric estimation factors that currently have statistically
significant influence on the degree of internationalization of the SMEs are
identified.
Estimated significant determinants are as follows:¹
(1) The size of the enterprise: the degree of internationalization
increases with the number of employees in the enterprise.
(2) Innovation activity: on average the degree of
internationalization increases proportionally to the increase in
innovation activity of the SMEs.
Figure 61 Distribution of the index values for internationalization, own
calculations
94,5%
3,0% 2,0% 0,2% 0,2%
0-20 (low level of internationalization)
21-40 (rather low level of internationalization)
41-60 (neither low, nor high level of
internationalization)
61-80 (rather high level of internationalization)
81-100 (high level of internationalization)
The highest degree of
internationalisation is
demonstrated by the
medium-sized
enterprises, by the
firms in the field of
production, and by the
innovative companies.
1 These results are based on estimated regressions and each of these factors is significant at level p <0.05.
Фигура 29
Познаване на портала за обществени консултации на Министерски съвет
Познавате ли електронния протал на Министерски съвет за обществени консултации www.strategy.bg? БАЗА: Всички. (Изследване сред МСП, 2011 г.)
4 Factors for
Development
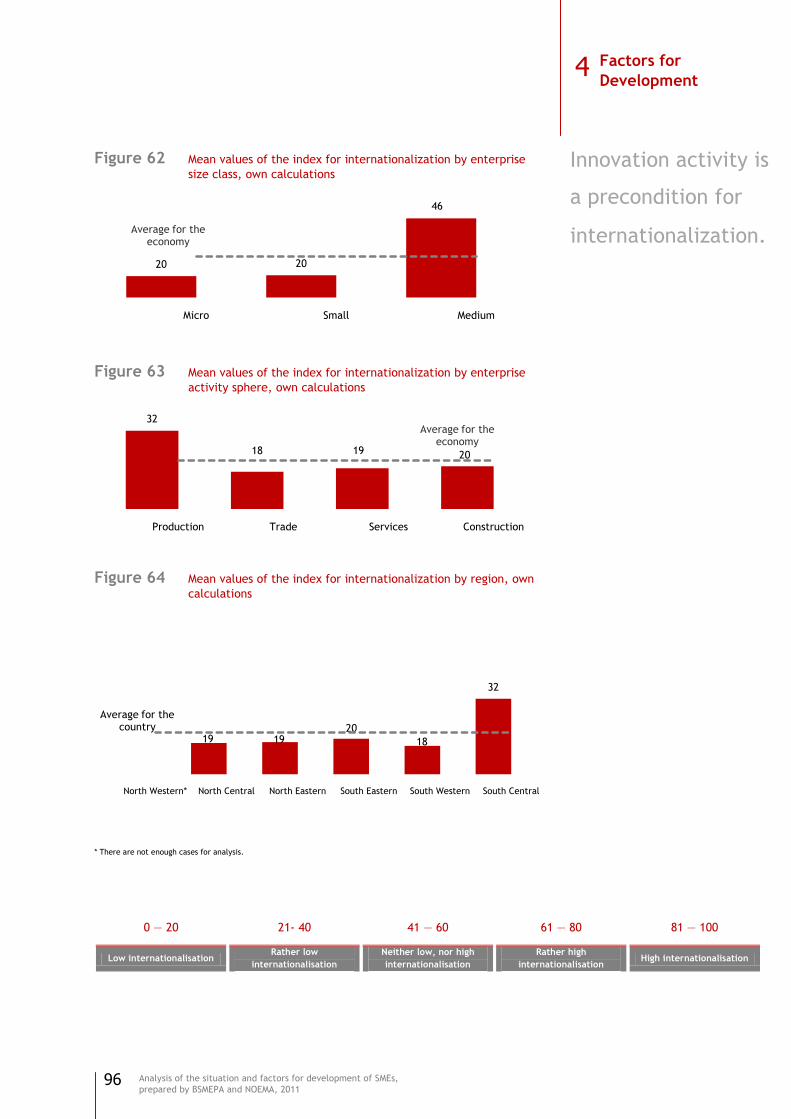
96
Analysis of the situation and factors for development of SMEs,
prepared by BSMEPA and NOEMA, 2011
Figure 62 Mean values of the index for internationalization by enterprise
size class, own calculations
Figure 63 Mean values of the index for internationalization by enterprise
activity sphere, own calculations
Figure 64 Mean values of the index for internationalization by region, own
calculations
* There are not enough cases for analysis.
0 — 20 21- 40 41 — 60 61 — 80 81 — 100
Low internationalisation Rather low
internationalisation
Neither low, nor high
internationalisation
Rather high
internationalisation High internationalisation
20 20
46
Average for the economy
101520253035404550
Micro Small Medium
32
18 19 20
Average for the economy
5
10
15
20
25
30
35
Production Trade Services Construction
19 1920
18
32
Average for the country
North Western* North Central North Eastern South Eastern South Western South Central
4 Factors for
Development
Innovation activity is
a precondition for
internationalization.

97
Analysis of the situation and factors for development of SMEs,
prepared by BSMEPA and NOEMA, 2011
Best practices
Role of the best practices
In general, ―good practices‖ include consecutive steps of predictable and
manageable activities — from the idea acceptance to its implementation.1
Very often good practices are generic, e.g. commonly applicable, which
makes such practices easily transferable from large to small enterprises.2
Because of this generic nature, in this analysis were identified practices,
which seemed to be easily transferable form large and medium size
enterprises to small and micro ones.
In the context of a relief access to the IT products and services, and the
global tendency towards their prices dropping, the SMEs have already the
opportunity to profit of good practices in this area. The application of
internet technologies facilitates the enterprises‘ access to information,
their communication with business partners, and gives the opportunity to
realize sales with low transaction costs. The use of information
management systems improves significantly the organizational processes,
decrease internal to firm transaction costs, and gives accurate and timely
information for making decisions.
Very important for the short and long term enterprise development is the
strategy for the HR development. The significance of the HR activities
comes from the new global market requirements, related to the fast
changing competencies and abilities. It is difficult to find on markets
enough number of employees with new knowledge and abilities. That is
why enterprises should engage more actively with the increasing of their
personnel qualification and suitability to new work devices and processes.
The elaboration and the application of market strategies in the
circumstances of highly competitive European and world markets are
crucial for the enterprises‘ success. Due to the increase market pressure
and information access, the activities like planning, marketing researching,
increasing the market shares, etc., which were inherent to large
enterprises; move more and more in the functioning of SMEs, too.
Figure 65 Use of management information systems
Has the company introduced the following management information systems?
BASE: All respondents. „Yes‖ answers. (Survey among SMEs, 2011)
6%
4%3%
5%
Management of relations with clients
Management of relations with suppliers
Integrated system for management of internal
processes
Other kind of management system
¹ Isaksen and Tidd, 2006; Dobbs and Hamilton, 2007.
² Edwards, 2000; Tidd, 2001.
Figure 66
Information about best practices
Does the company have enough information
about good practices (related to management, production processes, marketing and other) that was received last year? BASE: All respondents. (Survey among SME, 2011)
Yes12%
No88%
4 Factors for
Development
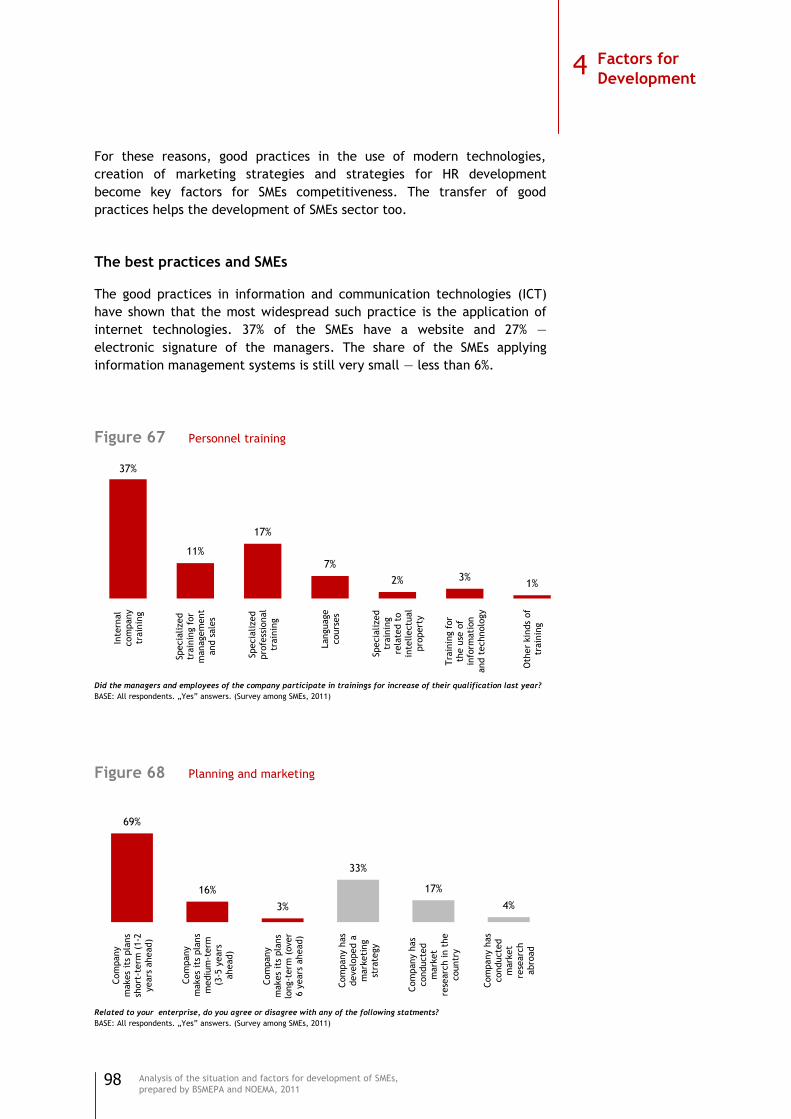
98
Analysis of the situation and factors for development of SMEs,
prepared by BSMEPA and NOEMA, 2011
For these reasons, good practices in the use of modern technologies,
creation of marketing strategies and strategies for HR development
become key factors for SMEs competitiveness. The transfer of good
practices helps the development of SMEs sector too.
The best practices and SMEs
The good practices in information and communication technologies (ICT)
have shown that the most widespread such practice is the application of
internet technologies. 37% of the SMEs have a website and 27% —
electronic signature of the managers. The share of the SMEs applying
information management systems is still very small — less than 6%.
Figure 67 Personnel training
Did the managers and employees of the company participate in trainings for increase of their qualification last year?
BASE: All respondents. „Yes‖ answers. (Survey among SMEs, 2011)
Figure 68 Planning and marketing
Related to your enterprise, do you agree or disagree with any of the following statments?
BASE: All respondents. „Yes‖ answers. (Survey among SMEs, 2011)
37%
11%
17%
7%
2% 3%1%
Inte
rnal
com
pany
train
ing
Specia
lized
train
ing f
or
managem
ent
and s
ale
s
Specia
lized
pro
fess
ional
train
ing
Language
cours
es
Specia
lized
train
ing
rela
ted t
o
inte
llectu
al
pro
pert
y
Tra
inin
g f
or
the u
se o
f in
form
ati
on
and t
echnolo
gy
Oth
er
kin
ds
of
train
ing
69%
16%
3%
33%
17%
4%
Com
pany
makes
its
pla
ns
short
-term
(1-2
years
ahead)
Com
pany
makes
its
pla
ns
mediu
m-t
erm
(3
-5 y
ears
ahead)
Com
pany
makes
its
pla
ns
long-t
erm
(over
6 y
ears
ahead)
Com
pany h
as
develo
ped a
m
ark
eti
ng
stra
tegy
Com
pany h
as
conducte
d
mark
et
rese
arc
h in t
he
countr
y
Com
pany h
as
conducte
d
mark
et
rese
arc
h
abro
ad
4 Factors for
Development

99
Analysis of the situation and factors for development of SMEs,
prepared by BSMEPA and NOEMA, 2011
The training of the personnel as a best practice yet is not a part of the
everyday life of most SMEs, but is relatively more widely applied. 37% of
the companies organize internal trainings and 17% — external training
specialised in the business area of the firm.
In the last year 14% of the SMEs have expanded their product portfolio, and
almost as many (13%) have expanded their domestic market. Only 3% of
the companies have been able to expand their external markets.
Index for best practices
The index measures the degree of application of good practices in the
SMEs.
For the purposes of the analysis the best practices are limited to those
that describe the internal organization of business activities and include:
Usage of modern ICT in the business activity;
Implementation of a strategy for human resources development;
Development and implementation of marketing strategies.
The index allows for a summary of all practices applied by the SMEs and
contains the following three equal components:
Level of ICT usage (as a function of: (1) implementation of
management information systems and (2) application of Internet
technologies);
Level of implementation of strategy for human resource
development in the enterprise (as a function of: (1) assessment of
staff qualifications and (2) availability of trainings enhancing staff
competences in the last year;
Level of implementation of market strategies (as a function of: (1)
the presence of short, medium and long term business plans and
(2) development and implementation of marketing strategies on
domestic and foreign markets).
For more information on the methodology of the index see the Annex.
Dissemination of best practices among the SMEs
There is a certain uptake of best practices in the SMEs‘ activities — 45% of
the firms apply such at low or rather low level, while one in ten companies
applies best practices to a more considerable extent. However, still no
SMEs apply best practices in high degree.
The application of best practices in the medium-sized enterprises is twice
higher than that in the micro-enterprises. There is a clear tendency
Every 10th
company seeks
implementation of
more and more
best practices.
The most
frequently
observed best
practices are
among the SMEs in
the sphere of
production.
Women
entrepreneurs are
more likely to
apply best
practices than
men.
4 Factors for
Development
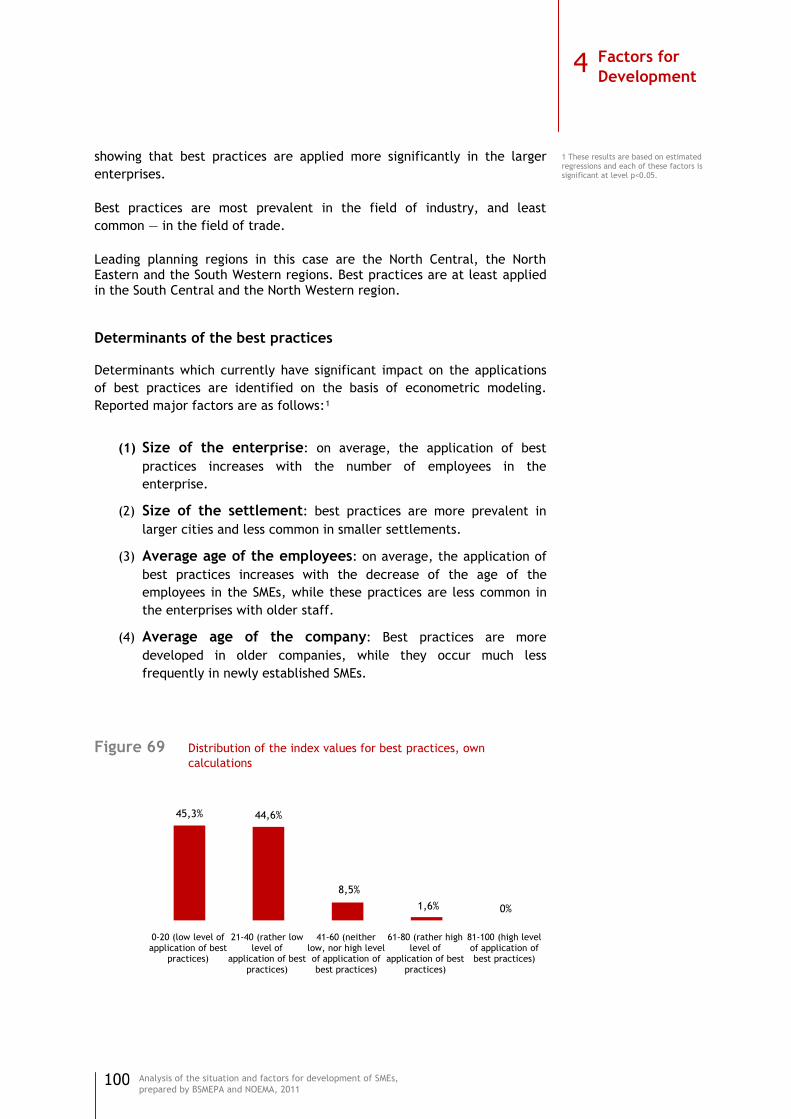
100
Analysis of the situation and factors for development of SMEs,
prepared by BSMEPA and NOEMA, 2011
showing that best practices are applied more significantly in the larger
enterprises.
Best practices are most prevalent in the field of industry, and least
common — in the field of trade.
Leading planning regions in this case are the North Central, the North Eastern and the South Western regions. Best practices are at least applied in the South Central and the North Western region.
Determinants of the best practices
Determinants which currently have significant impact on the applications
of best practices are identified on the basis of econometric modeling.
Reported major factors are as follows:¹
(1) Size of the enterprise: on average, the application of best
practices increases with the number of employees in the
enterprise.
(2) Size of the settlement: best practices are more prevalent in
larger cities and less common in smaller settlements.
(3) Average age of the employees: on average, the application of
best practices increases with the decrease of the age of the
employees in the SMEs, while these practices are less common in
the enterprises with older staff.
(4) Average age of the company: Best practices are more
developed in older companies, while they occur much less
frequently in newly established SMEs.
Figure 69 Distribution of the index values for best practices, own
calculations
45,3% 44,6%
8,5%
1,6% 0%0,0%5,0%
10,0%15,0%20,0%25,0%30,0%35,0%40,0%45,0%50,0%
0-20 (low level of application of best
practices)
21-40 (rather low level of
application of best practices)
41-60 (neither low, nor high level of application of best practices)
61-80 (rather high level of
application of best practices)
81-100 (high level of application of best practices)
1 These results are based on estimated regressions and each of these factors is significant at level p<0.05.
Фигура 29
Познаване на портала за обществени консултации на Министерски съвет
Познавате ли електронния протал на Министерски съвет за обществени консултации www.strategy.bg? БАЗА: Всички. (Изследване сред МСП, 2011 г.)
4 Factors for
Development
101
Analysis of the situation and factors for development of SMEs,
prepared by BSMEPA and NOEMA, 2011
(5) Age of the entrepreneur: The application of best practices
increases with the age of the entrepreneurs, while the younger
entrepreneurs use them to a lesser extent.
(6) Gender of the entrepreneur: Women entrepreneurs apply best
practices to a greater extent than men.
(7) Educational attainment of the entrepreneur: The
implementation of best practices depends on the higher
educational attainment of the entrepreneur.
(8) Innovation activity: The implementation of best practices is
directly related to the innovation activity of the enterprises. ON
average, the increase of innovation leads to greater
implementation of best practices.
The medium-sized
firms have twice as
many best practices
than the micro-
enterprises.
Best practices are
more commonly
found among
businesses in bigger
cities.
4 Factors for
Development
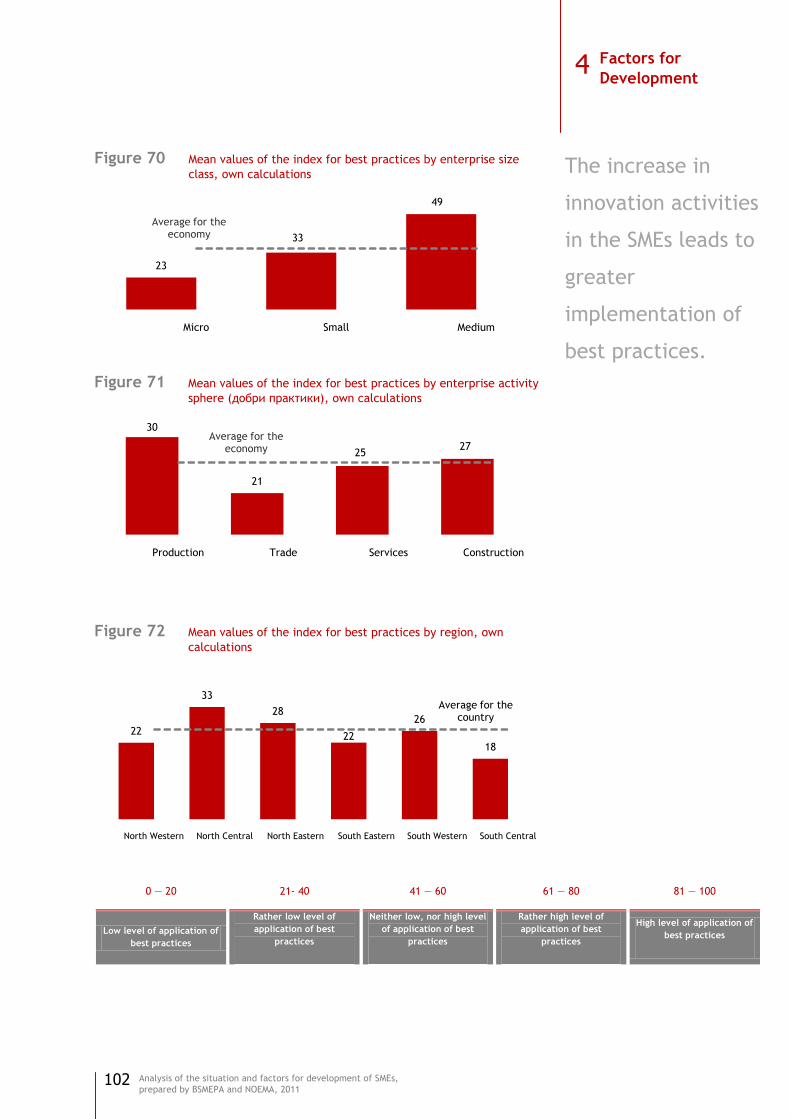
102
Analysis of the situation and factors for development of SMEs,
prepared by BSMEPA and NOEMA, 2011
Figure 70 Mean values of the index for best practices by enterprise size
class, own calculations
Figure 71 Mean values of the index for best practices by enterprise activity
sphere (добри практики), own calculations
Figure 72 Mean values of the index for best practices by region, own
calculations
0 — 20 21- 40 41 — 60 61 — 80 81 — 100
Low level of application of
best practices
Rather low level of
application of best
practices
Neither low, nor high level
of application of best
practices
Rather high level of
application of best
practices
High level of application of
best practices
23
33
49
Average for the economy
10152025303540455055
Micro Small Medium
30
21
2527
Average for the economy
15
20
25
30
Production Trade Services Construction
22
33
28
22
26
18
Average for the country
North Western North Central North Eastern South Eastern South Western South Central
4 Factors for
Development
The increase in
innovation activities
in the SMEs leads to
greater
implementation of
best practices.

103
Analysis of the situation and factors for development of SMEs,
prepared by BSMEPA and NOEMA, 2011
Factors for sustainable development and competitiveness
Stages in competitive development
According Michael Porter, there are four stages in countries, competitive
development, which are lead respectively by production factors,
investments, and innovations.1 The first stage includes advantages, based
on basic production factors like natural resources, favourable climate
conditions for given countries, low cost and numerous work force, and
others. On this stage the technology is delivered to a great degree form
other countries, and not created. The second stage is grounded on the
enterprises capacity (and sometime of the State) to invest massively in the
large scale capacities, which are equipped with the best existed on the
world market technology. The national industry not only absorbs, but
improves the foreign technology too. The third stage is called leading by
innovations because the enterprises not only acquire and improve foreign
technologies and methods, but create new ones. The competitiveness of
these enterprises on the international markets is in more differentiated
products and industrial segments. This stage marks the beginning of
significant foreign investments. The last fourth stage, which is lead by
wealth, practically leads to the economic decline. The movement form one
to other stage is not linear; it can be done by coming back and zigzag
motions.
The competitive advantages grow from each activity of the value chain —
form the product elaboration to services after sale. These advantages,
however, differ in the degree of their sustainability.
Cost price of the main factors, company procedures, which do not involve own
technology and one time design concepts, are advantages that can be easily
imitated. More enduring advantages of a higher order are such things as imposed
brands, which are resulting from many years of marketing effort or own
technology of the process
M. Porter
Competitiveness and sustainability of SMEs in the times of crisis
For the purpose of this research the competitiveness of enterprises was
regarded as their potential for achieving greater productivity, based on the
creative approach to human, capital, and physical resources. The
competitiveness finds its expression in economic growth, successful export
on international markets, managing the competitive pressure in more and
more globalized economic environment, and today — managing the effects
of the economic crisis.
The condition of the SME sector and its sustainability during the crisis are
studied through the prism of five basic factors for sustainable development
and competitiveness — internationalization, access to financing, innovative
activity, implementation of good practices and activity with respect to
intellectual property. A high degree of interrelatedness is observed1 among
¹ Портър, 2004. Конкурентното предимство на нациите. София, изд. „Класика и стил‖.
4 Factors for
Development
104
Analysis of the situation and factors for development of SMEs,
prepared by BSMEPA and NOEMA, 2011
the studied factors of competitiveness — the improvement of one of those
factors in a given enterprise leads to the improvement of another factor,
and consequently to all remaining factors.
For each of the factors an index summarizing the different and various
activities of the enterprises in a given direction is constructed. The indices
measuring the factors of sustainable development and competitiveness do
not exhaust all possible factors and are not meant to. They do not include
for example the standardization which is related to the implementation of
good practices, internalization, innovative activity and
internationalization. This factor is included in the study but it is too
specific depending on the size, industry and type of production of the
enterprise. Moreover, standardization is encountered in a relatively low
share of enterprises. Therefore, the implementation of standards is
included as a separate additional element in the analysis of
competitiveness and sustainability of the enterprises in the times of the
current crisis.
In general it can be concluded that the crisis has affected all SMEs
irrespective of whether they work for the domestic or the external markets
and irrespective of whether they develop separate factors of
competitiveness or not. Nevertheless, a more sustainable development is
observed for those enterprises which develop their factors for
competitiveness.
The access to financing has affected directly SME employment. The
enterprises with better access to financing have laid off less personnel
or haven‘t laid off personnel at all — the SMEs from all areas of activity
with a higher average index of access to financing have no layoffs in
2010. Vice versa, the studied enterprises from all economic activities
with a lower index of access to financing have made layoffs in 2010.
The limited access to financing has also affected the difficulty related
to loan repayment; a negative influence came also from high interest
levels. The financing studied here includes both the access to various
financial instruments and the participation in governmental, European
or other programs for SME support. Therefore, the measures aimed at
limiting the negative effects of the crisis on employment should also
include ones that improve the access to financing. In this respect the
better absorption of EU structural funds would affect positively
employment and would reduce unemployment. One of the ways to do
that is the creation of conditions for a more efficient absorption of
European structural funds. These conditions relate both to the better
awareness of entrepreneurs and to the improvement of their skills to
draft and implement projects. Additional efforts are also necessary for
the relative simplification of the application requirements and the
improvement of the cooperation between the interested entrepreneurs
and the government agencies responsible for the projects. Although
indirect, these measures would affect positively employment and
would reduce unemployment.
¹ Statistically significant correlations and regressions.
4 Factors for
Development
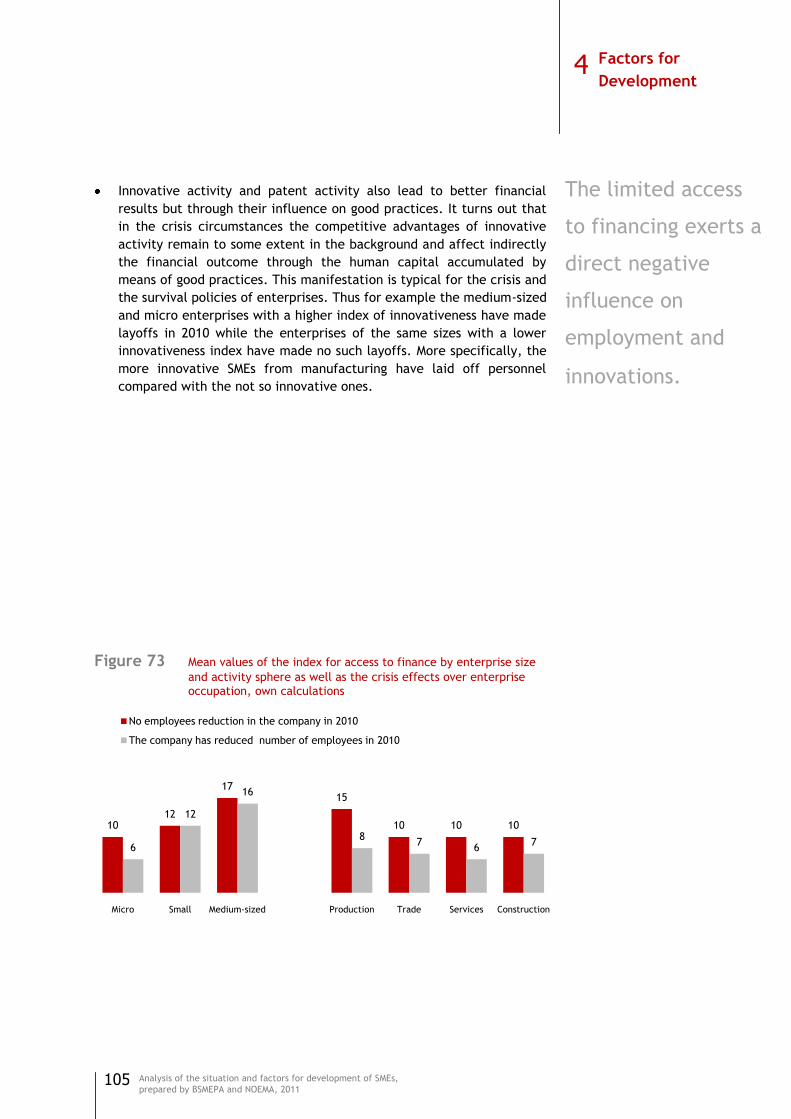
105
Analysis of the situation and factors for development of SMEs,
prepared by BSMEPA and NOEMA, 2011
Innovative activity and patent activity also lead to better financial
results but through their influence on good practices. It turns out that
in the crisis circumstances the competitive advantages of innovative
activity remain to some extent in the background and affect indirectly
the financial outcome through the human capital accumulated by
means of good practices. This manifestation is typical for the crisis and
the survival policies of enterprises. Thus for example the medium-sized
and micro enterprises with a higher index of innovativeness have made
layoffs in 2010 while the enterprises of the same sizes with a lower
innovativeness index have made no such layoffs. More specifically, the
more innovative SMEs from manufacturing have laid off personnel
compared with the not so innovative ones.
Figure 73 Mean values of the index for access to finance by enterprise size
and activity sphere as well as the crisis effects over enterprise occupation, own calculations
1012
1715
10 10 10
6
12
16
87
67
Micro Small Medium-sized Production Trade Services Construction
No employees reduction in the company in 2010
The company has reduced number of employees in 2010
The limited access
to financing exerts a
direct negative
influence on
employment and
innovations.
4 Фактори за развитие
4 Factors for
Development
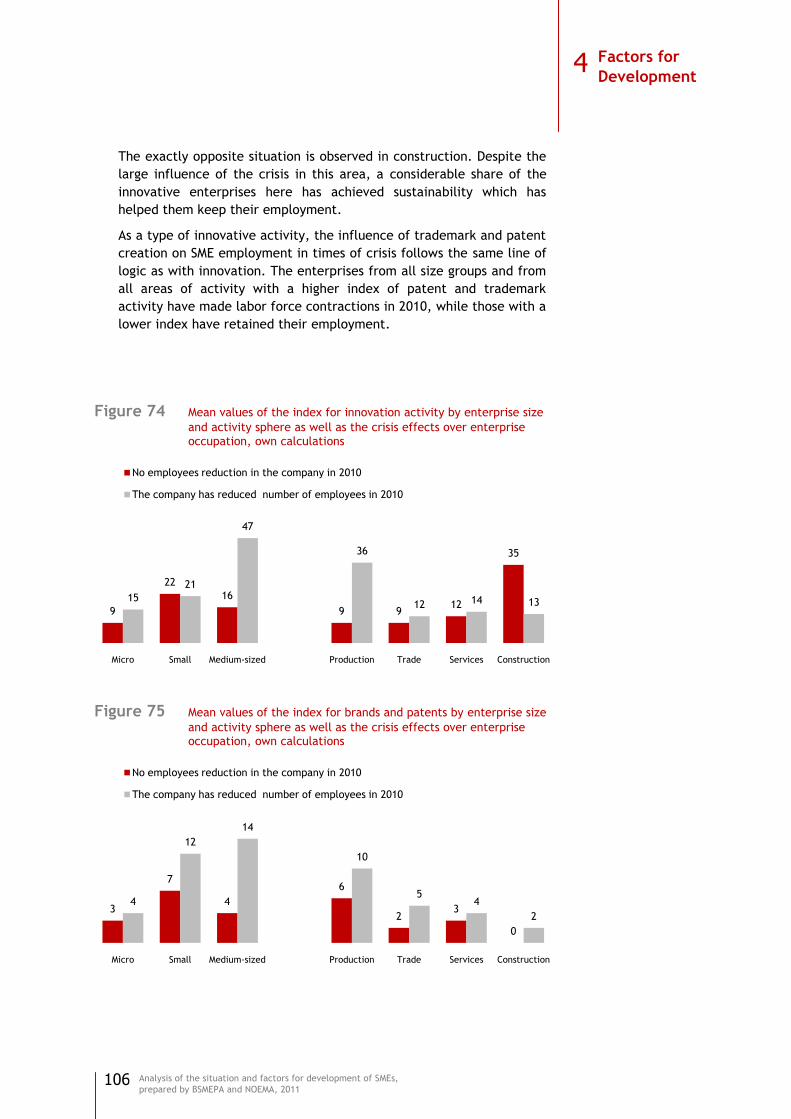
106
Analysis of the situation and factors for development of SMEs,
prepared by BSMEPA and NOEMA, 2011
The exactly opposite situation is observed in construction. Despite the
large influence of the crisis in this area, a considerable share of the
innovative enterprises here has achieved sustainability which has
helped them keep their employment.
As a type of innovative activity, the influence of trademark and patent
creation on SME employment in times of crisis follows the same line of
logic as with innovation. The enterprises from all size groups and from
all areas of activity with a higher index of patent and trademark
activity have made labor force contractions in 2010, while those with a
lower index have retained their employment.
Figure 74 Mean values of the index for innovation activity by enterprise size
and activity sphere as well as the crisis effects over enterprise occupation, own calculations
Figure 75 Mean values of the index for brands and patents by enterprise size
and activity sphere as well as the crisis effects over enterprise occupation, own calculations
9
22
16
9 912
35
15
21
47
36
12 14 13
Micro Small Medium-sized Production Trade Services Construction
No employees reduction in the company in 2010
The company has reduced number of employees in 2010
3
7
4
6
23
0
4
12
14
10
54
2
Micro Small Medium-sized Production Trade Services Construction
No employees reduction in the company in 2010
The company has reduced number of employees in 2010
4 Factors for
Development
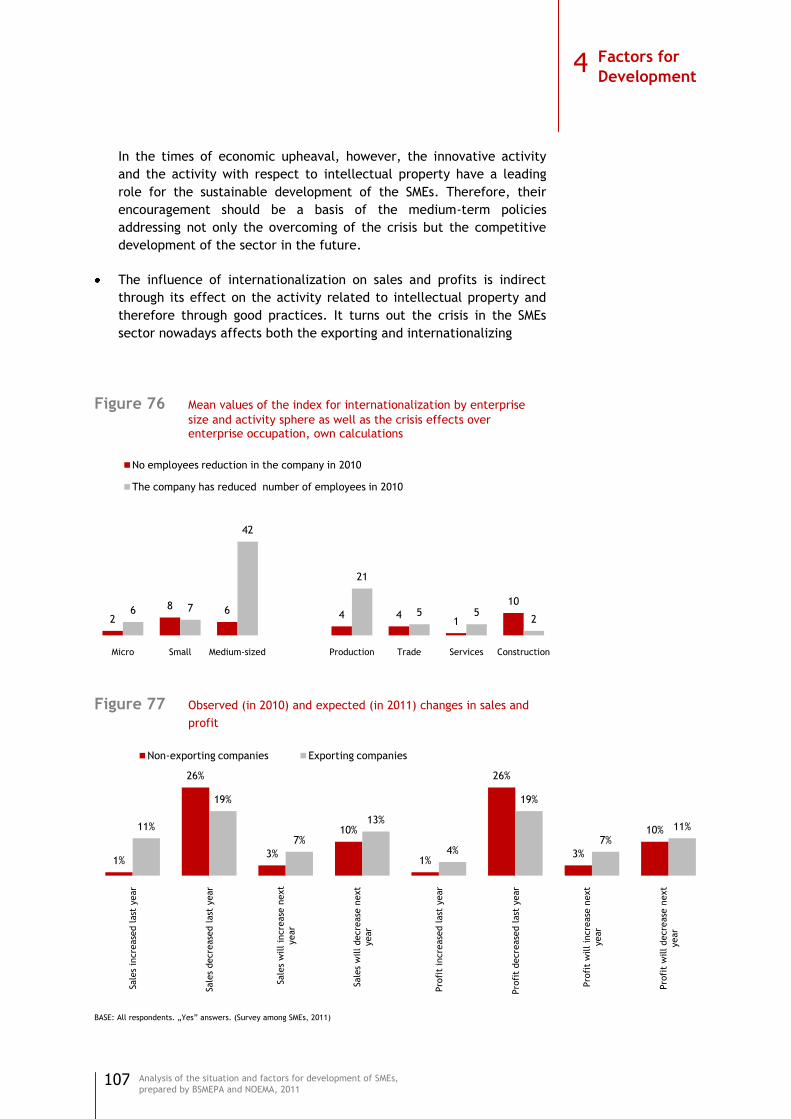
107
Analysis of the situation and factors for development of SMEs,
prepared by BSMEPA and NOEMA, 2011
In the times of economic upheaval, however, the innovative activity
and the activity with respect to intellectual property have a leading
role for the sustainable development of the SMEs. Therefore, their
encouragement should be a basis of the medium-term policies
addressing not only the overcoming of the crisis but the competitive
development of the sector in the future.
The influence of internationalization on sales and profits is indirect
through its effect on the activity related to intellectual property and
therefore through good practices. It turns out the crisis in the SMEs
sector nowadays affects both the exporting and internationalizing
Figure 76 Mean values of the index for internationalization by enterprise
size and activity sphere as well as the crisis effects over enterprise occupation, own calculations
Figure 77 Observed (in 2010) and expected (in 2011) changes in sales and
profit
BASE: All respondents. „Yes‖ answers. (Survey among SMEs, 2011)
2
8 6 4 41
106 7
42
21
5 52
Micro Small Medium-sized Production Trade Services Construction
No employees reduction in the company in 2010
The company has reduced number of employees in 2010
1%
26%
3%
10%
1%
26%
3%
10%11%
19%
7%
13%
4%
19%
7%
11%
Sale
s in
cre
ase
d l
ast
year
Sale
s decre
ase
d l
ast
year
Sale
s w
ill
incre
ase
next
year
Sale
s w
ill decre
ase
next
year
Pro
fit
incre
ase
d l
ast
year
Pro
fit
decre
ase
d l
ast
year
Pro
fit
will in
cre
ase
next
year
Pro
fit
will decre
ase
next
year
Non-exporting companies Exporting companies
4 Factors for
Development
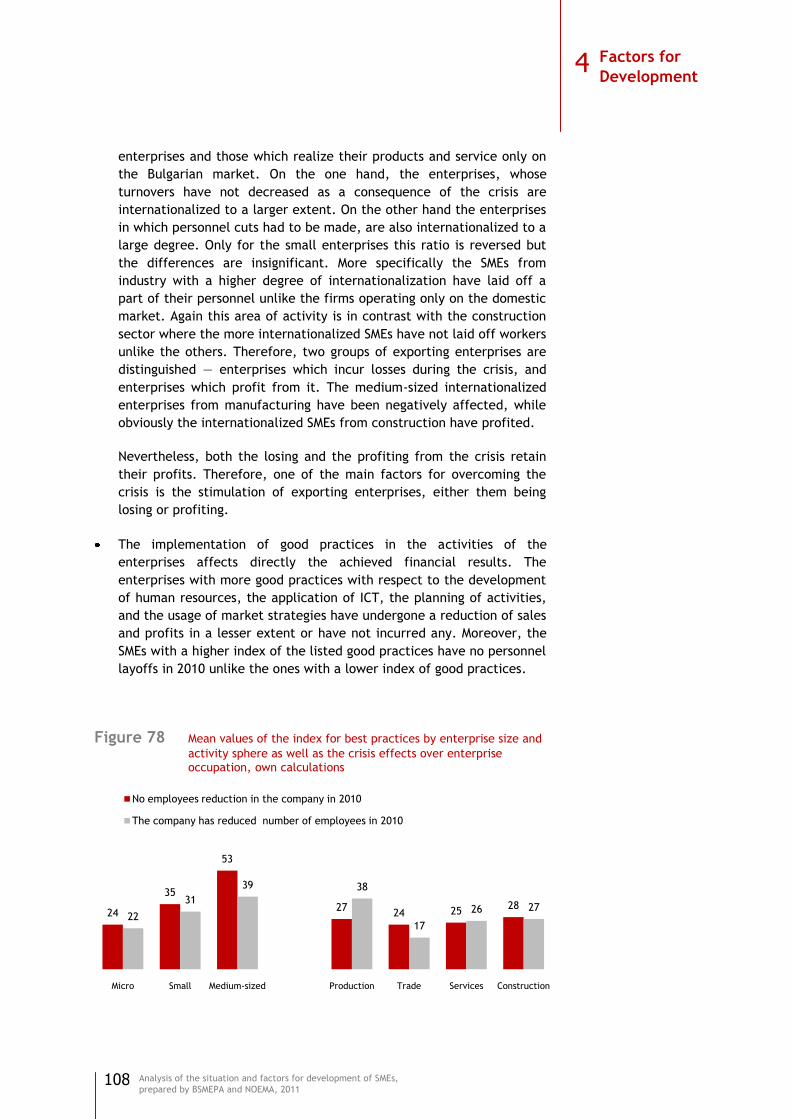
108
Analysis of the situation and factors for development of SMEs,
prepared by BSMEPA and NOEMA, 2011
enterprises and those which realize their products and service only on
the Bulgarian market. On the one hand, the enterprises, whose
turnovers have not decreased as a consequence of the crisis are
internationalized to a larger extent. On the other hand the enterprises
in which personnel cuts had to be made, are also internationalized to a
large degree. Only for the small enterprises this ratio is reversed but
the differences are insignificant. More specifically the SMEs from
industry with a higher degree of internationalization have laid off a
part of their personnel unlike the firms operating only on the domestic
market. Again this area of activity is in contrast with the construction
sector where the more internationalized SMEs have not laid off workers
unlike the others. Therefore, two groups of exporting enterprises are
distinguished — enterprises which incur losses during the crisis, and
enterprises which profit from it. The medium-sized internationalized
enterprises from manufacturing have been negatively affected, while
obviously the internationalized SMEs from construction have profited.
Nevertheless, both the losing and the profiting from the crisis retain
their profits. Therefore, one of the main factors for overcoming the
crisis is the stimulation of exporting enterprises, either them being
losing or profiting.
The implementation of good practices in the activities of the
enterprises affects directly the achieved financial results. The
enterprises with more good practices with respect to the development
of human resources, the application of ICT, the planning of activities,
and the usage of market strategies have undergone a reduction of sales
and profits in a lesser extent or have not incurred any. Moreover, the
SMEs with a higher index of the listed good practices have no personnel
layoffs in 2010 unlike the ones with a lower index of good practices.
Figure 78 Mean values of the index for best practices by enterprise size and
activity sphere as well as the crisis effects over enterprise occupation, own calculations
24
35
53
2724 25
2822
31
39 38
17
26 27
Micro Small Medium-sized Production Trade Services Construction
No employees reduction in the company in 2010
The company has reduced number of employees in 2010
4 Factors for
Development
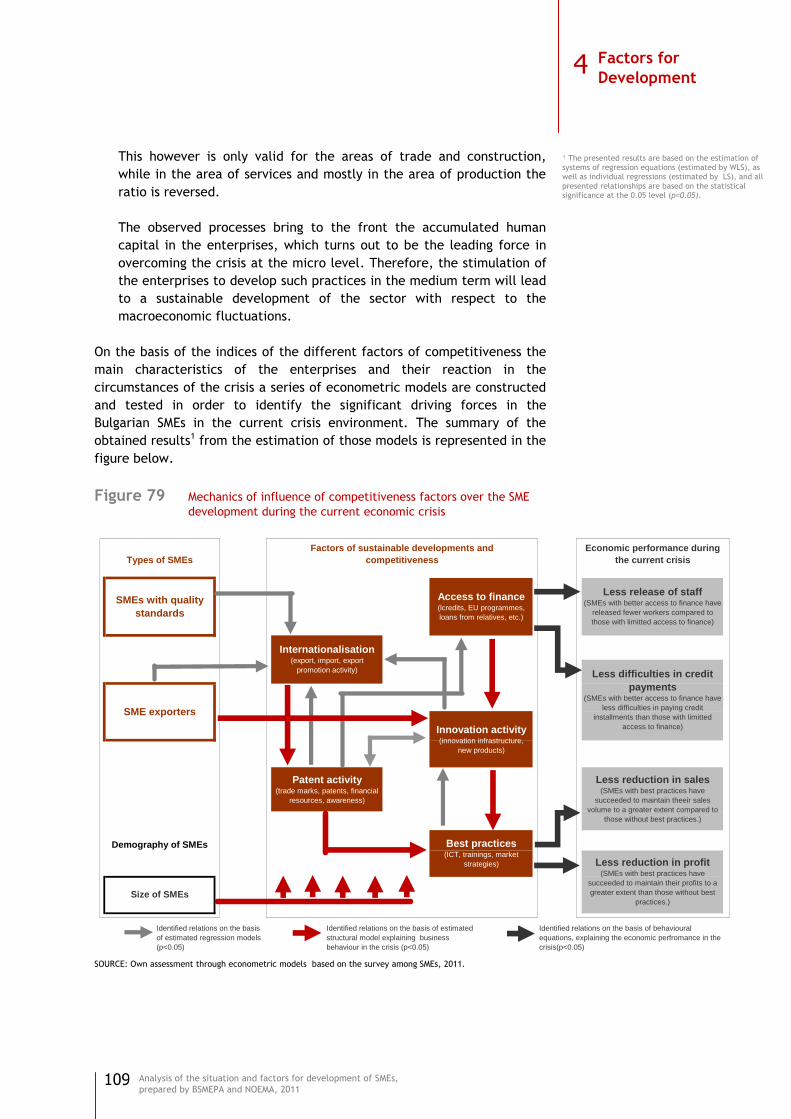
109
Analysis of the situation and factors for development of SMEs,
prepared by BSMEPA and NOEMA, 2011
This however is only valid for the areas of trade and construction,
while in the area of services and mostly in the area of production the
ratio is reversed.
The observed processes bring to the front the accumulated human
capital in the enterprises, which turns out to be the leading force in
overcoming the crisis at the micro level. Therefore, the stimulation of
the enterprises to develop such practices in the medium term will lead
to a sustainable development of the sector with respect to the
macroeconomic fluctuations.
On the basis of the indices of the different factors of competitiveness the
main characteristics of the enterprises and their reaction in the
circumstances of the crisis a series of econometric models are constructed
and tested in order to identify the significant driving forces in the
Bulgarian SMEs in the current crisis environment. The summary of the
obtained results1 from the estimation of those models is represented in the
figure below.
Figure 79 Mechanics of influence of competitiveness factors over the SME
development during the current economic crisis
SOURCE: Own assessment through econometric models based on the survey among SMEs, 2011.
Identified relations on the basis of behavioural
equations, explaining the economic perfromance in the
crisis(p<0.05)
Identified relations on the basis
of estimated regression models
(p<0.05)
Identified relations on the basis of estimated
structural model explaining business
behaviour in the crisis (p<0.05)
Economic performance during
the current crisis
Demography of SMEs Best practices (ICT, trainings, market
strategies)
Internationalisation (export, import, export
promotion activity)
Patent activity (trade marks, patents, financial
resources, awareness)
SME exporters
Factors of sustainable developments and
competitivenessTypes of SMEs
Less release of staff (SMEs with better access to finance have
released fewer workers compared to
those with limitted access to finance)
Less difficulties in credit
payments (SMEs with better access to finance have
less difficulties in paying credit
installments than those with limitted
access to finance)
Size of SMEs
Access to finance (lcredits, EU programmes,
loans from relatives, etc.)
Innovation activity (innovation infrastructure,
new products)
SMEs with quality
standards
Less reduction in sales (SMEs with best practices have
succeeded to maintain theeir sales
volume to a greater extent compared to
those without best practices.)
Less reduction in profit (SMEs with best practices have
succeeded to maintain their profits to a
greater extent than those without best
practices.)
¹ The presented results are based on the estimation of systems of regression equations (estimated by WLS), as well as individual regressions (estimated by LS), and all
presented relationships are based on the statistical significance at the 0.05 level (p=0.05).
4 Factors for
Development

110
Analysis of the situation and factors for development of SMEs,
prepared by BSMEPA and NOEMA, 2011
The figure clearly shows the sustainability of the various groups of
enterprises during the crisis: the enterprises with access to financing and
good practices have undergone less negative effects, namely less personnel
cuts, less difficulties in loan repayment, as well as less reductions in
turnover and profits compared to the other SMEs. Vice versa, the
enterprises with a more limited access to finance and less good practices
incurred negative effects in a larger scale. An interesting observation in
the times of crisis is the transfer to the background of the innovative
activity and internationalization. It turns out that the survival of SMEs in
the current conditions depends mainly on the accumulation and utilization
of human capital in them through good practices. Under difficult access to
financing, high intercompany indebtedness and shrunk sales the strategy
for business success in the short run includes predominantly the efficient
utilization of the available human capital. The innovative activities and the
internationalization which are the fundament of the medium-term success
of enterprises cannot lead to an immediate reflection in the turnovers
(which are extremely important in the times of crisis). Therefore we
observe the cancellation of investment plans and increased personnel
layoffs in the innovative and internationalized enterprises. When the
economy exits from the crisis, however, exactly those enterprises can turn
into the engine of the growth of the sector.
In conclusion it can be said that the identified relationships between the
factors of competitiveness and the effects from the economic crisis clearly
describe the profile of the sustainable enterprises, which in the short and
medium run can lead the SME sector out of the crisis and return the
economy to high growth rates. Those are mainly medium-sized enterprises
which have a broader access to financing or more own resources, and
restructured enterprises which have introduced key good practices —
regular staff trainings, systematic usage of ICT, incl. e-business
application, and market(ing) strategies. With a higher competitive
potential are also those SMEs which introduce innovations, engage in
patent activities and own trademarks creation, participate in various forms
of internationalization (imports and exports, cooperation with foreign
partners, etc.).
4 Factors for
Development
111
Analysis of the situation and factors for development of SMEs,
prepared by BSMEPA and NOEMA, 2011
Strengths and weaknesses, threats and opportunities for SME development
Weaknesses
According the data of the present research, in 80% of SMEs the innovation
activity was low; in 11% - rather low; in 5% - none low, neither high; in 3% -
rather high; and only in 1% - high. Barely 10% of researched SMEs had
enough means to finance the innovations, and only 3% possessed a R&D
unit and employees, responsible for R&D. The collaboration with institute,
universities, and academy was also limited — 4% of SMEs made use of
scientific works, and approximately 10% reported the collaboration with
universities. The innovation activity in medium sized enterprises was three
times higher, and in small enterprises — almost two times higher than in
microenterprises. The most innovative were manufacturing enterprises,
while the least innovative were traders. Significantly great number of SMEs
made use the internet technologies, but their share (less than 50%) looks
quite insufficient in the context of the mass penetration of the e-business
in the real and business life. 37% of the firms declared to have their own
internet page, 27% - electronic signature of managers, and 17% stated that
profit from the internet applications in their sales. The share of SMEs with
the implemented information management systems is quite small (below
6%).
13% of SMEs stated that in 2010 they elaborated and lanced new product
on the market; 16% improved considerably an already existing product; and
9% worked on a new product, which was expected to go recently on the
market. The new products are inherent mostly to small sized companies
(with a share close to that of the medium sized companies), while the late
were oriented mostly to the improvement of the already existed product.
In comparison with these two groups, the micro firms demonstrated more
limited capacities for product innovations.
As the innovations are at the ground of new trade marks and patents, not
surprisingly only 10% of SMEs had a registered trade mark in Bulgaria, and
other 6% - abroad. These shares for the patents registrations were
respectively 8% and 6%, while the upcoming registrations were
insignificant. Similar to the product innovations, this situation was a
consequence of an insufficient financial recourse — only 7% of SMEs stated
they have enough means for a trade mark registration, and another 5% -
for a patent registration. The level of knowledge of the intellectual
property value, as well as the opportunities for its registration in the
frame of the EU, is quite low.
The weak export positions of the Bulgarian SMEs were due to the fact that
the greatest part worked mainly for the internal market, while the
exporters were only 5% (according the Eurostat data of 2011 — 6%). The
number of exporters was two time smaller than the number of importers
4 Factors for
Development
112
Analysis of the situation and factors for development of SMEs,
prepared by BSMEPA and NOEMA, 2011
(12% according to both present data and Eurostat data), which conditioned
two times smaller export compared to import. The export structure
remained almost unchanged, keeping in the small manufactured and low
costs production. The share of SMEs with filial or joint ventures in other
countries is the lowest in Bulgaria, Hungary, Czech Republic, and Cyprus,
in spite that it is not great for the whole EU (5%). The biggest capacity for
the internationalization had the medium sized enterprises. For instance,
17% of these enterprises declared the enlargement of their markets abroad
in comparison with 4% of small and 3% of micro companies. The lower level
of the internationalization comparatively to the EU average level reflected
the lower competitiveness of Bulgarian SMEs. The conclusion was that they
are at the beginning of their integration to the EU economic structures and
to developed international markets.
In difference to the banks‘ credit expansion before the crisis, today 90% of
SMEs are strongly embarrassed in their access to financing, and barely 10%
had information about funds, providing financial means for business. That
is why the resources of entrepreneur were the basic, in spite quite
insufficient source for financing. In 2009 the access to public funds was
also considerably restricted — only 4% of SMEs profited from government
programmes, while the share of those, having access the European or other
foreign funds, was les significant. Each 10th enterprise failed to pay to
banks its debt in time, and each 3d enterprise was late with payments to
its partners and suppliers. 15% of SMEs waited payments from clients 3 and
more months.
From this self-evaluation of the SMEs entrepreneurs/managers followed
that their greatest weaknesses were the following: creation of own trade
marks (brands), patents, and other intellectual property; participation in
cooperative networks and clusters; thin export positions. Other
characteristics, which were evaluated as rather weak were: access to
finance; implementation of innovations, and marketing researches.
Practically all these activities, which are leading to the creation of
sustainable competitive advantages in the nowadays globalizing economy,
turned to be weak or the weakest sides of Bulgarian SMEs.
4 Factors for
Development

113
Analysis of the situation and factors for development of SMEs,
prepared by BSMEPA and NOEMA, 2011
Strengths
One of the strongest sides of SMEs was their contribution to the
employment increase even during the economic crisis. In 2009 the number
of employed in SMEs augmented with 22 thousands persons compared to
2008, while the number of employed in large enterprises decreased with
45 thousands persons for the same period. This fact underlined once again
the necessity for policies stimulating SMEs development as they alone in
the period of crisis preserve, and even increased the employment. Even
more - in 2009 only the micro enterprises increased their share in the
employment with 11%, while other size groups lose the employees. The
employment diminishing was greater in bigger enterprises (-9%), close to
that of medium size firms (-8%), and quite weaker in small firms (-0.2%).
To the strengths of the Bulgarian SMEs belonged the increased application
of professional education and training of personnel, which took place both
inside the firms (in 37% of SMEs), and outside in the forms of specialised
courses (in 17% of SMEs). The firms‘ education and training played a crucial
role for the employees‘ competencies adjustment in the conditions of fast
technological ant other changes. Probably this engagement allowed for 14%
of SMEs to enlarge the portfolio of their products in the last year, and
almost the same share (13%) to enlarge their market share inside the
country.
Each 10th enterprise strived to apply more ―good practices‖, related to
more intensive ICT use; company education of employees; better planning
and marketing analyses. The implementation of good practices was two
times more significant in medium size firms in comparison to micro firms.
Good practices were most spread in manufacturing sector, and less spread
— in commerce; these practices were more often met among the
companies in big cities, compared to those from smaller inhabited places.
With the increase of the enterprise innovation score, the implementation
of good practices increased too. It is worth to note that the women
entrepreneurs applied to a higher degree good practices in comparison to
men entrepreneurs. The intensity of the good practices implementation
depended positively on the entrepreneurs‘ educational level. Based on
these data, it becomes clear that the application of good practices
devoted to the increase of the firms‘ human capital is a capstone of their
success, particularly in the time of crisis.
The self-evaluation of the SMEs evidenced that the entrepreneurs
esteemed as their strengths namely the qualified staff, closely related
with the firms‘ education and training; improved opportunities to access
the information due to the more intensive use of the ICT; better planning
and marketing researches. In spite that these good practices were of a key
importance for the SMEs survival during the crisis, these practices seems
not sufficient to create sustainable competitive advantages, which firms
will need when going out of the crisis.
4 Factors for
Development

114
Analysis of the situation and factors for development of SMEs,
prepared by BSMEPA and NOEMA, 2011
It has to be noted also, despite as a weak tendency, that during the crisis
the majority of SMEs undertook serious steps to improve enterprises‘
profitability and efficiency. More than half of these firms undertook
measures to increase the employees‘ performance; to achieve more
precise accountability of debts and receipts; and to reach stricter control
over products and deliverables.
Figure 80 SME self-assessment of strong and weak sides
BASE: All respondents. (Survey among SMEs, 2011) LEGEND:
STRONG ASPECTS RATHER STRONG ASPECTS RATHER WEAK ASPECTS WEAK ASPECTS
4 Factors for
Development
115
Analysis of the situation and factors for development of SMEs,
prepared by BSMEPA and NOEMA, 2011
Threats
The researches from former financial crisis demonstrated that the credit
crisis may have long term effects on the tangible assets‘ values,
government debts, and employment. The negative structural effects of the
crisis could be a diminishing propensity of enterprises to invest (because of
the depreciation of tangibles assets), and among consumers — a low
propensity to consume. The worsening financial situation of governments
could lead to the decrease of public expenditures and/or to the tax
increase, which could engender the W scenario of the crisis. The expected
reduction of means for R&D may have as a consequence the retarding in
the technological progress, and the high unemployment — the loss of
competencies among workers and employees.
According the researched entrepreneurs, they were facing two groups of
acute problems at the beginning of 2011. The first group of issues was
related to the impossibility of decreasing anymore the costs, and the lack
of markets for their products and services. The second group included the
danger of the increasing inter-firms indebtedness (which hampered the
relationships with suppliers); the presence of a great part of ―grey
economy‖ in the respective sectors; and the freezing of the enterprises‘
investment plans. The indicated five problem areas in fact were the main
threats to the growth and the competitiveness of the Bulgarian SMEs.
These threats could be translated as issues of the business environment,
financial security and firms‘ stability, and an insufficient access to the
united European market.
The average age of all interviewed entrepreneurs/managers of SMEs was
46 years. The biggest is the group of 41-50 years old (32%), followed by the
younger group of 31-40 years old (30%), and on the third place was the
group of 51-60 years old (24%). The youngest (until 30 years) and the
oldest (more than 61 years) entrepreneurs had an equal share of 14%. In
this sense there was a threat, related to the family business transfer
among the oldest entrepreneurs. As a number of researches have shown,
very often the SMEs close down because of the lack of appropriate heirs or
loyal managers to continue the firms‘ activity.
4 Factors for
Development

116
Analysis of the situation and factors for development of SMEs,
prepared by BSMEPA and NOEMA, 2011
Opportunities
The opportunities to the SMEs sector development were connected mainly
with the expected economic recovery and the adequate firms‘ behaviour.
According the cited research of the European Central Bank (ECB), the most
often mentioned challenges by the European SMES were the demand drop
(28%) and the difficult access to finances (19%). The gravity of the second
challenge is different in different European countries, sectors, and SMEs
size groups. In any case today is the moment when the thoughtful
government measures are needed more than whenever. This is true not
only to the above mentioned two problem areas, but to the whole range of
measures concerning SMEs activities. In this respect there are great hopes
on the accepted by all EU member countries SBA.
Some enterprises were seeing in the crisis also the opportunity to improve
their positions in comparison to their rivals. This is possible as the crisis
caused the cognitive changes, which could lead new ideas of products or
production methods. As the enterprises‘ close down or bankruptcy has a
great social price, the inverse side of this process is that it happened with
the lowest efficient companies, and this way a space for the entering of
new players is open.
The definite opportunity for the progress of Bulgarian SMEs is a relatively
high educational level of their proprietors/managers. A little more than
half of them had a high school education, while the share of those with the
university education was smaller with 11%. The persons with university
education among entrepreneurs were two times more than the country
average. Two thirds of the interviewed entrepreneurs declared that they
made use of one foreign language, and one fifth — two and more
languages. It is worth to note that high educated and knowing foreign
languages female entrepreneurs were significantly more male
entrepreneurs (75% of women entrepreneurs used foreign languages
against 61% of men entrepreneurs). It was also encouraging the fact that
the attitude towards a second business chance (in a case of failure)
increased with the age decreasing - more than 75% of entrepreneurs until
40 years old could undertake again a business in a case of failure in
comparison to 50% among those between 51 и 60 years old, and 33% of
those aged 61 and more.
The orientation of the greater part of SMEs towards local market definitely
helped them to survive in the period of crisis (when the external demands
were fall down). At the same time, however, namely the export (where
the medium size firms prevail) outlined as leading for the economic
recovery. It means that at the medium size period these enterprises have
better perspectives.
4 Factors for
Development
117
Analysis of the situation and factors for development of SMEs,
prepared by BSMEPA and NOEMA, 2011
The entire SWOT analysis reveals, however, that three years after the
country accession to the EU, we may agree with the evaluation of
Bulgarian SMEs sector, given gust before this memberships:
―The SMEs sector remains relatively weak with the following inherent
characteristics: a presence of many surviving firms; small amount of
created added values; low quality of the created working places. If we
add the underestimation of the support to growing SMEs, which in fact are
the generators of the economic growth, and a very small number of SMEs
sub-contractors to big international companies, and significant “grey
sector”, we will outlined the important issues to entrepreneurship and
SMEs, which have to be resolved.‖1 The main reasons for the sketching
picture of Bulgarian SMEs are macroeconomic and institutional, and these
reasons need a special investigation.
¹ Todorov, 2006.
4 Factors for
Development

118
Analysis of the situation and factors for development of SMEs,
prepared by BSMEPA and NOEMA, 2011
Key points
There was an improvement of the institutional environment in 2010
compared to the previous years. It was the largest for the services and
procedures related to the trade register and the licensing and
registration regimes. The services and procedure of the customs
authorities and the judiciary offer the most unfavorable environment
to the SMEs.
10% of the SMEs have applied for public procurements in 2010. 60% of
them have won such.
In the beginning of 2011, 93 % of the SMEs had difficult access to
financing. The most impeded were the micro enterprises. 90% do not
have up-to-date information on the EU funds financing SMEs. Due to
the lack of alternative sources, the most frequently used source was
owner‘s funds.
In the beginning of 2011, in 80% of the SMEs innovation activity was
low. Only 10% of the SMEs declared that they had sufficient funds to
finance the innovative activity in the enterprise.
Almost all SMEs have a low degree of activity related to intellectual
property — trademarks and patents. 10% have a registered trademark
in Bulgaria, and 6% — abroad. A very low share of SMEs had sufficient
funds and information to register intellectual property in the country
and in the EU.
95% of the SMEs have a low degree of internationalization. In 2010,
12% carried out exports, and 5% — imports. The low degree of
participation in clusters — 4% — also stands as an impediment to the
internationalization of enterprises. Amongst the small and micro
enterprises the internationalization has a much lower coverage than
in the medium-sized enterprises.
Every 10th enterprise implements good practices to a more
considerable degree. The good practices are encountered in the
medium-sized enterprises twice more frequently than in the micro
enterprises. In the times of economic crisis the application of good
practices turns out to be a crucial factor for the sustainability of an
enterprise.
One of the strengths of the SMEs is their contribution to employment
increases, even in the times of crisis. Another strength is the
increasing implementation of personnel trainings. The weak points are
the low degree of internationalization and the feeble innovative and
patent activities.
4 Factors for
Development
119
Analysis of the situation and factors for development of SMEs,
prepared by BSMEPA and NOEMA, 2011
Measures and policies
Legal framework
Applicable national legislation in force
Small and Medium-Sized Enterprises Act
State Aid Act
Skilled Crafts Act
Cooperatives Act
Commerce Act
Accountancy Act
Investment Promotion Act
Value Added Tax Act
Local Taxes and Fees Act
Income Taxes on Natural Persons Act
Health and Safety at Work Act
Classification of Economic Activities
Applicable regulatory frameowork of EU
European Charter for Small Enterprises
Small Business Act
Applicable strategic documents at community and national level
Lisbon strategy
The Bulgarian economy — state and development strategy — Economic
strategy MEET
Programme for better regulation 2010-2013
National Strategy for Small and Medium Enterprises
5
120
Analysis of the situation and factors for development of SMEs,
prepared by BSMEPA and NOEMA, 2011
Contemporary approaches in formulating policies for SME
The evaluations of impact and the research on effects as a result of
governmental policies and aids for SME show that policies could have both
positive and negative effect.¹ Heterogeneity of these effects is confirmed
also by OISR research about presenting SME by EU.² These effects can be
explained by the different enterprise stages of development that received
governmental aid.³ For example, the new and young technological firms
have greater benefit by governmental financing compared to already
established enterprises, especially if it is carried out through a selective
evaluation of the projects.
Main task of the approaches formulating policies in the support of SME is to
clarify whether the not-good performance of SME about innovations is due
to market lacks or governmental policy lacks. The identified common risks
for innovations failure are associated with failure in the provision of
funding; lack of guarantees of property rights on innovation because the
possibility of being reproduced and others.4 Even in the presence of
developed patenting system, the process could be very expensive for SME.
Regarding to cooperative research and development activity, SME do not
have enough capacity for absorbing the results, so to benefit from this
activity.5
This mean, that SME should reach one critical size, to overcome barriers,
related to asymmetric information, access to finance, skilled employees,
government regulations and others. Thus appears that the most hampered
about innovations are the small and young innovative enterprises, which
has great potential for innovations.6 This requires special policy for them.
Along with these market failures, the other risk is related with failure of
government policies, even if they are well formulated and targeted. EU
countries differ in degree of development and implementation of these
policies. Not all have reached the target of 3% expenditures of GDP for
research and development activity. Others, more developed countries have
lots of small programs for overcoming different barriers. In the programs
for innovations support at SME are integrated the requirements for
cooperation and networks (clusters) in order better connectivity of
business and science, facilitating access to venture capital, public-private
partnership and others.7 However, the data shows that large innovative
enterprises are more likely to receive national financial support compared
to small innovative enterprises.8 Unlike the national or European financing,
the local and regional financing is not so narrowly directed toward large
enterprises, which underlines the importance of local policy according
SME. That is why, the current sector analysis reaching the following
conclusions and recommendations9:
Policies for stimulating SME needs systematic approach, creating
frame conditions for environment, which favors the innovations,
good practices and others.
These policies requires a failure test (both market and government
instruments).
¹ Czamitzki and Aerts, 2004; Takalo et al. 2007.
² OECD, 2007.
³ Colombo et al. 2008.
4 Veugelers, 2008.
5 Belderbos et al., 2004.
6 Veugelers, 2008.
7 ОЕCD, 2007.
8 Aertz and Schmidt, 2008.
9 For example, Veugelers, 2008.
5 Measures and policies

121
Analysis of the situation and factors for development of SMEs,
prepared by BSMEPA and NOEMA, 2011
These policies should be differentiated and aimed at target groups
of enterprises, thereby achieving greatest effect of the impact on
the sector. For example, young, fast growing high-tech enterprises
may face difficulties in obtaining finances for their innovations,
and they are the ones that can be engine of growth of high-tech
manufacturing.
The effective protection of intellectual property is often crucial to
the willingness of SME to seek financing and new markets of their
innovations.
A favorable tax treatment of activities to increase competitiveness
is needed.
The policies for stimulating SME need experimentation and impact
assessment (pre and post) and this requires appropriate cognitive
infrastructure.
Overall Assessment of the State Impact
According to M. Weber, there are two types of market economy — rational
and irrational. The rational market economy is characterizing by
entrepreneurs view relying on systematic work, profit on turnover,
increasing productivity, improving quality, cutting costs. These
profitability funds are combined with relatively modest personal
consumption. Contrasting characteristics of entrepreneurial behavior,
which includes demanding of political patronage, secured government
contracts, strive toward monopoly, show-off consumption and others, are
typical for the irrational type of market economy. That, which unify the
two types of market behavior is strive toward profit, and that, which
distinguish them, is the way its achievement.¹
At the late 90‘s, established in Bulgaria market economy shows many
similarities with the irrational type of economy. Started after that, process
of harmonization of Bulgarian legislation with that of EU rapidly led to
another change of rules. These rules require from SME to follow new
models — the observance of high standards, the rules of competitiveness,
implementing them into business networks, internationalization,
innovations and etc., without guarantee of previous gains. That is why at
the beginning they seem economically unaffordable to the business.
Regarding public administration these rules propose greater transparency
and efficiency, reducing the administrative burdens to business and free
communication. The new rules of European membership essentially means
second transition — this time from weak institutional and largely irrational
market economy to rational and regulated by European directives
economy.
The data analysis from the empirical study reveals relatively stabilization
of institutional environment for SME‘s business compared to previous
¹ Daskalov, 1992.
5 Measures and policies
122
Analysis of the situation and factors for development of SMEs,
prepared by BSMEPA and NOEMA, 2011
years. This is very clear at services and procedures, related to commercial
register and permissions and registration regimes, where is observing a
presence of friendly business environment. Others, which have improved
the environment for SME, are tax administration and social security.
Generally, the institutional environment is less favorable for enterprises in
bigger cities, the ones with smaller and younger employees as well as
those with highly educated owners. Northwestern region has the most
unfavorable institutional planning environment. These identified problem
areas can be the basis of measures for improving the administrative service
of SME and creating more favorable institutional climate.
Regarding the main action points, recommended at National Strategy for
Promotion of SME 2007-2013 — a major strategic document at national
level and directly corresponding with the main European provisions for
SME, can be made the following summarizing conclusions:
1. Promoting entrepreneurship spirit. Quick development of SME
sector in last decade is indicator for development of an environment,
promoting the entrepreneur spirit. Although this environment is
determined by number of processes along with conducting state policy
in the sector, an overall conclusion that can be made is that policies
during the last years have assisted to some extend that process. An
argument in this direction is the gradually improvement of enterprises
estimates for administrative services.
Milestone in the analysis however, is the large proportion of
entrepreneurs aged over 50 years (31%). At the same time, attitudes
for ―second chance‖ have predominantly young entrepreneurs. On one
hand this means that one third of SME‘s sector is threatened by
extinction in medium-term plan in case that retiring entrepreneurs do
not have someone to heritage the business. On other hand, this means,
in case of deepening the crisis and bringing a significant share of SME
to bankruptcy, most entrepreneurs will not restart their business.
That is why, the policies, directed toward entrepreneurship among
young people is of utmost importance for stable sector development.
Within these policies, have to be directed the measures of improving
the entrepreneur education quality and its expansion in technical
disciplines at universities.
2. Improving fund access. Access to finance of SME is difficult, which
is obvious from the macroeconomic indicators as well as
microeconomic data from the conducted survey. The size of enterprise
is leading in bank lending, which in most cases is discriminatory to
micro and small companies. Another reason for difficult access to bank
lending is the high interest rates of our country compared to European.
Therefore, strengthening the state policy toward providing alternative
sources of financing of SME is of critical significance for strengthening
the sector, mostly its support for exiting the crisis. Another problem in
companies financing is large inter-company indebtedness. State
5 Measures and policies
123
Analysis of the situation and factors for development of SMEs,
prepared by BSMEPA and NOEMA, 2011
intervention could be reduced here to ensuring regular, on-time
payments on budget obligations to SME by the different
administrations.
3. Financial support for SME by European Commission programs.
SME are the backbone of European economy and has the biggest
potential for job creating and growth. That is why EU develops various
programs, which facilitating the conditions for starting business and its
expansion. At present moment however the share of companies
received support by European structural funds is insignificant. Although
there is some progress in this area, still there is need of efforts,
toward greater absorption of structural funds, particularly by SME.
These efforts must be directed to better awareness of entrepreneurs
and to improve their skills in preparing and realizing their projects. It
is also necessary a relatively simplifying of project application
conditions and improving of interaction between the interested
entrepreneurs and the project responsible state agencies. Although
indirect these measures could have a direct positive impact on
employment and reducing unemployment.
4. Simplifying administrative environment for SME. EU put efforts
for limitation of bureaucracy and encourages the different
governments to follow this policy. From the current survey data
Bulgaria register progress at this area in last years, but still the
administration environment, supported by state institutions is unable
to provide favorable conditions at all administrative spheres. That for
example, a register of SME misses which to assist as well the activity of
relevant institutions as the activity of enterprises. Another problem,
standing in front of SME is the access to on-time and comprehensive
information about product markets, the status of key for them markets
and etc.
5. Protection of loyal competition. The competition market provides
the best guarantees of European SME at the efficiency search and
realization of the innovative potential. EU conducts strict competition
protection policy and protects SME from non-market behavior of some
economical subjects. Overall, there is great progress in this area in last
decade. Despite this SME still has need of support in this direction —
natural monopolies, the market power of large enterprises and the
unequal distribution of business by regions and economic activities in
many cases leads to distortions in demand and supply of markets in
which they operate.
6. Encouraging entrepreneurs to follow the principles of
sustainable development. The development of competitiveness,
combined with the social responsibility of enterprises and adherence of
norms preserving nature, allow achieving and maintaining of high living
standard, welfare and security EU population. The policies pursued by
governments over the past decade registers progress in this direction.
Attracted foreign investments till the moment of crisis led to renewing
the production capacities, implementation of new technologies and
5 Measures and policies
124
Analysis of the situation and factors for development of SMEs,
prepared by BSMEPA and NOEMA, 2011
increasing competitiveness of Bulgarian products. Still however the
main equipment of SME at the moment is old — its average age is 8¹
years, while in Europe for new equipment is considered that to 5
years. Due to investment activities contraction in last two crisis years,
the improvement of this indicator is not much probable in short-term.
That‘s why continuing the policies for attracting investments will lead
to reduce of negative effects of crisis on competitiveness.
7. Promote implementation of standards. Standardization is
important process for the enterprises, because create a stable frame,
in which they can work safely and much more easily to step on foreign
markets. In last years is observed a growing number of enterprises,
implemented internationally accepted standards. Still however their
share is relatively small. There is continuing need of policies, directed
to providing information and other technical help in the process of
implementation of standards in SME sector.
8. Internationalization of SME. One of the great successes of EU is
creating a huge common market of more than 450 million consumers.
In recent years is observed a growing number of exporting companies
among SME. Despite this the greater part of SME produces and
competes only on the local market, being unable to benefit from EU
accession, and the share of exported produce from the sector is very
small. That is why, the sector needs support today, for building a
capacity of enterprises, which to be prerequisite for their successful
internationalization. This may happen by providing more information,
trainings, participation at international fairs and exhibitions, business
delegations and others.
9. Support for R&D. The innovations today are more important for the
small business than ever, so to withstand the competition and stay on
the market. Markets change fast, especially as a result of the threat
coming from the world manufacturing centers like China and India.
Bulgarian enterprises are behind in their innovational activity, mostly
because of difficult access to financing. That‘s why, there is a need for
continuing the efforts toward better absorption of European funds,
supporting research and development.
10. Intellectual property protection. Many enterprises are created
just around a new idea, invention or innovation in marketing area of
particular product or service. Once the novelty being exposed to the
world, it instantly need legal protection — and this happens through
the measures at the area of intellectual property. The intellectual
property by itself is narrowly connected with export activity. Bulgarian
enterprises lagging behind in patenting activity — small is the share of
these, who are informed about the possibilities for mark branding in
Union. In addition, small part of the enterprises have sufficient
financial resource to register own brands. There is continuing need of
policies directed to consultations and facilitate access to funding
regarding the registration of trade marks and patents.
5 Measures and policies
¹ According to the results of the Survey among SMEs, 2011.
125
Analysis of the situation and factors for development of SMEs,
prepared by BSMEPA and NOEMA, 2011
Proposals for measures and policies
In the report by economic research unit of Eurobank EFG for the markets
of new Europe indicates that Bulgaria should transit toward new model of
development with accent on competitiveness and export. According to
analysts, the time when the foreign investments were engine of economic
growth of the country is over with the beginning of world financial and
economic crisis and our country should seek for other sources of growth.
This means that Bulgaria should shift the accent in its growth strategy from
crediting and consumption on improving competitiveness and stimulating
export.¹
Bulgarian SME can increase their competitiveness and integrate in
European and global developed markets, if strengthening the institutional
and in-house capacity in the following areas:
Improving the access to finance. Access to financing is the foundation
as well of the all processes related to increase of competitiveness as
for the business success of enterprises. The implementation of similar
measures will lead to direct positive effect on competitiveness in
average-term and long-term plans. Sample of measures, which can
improve the access to financing are::
a. Better awareness of entrepreneurs about the possibilities and
conditions for financing by structural fund programs of EU;
b. Trainings, directed toward increase of skills of enterprises a\in
preparing and realizing the projects;
c. Simplifying the application conditions for structural fund
programs of EU;
d. Expansion of the application access to apply for the separate
structural fund programs of EU for wider circle of SME
(regarding the size, age of enterprise, economic activity and
others);
e. Supporting the process of expanding the role of risk capital in
SME sector.
5 Measures and policies
¹ Eurobank EFG, 2010.
126
Analysis of the situation and factors for development of SMEs,
prepared by BSMEPA and NOEMA, 2011
Promotion of innovation and patenting activity:
a. Stimulating the reorientation of activity of SME from broadly
recognized worldwide industries with low added value to
certain niches, occupied on the basis of specific competitive
advantages and innovational products with higher added value.
b. Stimulating and implementing and application of ICT,
standards for quality and innovations, which benefits exceeds
the costs in long-term.
c. The technological modernization of SME requires broader
spread of part-time work and flexible employment, which is
necessary for more intensive use of new ICT. The policies in
this direction should be focused on the significant increase of
computer literacy of population as well as creating a
framework for more opportunities and flexible employment;
d. Supporting the process of creating a connections between the
enterprises and scientific divisions and stimulating the
development of joint projects;
e. Financing specialized personnel trainings in SME to define the
benefits from innovations and intellectual property.
f. Financing specialized trainings for e-business and the
opportunities of internet environment.
Promotion of internationalization. In order to enhance the
internationalization of the sector the support of the state can be
directed to:
a. Creating organizations for mutual marketing and advertising;
b. Supporting establishment of contacts with foreign partners
through different forms and forums, for example organizing a
commercial missions with representatives of Bulgarian and
foreign SME throughout the embassies of EU member countries
in Bulgaria;
c. Financial funding of communication campaigns, participation in
exhibitions and etc.;
d. Developing an export rating of enterprises and implement it at
formulating policies and certain target groups.
5 Measures and policies
127
Analysis of the situation and factors for development of SMEs,
prepared by BSMEPA and NOEMA, 2011
Trainings of entrepreneurs and increasing the qualification of SME
employees:
a. Wider dissemination of entrepreneur training among students
in technical disciplines;
b. Financing of trainings of entrepreneurs and SME employees;
c. Implementing of financial stimulus, which to promote SME to
apply good practices in sphere of human resources
development.
Promoting the implementation of good practices:
a. Implementing of financial stimulus, which to encourage SME to
broad using of ICT in their activity (e-business, managerial
information systems, etc.);
b. Financing of trainings of entrepreneurs on developing market
strategies and business planning.
Improving the institutional environment:
a. Updating the National strategy for promoting of SME 2007-
2013 г. according requirements of SBA;
b. Implementing a register of SME, as well as for export oriented
enterprises;
c. Providing on-time and comprehensive information about the
condition of SME sector and other statistical information,
which is to serve the enterprises in their activities of
development market strategies and business planning;
d. Overall improvement of information access of SME.
5 Measures and policies
128
Analysis of the situation and factors for development of SMEs,
prepared by BSMEPA and NOEMA, 2011
Improving the process of formulating adequate and on-time policies
for promoting the development of SME:
a. Preparation of regular analysis and panel researches about the
condition of the sector of SME and tracking the dynamics of
factors for sustainable development;
b. Identifying of key SME groups (for example, fast growing SME,
export oriented SME, innovative SME, cluster participating SME,
etc.) and preparation of regular analysis for their condition.
Overall, it can be concluded that short-term policies influencing the
development on SME sector, on one hand should be directed toward
improving the access to financing. On another hand, these policies should
focus on the enterprises with good practices, which in the moment are
most stable in crisis. By this way the institutional support will be directed
exactly toward these enterprises, which can help to the whole sector of
SME to come back on growth levels before crisis.
The policies with middle and long-term impact on the sector of SME should
be directed toward innovational activity of enterprises, which
development has a significant role for achieving higher competitiveness of
Bulgarian SME.
Regardless the time horizon of conducted policies however, key factor for
development the sector are the investments in human capital. That‘s why
continuing the policies of development of human resources and directing
them in areas with greater needs, will contribute as for the better exit
from crisis as for achieving high future economical growth in the sector.
5 Measures and policies
129
Analysis of the situation and factors for development of SMEs,
prepared by BSMEPA and NOEMA, 2011
Bibliography
БСК. 2009. 2009 г. през погледа на бизнеса (Резултати от анкетно проучване)
(http://www.econ.bg/files/101135/anketa-2009-press.bg)
Владимиров, Ж. 2001. Изградена ли е в България добре функционираща
пазарна икономика? В: Европейските измерения в управлението и
икономиката на страните в преход. СУ ―Св. Климент Охридски‖, Стопански
факултет, изд. ―Парадигма‖, с. 176-198
Даскалов, Р. 1992. Въведение в социологията на Макс Вебер. Изд. „Св. К.
Охридски‖, София
Задълженията на фирмите достигнаха 157 млрд.лв. към началото на 2010 г.,
(http://www.bia-bg.com/1/1/MlW-gRW7I5WnIlWHUZK3YJS-c9O3IdOfMhKvYZe7gRK-
UdOLU9OHUlKLgdaPIRmXct iP|
МИЕ, 2008. Оценка на конкурентоспособността на българската икономика.
Национално представително изследване сред бизнеса по поръчка на МИЕ,
Октомври — ноември 2008
МИЕ, 2010. Годишен доклад за състоянието и развитието на МСП в България
2008. София
Норт, Д. 2000. Институции, институционална промяна и икономически
резултати. ЛИК, София
По-добър достъп до финансиране, http://ec.europa.eu/enterprise/policies/
finance/index _bg.htm).
Портър, М. 2004. Конкурентното предимство на нациите. София, Изд. „Класика
и стил‖: 84
Тодоров, К. 2006. Българското предприемачество в обединена Европа:
предизвикателства и възможности. Годишник на УНСС, 2006, с. 77-100
Фондация ПИК. 2007. Иновации.бг. Българската иновационна система
(http://www.arcfund. net/file Src.php?id=2038)
Фондация ПИК. 2009. Иновации. Бг. Българската иновационна система в
условията на глобална икономическа криза. София
Харизанова, О. 2002. Новата нормативна уредба и официалните институции.
Във: Владимиров, Ж. (Ред). 2002. Предприятията от ХВП на България:
конкурентоспособност в условия на институционална промяна. София,
„Прим Трейд‖, с. 18-38
Национално представително изследване сред предприятията в нефинансовия сектор, проведено от НОЕМА през юни 2009 г.; извадка 1000 предприятия.
130
Analysis of the situation and factors for development of SMEs,
prepared by BSMEPA and NOEMA, 2011
Национално представително изследване сред предприятията в нефинансовия сектор, проведено от НОЕМА през май 2010 г.; извадка 1000 предприятия.
Национално представително изследване сред предприятия в сектор „Производство на храни‖, проведено от НОЕМА и ДЖОБ ТАЙГЪР през януари 2010 г.; извадка 300 предприятия.
Национално представително изследване сред малките и средните предприятия, проведено от НОЕМА през февруари 2011 г.; извадка 300 фирми.
Aerts, K. and T. Schmidt, 2008, Two for the price of one? On additionality effects of R&D subsidies: A comparison between Flanders and Germany, Research Policy, 37, 5, 806-822.
Bakker M., Klapper L. and Udell G., 2004, Financing Small and Medium-Size Enterprises with Factoring: Global Growth and Its Potential in Eastern Europe, World Bank Policy Research Working Paper No. 3342.
Belderbos, R., Carree, M., Diederen, B., Lokshin, B. and R. Veugelers, 2004, Heterogeneity in R&D Cooperation Strategies, International Journal of Industrial Organisation, 22, 8-9, 1237-1263.
Berger A. and Udell G., 1998, The Economics of Small Business Finance: The Roles of Private Equity and Debt Markets in the Financial Growth Cycle, Journal of Banking and Finance, Volume 22, pp. 613-673
Berger A. and Udell G., 2000, Small Business and Debt Finance, as in Zoltán J. Ács, David B. Audretsch, 2003, Handbook of Entrepreneurship Research, Springer
Berger A. and Udell G., 2002, Small Business Credit Availability And Relationship Lending: The Importance Of Bank Organisational Structure, The Economic Journal, 112 (February), F32-F53
Berger, A. and Udell G., 2005, A More Complete Conceptual Framework for Financing of Small and Medium Enterprises, World Bank Policy Research Working Paper No. 3795
Bilton, C. and Cummings, S. (2010), Creative Strategy: Reconnecting Business and Innovation, John Wiley & Sons, Chichester.
Carlin W. and Mayer C, 2003, Finance, investment, and growth , Journal of Financial Economics 69 (2003) 191–226
Chelliah S. and Sulaiman, M. (2010) ―Internationalization and Performance: Small and Medium Enterprises (SMEs) in Malaysia‖, International Journal of Business and Management, Vol. 5, No.6, June 2010.
Chilosi, A. 2001. Entrepreneurship and Transition, Moct-Most, 11, pp. 327-357.
Colombo, M., Giannangeli, S. and Grilli, L. (2008), ―A longitudinal analysis of public financing and the growth of New Technology-based Firms: do firms‘ age and applicants‘ evaluation methods matter?‖, Unpublished Manuscript
Czarnitzki, D. and Aerts, K. (2004), ―Using innovation survey data to evaluate R&D policy: The case of Belgium‖, ZEW Discussion Paper 04-55, Mannheim
Damanpour, F. (1991). Organizational innovation: A meta-analysis of effects of determinants and moderators. Academy of Management Journal, 34 (3), 555–590.
Demirguc-Kunt A. and Maksimovic V., 2001, Firms as Financial Intermediaries: Evidence from Trade Credit Data, World Bank Policy Research Working Paper No. 2696
Djankov S., McLiesh C. and Shleifer A., 2004, Private Credit in 129 Countries, Available at SSRN: http://ssrn.com/abstract=637301
Doing Business 2010 report, June 2008-May 2009, (http://www. doingbusiness.org/economyrankings)
EC, 2004a, Internationalisation of SMEs, Observatory of European SMEs, 2003, No. 4
Bibliography

131
Analysis of the situation and factors for development of SMEs,
prepared by BSMEPA and NOEMA, 2011
EC, 2004б, Innovation Management in the Knowledge - Driven Economy, ECSC-EC-EAEC Brussels-Luxembourg,(ftp://ftp.cordis.europa.eu/pub/ innovation-policy/studies/studies_innovation_management_ final_ report.pdf
EC, 2010, European SMEs under Pressure, Annual Report on EU SMEs 2009, Directorate –General for Enterprise and Industry, 11/05/10 DGENTR-AnnualReport2010_100511.indd 1,
Eurobank EFG: Фискалната дисциплина подобрява шансовете на България за ERM II,http://www.dnevnik.bg/pazari/2010/03/02/867029_ eurobank _efg_fiskalnata _disciplina_podobriava/
European Central Bank, (2010), Survey on the access of SMEs in the euro-areas (March to September 2010), (http://www.ecb.int/pub/pdf/other/ accesstofinancesmallmediumsized enterprises 201010en.pdf)
Feige, E.L. 1997. Underground Activity and Institutional Change: Productive, Protective and Predatory Behaviour in Transition Economies, in Nelson, J. M., Tilly, C. and Walker, L. (Eds.), Transforming Post-Communist Political Economies, Washington D.C., National Academy Press, pp. 21-34.
Freeman, C., Soete, L., 1997. The Economics of Industrial Innovation, Third ed., Pinter.
Gregory B., Rutherford M., Oswald S. and Gardiner L., 2005, An Empirical Investigation of the Growth Cycle Theory of Small Firm Financing, Journal of Small Business Management 2005 43(4), pp. 382–392
Hadjimanolis, A., 1999, ―Barriers to innovation for SMEs in a small less developed country (Cyprus)‖, Technovation, Vol. 19, pp. 561-70.
Humphrey, J., Shmitz, H. 2002. Developing country firms in the world economy. Governance and upgrading in global value chains, INEF Report, 61, Duiburg
Hurley, R., & Hult, G. T. M. (1998, July). Innovation, market orientation, and organizational learning: An integration and empirical examination. Journal of Marketing, 62, 42– 54.
Jensen M. and Meckling W., 1976, Theory of the Firm: Managerial Behavior, Agency Costs and Ownership Structure, Journal of Financial Economics, v3, n4, 305-60.
Jensen M., 1986, Agency Cost Of Free Cash Flow, Corporate Finance, and Takeovers, American Economic Review, Vol. 76, No. 2
Kanter, R. (1999), "From spare change to real change: the social sector as beta site for business innovation", Harvard Business Review, Vol. 77 No.3, pp.122-32.
Klapper L., Sarria-Allende V. and Sulla V., 2002, Small- and Medium-Size Enterprise
Financing in Eastern Europe, World Bank Policy Research Working Paper No. 2933.
La Porta R., Lopez de Silanes F., Shleifer A. and Vishny R., 1997, Legal
Determinants of External Finance, NBER Working Paper No. W5879
McEvily, S.K., Eisenhardt, K.M., Prescott, J.E., 2004. The global acquisition,
leverage, and protection of technological competencies. Strategic Management
Journal 25, 713–722.
Myers S. and Majluf N. S., 1984, Corporate Financing and Investment Decisions
When Firms Have Information That Investors Do Not Have, Journal of Financial
Economics, v13, n2, 187-221.
Myers S., 1977, Determinants of Corporate Borrowing, Journal of Financial
Economics, v5, n2 147-75.
Nivorozhkin E., 2004, The Dynamics of Capital Structure in Transition Economies,
Journal Economics of Planning, Volume 37, Number 1, Pages 25-45
OECD, 1997, Globalization and Small and Medium Enterprises (SMEs), Organization
for Economic Co-operation and Development, Paris.
Bibliography
132
Analysis of the situation and factors for development of SMEs,
prepared by BSMEPA and NOEMA, 2011
OECD, 2007, Framework for the Evaluation of SMEs and Entrepreneurship Policies
and Programmes, Paris
Porter, M.E. and Stern, S., 1999, The New Challenge to America‘s Prosperity:
Findings from the Innovation Index, Council on Competitiveness, Washington, DC.
Porter, M.E., 1990. The Competitive Advantage of Nations. Macmillan, New York.
Porter, M.E., 1998. On Competition. Harvard Business School, Boston, MA.
Schumpeter, J.A. 1961, The theory of economic development : an inquiry into profits, capital, credit, interest, and the business cycle. Translated from the German by Redvers Opie (1961) New York: OUP
Senge, P.M., Carstedt, G., 2001. Innovating our way to the next industrial
revolution. MIT Sloan Management Review 42, 24-38 (Winter 2001).
Shoham, A., Fieganbaum, A., 2002. Competitive determinants of organizational
risk-taking attitude: the role of strategic reference points. Management Decision 40
(2), 127–141.
Smallbone, D., F. Welter. 2001. The distinctiveness of entrepreneurship in
transition economies, Small Business Economics, Vol. 16 pp. 249 — 262
Stiglitz J. and Weiss A., 1981, Credit Rationing in Markets with Imperfect
Information, American Economic Review, American Economic Association, vol.
71(3), pages 393-410, June.
Storey, David J., 1994, Understanding the Small Business Sector, London:
Routledge.
Takalo, T., Tanayama, T. Toivanen, O., 2007, Selection or self-rejection?
Applications into a voluntary treatment program: the case of R&D subsidies, HECER
DP, Helsinki.
The World Bank. 2002. Building Institutions for Markets. World Development Report
2002. WB, Washington, D.C
Tidd, J., Bessant, J., Pavitt, K., 1997. Managing Innovation. Integrating
Technological, Market and Organizational Change. Wiley, New York.
Titman S. and Wessels R., 1988, The Determinants of Capital Structure Choice, The
Journal of Finance, Vol. 43, No. 1, pp. 1-19.
R. Veugelers, R. (2008), The Role of SMEs in Innovation in the EU: A Case for Policy
Intervention?, Review of Business and Economics, Volume LIII, No 3, July-
September 2008, pp.239-262,
Welch, L. S. and Luostarinen, R. K (1988) ‗Internationalization: Evolution of a
Concept‘, Journal of General Management 14 (2), pp. 34-55.
Westhead, P., Wright, M. and Ucbasaran, D. (2002) ‗International Market Selection
Strategies Selected by ―Micro‖ and ―Small‖ Firms‘, Omega, International Journal of
Management Science 30(1), pp. 51-68.
Wild, J.J., Wild, K.L. and Han, J.C.Y. (2007), International Business: An Integrated
Approach, Prentice-Hall, New York, NY.
Xheneti, M., D. Smallbone. 2008. The Role of Public Policy in Entrepreneurship
Development in Post-Socialist Countries: A Comparison of Albania and Estonia, EBS
Review, No 24 (1), pp. 23-37
Bibliography

133
Analysis of the situation and factors for development of SMEs,
prepared by BSMEPA and NOEMA, 2011
Annex
Microeconomic indicators for the performance of SME sector
Table 27 Matrix with microeconomic indicators for the sector performance,
2009-2011
No Indicator Measure Value
І Promotion of entrepreneurship and favorable business environment
1 Penetration of entrepreneurship (presence of own business) among the population
% 6
2 Awareness of the CM portal for public consultation % 10
3 Access to information about programs and funds to aid SMEs
% 12
4 Access to information about beneficial practices in management
% 12
5 Access to information about international markets % 6
6 Participation in tenders % 10
7 Winning tenders % 6
8 Average time, spent for administrative procedures hours /year 52
9 Negative effect of informal sector over company‘s activities
% 27
10 Encounter of corruption % 13
11 Age of entrepreneur (average) years 46
12 Years of entrepreneurship experience (average) years 14
13 Attitude towards a second attempt in case of insolvency
% 63
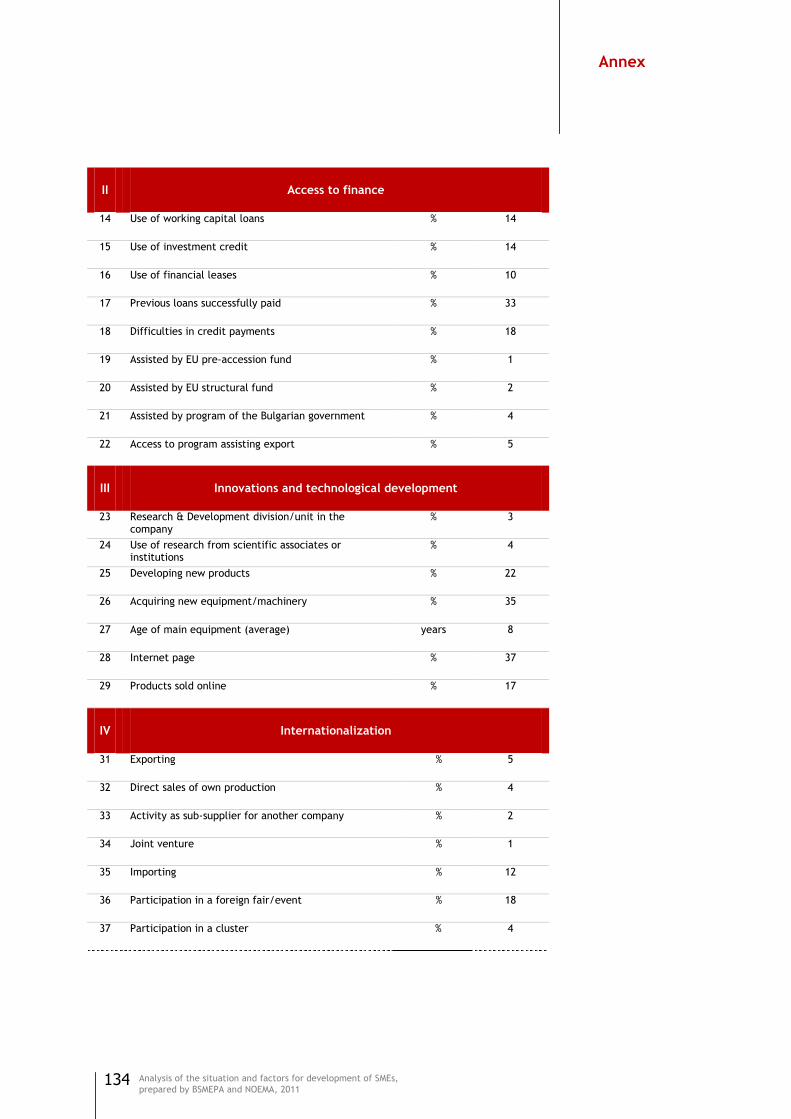
134
Analysis of the situation and factors for development of SMEs,
prepared by BSMEPA and NOEMA, 2011
ІІ Access to finance
14 Use of working capital loans % 14
15 Use of investment credit % 14
16 Use of financial leases % 10
17 Previous loans successfully paid % 33
18 Difficulties in credit payments % 18
19 Assisted by EU pre-accession fund % 1
20 Assisted by EU structural fund % 2
21 Assisted by program of the Bulgarian government % 4
22 Access to program assisting export % 5
ІІІ Innovations and technological development
23 Research & Development division/unit in the company
% 3
24 Use of research from scientific associates or institutions
% 4
25 Developing new products % 22
26 Acquiring new equipment/machinery % 35
27 Age of main equipment (average) years 8
28 Internet page % 37
29 Products sold online % 17
ІV Internationalization
31 Exporting % 5
32 Direct sales of own production % 4
33 Activity as sub-supplier for another company % 2
34 Joint venture % 1
35 Importing % 12
36 Participation in a foreign fair/event % 18
37 Participation in a cluster % 4
Annex

135
Analysis of the situation and factors for development of SMEs,
prepared by BSMEPA and NOEMA, 2011
V Intellectual property
38 Registered trademark in Bulgaria % 10
39 Registered trademark abroad % 6
40 Registered patent in Bulgaria % 8
41 Registered patent abroad % 2
VІ Sustainability and best practices
42 Use of renewable source energy % 2
43 Use of nanotechnology % 1
44 Introduced standards (quality/management/environment/etc)
% 46
45 Introduced systems for management of company processes
% 18
46 Investment in marketing and advertisement % 30
47 Staff training % 31
48 Relations with educational institutions % 13
49 Midterm activity planning % 16
50 Long-term activity planning % 3
Annex

136
Analysis of the situation and factors for development of SMEs,
prepared by BSMEPA and NOEMA, 2011
Main macroeconomic indicators
Table 28 Macroeconomic indicators in Bulgaria, 2002-2009
2002 2003 2004 2005 2006 2007 2008 2009 2010
Real sector
GDP
GDP (million EUR) 16969 18310 20361 23255 26476 30772 35430 34932 36033
GDP (real growth) 4.7% 5.5% 6.7% 6.4% 6.5% 6.4% 6.2% -5.5% 0.2%
Final consumpsion (real growth ) 3.1% 7.2% 6.8% 5.3% 7.5% 7.2% 2.6% -7.3% -1.1%
Fixed investment (real growth ) 7.6% 13.0% 13.7% 30.7% 13.1% 11.8% 21.9% -17.6% -16.5%
Export (real growth ) 9.8% 10.6% 11.9% -17.5% 50.7% 6.1% 3.0% -11.2% 16.3%
Import (real growth ) 6.8% 16.7% 13.9% -7.6% 47.7% 9.6% 4.2% -21.0% 4.5%
Inflation
Inflation rate at the end of the year 3.8% 5.6% 4.0% 6.5% 6.5% 12.5% 7.8% 0.6% 4.5%
Annual average inflation 5.8% 2.3% 6.1% 5.0% 7.3% 8.4% 12.3% 2.8% 2.4%
Unemployment
Unemployment rate at the end of the year 16.3% 13.5% 12.2% 10.7% 9.1% 6.9% 6.3% 9.1% 11.2%
Industry
Industrial production index (2005 г. = 100) 73.3 82.9 93.5 100.0 106.0 116.2 117.0 95.6% 97.6
Industrial turnover index (2005 г. = 100) 71.9 75.3 90.2 100.0 119.1 137.0 155.8 123.8% 141.3
External sector
BOP
Current Account (million EUR) -403.1 -973.3 -1307.0 -2706.2 -4647.5 -7755.0 -8162.4 -3118.2 -356.2
Current Account, percentage of GDP -2.4% -5.3% -6.4% -11.6% -17.6% -25.2% -23.0% -8.9% -1.0%
Trade balance (million EUR) -1878 -2426 -2954 -4410 -5562 -7245 -8597 -4173 -2412.5
Trade balance , percentage of GDP -11.1% -13.2% -14.5% -19.0% -21.0% -23.5% -24.3% -11.9% -6.7%
Export F.O.B., million EUR 6063 6668 7985 9466 12012 13512 15277 11700 15588
Import F.O.B., million EUR 7941 9094 10938 13876 17574 20757 24036 15873 18001
Forex reserves of BNB, million EUR 4575 5309 6770 7370 8926 11937 12713 12919 12977
Forex reserves of BNB / import from SNFU, in months 5.6 5.7 6.0 5.3 5.1 5.8 5.3 8.0 7.3
Foreign Direct investments, million EUR
980 1851 2736 3152 6222 9052 6728 2412
1638.4
Foreign direct investments, percentage of GDP
5.8% 10.1% 13.4% 13.6% 23.5% 29.4% 19.0% 6.9%
4.5%
Fiscal sector
Goverment Budget
Government deficit/surplus, million EUR -131.4 0.5 337.5 692.7 893.5 1001.9 1017.4 -270.7 2783.4
Government deficit/surplus, percentage of GDP -0.8% 0.0% 1.7% 3.0% 3.4% 3.3% 2.9% -0.8% -3.9%
Government dept
Government dept, million EUR 9283.5 8430.5 7954.3 6844.4 6199.9 5709.7 5465.0 5440.6 6020.6
Government dept, percentage of GDP 55.7% 48.1% 40.1% 31.3% 24.6% 19.8% 16.1% 16.1% 16.7%
Financial sector
Monetary report
Broad money, million EUR 7085 8471 10427 12915 16393 21506 23406 24384 25884
Credit to NGO , million EUR 3149 4641 6876 9214 11398 18656 24713 25599 25903
Interest rates
Main Interest rate at the end of the year 3.31% 2.83% 2.37% 2.05% 3.26% 4.58% 5.77% 0.55% 0.2%
SOURCE: NSI, Employment Agency, BNB, Bulgarian stock exchange —Sofa.
Annex
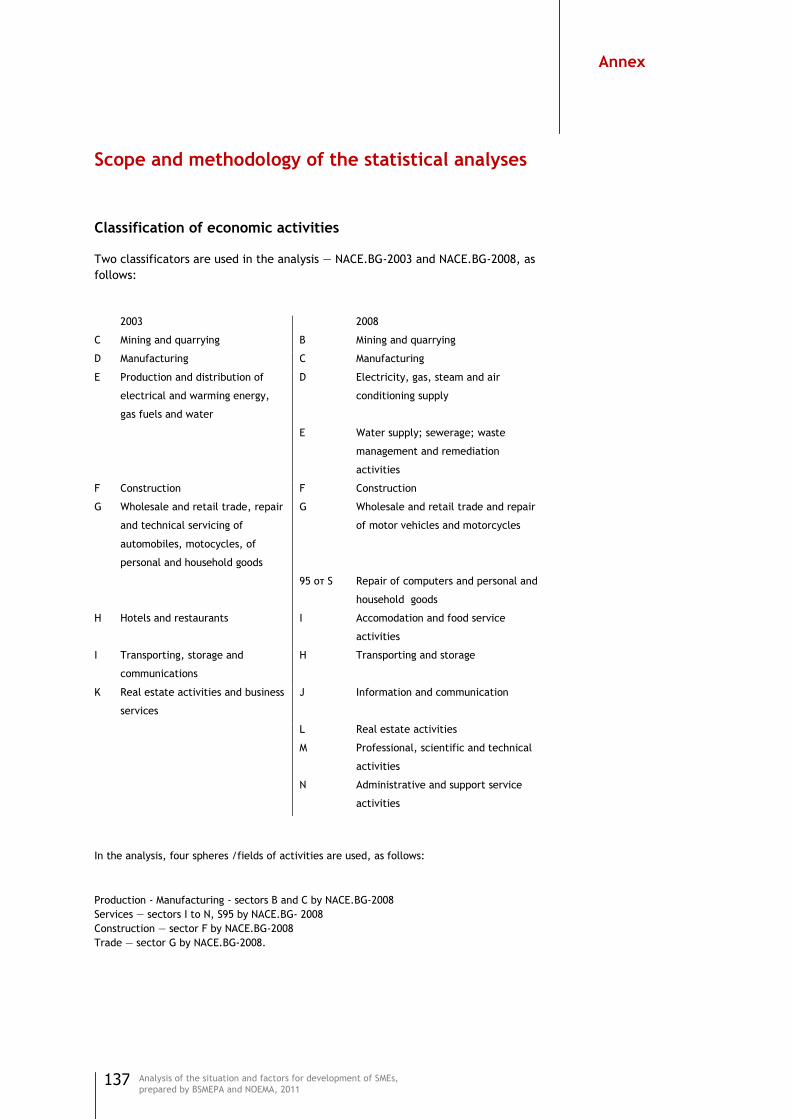
137
Analysis of the situation and factors for development of SMEs,
prepared by BSMEPA and NOEMA, 2011
Scope and methodology of the statistical analyses
Classification of economic activities
Two classificators are used in the analysis — NACE.BG-2003 and NACE.BG-2008, as
follows:
2003 2008
С Mining and quarrying В Mining and quarrying
D Manufacturing С Manufacturing
Е Production and distribution of
electrical and warming energy,
gas fuels and water
D Electricity, gas, steam and air
conditioning supply
Е Water supply; sewerage; waste
management and remediation
activities
F Construction F Construction
G Wholesale and retail trade, repair
and technical servicing of
automobiles, motocycles, of
personal and household goods
G Wholesale and retail trade and repair
of motor vehicles and motorcycles
95 от S Repair of computers and personal and
household goods
Н Hotels and restaurants I Accomodation and food service
activities
I Transporting, storage and
communications
H Transporting and storage
K Real estate activities and business
services
J Information and communication
L Real estate activities
M Professional, scientific and technical
activities
N Administrative and support service
activities
In the analysis, four spheres /fields of activities are used, as follows:
Production - Manufacturing - sectors В and С by NACE.BG-2008
Services — sectors I to N, S95 by NACE.BG- 2008
Construction — sector F by NACE.BG-2008
Trade — sector G by NACE.BG-2008.
Annex
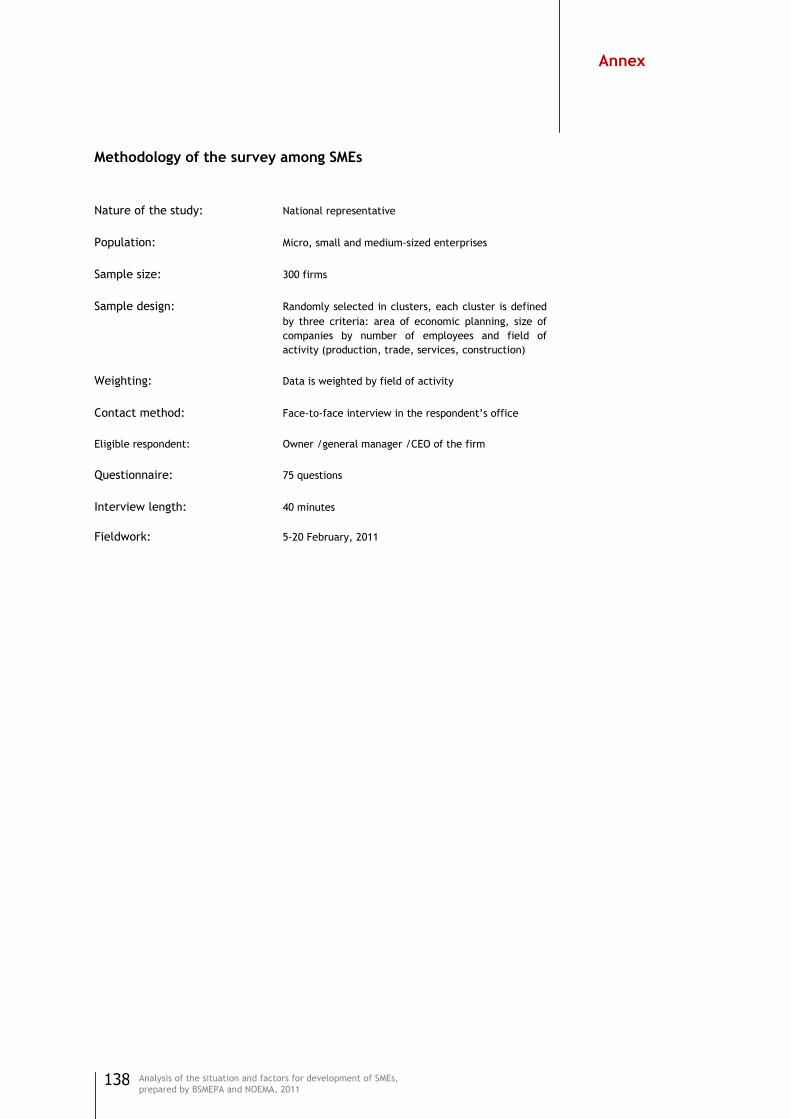
138
Analysis of the situation and factors for development of SMEs,
prepared by BSMEPA and NOEMA, 2011
Methodology of the survey among SMEs
Nature of the study: National representative
Population: Micro, small and medium-sized enterprises
Sample size: 300 firms
Sample design: Randomly selected in clusters, each cluster is defined
by three criteria: area of economic planning, size of
companies by number of employees and field of
activity (production, trade, services, construction)
Weighting: Data is weighted by field of activity
Contact method: Face-to-face interview in the respondent‘s office
Eligible respondent: Owner /general manager /CEO of the firm
Questionnaire: 75 questions
Interview length: 40 minutes
Fieldwork: 5-20 February, 2011
Annex
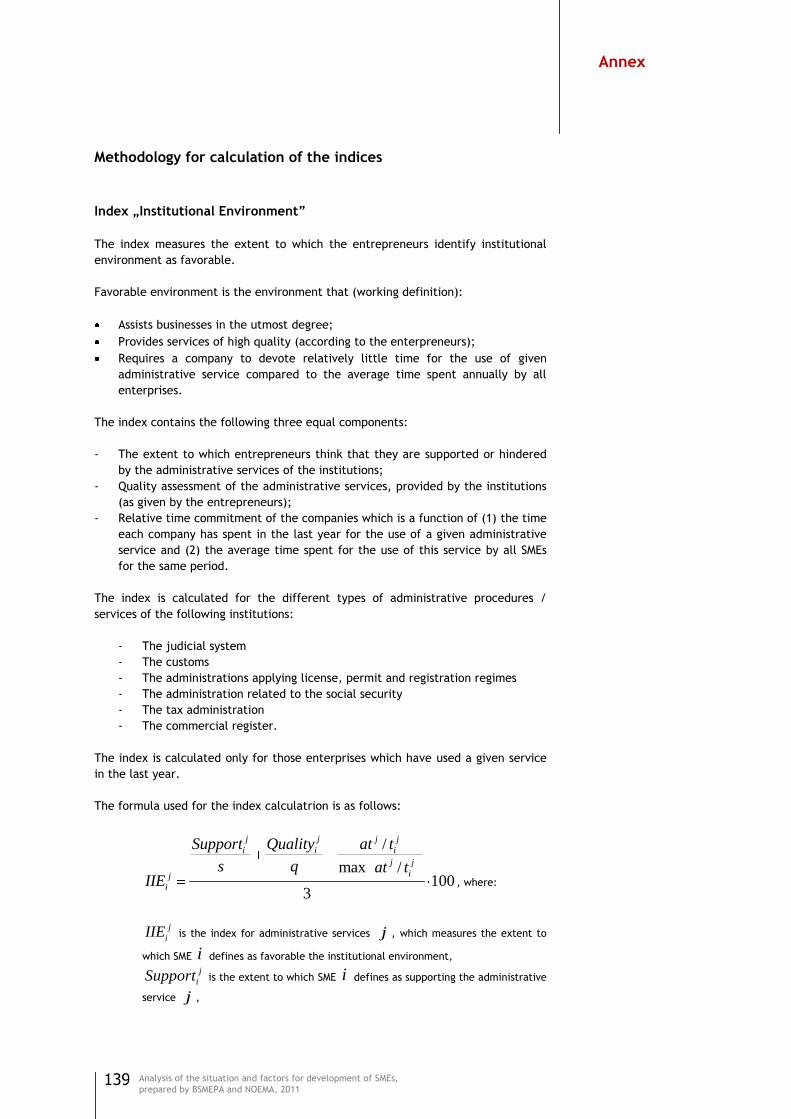
139
Analysis of the situation and factors for development of SMEs,
prepared by BSMEPA and NOEMA, 2011
Methodology for calculation of the indices
Index „Institutional Environment”
The index measures the extent to which the entrepreneurs identify institutional
environment as favorable.
Favorable environment is the environment that (working definition):
Assists businesses in the utmost degree;
Provides services of high quality (according to the enterpreneurs);
Requires a company to devote relatively little time for the use of given
administrative service compared to the average time spent annually by all
enterprises.
The index contains the following three equal components:
‐ The extent to which entrepreneurs think that they are supported or hindered
by the administrative services of the institutions;
‐ Quality assessment of the administrative services, provided by the institutions
(as given by the entrepreneurs);
‐ Relative time commitment of the companies which is a function of (1) the time
each company has spent in the last year for the use of a given administrative
service and (2) the average time spent for the use of this service by all SMEs
for the same period.
The index is calculated for the different types of administrative procedures /
services of the following institutions:
‐ The judicial system
‐ The customs
‐ The administrations applying license, permit and registration regimes
‐ The administration related to the social security
‐ The tax administration
‐ The commercial register.
The index is calculated only for those enterprises which have used a given service
in the last year.
The formula used for the index calculatrion is as follows:
/
max /100
3
j j j j
i i i
j j
ij
i
Support Quality at t
s q at tIIE , where:
j
iIIE is the index for administrative services j , which measures the extent to
which SME i defines as favorable the institutional environment,
j
iSupport is the extent to which SME i defines as supporting the administrative
service j ,
Annex
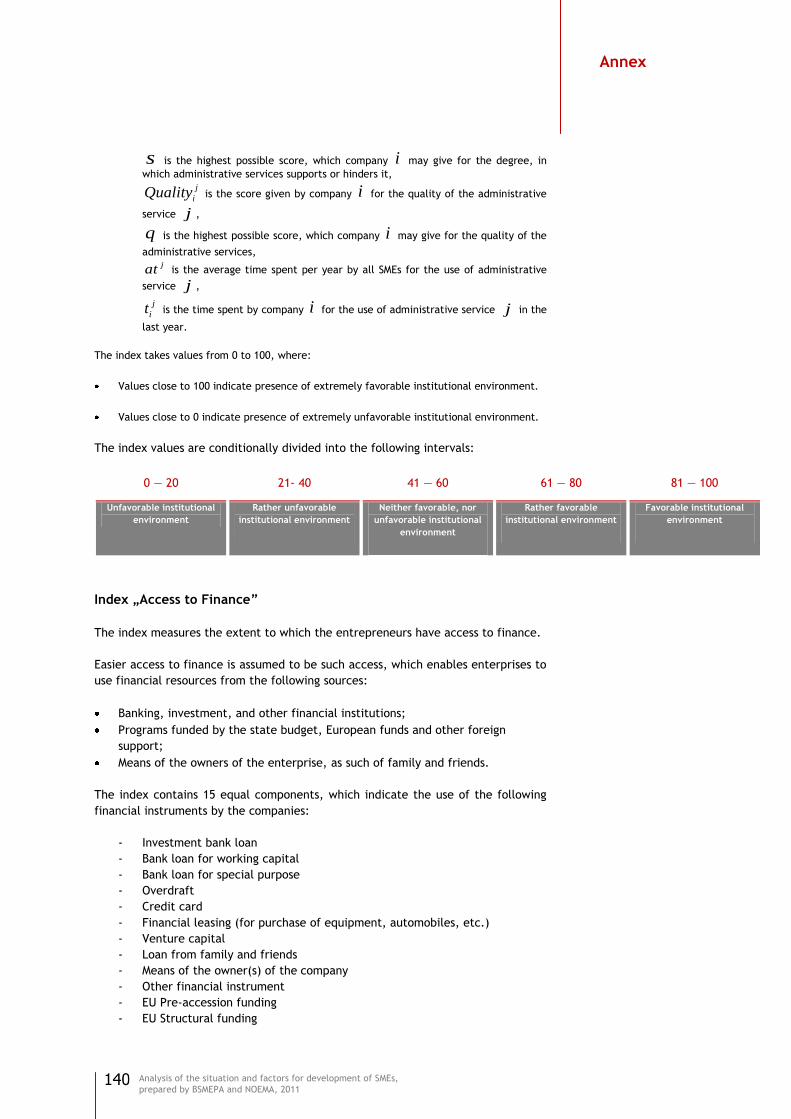
140
Analysis of the situation and factors for development of SMEs,
prepared by BSMEPA and NOEMA, 2011
s is the highest possible score, which company i may give for the degree, in
which administrative services supports or hinders it,
j
iQuality is the score given by company i for the quality of the administrative
service j ,
q is the highest possible score, which company i may give for the quality of the
administrative services, jat is the average time spent per year by all SMEs for the use of administrative
service j ,
j
it is the time spent by company i for the use of administrative service j in the
last year.
The index takes values from 0 to 100, where:
Values close to 100 indicate presence of extremely favorable institutional environment.
Values close to 0 indicate presence of extremely unfavorable institutional environment.
The index values are conditionally divided into the following intervals:
0 — 20 21- 40 41 — 60 61 — 80 81 — 100
Unfavorable institutional
environment
Rather unfavorable
institutional environment
Neither favorable, nor
unfavorable institutional
environment
Rather favorable
institutional environment
Favorable institutional
environment
Index „Access to Finance”
The index measures the extent to which the entrepreneurs have access to finance.
Easier access to finance is assumed to be such access, which enables enterprises to
use financial resources from the following sources:
Banking, investment, and other financial institutions;
Programs funded by the state budget, European funds and other foreign
support;
Means of the owners of the enterprise, as such of family and friends.
The index contains 15 equal components, which indicate the use of the following
financial instruments by the companies:
‐ Investment bank loan
‐ Bank loan for working capital
‐ Bank loan for special purpose
‐ Overdraft
‐ Credit card
‐ Financial leasing (for purchase of equipment, automobiles, etc.)
‐ Venture capital
‐ Loan from family and friends
‐ Means of the owner(s) of the company
‐ Other financial instrument
‐ EU Pre-accession funding
‐ EU Structural funding
Annex

141
Analysis of the situation and factors for development of SMEs,
prepared by BSMEPA and NOEMA, 2011
‐ Programme funded by the state budget (of the Government, a Ministry, a
State Agency, etc.)
‐ State programmes of third parties (other countries)
‐ Other support received.
The index considers whether the companies have used each financial instrument in
the last year. The formula used for the calculation of the index is as follows:
Pr
100max( Pr )
n m k
i i i
n m ki n m k
n m k
FinInstrument ogramme FamilyFriends
IAFFinInstrument ogramme FamilyFriends
where:
iIAF is the index of access to finance for entrepreneur i ,
n
iFinInstrument measures whether the enterpreneur i uses financial
instrument n , provided by banking, investment and other financial institutions,
Pr m
iogramme measures whether the enterpreneur i uses funding program m, granted by the Government, the EU funds and third parties,
k
iFamilyFriends measures whether the enterpreneur i uses loans from
source k , received by the owner(s) of the enterprise, family and friends.
The index takes values from 0 to 100, where:
Values close to 100 indicate presence of extremely easier access to finance, which
allows SMEs to freely use all different sources.
Values close to 0 indicate presence of extremely difficult access to finance, which does
not allow entrepreneurs to use no financial resources at all.
The index values can be divided into the following intervals:
0 — 20 21- 40 41 — 60 61 — 80 81 — 100
Very difficult access Difficult access Neither difficult, nor easy
access
Easy access Very easy access
Index „Innovation Activity”
The index measures the extent to which entrepreneurs pursue innovation.
Innovation activities include (working definition):
Establishment of innovation infrastructure in the enterprise
Development of new products and issuing them on the market
The index contains the following two equal components:
‐ Availability of innovation infrastructure in the enterprise;
‐ Availability of development of new products.
The index is calculated based on the following types of internal firm‘s activities:
Annex
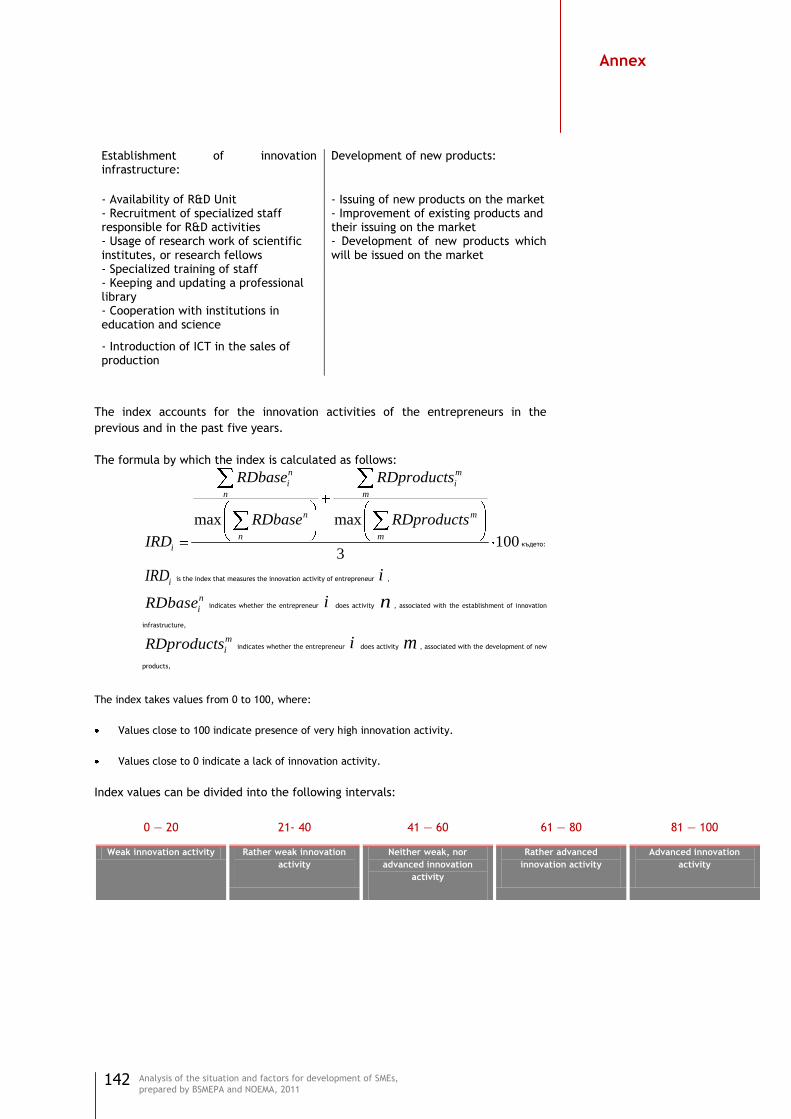
142
Analysis of the situation and factors for development of SMEs,
prepared by BSMEPA and NOEMA, 2011
Establishment of innovation infrastructure:
Development of new products:
- Availability of R&D Unit - Issuing of new products on the market - Recruitment of specialized staff responsible for R&D activities
- Improvement of existing products and their issuing on the market
- Usage of research work of scientific institutes, or research fellows
- Development of new products which will be issued on the market
- Specialized training of staff - Keeping and updating a professional library
- Cooperation with institutions in education and science
- Introduction of ICT in the sales of production
The index accounts for the innovation activities of the entrepreneurs in the
previous and in the past five years.
The formula by which the index is calculated as follows:
max max
1003
n m
i i
n m
n m
n m
i
RDbase RDproducts
RDbase RDproducts
IRD където:
iIRD is the index that measures the innovation activity of entrepreneur i ,
n
iRDbase indicates whether the entrepreneur i does activity n , associated with the establishment of innovation
infrastructure,
m
iRDproducts indicates whether the entrepreneur i does activity m , associated with the development of new
products,
The index takes values from 0 to 100, where:
Values close to 100 indicate presence of very high innovation activity.
Values close to 0 indicate a lack of innovation activity.
Index values can be divided into the following intervals:
0 — 20 21- 40 41 — 60 61 — 80 81 — 100
Weak innovation activity Rather weak innovation
activity
Neither weak, nor
advanced innovation
activity
Rather advanced
innovation activity
Advanced innovation
activity
Annex
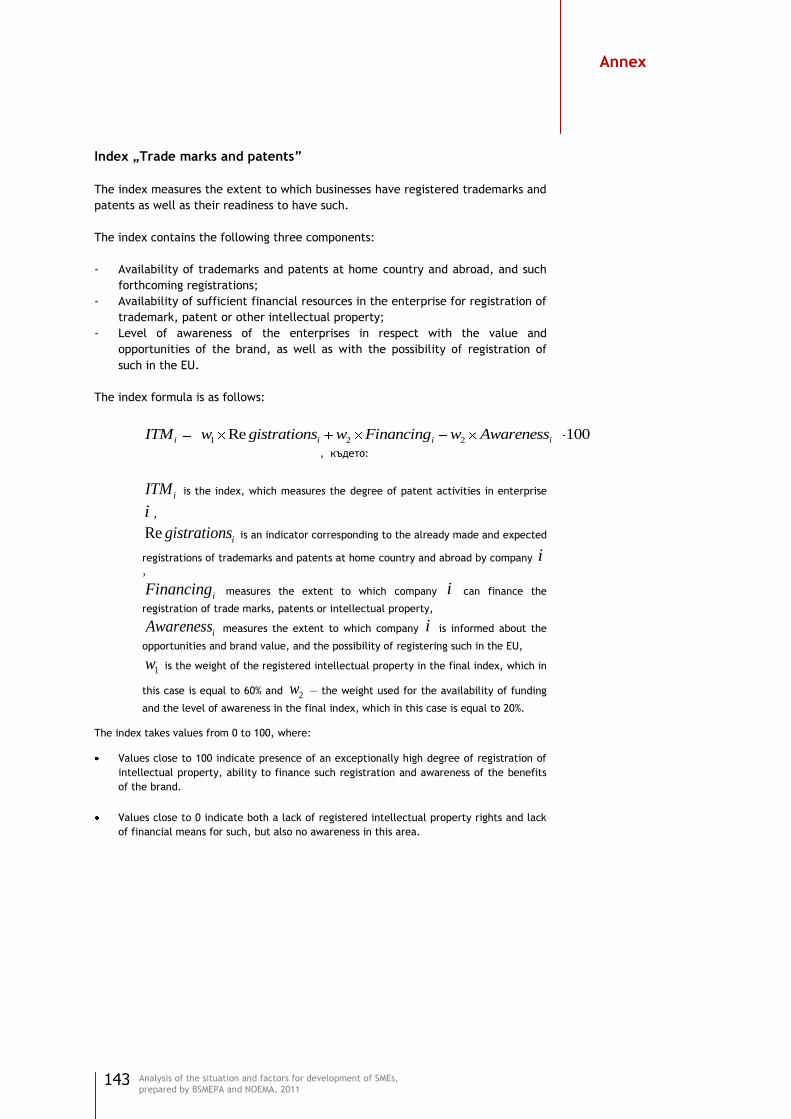
143
Analysis of the situation and factors for development of SMEs,
prepared by BSMEPA and NOEMA, 2011
Index „Trade marks and patents”
The index measures the extent to which businesses have registered trademarks and
patents as well as their readiness to have such.
The index contains the following three components:
‐ Availability of trademarks and patents at home country and abroad, and such
forthcoming registrations;
‐ Availability of sufficient financial resources in the enterprise for registration of
trademark, patent or other intellectual property;
‐ Level of awareness of the enterprises in respect with the value and
opportunities of the brand, as well as with the possibility of registration of
such in the EU.
The index formula is as follows:
1 2 2Re 100i i i iITM w gistrations w Financing w Awareness
, където:
iITM is the index, which measures the degree of patent activities in enterprise
i ,
Re igistrations is an indicator corresponding to the already made and expected
registrations of trademarks and patents at home country and abroad by company i,
iFinancing measures the extent to which company i can finance the
registration of trade marks, patents or intellectual property,
iAwareness measures the extent to which company i is informed about the
opportunities and brand value, and the possibility of registering such in the EU,
1w is the weight of the registered intellectual property in the final index, which in
this case is equal to 60% and 2w — the weight used for the availability of funding
and the level of awareness in the final index, which in this case is equal to 20%. The index takes values from 0 to 100, where:
Values close to 100 indicate presence of an exceptionally high degree of registration of
intellectual property, ability to finance such registration and awareness of the benefits
of the brand.
Values close to 0 indicate both a lack of registered intellectual property rights and lack
of financial means for such, but also no awareness in this area.
Annex
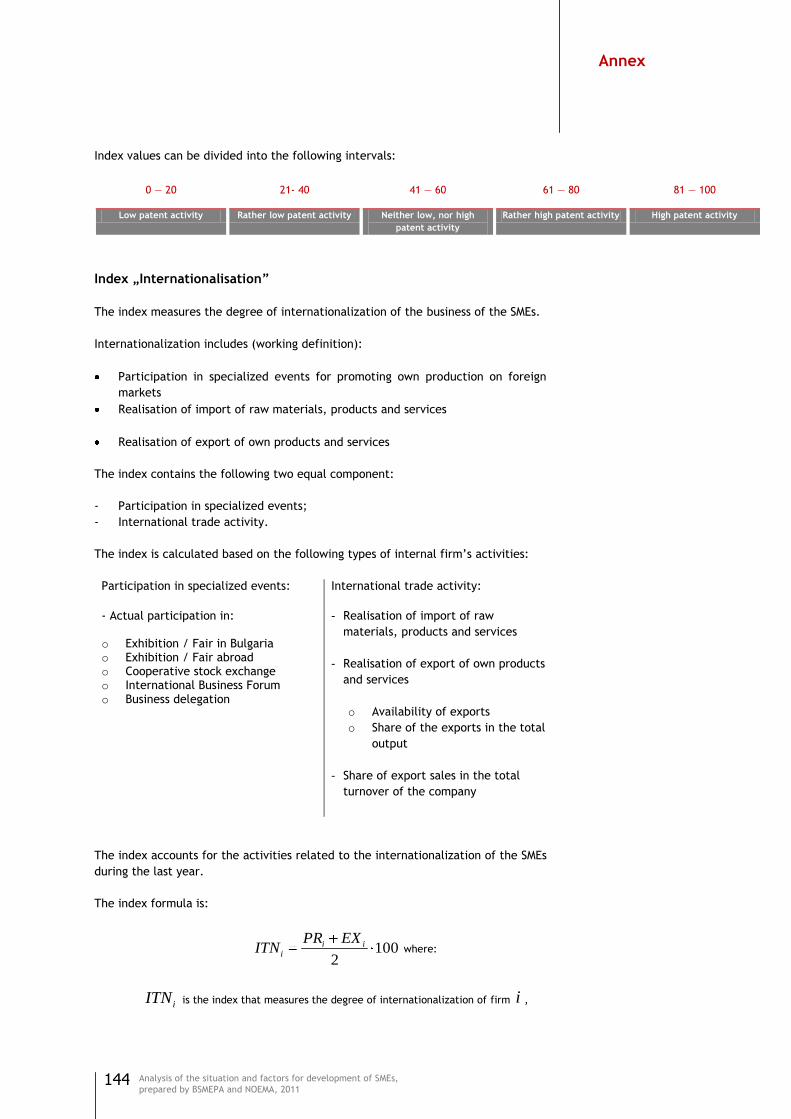
144
Analysis of the situation and factors for development of SMEs,
prepared by BSMEPA and NOEMA, 2011
Index values can be divided into the following intervals:
0 — 20 21- 40 41 — 60 61 — 80 81 — 100
Low patent activity Rather low patent activity Neither low, nor high
patent activity
Rather high patent activity High patent activity
Index „Internationalisation”
The index measures the degree of internationalization of the business of the SMEs.
Internationalization includes (working definition):
Participation in specialized events for promoting own production on foreign
markets
Realisation of import of raw materials, products and services
Realisation of export of own products and services
The index contains the following two equal component:
‐ Participation in specialized events;
‐ International trade activity.
The index is calculated based on the following types of internal firm‘s activities:
Participation in specialized events: International trade activity:
- Actual participation in: o Exhibition / Fair in Bulgaria o Exhibition / Fair abroad o Cooperative stock exchange o International Business Forum o Business delegation
- Realisation of import of raw
materials, products and services
- Realisation of export of own products
and services
o Availability of exports
o Share of the exports in the total
output
- Share of export sales in the total
turnover of the company
The index accounts for the activities related to the internationalization of the SMEs
during the last year.
The index formula is:
1002
i ii
PR EXITN where:
iITN is the index that measures the degree of internationalization of firm i ,
Annex

145
Analysis of the situation and factors for development of SMEs,
prepared by BSMEPA and NOEMA, 2011
iPR shows the promotion activities carried and is equal to:
max
m
i
mi
m
i
m
PR
PR
PR
,
iEX measures the degree of foreign trade and is equal to:
1 2
Im _ _
2 2
i i i ii
port Export Exp output Exp turnoverEX w w
, where 1w and 2w are respectively the weights (in this case assumed to be equal
respectively to 40% and 60%), Im iport and iExport indicate the presence of
relevant import and export _ iExp output is the export share of total production
in enterprise i , and _ iExp turnover — the share of turnover that comes from
exports. The index takes values from 0 to 100, such as:
Values close to 100 indicate presence of an exceptionally high degree of
internationalization.
Values close to 0 indicate absence of any internationalization of the company.
Index values can be divided into the following intervals:ниска стен на активност
по отношение на интелектуална собственост
0 — 20 21- 40 41 — 60 61 — 80 81 — 100
Low internationalisation Rather low
internationalisation
Neither low, nor high
internationalisation
Rather high
internationalisation
High internationalisation
ниска степен на активност по отношение на интелектуална собственост
Index „Best practices”
The index measures the degree of application of best practices by the SMEs.
Application of best practices includes (working definition):
Usage of modern ICT in the business activities
Implementation of strategies for the development of human resources
Development and implementation of market strategies.
The index contains the following three equal components:
‐ Level of usage of ICT (as a function of: (1) implementation of management
information systems and (2) application of internet technologies);
‐ Level of implementation of policies to improve staff qualifications (as a
function of: (1) assessment of staff qualifications and (2) availability of
trainings enhancing staff competences in the last year);
‐ Level of development and implementation of market strategies (as a function
of: (1) availability of short, medium and long term business plans and (2)
development and implementation of marketing strategies for domestic and
foreign markets).
The index is calculated based on the following types of intercompany activities:
Annex
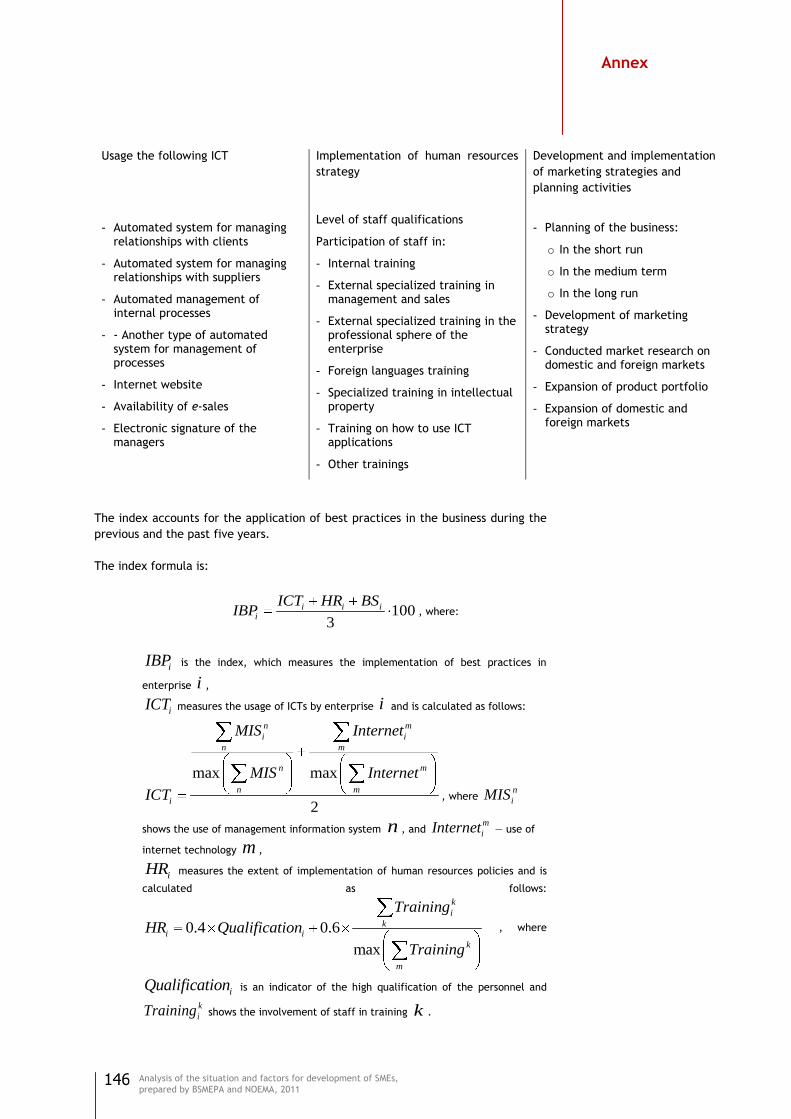
146
Analysis of the situation and factors for development of SMEs,
prepared by BSMEPA and NOEMA, 2011
Usage the following ICT Implementation of human resources
strategy
Development and implementation
of marketing strategies and
planning activities
- Automated system for managing relationships with clients
- Automated system for managing relationships with suppliers
- Automated management of internal processes
- - Another type of automated system for management of processes
- Internet website
- Availability of e-sales
- Electronic signature of the managers
Level of staff qualifications
Participation of staff in:
- Internal training
- External specialized training in management and sales
- External specialized training in the professional sphere of the enterprise
- Foreign languages training
- Specialized training in intellectual property
- Training on how to use ICT applications
- Other trainings
- Planning of the business:
o In the short run
o In the medium term
o In the long run
- Development of marketing strategy
- Conducted market research on domestic and foreign markets
- Expansion of product portfolio
- Expansion of domestic and foreign markets
The index accounts for the application of best practices in the business during the
previous and the past five years.
The index formula is:
1003
i i ii
ICT HR BSIBP , where:
iIBP is the index, which measures the implementation of best practices in
enterprise i ,
iICT measures the usage of ICTs by enterprise i and is calculated as follows:
max max
2
n m
i i
n m
n m
n m
i
MIS Internet
MIS Internet
ICT , where n
iMIS
shows the use of management information system n , and m
iInternet — use of
internet technology m ,
iHR measures the extent of implementation of human resources policies and is
calculated as follows:
0.4 0.6
max
k
i
ki i
k
m
Training
HR Qualification
Training
, where
iQualification is an indicator of the high qualification of the personnel and
k
iTraining shows the involvement of staff in training k .
Annex
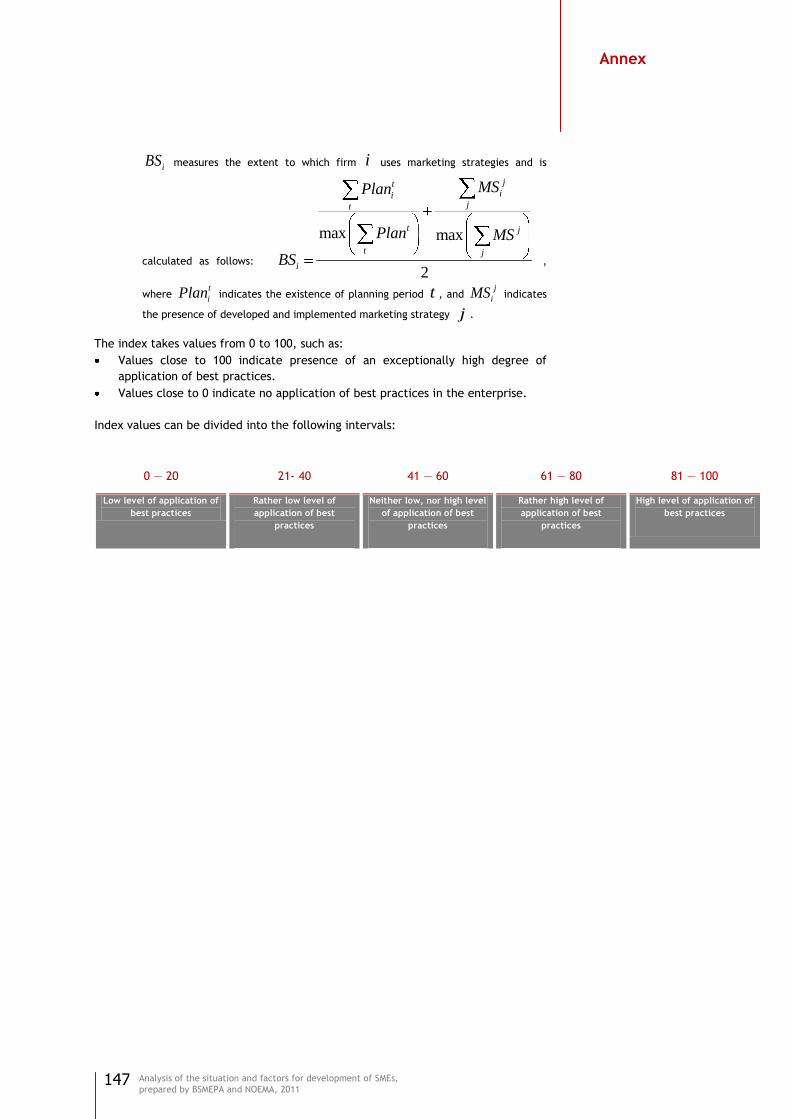
147
Analysis of the situation and factors for development of SMEs,
prepared by BSMEPA and NOEMA, 2011
iBS measures the extent to which firm i uses marketing strategies and is
calculated as follows:
max max
2
jtii
jt
t j
t j
i
MSPlan
Plan MS
BS ,
where t
iPlan indicates the existence of planning period t , and j
iMS indicates
the presence of developed and implemented marketing strategy j .
The index takes values from 0 to 100, such as:
Values close to 100 indicate presence of an exceptionally high degree of
application of best practices.
Values close to 0 indicate no application of best practices in the enterprise.
Index values can be divided into the following intervals:
0 — 20 21- 40 41 — 60 61 — 80 81 — 100
Low level of application of
best practices
Rather low level of
application of best
practices
Neither low, nor high level
of application of best
practices
Rather high level of
application of best
practices
High level of application of
best practices
Annex
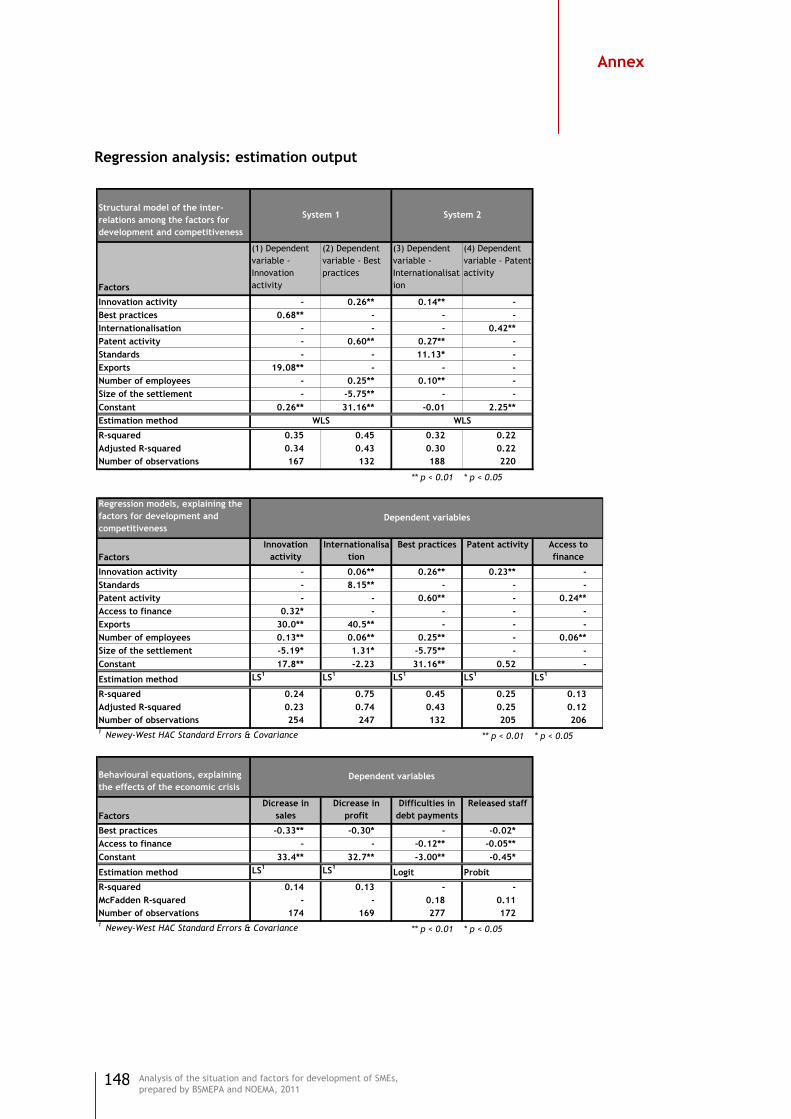
148
Analysis of the situation and factors for development of SMEs,
prepared by BSMEPA and NOEMA, 2011
Regression analysis: estimation output
Structural model of the inter-
relations among the factors for
development and competitiveness
Factors
(1) Dependent
variable -
Innovation
activity
(2) Dependent
variable - Best
practices
(3) Dependent
variable -
Internationalisat
ion
(4) Dependent
variable - Patent
activity
Innovation activity - 0.26** 0.14** -
Best practices 0.68** - - -
Internationalisation - - - 0.42**
Patent activity - 0.60** 0.27** -
Standards - - 11.13* -
Exports 19.08** - - -
Number of employees - 0.25** 0.10** -
Size of the settlement - -5.75** - -
Constant 0.26** 31.16** -0.01 2.25**
Estimation method
R-squared 0.35 0.45 0.32 0.22
Adjusted R-squared 0.34 0.43 0.30 0.22
Number of observations 167 132 188 220
** p < 0.01 * p < 0.05
Regression models, explaining the
factors for development and
competitiveness
Factors
Innovation
activity
Internationalisa
tion
Best practices Patent activity Access to
finance
Innovation activity - 0.06** 0.26** 0.23** -
Standards - 8.15** - - -
Patent activity - - 0.60** - 0.24**
Access to finance 0.32* - - - -
Exports 30.0** 40.5** - - -
Number of employees 0.13** 0.06** 0.25** - 0.06**
Size of the settlement -5.19* 1.31* -5.75** - -
Constant 17.8** -2.23 31.16** 0.52 -
Estimation method LS1
LS1
LS1
LS1
LS1
R-squared 0.24 0.75 0.45 0.25 0.13
Adjusted R-squared 0.23 0.74 0.43 0.25 0.12
Number of observations 254 247 132 205 2061 Newey-West HAC Standard Errors & Covariance ** p < 0.01 * p < 0.05
Behavioural equations, explaining
the effects of the economic crisis
Factors
Dicrease in
sales
Dicrease in
profit
Difficulties in
debt payments
Released staff
Best practices -0.33** -0.30* - -0.02*
Access to finance - - -0.12** -0.05**
Constant 33.4** 32.7** -3.00** -0.45*
Estimation method LS1
LS1
Logit Probit
R-squared 0.14 0.13 - -
McFadden R-squared - - 0.18 0.11
Number of observations 174 169 277 1721 Newey-West HAC Standard Errors & Covariance ** p < 0.01 * p < 0.05
WLS WLS
Dependent variables
Dependent variables
System 1 System 2
Annex
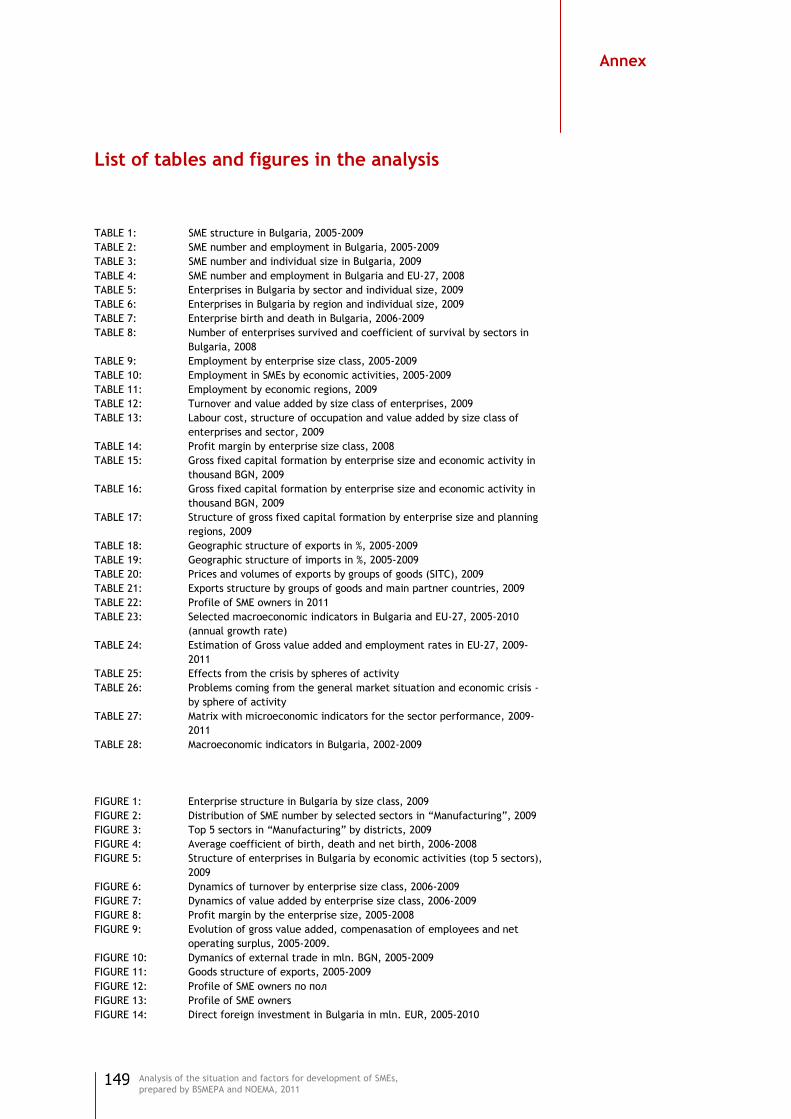
149
Analysis of the situation and factors for development of SMEs,
prepared by BSMEPA and NOEMA, 2011
List of tables and figures in the analysis
TABLE 1: SME structure in Bulgaria, 2005-2009
TABLE 2: SME number and employment in Bulgaria, 2005-2009
TABLE 3: SME number and individual size in Bulgaria, 2009
TABLE 4: SME number and employment in Bulgaria and EU-27, 2008
TABLE 5: Enterprises in Bulgaria by sector and individual size, 2009
TABLE 6: Enterprises in Bulgaria by region and individual size, 2009
TABLE 7: Enterprise birth and death in Bulgaria, 2006-2009
TABLE 8: Number of enterprises survived and coefficient of survival by sectors in
Bulgaria, 2008
TABLE 9: Employment by enterprise size class, 2005-2009
TABLE 10: Employment in SMEs by economic activities, 2005-2009
TABLE 11: Employment by economic regions, 2009
TABLE 12: Turnover and value added by size class of enterprises, 2009
TABLE 13: Labour cost, structure of occupation and value added by size class of
enterprises and sector, 2009
TABLE 14: Profit margin by enterprise size class, 2008
TABLE 15: Gross fixed capital formation by enterprise size and economic activity in
thousand BGN, 2009
TABLE 16: Gross fixed capital formation by enterprise size and economic activity in
thousand BGN, 2009
TABLE 17: Structure of gross fixed capital formation by enterprise size and planning
regions, 2009
TABLE 18: Geographic structure of exports in %, 2005-2009
TABLE 19: Geographic structure of imports in %, 2005-2009
TABLE 20: Prices and volumes of exports by groups of goods (SITC), 2009
TABLE 21: Exports structure by groups of goods and main partner countries, 2009
TABLE 22: Profile of SME owners in 2011
TABLE 23: Selected macroeconomic indicators in Bulgaria and EU-27, 2005-2010
(annual growth rate)
TABLE 24: Estimation of Gross value added and employment rates in EU-27, 2009-
2011
TABLE 25: Effects from the crisis by spheres of activity
TABLE 26: Problems coming from the general market situation and economic crisis -
by sphere of activity
TABLE 27: Matrix with microeconomic indicators for the sector performance, 2009-
2011
TABLE 28: Macroeconomic indicators in Bulgaria, 2002-2009
FIGURE 1: Enterprise structure in Bulgaria by size class, 2009
FIGURE 2: Distribution of SME number by selected sectors in ―Manufacturing‖, 2009
FIGURE 3: Top 5 sectors in ―Manufacturing‖ by districts, 2009
FIGURE 4: Average coefficient of birth, death and net birth, 2006-2008
FIGURE 5: Structure of enterprises in Bulgaria by economic activities (top 5 sectors),
2009
FIGURE 6: Dynamics of turnover by enterprise size class, 2006-2009
FIGURE 7: Dynamics of value added by enterprise size class, 2006-2009
FIGURE 8: Profit margin by the enterprise size, 2005-2008
FIGURE 9: Evolution of gross value added, compenasation of employees and net
operating surplus, 2005-2009.
FIGURE 10: Dymanics of external trade in mln. BGN, 2005-2009
FIGURE 11: Goods structure of exports, 2005-2009
FIGURE 12: Profile of SME owners по пол
FIGURE 13: Profile of SME owners
FIGURE 14: Direct foreign investment in Bulgaria in mln. EUR, 2005-2010
Annex
150
Analysis of the situation and factors for development of SMEs,
prepared by BSMEPA and NOEMA, 2011
FIGURE 15: Employment and unemployment, 2005-2010
FIGURE 16: Inflation rate, 2005-2010
FIGURE 17: Current account, 2005-2010
FIGURE 18: GDP rate, 2002-2010
FIGURE 19: Policies related to enterprise personnel in 2009
FIGURE 20: Effects of the crisis - total and among enterprise size classes
FIGURE 21: Market positions in 2010
FIGURE 22: Problems coming from the general market situation and economic crisis -
by enterprise size class
FIGURE 23: Participation in public discussion of legislation in the sector of activity
FIGURE 24: Participation in public procurements
FIGURE 25: Use of public services
FIGURE 26: Time spared for administrative services
FIGURE 27: Awareness of the web site for consultancy of the Council of Ministers
FIGURE 28: Areas /institutions with corruption
FIGURE 29: Witnessing of corruption practices
FIGURE 30: Distribution of the index values for institutional environment, own
calculations
FIGURE 31: Mean values of the index for institutional environment by enterprise size
class, own calculations
FIGURE 32: Mean values of the index for institutional environment by enterprise
activity sphere, own calculations
FIGURE 33: Mean values of the index for institutional environment by region, own
calculations
FIGURE 34: Information about funds supporting SME
FIGURE 35: Use of financial instruments
FIGURE 36: Access to public funds
FIGURE 37: Distribution of the index values for access to finance, own calculations
FIGURE 38: Mean values of the index for access to finance by enterprise size class,
own calculations
FIGURE 39: Mean values of the index for access to finance by enterprise activity
sphere, own calculations
FIGURE 40: Mean values of the index for access to finance by region, own calculations
FIGURE 41: Innovation practices in SMEs
FIGURE 42: Practices for research and development in SMEs
FIGURE 43: Distribution of the index values for innovation activity, own calculations
FIGURE 44: Mean values of the index for innovation activity by enterprise size class,
own calculations
FIGURE 45: Mean values of the index for innovation activity by enterprise activity
sphere, own calculations
FIGURE 46: Mean values of the index for innovation activity by region, own
calculations
FIGURE 47: Activities related to intellectual property
FIGURE 48: Registration of trade marks
FIGURE 49: Registration of patents
FIGURE 50: Distribution of the index values for intellectual property (brands and
patents), own calculations
FIGURE 51: Mean values of the index for brand and patents by enterprise size class,
own calculations
FIGURE 52: Mean values of the index for brand and patents by enterprise activity
sphere, own calculations
FIGURE 53: Mean values of the index for brand and patents by region, own
calculations
FIGURE 54: Forms of exports and international partnership
FIGURE 55: Information about markets abroad
FIGURE 56: Importing and Exporting
FIGURE 57: Participation in exhibitions and trade fairs
FIGURE 58: Participation in clusters
FIGURE 59: Activities within clusters
FIGURE 60: Benefits from the participation in clusters
Annex
151
Analysis of the situation and factors for development of SMEs,
prepared by BSMEPA and NOEMA, 2011
FIGURE 61: Distribution of the index values for internationalization, own calculations
FIGURE 62: Mean values of the index for internationalization by enterprise size class,
own calculations
FIGURE 63: Mean values of the index for internationalization by enterprise activity
sphere, own calculations
FIGURE 64: Mean values of the index for internationalization by region, own
calculations
FIGURE 65: Use of management information systmes
FIGURE 66: Information about best practices
FIGURE 67: Personnel training
FIGURE 68: Planning and marketing
FIGURE 69: Distribution of the index values for best practices, own calculations
FIGURE 70: Mean values of the index for best practices by enterprise size class, own
calculations
FIGURE 71: Mean values of the index for best practices by enterprise activity sphere,
own calculations
FIGURE 72: Mean values of the index for best practices by region, own calculations
FIGURE 73: Mean values of the index values for access to finance by enterprise size
and activity sphere as well as the crisis effects over enterprise occupation
FIGURE 74: Mean values of the index for innovation activity by enterprise size and
activity sphere as well as the crisis effects over enterprise occupation
FIGURE 75: Mean values of the index for brands and patents by enterprise size and
activity sphere as well as the crisis effects over enterprise occupation
FIGURE 76: Mean values of the index for internationalization by enterprise size and
activity sphere as well as the crisis effects over enterprise occupation
FIGURE 77: Observed (in 2010) and expected (in 2011) changes in sales and profit
FIGURE 78: Mean values of the index for best practices by enterprise size and activity
sphere as well as the crisis effects over enterprise occupation
FIGURE 79: Mechanics of influence of competitiveness factors over the SME
development during the current economic crisis
FIGURE 80: SME self-assessment of strong and weak sides
Annex
152
Analysis of the situation and factors for development of SMEs,
prepared by BSMEPA and NOEMA, 2011
This analysis was prepared on behalf of the Bulgarian Small and Medium
Enterprise Promotion Agency.
© Bulgarian Small and Medium Enterprises Promotion Agency (BSMEPA)
1000 Sofia; 21, 6-th September Str.
Department of Development and Internationalization of Small and Medium-
sized Enterprises
www.sme.government.bg
NOEMA LTD.
1000 Sofia; 53, Tzar Simeon Str.
www.noema.bg
AUTHORS: Dr. Ralitsa Simeonova-Ganeva, team leader (Sofia University) Dr. Econ.Sc. Zhelyu Vladimirov (Sofia University) Margarita Boeva, senior researcher (NOEMA) Natalya Panayotova, Ph.D. student (Sofia University) Dr. Kaloyan Ganev (Sofia University) Roza Peneva, senior researcher (NOEMA)
EDITORS: Dr. Econ.Sc. Zhelyu Vladimirov (Sofia University) Dr. Kaloyan Ganev (Sofia University)