bulletin of the geological society of denmark
TRANSCRIPT

· 11
Magnetic Susceptibility Ellipsoids in Nagssugtoqidianand Archaean rocks in South-East Greenland
GEORGE E.J. BECKMANN
Beckmann, George, E.J. 2008–07–02. Magnetic Susceptibility Ellipsoids in Nagssugtoqidian andArchaean rocks in South-East Greenland. © 2008 by Bulletin of the Geological Society of Denmark,Vol. 56, pp. 11–25. ISSN 0011–06297. (www.2dgf.dk/publikationer/Bulletin)
Measurements of magnetic susceptibility have been carried out on Precambrian rocks in south-eastGreenland in the Nagssugtoqidian mobile belt from Ammassalik northwards to its boundary withthe Archaean craton, and slightly beyond. Directions of Maximum susceptibility are the best de-fined, and are as follows: Ammassalik: Declination = 3º, Inclination = 40º,α95 = 7º; Nagssugtoqidian/Archaean “boundary”: Declination = 311º, Inclination = 62º,α95 = 10º; area enclosing post-tectonicplutons: Declination = 194º, Inclination = 87º, α95 = 17º. The boundary is invisible to the directions ofMaximum susceptibility.
A shear zone near the boundary has been studied in detail. The Maximum directions of thesamples are tightly grouped and lie in the plane of the zone, whilst the Intermediate directionsrotate about the Maximum direction as the zone is approached, until they lie in its plane. Suchrotation is widespread in the boundary area.
A plate tectonic explanation for the Maxima from the boundary and from Ammassalik is pro-posed as follows: the Maximum direction from the boundary is attributed to subduction and colli-sion of the Archaean plate arriving from the north-east, followed by a vertical component imprintedby the emplacement of the plutons. The Maximum direction at Ammassalik is due to overridingArchaean crust coming from the north.
Anisotropy of magnetic susceptibility is useful in detecting shear zones and rock fabric whenthese are not apparent in the field or hand specimen.
Key Words. Greenland, Nagssugtoqidian, Archaean, Magnetic Anisotropy, Shear Zones collision.
George, E.J. Beckmann, Physics Centre, School of Natural Scinces, Newcastle University, Newcastle uponTyne, NE1 7RU, UK. Present Address: 22 Oak Avenue, Hampton, Middlesex, TW12 3NX[[email protected]]
Geological SettingThe Precambrian rocks of south-east Greenland weredescribed by Andrews et al. (1973) who identified asection between about 64º and 66º N, which, theyasserted, is a continuation of the Nagssugtoqidianmobile belt of west Greenland. In 1976 the Geologi-cal Survey of Greenland (GGU, since renamed TheGeological Survey of Denmark and Greenland,GEUS) mounted an expedition in the motor cutter“Tycho Brahe” to map the extension of this belt tothe north. At its northernmost extremity an area ofgranulite facies rocks was reported (Bridgwater etal. 1977), which was subsequently recognised as Ar-chaean craton by Bridgwater & Myers (1979), whoregarded Nagssugtoqidian effects there as mild.
These authors perceived the boundary between theArchaean craton and the Nagssugtoqidian belt assharp but later work suggested that it is diffuse(Chadwick et al. 1989; Dawes et al. 1989). The longperiod of Nagssugtoqidian deformation had beendivided into two main phases (Bridgwater et al. 1977)although Bridgwater & Myers (1979) considered thatthere was, after all, no intervening period of crustalstability but, rather, a continuous series of events.
The expedition initially worked near Ammassalik(Fig. 1) to articulate with earlier work there (Wrightet al. 1973). Ammassalik is centred on an intrusivebody, some 600 km2 in area, known as the Ammassa-lik charnockite complex. This massive body retainsprimary igneous features and was emplaced “justbefore or possibly during the youngest phase ofNagssugtoqidian deformation” (Bridgwater & Myers
Magnetic Anisotropy in SE Greenland

12 · Bulletin of the Geological Society of Denmark
1979). It is associated with continental collision andis thus analogous to the Sisimiut charnockite on thewest coast (van Gool et al. 2002). Some 20 km north-east of Ammassalik there lies an area of post-tecton-ic plutons, of about the same extent. All these rockbodies were described by Bridgwater & Myers (1979),who cited ages as follows:
Archaean craton: 2,800 MaNagssugtoqidian deformation: 2,700–1,900 MaAmmassalik charnockite: 1,900 MaPost-tectonic plutons: 1,580–1,550 Ma.
These authors regarded a Rb-Sr whole rock ageon south Storo of 2,635 (±55) Ma (Pedersen & Bridg-water 1979) as a good estimate of the beginning ofthe Nagssugtoqidian metamorphism, and they not-ed a peak of thermal activity at 2,600 Ma. A preciseage of emplacement for the Ammassalik complex waslater obtained at 1,886 (±2) Ma by Hansen & Kalsbeek(1989), but it underwent metamorphism until 1773(±22) Ma, or later (Kalsbeek & Taylor 1989). It there-fore follows that the Nagssugtoqidian metamorphismended between about 1,750 and 1,580 Ma.
In this paper there will be frequent references to
Fig. 1. Map of region studied by the 1976 expedition, after Bridgwater & Myers (1979), showing sites sampled in the present study,in four areas. The miniature stereograms indicate the mean directions of Maximum susceptibility; the smaller the dot the moreprecisely is the direction known.

· 13
the Nagssugtoqidan/Archaean boundary. This is theborder in Fig. 1 between the hatched and white areasof land within the area NA (ignoring the outcrops ofArchaean material). This border will sometimes becalled simply “the boundary”.
The present author was invited to participate inthe expedition to perform palaeomagnetic work inthe region (Beckmann 1977,1979,1983), which alsoincluded Tertiary dykes (Beckmann 1982). The Am-massalik complex yielded results of exceptional pre-cision (Beckmann 1983). Upon completion of the pal-aeomagnetic work, it occurred to him to determinethe anisotropy of magnetic susceptibility (AMS) el-lipsoids of all the Precambrian samples. The resultsare presented in this paper, which expands the un-published report he submitted to GGU in 1977.
Magnetic SusceptibilityPreamble
When a magnetic field is applied to a substance itsinitial magnetisation is proportional to the field. Theconstant of proportionality is known as the “mag-netic susceptibility”, which is thus a measure of theease with which the substance can be magnetised.In rocks, the susceptibility varies with direction be-cause they are anisotropic. A direction can be estab-lished in which the susceptibility is a maximum, an-other in which it is a minimum, and a third, ortho-gonal to the other two, in which it has intermediatesusceptibility. These three directions form a triad inwhich the values (kmax, kint, kmin) form the semi-axes ofthe susceptibility ellipsoid. It is common practice todefine ratios as follows, analogous to those of thestrain ellipsoid:
P1 = kmax / kint = lineation (L)P2 = kmax / kmin = anisotropy factor (An)P3 = kint / kmin = foliation (F)P3/P1= (kint)
2 / kmax kmin = eccentricity (E).
E is important for recognising the shape of the ellip-soid. If E < 1 the lineation dominates and so the ellip-soid is prolate, and if kmin and kint are nearly equal itis cigar-shaped. If E > 1 foliation dominates, and sothe ellipsoid is oblate, and if kint is close to kmax theellipsoid is disk-shaped.
There are two applications of AMS to the study ofrocks:
1. Palaeomagnetism:
When a rock acquires magnetism, it does so ideallyin the direction of the ambient field but, in practice,the direction is deflected on account of anisotropy.The expected deflections were calculated by Uyedaet al. (1962) in a study which predicted that theywould be smaller than had been generally assumed,and subsequently justified the application of palaeo-magnetism to metamorphic rocks in the 1970’s, e.g.Beckmann (1976). Sampling was even done in a shearzone in west Greenland; in this case there was anattempt to correct for the deflections by incorpora-ting the AMS ellipsoids (Beckmann et al. 1977).
2. Petrofabric analysis:
The present paper deals only with this application.Graham (1954) was the first to suggest the applica-tion of AMS to structural problems. He demonstra-ted that the direction of Maximum susceptibility inferromagnetic grains was parallel to their length.Many authors have since made the same point. Thespeed of modern machines renders the method par-ticularly appealing, but, even now, this tool has notbeen fully exploited, especially in metamorphic rocks.
Much work was done on slates, for example Fuller(1963) and Singh et al. (1975). Wood et al. (1976)proved that the finite strain ellipsoids coincided withthe AMS ellipsoids in slates.
Khan (1962) studied thin sections of a dyke anddemonstrated that the AMS is due to the orientationof the magnetite grains. Khan obtained striking re-sults from Precambrian dykes and gneisses from theLewisian of north-west Scotland, which yielded well-grouped principal directions of AMS. The ellipsoidswere oblate with maximum/intermediate planesparallel to the visible foliation and the maximumdirection parallel to the visible lineation. Khan alsoshowed that the directions from Scourian and Lax-fordian sites (Sutton & Watson 1951) were different,implying that directions are reset by metamorphism.
Khan subjected some rocks to temperatures up to700ºC and to high pressures, and sometimes bothtogether. He found no changes in the orientations ofthe AMS ellipsoids. Consequently, he stressed thatAMS orientations are a fundamental property ofrocks, which would not be altered as long as therewere no melting or shearing. Khan’s results are sem-inal to the present paper.
In west Greenland Beckmann et al. (1976) noticedthat in Nordre Stromfjord the axes of the AMS ellip-soid generally coincided with the strain ellipsoid. Incontrast, a subtler situation exists near Sisimiut (for-
Magnetic Anisotropy in SE Greenland

14 · Bulletin of the Geological Society of Denmark
merly Holsteinsborg) on the mountain Kaellingehaet-ten which has had such a complex metamorphichistory that the tectonic fabric is locally devoid of alinear element. On the other hand there does exist alinear component in the magnetic fabric. Moreover,the AMS axes correspond to those of the strain ellip-soid for rocks a few km to the south which have beenstrongly affected by later Nagssugtoqidian deforma-tion. The authors concluded that the determinationof AMS ellipsoids offered a sensitive means of ascer-taining the direction of the last deformation in ametamorphic terrain, in accordance with the predic-tion of Khan (1962).
Later in this paper particular importance will beattached to the Maximum direction of AMS. Intui-tively, this is the direction of stretching of rocks.However, if rocks had been fluid, a rolling motioncan be envisaged. Jeffery (1922) investigated mathe-matically the orientation of prolate spheroidal par-ticles in a flowing liquid. He predicted that theywould align themselves with their long axes normalto both the velocity and to the direction of its maxi-mum gradient. Khan (1962) found some support forthis prediction in lavas and gabbros. In the presentpaper, the two styles for the Maximum AMS direc-tion will be called the “stretching” and “rolling”modes. Evidently, research on the rolling mode hasbeen carried out on rocks which had been liquid.However, it might also occur in solid rocks, which,in a metamorphic terrain, could behave like a veryviscous liquid over the millions of years during whichchanges occur.
Ellwood (1978) studied lavas further, and againfound support for the rolling prediction, althoughhe noted that the effect depended on the physicalcircumstances. Indeed, the relationship between AMSdirections and petrofabric is more complex than reali-sed in early papers on this subject. Rochette et al.(1992) made a theoretical study of influences on AMSdirections, which they illustrated particularly withtheir work on dykes from the Oman ophiolite. Theypointed out that research on AMS directions has usu-ally rested upon three assumptions:1. The AMS ellipsoid is coaxial with the petrofabric
ellipsoid2. The shape of the AMS ellipsoid is directly related
to the rock fabric3. AMS directions are not influenced by the natural
remanent magnetisation (NRM).These authors proved that these assumptions are notalways justified. Sometimes rocks exhibit an “in-verse” fabric in which the principal AMS directionsswap with the “normal” directions. This effect canbe caused by the bulk of the minerals in the rock, thematrix, which is normally regarded as non-magnet-
ic but which becomes temporarily slightly magnet-ised during the measuring processes.
Rochette et al. (1992) demonstrated, in the Omandykes, three sets of directions, and a miscellaneousset. Such experiments emphasise how difficult it isto correlate AMS directions with flow directions.(These authors were aware of the “rolling” possibil-ity, first noticed by Khan (1962), but did not find it inthese dykes).
It was mentioned at the beginning of this sectionthat AMS affects the direction of NRM. Is the reversetrue? Rochette et al. (1992) found that there is indeeda linkage but that the following factors reduce itsimportance:
Thermal, or tumbling alternating field (AF) demag-netisationLow intensity of NRM (implying well separatedmagnetic grains)High values of anisotropy.
An attempt will be made in the Discussion section torelate the warnings of Rochette et al. (1992) to therocks of the present study.
Analytical MethodsThe principal directions and magnitudes of the AMScomponents were measured with the Complete Re-sults Anisotropy Delineator (CRAD). The magni-tudes were corrected using the formulae of Hroudaet al. (1983). The CRAD was invented by L. Mo-lyneux and M.J. Gross, of this Department, and de-scribed by Collinson (1983).
The statistics applied to directions are those ofFisher (1953). These feature k, commonly known asthe precision parameter, which is a measure of theprecision of grouping, and ααααα95, which is the semi-angle of the cone of 95% confidence about the meandirection. These statistics apply to circularly symmet-rical distributions of directions. It will be seen thatthe distributions in this paper are not circular. Nev-ertheless, ααααα95 has been found to be a useful and rea-listic measure of error. Precedents for the applica-tion of Fisher statistics to AMS directions were setby Khan (1962) and Fuller (1963).
Magnetic susceptibility is like a vector in that ithas direction and size but the direction is double-ended. It is usual to assume that it has the same val-ue in one direction as the opposite. Hence a deci-sion has to be made as to which end to choose. Con-sider, say, the Maximum directions for a site. Thesimplest case occurs when they are well-grouped andaway from the horizontal; then simply choose the

· 15
downward inclinations. In other cases, choose all thedownward inclinations and form their mean. Thennote the angle between the Maximum of the first sam-ple and this mean; if it is greater than a right anglereverse it, and so on through all the samples. Form anew mean and repeat the process until no furtherchanges are required. If the final mean has negativeinclination reverse it. These calculations are done incompany with the other two principal directions. Theangles between the three means are noted at the end;when there is compact grouping, these are oftenwithin one or two degrees of 90º (although they arenot required to be orthogonal).
Notes: All stereograms in this paper are in Wulff(equal angle) projection. Filled squares, triangles, andcircles denote Maximum, Intermediate, and Mini-mum directions respectively, following Khan (1962).Phrases like “directions of Maximum magnetic sus-ceptibility” will be shortened to “Maximum direc-tions”.
Field WorkThe procedures used to obtain the rocks in this col-lection have already been described (Beckmann1983).
The charnockite complex was sampled at threesites in Ammassalik harbour. Two of these were ofgarnetiferous granulite, 0.7 km apart (sites 1 & 2),whilst the third was a norite (42). On average, 17 sam-ples were taken from each site.
Thirteen sites were sampled in the vicinity of theNagssugtoqidian/Archaean boundary, all lyingwithin 30 km of it. Eight of these were withinNagssugtoqidian rocks whilst five were in the Ar-chaean craton (Fig. 1, area NA). The average numberof samples per site was 18.
Ten sites were chosen from area P (Fig. 1), sur-rounding the plutonic complex. One of the sites wasa granite (32) and three were from gneisses close to agranite contact (33,34,35). Site 31 was a norite withina small outcrop of plutons. More granites would havebeen sampled but their hardness was an inhibitingfactor in view of the short time available for sam-
Magnetic Anisotropy in SE Greenland
Fig. 2. Directions of the axes of magnetic susceptibility ellipsoids at Ammassalik:[� = Maximum, � = Intermediate, � = Minimum](a). Mean directions of the principal axes from the three sites, in relation to the locus of points orthogonal to the mean of the meanMaximum directions.(b). Means of the mean directions.

16 · Bulletin of the Geological Society of Denmark
pling. Approximately 12 samples were taken fromeach site.
Seven sites were sampled in the Sermiligâq area,at about 20 samples per site.
ResultsThe Main Results
At Ammassalik the principal directions are well-grouped, especially the Maximum directions, whosemeans are close to each other (Fig. 2, and Table 1).
In area NA (Fig. 1) the Maximum directions arethe easiest to interpret on account of their grouping.
The sites from the Nagssugtoqidian area form agroup with similar Maximum directions to thosefrom the Archaean craton (Fig. 3). Thus no change isapparent upon crossing the boundary, and so the 13sites may be regarded as a single group (Fig. 3 &Table 2). On the other hand, the Intermediate andMinimum directions of individual samples are gen-erally poorly-grouped and tend to “swing” along thearc which is orthogonal to the mean Maximum di-rection, for example site 18 (Fig. 4). Site 11 is the soleexception in area NA (Fig. 4). Such swinging behav-iour occurs between sites, as well as between sam-ples within a particular site, as illustrated by plot-ting the mean Intermediate and Minimum directions
TABLE 1. Susceptibility Results from Ammassalik
Site Samples Axis DEC INC k α95 L An F E1 20 1.10 1.20 1.09 0.99
Max 4 36 34 5.7Int 121 33 8 12.0Min 240 36 10 10.9
2 21 1.10 1.28 1.17 1.07Max 2 44 43 4.9Int 115 21 36 5.4Min 222 38 106 3.1
42 11 1.12 1.23 1.10 0.98Max 2 38 181 3.4Int 103 13 92 4.8Min 208 49 124 4.1
Mean Max 3 40 354 6.6Mean Int 112 23 39 20.0Mean Min 225 42 35 21.1
Note: L, An, F, E in Tables 1, 2, & 3 denote mean values at a site for Lineation, Anisotropy, Foliation,& Eccentricity, respectively.
Fig. 3. Mean Maximum directions of the sites near the Nagssugtoqidian/Archaean boundary (area NA).

· 17Magnetic Anisotropy in SE Greenland
Table 2: Details of Sites near NAG/Archaean boundary
Site Sam- Locality Rock Type Max- Susc k α95
L An F Eples DEC INC
Arch-aean:17 22 Kangertivatsiaq/ Granulite 272 55 20 7.1 1.06 1.12 1.06 1.00
Sangmilik Gneiss18 21 Kangertivatsiaq Granulite 330 48 16 8.1 1.18 1.26 1.07 0.92
Gneiss19 21 Kangertivatsiaq Granulite 289 44 6 13.7 1.09 1.20 1.10 1.01
Gneiss20 21 Nordfjord Gneiss & 272 55 12 9.5 1.20 1.32 1.10 0.92
QuartziteGranulite
25 *3 Nordfjord Pseudo- 306 63 437 5.9 1.06 1.08 1.02 0.96tachylite
NAG:11 21 Bjornebugt Banded 18 72 18 7.8 1.12 1.64 1.47 1.32
Gneiss12 21 Bjornebugt Dyke Am- 70 87 24 6.6 1.07 1.13 1.06 0.99
phibolite13 20 Depotfjord Dyke Am- 322 48 32 5.9 1.07 1.10 1.03 0.96
phibolite14 21 South Storo Gneissified 358 46 4 17.1 1.08 1.24 1.15 1.06
granite15 21 South Storo Granite+ 321 67 4 18.7 1.09 1.19 1.09 1.01
gneiss16 12 South Storo Dyke Am- 318 64 18 10.6 1.12 1.22 1.08 0.97
phibolite23 11 Sangmilik Granulite 292 52 6 20.6 1.09 1.22 1.12 1.02
Gneiss27 £6 South Storo Shear Zone 305 63 394 3.4 1.32 1.83 1.39 1.06
* 10 samples collected. £ 7 samples collected.
Fig. 4. Site 18: Mean Maximum direction, and the Intermediate and Minimum directions of individual samples, in relation to thelocus of points orthogonal to the mean Maximum. Site 11: Mean directions of its principal directions.
18 · Bulletin of the Geological Society of Denmark
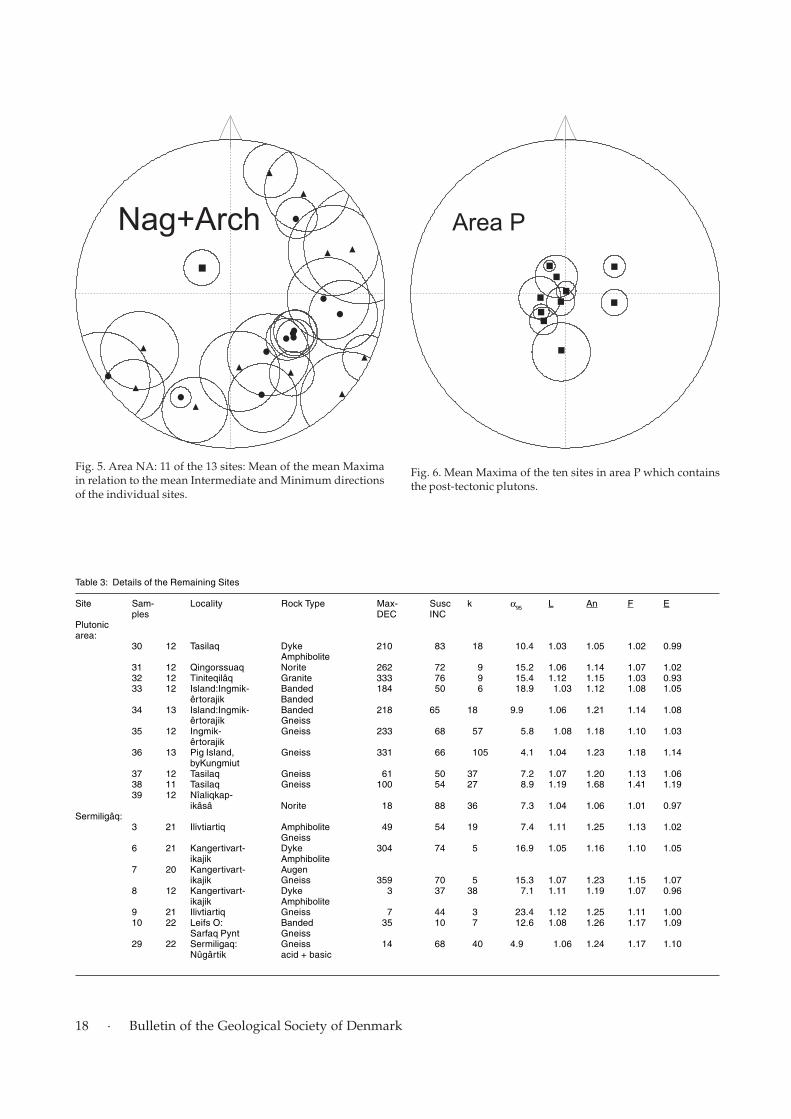
Fig. 5. Area NA: 11 of the 13 sites: Mean of the mean Maximain relation to the mean Intermediate and Minimum directionsof the individual sites.
Fig. 6. Mean Maxima of the ten sites in area P which containsthe post-tectonic plutons.
Table 3: Details of the Remaining Sites
Site Sam- Locality Rock Type Max- Susc k α95 L An F Eples DEC INC
Plutonicarea:
30 12 Tasilaq Dyke 210 83 18 10.4 1.03 1.05 1.02 0.99Amphibolite
31 12 Qingorssuaq Norite 262 72 9 15.2 1.06 1.14 1.07 1.0232 12 Tiniteqilâq Granite 333 76 9 15.4 1.12 1.15 1.03 0.9333 12 Island:Ingmik- Banded 184 50 6 18.9 1.03 1.12 1.08 1.05
êrtorajik Banded34 13 Island:Ingmik- Banded 218 65 18 9.9 1.06 1.21 1.14 1.08
êrtorajik Gneiss35 12 Ingmik- Gneiss 233 68 57 5.8 1.08 1.18 1.10 1.03
êrtorajik36 13 Pig Island, Gneiss 331 66 105 4.1 1.04 1.23 1.18 1.14
byKungmiut37 12 Tasilaq Gneiss 61 50 37 7.2 1.07 1.20 1.13 1.0638 11 Tasilaq Gneiss 100 54 27 8.9 1.19 1.68 1.41 1.1939 12 Nîaliqkap-
ikâsâ Norite 18 88 36 7.3 1.04 1.06 1.01 0.97Sermiligâq:
3 21 Ilivtiartiq Amphibolite 49 54 19 7.4 1.11 1.25 1.13 1.02Gneiss
6 21 Kangertivart- Dyke 304 74 5 16.9 1.05 1.16 1.10 1.05ikajik Amphibolite
7 20 Kangertivart- Augenikajik Gneiss 359 70 5 15.3 1.07 1.23 1.15 1.07
8 12 Kangertivart- Dyke 3 37 38 7.1 1.11 1.19 1.07 0.96ikajik Amphibolite
9 21 Ilivtiartiq Gneiss 7 44 3 23.4 1.12 1.25 1.11 1.0010 22 Leifs O: Banded 35 10 7 12.6 1.08 1.26 1.17 1.09
Sarfaq Pynt Gneiss29 22 Sermiligaq: Gneiss 14 68 40 4.9 1.06 1.24 1.17 1.10
Nûgârtik acid + basic

· 19
of 11 of the 13 sites (Fig. 5). (Sites 25 and 27 havebeen excluded because their Intermediate and Mini-mum mean directions are not significant at the levelof 95% confidence (Irving 1964, p. 63)).
In area P the Intermediate and Minimum direc-tions vary greatly. However, in the Maxima, someconsistency is apparent, yet again (Fig. 6), so that itis reasonable to calculate the mean direction of thesemeans, which is practically vertical.
The mean directions of the Maxima from each ofthe areas above are depicted in Fig. 7, each surround-ed by its circle of 95% confidence.
The sites near Sermiligâq display such a varietyof directions (Table 3) that it is not realistic to gener-alise about them.
Results from Particular SitesShear Zone
Site 27 is a shear zone in the gneisses of south Storo.Its strike is 137º, it is nearly vertical, and is 25 cmwide. Seven cores were drilled at measured distancesfrom the north-eastern margin. The first was tenmetres from it, the next four were within one metreof it, and one was at the margin, whilst the seventhwas inside the shear zone.
Fig. 7. Summary stereogram for the mean Maxima from threeareas.
Fig. 8. Site 27: Left: Precise mean Maximum of samples influenced by this shear zone, (with the Maximum for a sample uninflu-enced by it), in relation to their Intermediate directions as the shear zone is approached. Numbers in brackets are distances fromthe nearer margin of the zone. The solid arc is the plane containing the mean Maximum direction and the strike of the shear zone.Right: Behaviour of the susceptibility ratios upon approach to the shear zone (shaded). Numbers in circles are sample numbers.
Magnetic Anisotropy in SE Greenland

20 · Bulletin of the Geological Society of Denmark
The Maximum directions from samples 2 to 7 areso nearly parallel that they cannot be distinguishedon a stereogram. Their mean direction is illustratedin Fig. 8, left. The direction from sample 1 is remotefrom that direction; it is therefore not particularlyinfluenced by the shear zone. The study of the zonewill therefore be confined to samples 2 to 7.
The Intermediate directions of the samples rotatein an arcuate manner as the shear zone is approached;that for sample 5 lies in the plane of the shear zone,whilst 7 is very close to it. Sample 6 “overshoots”the plane. This behaviour is probably associated witha change in the iron oxides from “ilmenomagnetites”in rocks ten metres from the shear zone to hydratedferric oxides and haematite in the shear and imme-
diate country rocks (D. Bridgwater, personal com-munication, 1979). Evidence for such changes comesfrom falling values of the mean susceptibility as themargin is approached down to sample 6 which hasonly 7% of that in sample 3 (nevertheless sample 7has a value close to sample 3).
Pseudotachylite
Site 25 is a pseudotachylite; it is a member of a swarmon the west coast of Nordfjord, in the Archaean cra-ton. They are within and parallel to a several hun-dred metre wide retrogressed ductile shear zone bor-dered by granulite facies rocks (Bridgwater et al.1977). This particular pseudotachylite is a few cmwide and strikes at 140º. Palaeomagnetic analysis hadproved that it is of similar magnetic age to the gneiss-es in the Nordfjord region (Beckmann 1983).
Ten samples were taken from this feature; they arenearly isotropic. The lineation is hardly greater thanunity, so that it is generally not meaningful to quoteMaximum susceptibility directions. However, three
Table 4. Summary of Maximum Susceptibility directions
Area Sites Dec Inc k α95
NA 13 311 62 17 10.3Ammass 3 3 40 354 6.6P 10 194 87 9 16.9
Fig. 9. (a) Mean Maximum direction from the pseudotachylite (site 25) and the plane containing this direction and the strike of thisfeature. (b) Intermediate and Minimum directions of its samples in relation to the locus of points orthogonal to the mean Maxi-mum. (c) Mean Maxima from sites 25 & 27 and the mean of mean Maxima from the remaining 11 sites in area NA.

· 21
of the samples have average lineation greater thanthe other seven, namely 1.06 compared with 1.02, andthey are the only prolate ones. These three sampleshave yielded practically parallel Maximum direc-tions, whose mean is indistinguishable from that ofthe shear zone (27). The plane containing this meandirection and the strike of the pseudotachylite (Fig.9a) is indistinguishable from that of the shear zone(27, Fig. 8, left). The Intermediate and Minimum di-rections display swinging behaviour (Fig. 9b) like thatseen in the shear zone. The mean Maximum direc-tions for the shear zone (27) and the pseudotachylite(25) are plotted in relation to the mean Maximumdirection of the other 11 sites in area NA (Fig. 9c).
Site 13This is a dyke amphibolite which was sampled withthe late David Bridgwater, who noted that it is gar-net-bearing and undeformed, within country rock ingranulite facies. Nevertheless, some deformation isimplicit in the magnetic fabric which has a well-de-fined Maximum direction (Table 2). We sampled nor-mally to the dyke margin, from 5 cm to 35 metres,but no systematic variation of directions with dis-tance has been found.
Site 35This site is of particular interest. The first six sam-ples from this gneiss were in an area of folds, where-as the second six were not. In spite of this difference
their principal axes of magnetic susceptibility areindistinguishable (Fig. 10). Therefore these directionswere imposed after the folding. (This test is analo-gous to the “fold test” in palaeomagnetism).
DiscussionThe shear zone, site 27, formed at the beginning ofthe Nagssugtoqidian metamorphism, in view of theage of two adjacent shear zones, namely 2,660 (±180)Ma (Pedersen & Bridgwater 1979). However, suchshear zones were probably reactivated much later(Chadwick & Vasudev 1989). If so, this would beanother example of the persistence of tectonic linea-ments near structural boundaries for hundreds ofmillions of years (Bridgwater et al. 1973; Watterson1975). It is now suggested that the transparency ofthe Nagssugtoqidian/Archaean boundary to AMSwas caused by overprinting late in the Nagssugto-qidian metamorphism. This would imply thatNagssugtoqidian events in the Archaean were morewidespread than had been recognised by Bridgwa-ter & Myers (1979). This point of view was reinforcedby Chadwick et al. (1989), who concluded that theboundary is not sharp but, rather, a zone as much as100 km wide.
The “swinging” behaviour of the Intermediate di-rections as the shear zone (27) is approached offersan explanation of this phenomenon in site 18, andother sites, which may therefore also have been situ-ated in shear zones. The implication is that shearzones in this part of south-east Greenland are abun-dant. This suspicion is supported by geological evi-dence from south Storo, where the shear belts varyin width between several hundred metres and lessthan one metre (Bridgwater 1979), and a shear belthundreds of metres wide in Nordfjord (Bridgwateret al. 1977).
The shear zone (27) and pseudotachylite (25) strikenorth-west/south-east. This strike looks the sameas for the boundary from aeromagnetic data (Ver-hoof et al. 1996, depicted in van Gool et al. 2002, Fig.6), implying that these features may be associatedwith continental collision, like the Nordre Stromf-jord shear zone on the west coast (van Gool et al.2002, Figs. 3 & 4). There are indications of collisionof two Archaean blocks from geochronology in theAmmassalik area (Kalsbeek & Taylor 1989).
There is geological evidence about the sense ofmovement of the shear zones in area NA. The ap-pearance in the field of the shear zone (27) indicatesthat the shearing movement had been dextral, in ac-cord with three other shear zones in the localityFig. 10. Fold test on site 35.
Magnetic Anisotropy in SE Greenland

22 · Bulletin of the Geological Society of Denmark
(Bridgwater 1979). Site 27 had experienced north-side-down movement (see Fig. 8, left), in commonwith shear zones in Nordfjord (Bridgwater et al.1977). Three shear zones adjacent to site 27 trending130º/V are 10–20 cm wide; within one metre of theirmargins the mineral fabric is intensified and rotatedto become parallel to the central zones (Pedersen &Bridgwater 1979). Rotation about the Maximum sus-ceptibility axis of the shear zone (27), and the othersites in Area NA, would correspond to the “rolling”mode mentioned in the “Magnetic Susceptibility”section of this paper.
The suggestion of continental collision can be tak-en further with the AMS results, but the steep incli-nation of the Maximum direction from area NApresents a problem because rolling would be expect-ed to be horizontal. However, this Maximum direc-tion could be regarded as a combination of a hori-zontal component striking north-west/south-eastand a vertical one. This strike is to be expected ifoceanic crust were subducting towards the south-west, causing a rolling motion in the receiving rocksanticlockwise about a horizontal axis directed to thesouth-east. (Indeed, the sense of subduction shouldbe underneath the mobile belt on the basis of the con-vexity of the aeromagnetic boundary, as proposedfor the west coast by van Gool et al. (2002)). The ver-tical component of the Maximum direction couldhave been imposed later. A reservation with thismodel is that it violates the proposition that AMSdirections correspond to the last metamorphic event.However, the model could be sustained if the verti-cal component had been the response to stretchingrather than metamorphism.
This rolling regime accords with the subductionand collision model of van Gool et al. (2002) for westGreenland when the curvature of the aeromagneticboundary is taken into account. In their Fig. 5, panel3, progress of the Disko (Ilulissat) craton is seen to-wards the North Atlantic craton, with subduction ofoceanic crust, followed by collision as it arrives fromthe WNW (panel 4) causing peak metamorphism,whilst the thrust arrows can be interpreted as a roll-ing motion anticlockwise about a horizontal axis di-rected ENE, which is the same sense as that now pro-posed for east Greenland.
The area P, consisting of Nagssugtoqidian gneiss-es surrounding the plutons, has yielded a mean Max-imum direction which is practically vertical. Thisdirection was probably established as the emergingplutons exerted upward stresses. Comparison of Fig.3, right and Fig. 6 shows overlapping, implying thatthe directions from area NA have been influencedby the emplacement of the plutons. Thus the verticalcomponent from the plutons would provide the ver-
tical component postulated after the rolling in areaNA. Moreover, it would have been a stretching im-posed in non-metamorphic conditions because theNagssugtoqidian metamorphism had ceased by thattime.
The Maximum direction identified at Ammassal-ik, namely north and 40º downwards, can be ex-plained by Archaean crust overriding the mobile belt(Bridgwater 1979; Chadwick & Vasudev 1989; Daweset al. 1989), with a stretching effect which would haveexpressed itself as a north to south lineation, ie thedirection of the Maximum in AMS terms, in “stretch-ing” mode. Such a hypothesis would nearly fit theobservation of Bridgwater and Myers (1979), at thesouthern margin of the mobile belt, of linear fabricsin younger Nagssugtoqidian shear planes plungingat 20º–30º to the north.
Two of the declinations identified in the presentinvestigation, from the Nagssugtoqidian/Archaeanboundary and from Ammassalik (311º and 3º, respec-tively), recall a remark in Andrews et al. (1973):“Strong linear fabrics developed in these [shear] belts,plunging to the north-west and north”. These authorseven refer to interference patterns between the twosets of directions. These two declinations are alsoreminiscent of those mentioned by van Gool et al.(2002) for the Nagssugtoqidian of east Greenland:“The structural grain shows a consistent ESE struc-tural trend and south-directed thrusts exist through-out the orogen” (bearing in mind that a particulardirection in AMS is equivalent to its opposite owingto double-end-edness). The present paper supple-ments the declinations of these authors with inclina-tions, giving directions.
No reason suggests itself for the lack of an out-come for the Sermiligâq area. The default explana-tion is that this is an area of diverse local disturbanc-es which prevented consistent directions from beingestablished, a possibility which accords with the lackof meaningful palaeomagnetic results in this area(Beckmann 1983), indicating that these magneticrecords have been largely lost.
The precise mean Maximum directions at Ammas-salik (Table 1) recall the precision of the palaeomag-netic results here (Beckmann 1983), particularly forthe two garnetiferous granulite sites, whose direc-tions of magnetisation are very close to each other.Perhaps the robustness of these magnetic records isassociated with the massive character of these rocks.
The deductions from the principal AMS directionsare at risk in view of the caveats of Rochette et al.(1992). It is assumed that the AMS directions of thepresent study arise from multi-domain magnetite.But have they been affected by a contribution fromthe matrix? This question is answered by consider-

· 23
ing the area NA. This contains a great variety of rocktypes (Table 2), with a corresponding variety of ma-trices, and yet they have a common Maximum direc-tion, and common “swinging” behaviour (except site11). Any contribution from the matrices is thereforeunlikely because such contributions would be dif-ferent from each other. In detail, the mineralogy ofthe shear zone (27) changes drastically as the marginis approached (Bridgwater 1979) whilst the Maxi-mum direction remains constant (even for specimen6 in the margin itself, and specimen 7 within theshear).
The rocks of this study are favourable to there be-ing just weak linkage between AMS and NRM thus:
(i) low intensity of NRM and high values of aniso-tropy compared with basaltic rocks, such as thosestudied by Rochette et al. (1992),
(ii) previous demagnetisation, especially tumblingAF.
This collection had been treated by tumbling AF de-magnetisation in one site, and thermal for the remain-der (Beckmann 1983). The AF site was site 1 at Am-massalik, whereas sites 2 & 42 there had been treat-ed thermally (subject to checking that no chemicalchanges had occurred). Nevertheless, the Maximumdirections are practically parallel (Fig. 2); if there hadbeen a linkage the two methods would have mani-fested a link in different ways.
“Inverse” fabrics have not been noticed in thepresent rocks; indeed Rochette et al. (1992) recordedother authors who had concluded that multi-domainmagnetite yields “normal” AMS fabric. Above all, itneeds to be said that Rochette et al. (1992) did notconsider metamorphic rocks, and so their reserva-tions may not, in any case, apply to this study.
Dansk ResuméMålinger af anisotropien i den magnetiske suscepti-bilitet (AMS) er blevet udført på Prækambriske bjer-garter i Sydøstgrønland i området fra det Nagssug-toqidiske mobile bælte ved Ammassalik og imodNord til lidt forbi grænsen af det Arkæiske Kraton.Retningerne af den maksimale susceptibilitet er debedst definerede, og er som følger: Ammassalik: Dec= 3°, Inc = 40°, α95
= 7º; Nagssugtoqidiske Arkæ-iske”grænse”: Dec = 311°, Inc = 62°, α95 = 10°; Are-alet med post-tektoniske plutoner: Dec = 194º, Inc =87°, α95 = 17°. En shearzone nær grænsen er blevetdetailleret undersøgt. Maksimums-retningerne afprøverne er vel grupperede og falder i shearzonens
plan, mens de intermediære retninger drejer omkringmaksimumsretningen når man nærmer sig shearzo-nen, indtil de ligger i dens plan. En sådan drejninger almindelig i grænseområdet.
En pladetektonisk forklaring for de maksimaleretninger i grænseområdet og fra Ammassalik fore-slås som følger: Maksimumsretningen fra grænseom-rådet tilskrives subduktion og kollision af den Arkæ-iske plade kommende fra nordøst, efterfulgt af envertikal komponent, som overprintes ved pluton-ernes intrusion. Maksimumsretningen ved Ammas-salik skyldes overridende Arkæisk skorpe der kom-mer fra nord.
ConclusionsThe Maximum directions are summarised in Table 4and Fig. 7, and depicted according to their areas inFig. 1. The directions from the three areas are signif-icantly different from each other, at the 95% confi-dence level, implying differences in the times atwhich these directions were established. The hori-zontal part of the direction from the area NA is prob-ably older than that from Ammassalik because theAmmassalik area stabilised later (Chadwick & Vas-udev 1989; Kalsbeek & Taylor 1989). This order ofevents agrees with that established palaeomagneti-cally (Beckmann 1983). The direction from area P isprobably the youngest.
The discovery of “swinging” behaviour in a shearzone has demonstrated that AMS would be useful indetecting shear zones, even when they are not ap-parent in the field. Moreover, fabric has been recog-nised in rocks in which it is invisible in hand sample.The advocacy of Graham (1954) of AMS as “an un-exploited petrofabric indicator” is thus upheld.
An interpretation of the AMS results has beenmade in terms of a plate tectonic model for the Ar-chaean/Nagssugtoqidian boundary which is similarto that of van Gool et al. (2002) for the west coast ofGreenland. Clearly, the present author’s solution isspeculative but he hopes that it will provide a basisfor discussion, and that the data presented in thispaper will prove helpful in any further work on theplate tectonic history of the Precambrian rocks ofsouth-east Greenland.
AcknowledgmentsThis field work was carried out during the tenure ofa Leverhulme Fellowship, which is gratefully ac-
Magnetic Anisotropy in SE Greenland

24 · Bulletin of the Geological Society of Denmark
knowledged. It is a pleasure to acknowledge thesupport of the crew and colleagues in “Tycho Bra-he”. J. Watterson measured the distances of the holesfrom the shear zone, and determined its attitude. Ithank GEUS for permission to publish this paper, andN. Henriksen for advice about publication. I thankN. Abrahamsen for the Danish translation of the ab-stract. I am grateful to the referees, N. Abrahamsenand M.F. Knudsen, for their careful reading of themanuscript and most helpful and constructive sug-gestions. A. Stephenson advised me about the appli-cation of the correction equations for the CRAD. Ithank Marian Nicholson for proof reading the man-uscript.
ReferencesAndrews, J.R., Bridgwater, D., Gormsen, K., Gulson, B., Keto,
L. & Watterson, J. 1973: The Precambrian of South-EastGreenland. In: Park, R.G. & Tarney, J. (eds): The Early Pre-cambrian of Scotland and Related Rocks of Greenland, 194pp. University of Keele, 143-156.
Beckmann, G.E.J. 1976: A palaeomagnetic study of part of theLewisian complex, north-west Scotland. Journal of the Ge-ological Society of London 132, 45-59.
Beckmann, G.E.J. 1977: Palaeomagnetic investigations in South-East Greenland. Grønlands Geologiske Undersøgelse Rap-port 85, 84-85.
Beckmann, G.E.J. 1979: A review of Nagssugtoqidian palaeo-magnetism. Grønlands Geologiske Undersøgelse Rapport89, 115-124.
Beckmann, G.E.J. 1982: Palaeomagnetism of nine dated Phan-erozoic dykes in south-east Greenland. Geophysical Jour-nal of the Royal Astronomical Society 69, 355-368.
Beckmann, G.E.J. 1983: Palaeomagnetism of some Precambrianrocks in south-east Greenland. Physics of the Earth and Plan-etary Interiors 32, 85-99.
Beckmann, G.E.J., Davidson, L. & Grocott, J. 1976, unpublished:The magnetic susceptibility ellipsoids in some gneisses fromwest Greenland, read to the Tectonic Studies Group, Uni-versity of Dundee, 20 December 1976.
Beckmann, G.E.J., Olesen, N.O. & Sorensen, K. 1977: A palaeo-magnetic experiment on crustal uplift in West Greenland.Earth and Planetary Science Letters 36, 269-279.
Bridgwater, D. 1979: Chemical and Isotopic Redistribution inZones of Ductile Deformation in a Deeply Eroded MobileBelt: Part I, Chemical Redistribution. United States Geo-logical Survey, Open File Report 79-1239, 505-512.
Bridgwater, D. & Myers, J.S. 1979: Outline of the Nagssugto-qidian mobile belt of East Greenland. Grønlands GeologiskeUndersøgelse Rapport 89, 9-18.
Bridgwater, D., Escher, A. & Watterson, J. 1973: Dyke swarmsand the Persistence of Major Geological Boundaries inGreenland. In: Park, R.G. & Tarney, J. (eds): The Early Pre-cambrian of Scotland and Related Rocks of Greenland, 194pp. University of Keele, 137-141.
Bridgwater, D., Davies, F.B., Gill, R.C.O., Gorman, B.E., Hen-riksen, N. & Watterson, J. 1977: Field mapping in the
Nagssugtoqidian of South-East Greenland. Grønlands Ge-ologiske Undersøgelse Rapport 85, 74-83.
Chadwick, B. & Vasudev, V.N. 1989: Some observations on thestructure of the early Proterozoic, Ammassalik mobile beltin the Ammassalik Area, South-East Greenland. In: Kals-beek, F. (ed.): Geology of the Ammassalik Area, South-EastGreenland. Grønlands Geologiske Undersøgelse Rapport146, 29-40.
Chadwick, B., Dawes, P.R., Escher, J.C., Friend, C.R.L., Hall,R.P., Kalsbeek, F., Nielsen, T.F.D., Nutman, A.P., Soper, N.J.& Vasudev, V.N. 1989: The Proterozoic mobile belt in theAmmassalik region, South-East Greenland (Ammassalikmobile belt): an introduction and re-appraisal. In: Kalsbeek,F. (ed.): Geology of the Ammassalik region, South-EastGreenland. Grønlands Geologiske Undersøgelse Rapport146, 5-12.
Collinson, D.W. 1983: Methods in Rock Magnetism and Palae-omagnetism. Chapman and Hall, 503 pp. London, 50.
Dawes, P.R., Soper, N.J., Escher, J.C., & Hall, R.P. 1989: Thenorthern boundary of the Proterozoic (Nagssugtoqidian)mobile belt of South-East Greenland.
In: Kalsbeek, F. (ed.): Geology of the Ammassalik region, South-East Greenland. Grønlands Geologiske Undersøgelse Rap-port 146, 54-65.
Ellwood, B.B. 1978: Flow and emplacement direction deter-mined for selected basaltic bodies using magnetic suscepti-bility anisotropy measurements. Earth and Planetary Sci-ence Letters 41, 254-264.
Fisher, R.A. 1953: Dispersion on a sphere. Proceedings of theRoyal Society London A 217, 295-307.
Fuller, M.D. 1963: Magnetic Anisotropy and Palaeomagnetism.Journal of Geophysical Research, 68, 293-309.
Graham, J.W. 1954: Magnetic Susceptibility Anisotropy , anunexploited petrofabric element. Bulletin of the GeologicalSociety of America 65, 1257-1258.
Hansen B.T. & Kalsbeek, F. 1989: Precise age for the Ammassa-lik Intrusive Complex. In: Kalsbeek, F. (ed.): Geology of theAmmassalik region, South-East Greenland. Gronlands Ge-ologiske Undersogelse Rapport 146, 46-47.
Hrouda, F., Stephenson, A. & Woltär, L. 1983: On the standard-isation of measurements of the anisotropy of magnetic sus-ceptibility. Physics of the Earth and Planetary Interiors 32,203-208.
Irving, E. 1964: Palaeomagnetism and its application to geo-logical and geophysical problems, Wiley, New York, 399pp.
Jeffery, G.B. 1922: The motion of ellipsoidal particles immersedin a viscous fluid. Proceedings of the Royal Society LondonA 102, 161-179.
Kalsbeek, F. & Taylor, P.N. 1989: Programme of geochronologyand isotope geochemistry in the Ammassalik region, South-East Greenland: outline and preliminary results. In:Kalsbeek, F. (ed.): Geology of the Ammassalik region, South-East Greenland. Grønlands Geologiske Undersøgelse Rap-port 146, 13-16.
Khan, M.A. 1962: The Anisotropy of Magnetic Susceptibility ofsome Igneous and Metamorphic rocks. Journal of Geophysi-cal Research 67, 2873-2885.
Pedersen, S. & Bridgwater, D. 1979: Isotopic re-equilibrationof Rb-Sr whole rock systems during reworking of Archaeangneisses in the Nagssugtoqidian mobile belt, East Green-land. Grønlands Geologiske Undersøgelse Rapport 89, 133-146.

· 25
Rochette, P., Jackson, M., & Aubourg, C. 1992: Rock Magnet-ism and the Interpretation of Anisotropy of Magnetic Sus-ceptibility. Reviews of Geophysics 30(3), 209-226.
Singh, J., Sanderson, D.J. & Tarling, D.H. 1975: The MagneticSusceptibility Anisotropy of Deformed Rocks from NorthCornwall, England. Tectonophysics 27, 141-153.
Sutton, J. & Watson, J. 1951: The Pre-Torridonian metamorphichistory of the Loch Torridon and Scourie areas in the North-West Highlands and its bearing on the chronological classi-fication of the Lewisian. Quarterly Journal of the Geologi-cal Society of London 106, 241-307.
Uyeda, S., Fuller, M.D. Belshé, J.C. & Girdler, R.W. 1962: Ani-sotropy of magnetic susceptibility of rocks and minerals.Journal of Geophysical Research 68, 279-291.
van Gool, J.A.M., Connelly, J.N., Marker, M. & Mengel, F.C.2002: The Nagssugtoqidian Orogen of West Greenland: tec-tonic evolution and regional correlations from a West Green-land perspective. Canadian Journal of Earth Sciences 39,665-686.
Verhoef, J., Macnab, R., Roest, W. & Arjani-Hamed, J. 1996:Magnetic Anomalies of the Arctic and North Atlantic oceansand adjacent land areas. GAMMAA5 (Gridded Aeromag-netic and Marine Magnetics of the north Atlantic and Arc-tic, 5 km), Geological Survey of Canada, Open File Report3125a.
Watterson, J. 1975: Mechanism for the persistence of tectoniclineaments. Nature 253, 520-522.
Wood, D.S., Oertel, G., Rathore, J.S. & Bennett, H.F. 1976: Strainand anisotropy in rocks. Philosophical Transactions of theRoyal Society London A 283, 27-42.
Wright, A.E., Tarney, J., Palmer, K.F., Moorlock, B.S.P. & Skin-ner, A.C. 1973: The Geology of the Ammassalik Area, EastGreenland and possible relationships with the Lewisian ofScotland. In: Park, R.G. & Tarney, J. (eds): The Early Pre-cambrian of Scotland and Related Rocks of Greenland, 194pp. University of Keele, 157-177.
Magnetic Anisotropy in SE Greenland