bulletin of the seismological society of america · pdf filefigure 1. earthquake epicenters in...
TRANSCRIPT

THE SEISMOLOGICAL SOCIETY OF AMERICA400 Evelyn Ave., Suite 201
Albany, CA 94706-1375(510) 525-5474; FAX (510) 525-7204
www.seismosoc.org
Bulletin of the Seismological Society of America
This copy is for distribution only bythe authors of the article and their institutions
in accordance with the Open Access Policy of theSeismological Society of America.
For more information see the publications sectionof the SSA website at www.seismosoc.org
Paleoseismic Evidence for Multiple Mw ≥6 Earthquakes in the
Eastern Tennessee Seismic Zone during the Late Quaternary
by Kathleen F. Warrell,* Randel T. Cox, Robert D. Hatcher Jr.,James D. Vaughn,† and Ronald Counts
Abstract The eastern Tennessee seismic zone (ETSZ) is the second-most activeseismic zone in the eastern United States, but it has not generated an earthquake largerthan Mw 4.8 in historic time. Earthquakes are sourced deep in autochthonous base-ment, and there are no known faults originating at this depth that break the surface. Asa result, until recently, there has been virtually no fieldwork to identify Quaternarypaleoseismic features in the ETSZ. We present new results from paleoseismic inves-tigations of coseismic features that indicate the ETSZ generated Mw ≥6 earthquakesduring the late Quaternary. Detailed geologic mapping and trenching near Dandridge,Tennessee, record a northeast-trending zone of seismically generated features.Optically stimulated luminescence ages delimit timing for the formation ofpaleoseismic features crosscutting Quaternary alluvium and alluvium-filled fissures,including a thrust fault with ∼1 m displacement. Collectively, this zone of faults andfissures provides significant evidence that the ETSZ has produced at least three largeearthquakes during the late Pleistocene and at least one that exceeded Mw 6.
Introduction
Broadly intact cratonic crust in the eastern United Statesallows moderate-to-large earthquakes (Mw 4.5–7.5) to affectareas at least five times larger than earthquakes of equal mag-nitude in the western United States, where the crust is morefragmented (Bollinger et al., 1993; Bockholt et al., 2015).Thus, identifying seismogenic faults in the east is vital for ac-curate seismic-hazard assessments. The eastern Tennessee seis-mic zone (ETSZ) is second to the NewMadrid seismic zone inthe frequency of earthquakes in the eastern United States, yet ithas not generated an earthquake larger thanMw 4.8 in historictimes (e.g., Powell et al., 1994). As a result, even though theETSZ has far more earthquakes than the Charleston, SouthCarolina, seismic zone, seismic-hazard estimates for the ETSZare lower than those for Charleston (Bollinger et al., 1993; Pe-tersen et al., 2014). Several large population centers (e.g.,Knoxville, Tennessee and Chattanooga, Tennessee) and criticalinfrastructures (e.g., nuclear power plants, dams, and high-ways) are located in the ETSZ and may not be fully preparedfor large earthquakes (Fig. 1). In this article, we build on thefieldwork of Hatcher et al. (2012) and describe paleoseismicfeatures that suggest that the ETSZ has produced at least oneMw ≥6 earthquake during the Quaternary.
Background
The ETSZ extends from northeastern Alabama andnorthwestern Georgia into eastern Kentucky (Powell et al.,1994; Hatcher et al., 2012; Carpenter et al., 2014), encom-passing an area 50 km wide and>300 km long (Fig. 1). Thisarea is underlain by the late Paleozoic Appalachian forelandfold-thrust belt (Hardeman et al., 1966), but recent seismicityappears to be unrelated to the Paleozoic faults because thebasal décollement of the thin-skinned fold-thrust belt is3–5 km below the surface (Hatcher et al., 2007), and thehypocenters of ETSZ earthquakes lie at 5–26 km depth inPrecambrian basement rocks (Vlahovic et al., 1998). Toensure that the features we investigate are related to ETSZearthquakes and not Paleozoic earthquakes, this article fo-cuses on features that deform late Quaternary river sedimentsthat rest on shale bedrock.
Except for the geologic work by Whisner et al. (2003)and Hatcher et al. (2012), previous work in the ETSZ hasfocused on determining focal mechanism solutions of earth-quakes and resolving possible fault planes at depth usingsmall earthquakes (Chapman et al., 1997; Dunn and Chap-man, 2006; Cooley, 2014; Cooley et al., 2014). These focalmechanism solutions (mostly strike slip and thrust) are com-patible with the N70°E orientation of maximum principalcompressive stress (σ1) in the ETSZ, which is hypothesizedto derive from ridge-push forces originating at the Mid-Atlantic Ridge (Zoback and Zoback, 1991; Zoback, 1992;
*Now at Department of Earth and Planetary Sciences, Rutgers, The StateUniversity of New Jersey, 610 Taylor Road, Piscataway, New Jersey 08854-8066.
†Now at P.O. Box 1732, Fairfield Glade, Tennessee 38558.
BSSA Early Edition / 1
Bulletin of the Seismological Society of America, Vol. XX, No. xx, pp. –, – 2017, doi: 10.1785/0120160161

Figure1.
Earthquakeepicentersin
theeasternTennesseeseismiczone
depicted
relativ
eto
largecitiesin
theregion.D
andridge,T
ennessee,isthelocatio
nof
thefie
ldsitesforthisarticle.
Earthquakedata
arefrom
theAdvancedNationalS
eism
icSy
stem
Com
prehensive
Catalog.R
egionalsettin
gof
field
sitesDL-6
andDL-9.D
igitale
levatio
nmodel
source
=Sh
uttle
Radar
Topo
graphy
Mission
90m;geog
raph
icfeatures
from
The
NationalAtlas.
2 K. F. Warrell, R. T. Cox, R. D. Hatcher Jr., J. D. Vaughn, and R. Counts
BSSA Early Edition

Hurd and Zoback, 2012). Additionally, P- and S-wave arrivaltimes have been used to investigate the relationship of seis-mic-velocity anomalies in the ETSZ to the New York–Ala-bama magnetic-gravity lineament (King and Zietz, 1978;Vlahovic et al., 1998; Powell et al., 2014), which probablyrepresents a major crustal boundary in the Grenville orogen(King and Zietz, 1978). Other workers (e.g., Powell et al.,1994, 2014; Steltenpohl et al., 2010; Powell and Chapman,2012) attempted to correlate the distribution of ETSZ earth-quakes with this lineament. Hatcher et al. (2012, their fig. 1)stated that this correlation is unlikely because the New York–Alabama lineament has a much larger extent than the ETSZ,and areas of highest earthquake density are not necessarilylinear. Recent vertical relocation of ETSZ earthquakes (Po-well and Chapman, 2012) indicate that most of the seismicityoccurs east of the New York–Alabama lineament, and thatthe concentration of earthquakes is bounded on the west bythe lineament.
The first detailed field-based study of the ETSZ de-scribed folded Quaternary sediments in a small part of theETSZ that could possibly be related to paleoseismic activity(Whisner et al., 2003). More recently, Hatcher et al. (2012)made a detailed reconnaissance of French Broad Riverterraces exposed along Douglas Reservoir near Dandridge,Tennessee, and identified several faults, fractures, and lique-faction features that cut Quaternary sediment at sites alongthe reservoir.
In this article, we present the results of detailed geologicmapping and optically stimulated luminescence (OSL) agesof sediments at site DL-6 of Hatcher et al. (2012) and at siteDL-9 (an area of colinear sediment-filled fissures on the op-posite shore of the reservoir) west of Dandridge, Tennessee
(Figs. 1 and 2b); and use these to develop a chronology ofseismic events affecting the sites.
Previous Work
Hatcher et al. (2012) identified at least five fluvial strathterraces belonging to the French Broad River along theshores of Douglas Lake. The lowest terrace, the preimpound-ment floodplain, is only partly exposed in the upstream limitsof Douglas Lake during maximum (winter) drawdown.Winter drawdown increases terrace exposures throughout thereservoir, and these are the focus of Hatcher et al. (2012).The ages of French Broad River terraces are not well con-strained, but a terrace exposed 200 m south of Dandridge,Tennessee, yielded an OSL age of 203! 13 ka (Hatcheret al., 2012). OSL ages of deformed terraces provide only amaximum age for deformation.
Site DL-6 of Hatcher et al. (2012) is located on theinside of a meander of the modern French Broad River∼5 km southwest of Dandridge, Tennessee (Fig. 2). This siteis a south-facing exposure of a Quaternary terrace (saturatedOSL ages >112 and >103 ka) and Middle Ordovician Sev-ier Shale along a small tributary of the French Broad River(Hatcher et al., 2012; Fig. 2). Strong currents in the reservoirat this site have partially eroded the terrace deposits, expos-ing alluvium above the shale that ranges from 0 to 4.0 mthick. The basal alluvium on the bedrock strath is an∼0:5-m-thick discontinuous layer of pebbles, cobbles, andboulders composed mostly of rounded-vein quartz, somerounded-to-angular chert, minor granitoid and quartzite peb-bles, and rare amphibolite and calcsilicate pebbles. The clastsoriginate from the headwaters of the French Broad River,
Figure 2. (a) 1938 Tennessee Valley Authority aerial photo of sites DL-6 and DL-9 and the surrounding area. (b) Part of the Shady Grove7.5 min quadrangle, Tennessee (1939 version), showing the same area in (a) and sites DL-6 and DL-9. (b) Shaded areas indicate landelevations above maximum summer water level (305 m.a.s.l.) in Douglas Reservoir. C.I., contour interval.
Paleoseismic Evidence for Multiple Mw ≥6 Earthquakes in the ETSZ during the Late Quaternary 3
BSSA Early Edition
possibly as far away as the southeastern flank of the BlueRidge. This basal cobble layer is overlain by a red clay loamto sandy loam (Hatcher et al., 2012). A dark brown toreddish-yellow BC or BCt soil horizon may be locally devel-oped, and the surface soil is a 3"m thick, well-developedUltisol (Hatcher et al., 2012), which suggests the terraceis older than Holocene.
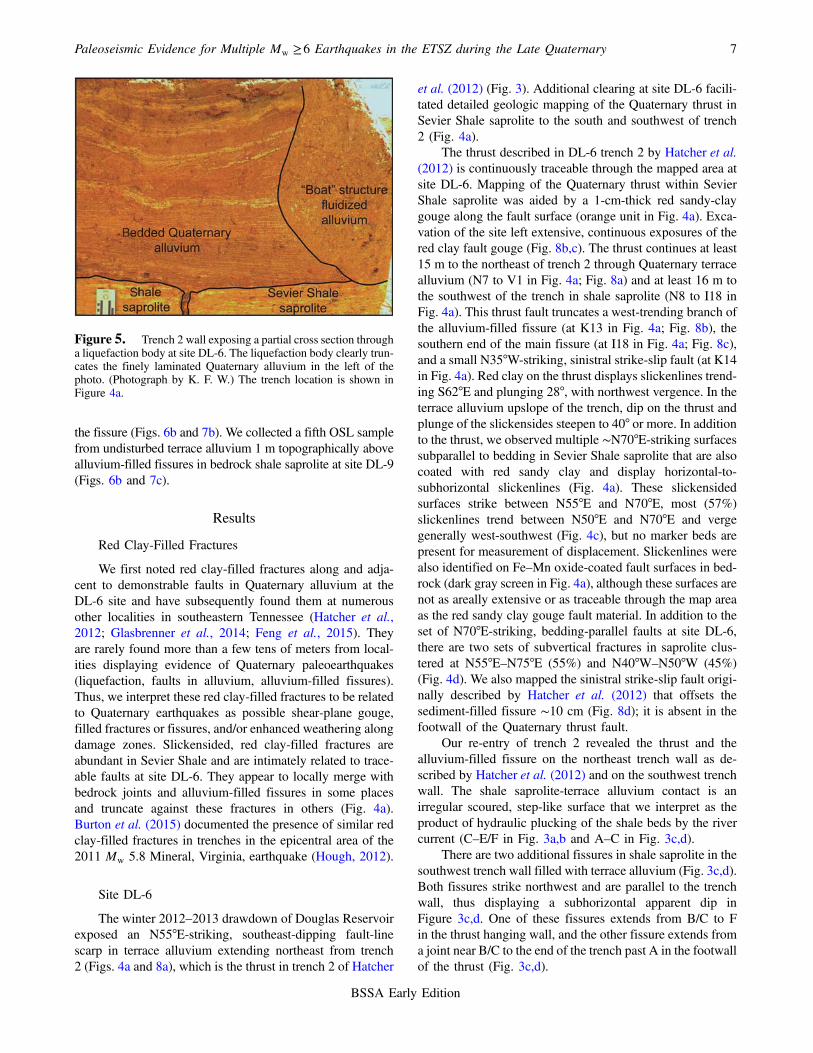
At site DL-6, Hatcher et al. (2012) described an ∼30 cmwide, N33°E-striking Quaternary fissure in N70°E-striking,15° SE-dipping Sevier Shale saprolite. The fissure is filledwith Quaternary alluvium from the overlying terrace.Because the northeast strike of the fissure is oblique to topo-graphic contours, Hatcher et al. (2012) argued that it isunlikely the fissure is related to landsliding, at least on theHolocene landscape. (We present herein new evidence thatthis fissure is part of a larger zone that crosses the FrenchBroad River valley and thus is not related to landsliding.)Trenching across this fissure revealed an N55°E-striking,southeast-dipping thrust fault with ∼1 m displacement of theterrace alluvium/bedrock contact (C–G in Fig. 3a,b and atN7.5 in Fig. 4a; Hatcher et al., 2012). The hanging wallmoved uphill, precluding a landslide origin. Fault dip is30°–40° within terrace alluvium but flattens to 15°, anddown-dip becomes listric, parallel to bedding within SevierShale saprolite (Figs. 3 and 4e). This thrust cuts the sedi-ment-filled fissure. An N35°W-striking, vertical, sinistralstrike-slip fault in the thrust hanging wall offsets the fissure10 cm (at K14.5 in Fig. 4a). Hatcher et al. (2012) also de-scribed a liquefaction body in terrace alluvium that predatesUltisol development (blue unit in Fig. 4a; Fig. 5). Beddinghas been destroyed by fluidization of the alluvium within theliquefaction body, and it represents a potential source bed forupward clastic intrusions. Rarity of similar features in terracealluvium around Douglas Lake argues that the destruction ofbedding within this body was not caused by a common proc-ess like tree throw. It is similar to other liquefaction bodiesdescribed previously, such as the bulbous-shaped lens pale-oliquefaction feature at site 2 of Bastin et al. (2015) in Can-terbury, New Zealand. These and other numerous featuresdiscovered at site DL-6 by Hatcher et al. (2012) suggestedat least twoMw ≥6 earthquakes and motivated detailed map-ping of a larger area of DL-6, expanded reconnoitering ofDouglas Lake winter low-water shore, and additional OSLdating of Quaternary alluvium.
Methods
Our study sites DL-6 and DL-9 (Figs. 1 and 2) are alongthe winter (low water) shore of Douglas Lake, built by theTennessee Valley Authority in 1943 by impounding theFrench Broad River, a principal drainage of the southernAppalachians. This reservoir provides a unique area in whichto study paleoseismic features in this region because the Ten-nessee Valley Authority seasonally lowers the water level ofthe reservoir some 15 m from late October until mid-April toaccommodate winter–spring runoff. As a result, during win-
ter large areas of the unvegetated lakebed expose multipleQuaternary French Broad River terrace deposits. Thispermits high-quality reconnaissance and detailed geologicmapping of potential paleoseismic features that occur inQuaternary alluvium and underlying bedrock. Alluvial terra-ces at study sites DL-6 and DL-9 are underlain by MiddleOrdovician Sevier Shale, thus avoiding the misinterpretationof sinkhole collapse in carbonate bedrock as deformationrelated to recent fault movement.
To expand the mapping of Hatcher et al. (2012), siteDL-6 was bulldozed during winter low water to removemodern lake sediment and topographic irregularities. Usinga 2 m grid, we mapped the cleared area in as much detail aspossible (Fig. 4a), although terrace alluvium in the mappedarea contains few recognizable features because of intenseweathering and soil development. We measured strike anddip on fault and fracture surfaces and on bedding in bedrockand measured trend-and-plunge of slickenlines (Fig. 4a–d).Also, at site DL-6, trench 2 of Hatcher et al. (2012) was re-opened to expose the Quaternary thrust, and the first detaileddescription of the southwest trench wall is presented here(Fig. 3c,d). A shallow water table prevented excavating thetrench deeper than 1.5 m.
Investigation of Quaternary deformation associated withstructures observed at site DL-6 was further expanded by rec-onnoitering the Douglas Lake shoreline at a lower water levelthan previous attempts. We cleared modern lake sediment atsite DL-9 by hand shovel, mapped Quaternary fissures filledwith terrace alluvium and joints in Quaternary alluvium us-ing a 1 m grid, and made structural measurements on fissureand joint surfaces (Fig. 6).
OSL samples were collected in opaque tubes to ensurethey were not exposed to sunlight, and the OSL samples weresent to the Luminescence Dating Research Laboratory at theUniversity of Illinois-Chicago for analyses. At the Universityof Illinois-Chicago, OSL ages were calculated using the Gal-braith et al. (1999) minimum age model which assigns agreater weight to the youngest equivalent dose population.This model was adopted because overdispersion values forthese samples are high (>35%). The coarse-grained (150–250 μm) quartz fraction was analyzed. Equivalent dose valueswere analyzed under blue-light excitation (470" 20 nm)following single aliquot protocols of Murray and Wintle(2003). U, Th, and K2O content were measured by inductivelycoupled plasma-mass spectrometry at Activation LaboratoriesLtd., Ancaster, Ontario, Canada. The cosmic component ofthe dose rate was estimated from Prescott and Hutton (1994).We collected four new OSL samples from terrace alluviumwithin fissures in Sevier Shale saprolite: two were collectedfrom the map-view trace of the main fissure at site DL-6(Fig. 4a) by driving a tube vertically into the alluvium fillingthe fissure; one was collected from a fissure branch in the westwall of trench 2 at site DL-6 (Fig. 3c,d) by driving a tube hori-zontally into the alluvium filling the fissure, and one wascollected from a fissure exposed in a pit excavated at siteDL-9 by driving a tube horizontally into the alluvium filling
4 K. F. Warrell, R. T. Cox, R. D. Hatcher Jr., J. D. Vaughn, and R. Counts
BSSA Early Edition

Figure 3. Composite photographs of (a,b) the northeast wall of trench 2 of Hatcher et al. (2012) and (c,d) the southwest wall of the sametrench (first described herein) at site DL-6 that expose an N55°E-striking thrust fault that truncates an N33°E-striking alluvium-filled fissure,along with sketch overlays of the photographs. Note two small faults splaying from the main thrust on the northeast wall. The main thrust has∼1-m upslope displacement. The location of the southern end of a liquefaction body is also shown on the northeast wall. Half arrowheadsdenote the dip-slip component of displacement. The trench location is shown in Figure 4a. (Photographs by R. D. H.)
Paleoseismic Evidence for Multiple Mw ≥6 Earthquakes in the ETSZ during the Late Quaternary 5
BSSA Early Edition
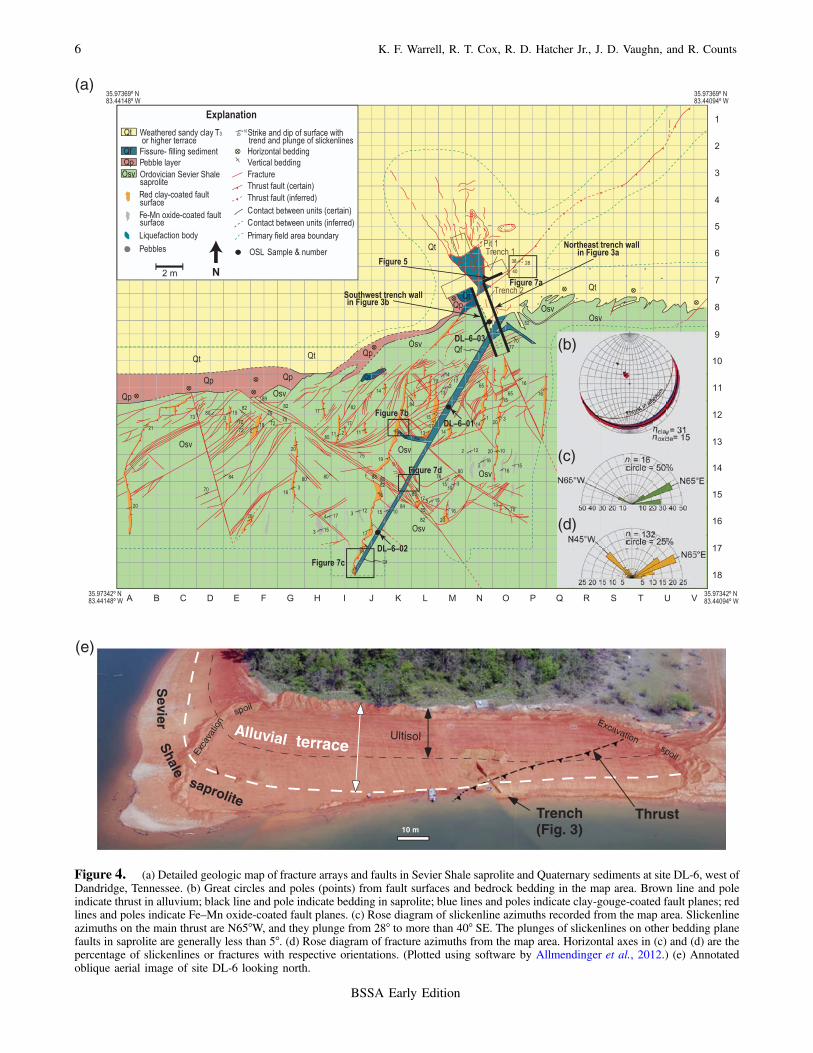
Figure 4. (a) Detailed geologic map of fracture arrays and faults in Sevier Shale saprolite and Quaternary sediments at site DL-6, west ofDandridge, Tennessee. (b) Great circles and poles (points) from fault surfaces and bedrock bedding in the map area. Brown line and poleindicate thrust in alluvium; black line and pole indicate bedding in saprolite; blue lines and poles indicate clay-gouge-coated fault planes; redlines and poles indicate Fe–Mn oxide-coated fault planes. (c) Rose diagram of slickenline azimuths recorded from the map area. Slickenlineazimuths on the main thrust are N65°W, and they plunge from 28° to more than 40° SE. The plunges of slickenlines on other bedding planefaults in saprolite are generally less than 5°. (d) Rose diagram of fracture azimuths from the map area. Horizontal axes in (c) and (d) are thepercentage of slickenlines or fractures with respective orientations. (Plotted using software by Allmendinger et al., 2012.) (e) Annotatedoblique aerial image of site DL-6 looking north.
6 K. F. Warrell, R. T. Cox, R. D. Hatcher Jr., J. D. Vaughn, and R. Counts
BSSA Early Edition
the fissure (Figs. 6b and 7b). We collected a fifth OSL samplefrom undisturbed terrace alluvium 1 m topographically abovealluvium-filled fissures in bedrock shale saprolite at site DL-9(Figs. 6b and 7c).
Results
Red Clay-Filled Fractures
We first noted red clay-filled fractures along and adja-cent to demonstrable faults in Quaternary alluvium at theDL-6 site and have subsequently found them at numerousother localities in southeastern Tennessee (Hatcher et al.,2012; Glasbrenner et al., 2014; Feng et al., 2015). Theyare rarely found more than a few tens of meters from local-ities displaying evidence of Quaternary paleoearthquakes(liquefaction, faults in alluvium, alluvium-filled fissures).Thus, we interpret these red clay-filled fractures to be relatedto Quaternary earthquakes as possible shear-plane gouge,filled fractures or fissures, and/or enhanced weathering alongdamage zones. Slickensided, red clay-filled fractures areabundant in Sevier Shale and are intimately related to trace-able faults at site DL-6. They appear to locally merge withbedrock joints and alluvium-filled fissures in some placesand truncate against these fractures in others (Fig. 4a).Burton et al. (2015) documented the presence of similar redclay-filled fractures in trenches in the epicentral area of the2011 Mw 5.8 Mineral, Virginia, earthquake (Hough, 2012).
Site DL-6
The winter 2012–2013 drawdown of Douglas Reservoirexposed an N55°E-striking, southeast-dipping fault-linescarp in terrace alluvium extending northeast from trench2 (Figs. 4a and 8a), which is the thrust in trench 2 of Hatcher
et al. (2012) (Fig. 3). Additional clearing at site DL-6 facili-tated detailed geologic mapping of the Quaternary thrust inSevier Shale saprolite to the south and southwest of trench2 (Fig. 4a).
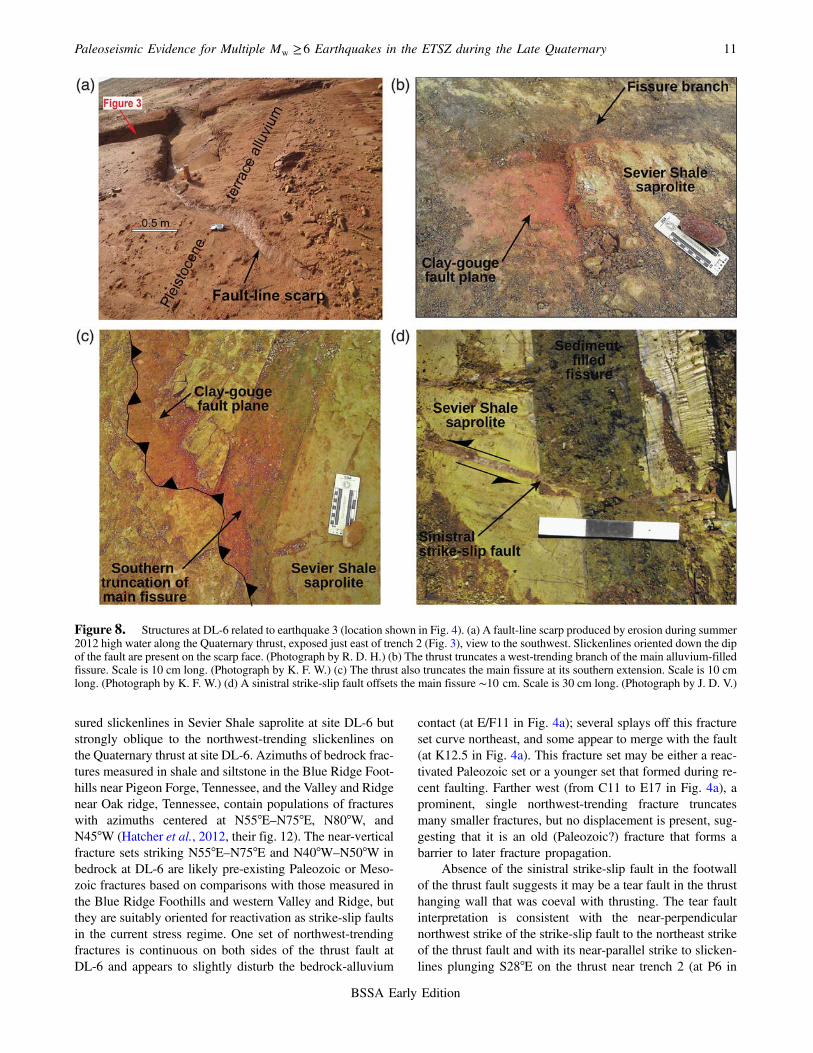
The thrust described in DL-6 trench 2 by Hatcher et al.(2012) is continuously traceable through the mapped area atsite DL-6. Mapping of the Quaternary thrust within SevierShale saprolite was aided by a 1-cm-thick red sandy-claygouge along the fault surface (orange unit in Fig. 4a). Exca-vation of the site left extensive, continuous exposures of thered clay fault gouge (Fig. 8b,c). The thrust continues at least15 m to the northeast of trench 2 through Quaternary terracealluvium (N7 to V1 in Fig. 4a; Fig. 8a) and at least 16 m tothe southwest of the trench in shale saprolite (N8 to I18 inFig. 4a). This thrust fault truncates a west-trending branch ofthe alluvium-filled fissure (at K13 in Fig. 4a; Fig. 8b), thesouthern end of the main fissure (at I18 in Fig. 4a; Fig. 8c),and a small N35°W-striking, sinistral strike-slip fault (at K14in Fig. 4a). Red clay on the thrust displays slickenlines trend-ing S62°E and plunging 28°, with northwest vergence. In theterrace alluvium upslope of the trench, dip on the thrust andplunge of the slickensides steepen to 40° or more. In additionto the thrust, we observed multiple ∼N70°E-striking surfacessubparallel to bedding in Sevier Shale saprolite that are alsocoated with red sandy clay and display horizontal-to-subhorizontal slickenlines (Fig. 4a). These slickensidedsurfaces strike between N55°E and N70°E, most (57%)slickenlines trend between N50°E and N70°E and vergegenerally west-southwest (Fig. 4c), but no marker beds arepresent for measurement of displacement. Slickenlines werealso identified on Fe–Mn oxide-coated fault surfaces in bed-rock (dark gray screen in Fig. 4a), although these surfaces arenot as areally extensive or as traceable through the map areaas the red sandy clay gouge fault material. In addition to theset of N70°E-striking, bedding-parallel faults at site DL-6,there are two sets of subvertical fractures in saprolite clus-tered at N55°E–N75°E (55%) and N40°W–N50°W (45%)(Fig. 4d). We also mapped the sinistral strike-slip fault origi-nally described by Hatcher et al. (2012) that offsets thesediment-filled fissure ∼10 cm (Fig. 8d); it is absent in thefootwall of the Quaternary thrust fault.
Our re-entry of trench 2 revealed the thrust and thealluvium-filled fissure on the northeast trench wall as de-scribed by Hatcher et al. (2012) and on the southwest trenchwall. The shale saprolite-terrace alluvium contact is anirregular scoured, step-like surface that we interpret as theproduct of hydraulic plucking of the shale beds by the rivercurrent (C–E/F in Fig. 3a,b and A–C in Fig. 3c,d).
There are two additional fissures in shale saprolite in thesouthwest trench wall filled with terrace alluvium (Fig. 3c,d).Both fissures strike northwest and are parallel to the trenchwall, thus displaying a subhorizontal apparent dip inFigure 3c,d. One of these fissures extends from B/C to Fin the thrust hanging wall, and the other fissure extends froma joint near B/C to the end of the trench past A in the footwallof the thrust (Fig. 3c,d).
Figure 5. Trench 2 wall exposing a partial cross section througha liquefaction body at site DL-6. The liquefaction body clearly trun-cates the finely laminated Quaternary alluvium in the left of thephoto. (Photograph by K. F. W.) The trench location is shown inFigure 4a.
Paleoseismic Evidence for Multiple Mw ≥6 Earthquakes in the ETSZ during the Late Quaternary 7
BSSA Early Edition
Site DL-9
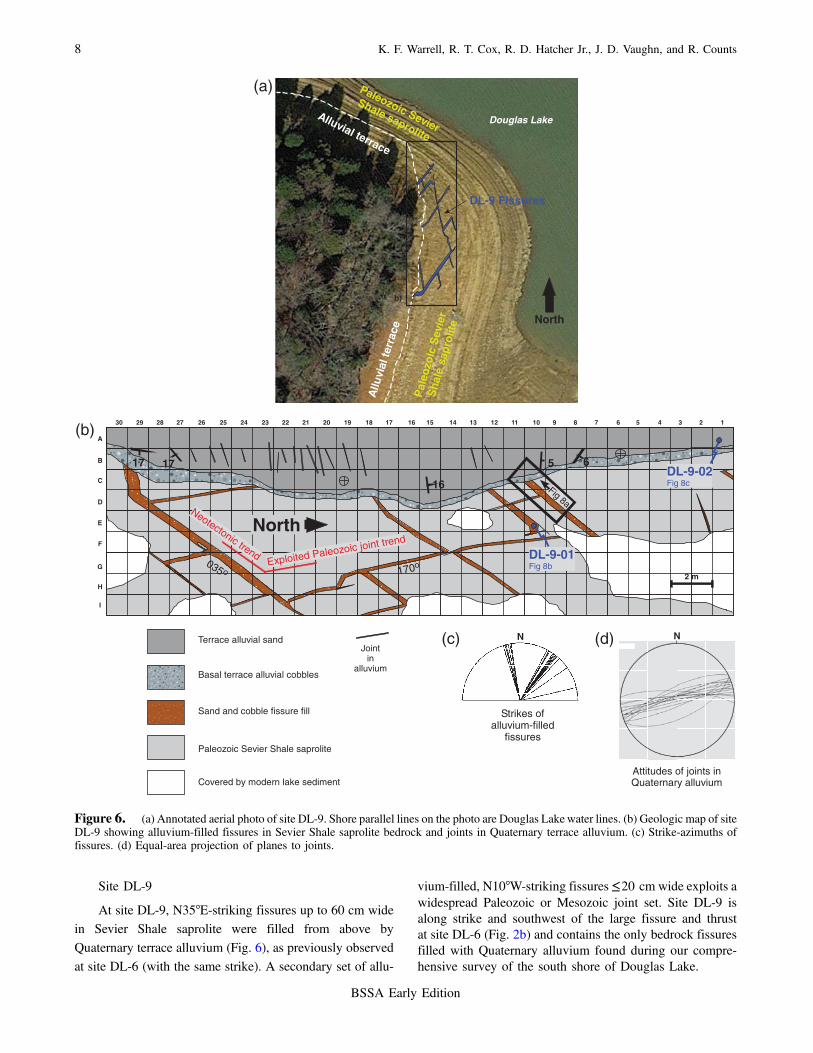
At site DL-9, N35°E-striking fissures up to 60 cm widein Sevier Shale saprolite were filled from above byQuaternary terrace alluvium (Fig. 6), as previously observedat site DL-6 (with the same strike). A secondary set of allu-
vium-filled, N10°W-striking fissures ≤20 cm wide exploits awidespread Paleozoic or Mesozoic joint set. Site DL-9 isalong strike and southwest of the large fissure and thrustat site DL-6 (Fig. 2b) and contains the only bedrock fissuresfilled with Quaternary alluvium found during our compre-hensive survey of the south shore of Douglas Lake.
b)
Douglas Lake
Pal
eozo
icS
evie
rS
hale
sapr
olite
Paleozoic Sevier
Shale saprolite
DL-9 Fissures
(a)
(b)
Alluvial terrace
Allu
vial
terr
ace North
Terrace alluvial sand
Basal terrace alluvial cobbles
Paleozoic Sevier Shale saprolite
Sand and cobble fissure fill
Covered by modern lake sediment
Jointin
alluvium
035 o 170o
17 17
16
5 6
26 25 24 23 22 21 20 19 18 17 16 15 14 13 12 11 10 9 8 7 6 5 4 3 2 130 29 2728
G
F
E
D
C
B
A
H
I
Exploited Paleozoic joint trend
Neotectonic trend DL-9-01Fig 8b
DL-9-02Fig 8c
2 m
N
Strikes ofalluvium-filled
fissures
N
Attitudes of joints inQuaternary alluvium
Fig 8a
North
(c) (d)
Figure 6. (a) Annotated aerial photo of site DL-9. Shore parallel lines on the photo are Douglas Lake water lines. (b) Geologic map of siteDL-9 showing alluvium-filled fissures in Sevier Shale saprolite bedrock and joints in Quaternary terrace alluvium. (c) Strike-azimuths offissures. (d) Equal-area projection of planes to joints.
8 K. F. Warrell, R. T. Cox, R. D. Hatcher Jr., J. D. Vaughn, and R. Counts
BSSA Early Edition
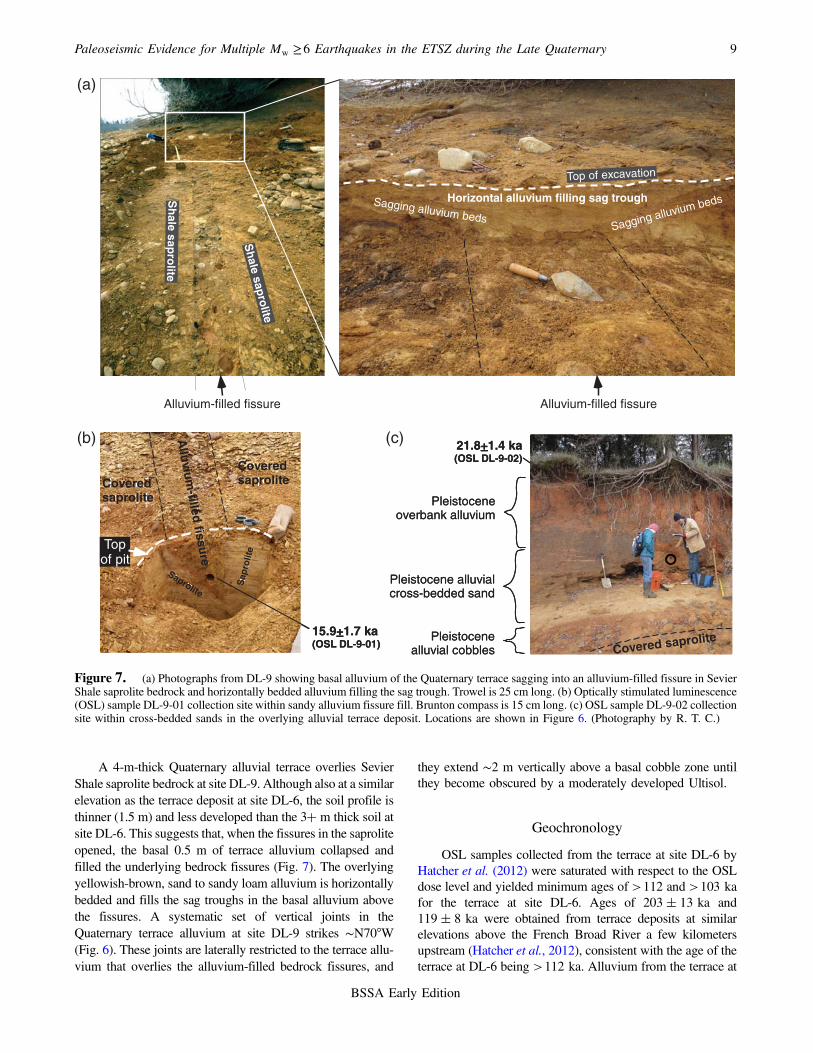
A 4-m-thick Quaternary alluvial terrace overlies SevierShale saprolite bedrock at site DL-9. Although also at a similarelevation as the terrace deposit at site DL-6, the soil profile isthinner (1.5 m) and less developed than the 3"m thick soil atsite DL-6. This suggests that, when the fissures in the saproliteopened, the basal 0.5 m of terrace alluvium collapsed andfilled the underlying bedrock fissures (Fig. 7). The overlyingyellowish-brown, sand to sandy loam alluvium is horizontallybedded and fills the sag troughs in the basal alluvium abovethe fissures. A systematic set of vertical joints in theQuaternary terrace alluvium at site DL-9 strikes ∼N70°W(Fig. 6). These joints are laterally restricted to the terrace allu-vium that overlies the alluvium-filled bedrock fissures, and
they extend ∼2 m vertically above a basal cobble zone untilthey become obscured by a moderately developed Ultisol.
Geochronology
OSL samples collected from the terrace at site DL-6 byHatcher et al. (2012) were saturated with respect to the OSLdose level and yielded minimum ages of >112 and >103 kafor the terrace at site DL-6. Ages of 203! 13 ka and119! 8 ka were obtained from terrace deposits at similarelevations above the French Broad River a few kilometersupstream (Hatcher et al., 2012), consistent with the age of theterrace at DL-6 being >112 ka. Alluvium from the terrace at
Alluvium-filled fissure
Sagging alluvium bedsSagging alluvium bedsHorizontal alluvium filling sag troughS
halesaprolite
Shale
saprolite
Top of excavation
Alluvium-filled fissure
(a)
(b) (c) 21.8+1.4 ka(OSL DL-9-02)
15.9+1.7 ka(OSL DL-9-01)
Sap
rolit
e
Saprolite
Topof pit
CoveredsaproliteCovered
saprolite
Alluvium
-filledfissure
Covered saprolitePleistocenealluvial cobbles
Pleistocene alluvialcross-bedded sand
Pleistoceneoverbank alluvium
21.8+1.4 ka(OSL DL-9-02)
SSSSSSSSSSSSSSSSSSSSSSSSSaaaaaaaaaaaaaaaaaaaaaaaaaaaaaaapppppppppppppppppppppppppppppppppp
rrrrrrrrrrrrrrrrrooooooooooooooolllllllllllllllllllllllllliiiiiiiiiiiiiiittttttttttttttttttttttttttttttttttttttttttt
eeeeeeeeeeeeeeeeeeeeeeeeeeeeeeeeeeee
SSSSSSSSSSSSSSSSSSSSSSSSSSSSSSSSSSSSSSSSSSSSSSSSaaaaaaaaaaaaaaaaaaaaaaaaaaaapppppppppppppppppppppppppppppppppppprrrrrrrrrrrrrrrrrroooooooooooooooooooooolllllllllllllllllllllllllliiiiiiiiiiiiiiiiiiiiiiiiiittttttttttttttttttttttttttttttteeeeeeeeeeeeeeeeeeeeeeeeeeeeeeeeeeeeeeee
TTTTTTTTTTTTTTTTTTTTTTTTTTTTTTTTTTTTTTTTTTTTTTTTTTTTTTTTTTTTTTTTTTTTTTTTTTTTTTTTTTTTTTTTTTTTTTTTTTTTTTTTTTTTTTTTTTTTTTTTTTTTTToooooooooooooooooooooooooooooooooooooooooooooooooooooooooooooooooooooooooooooooooooooooooooooooooooooooooooooooooooooooooooTTTTTTTTTTTTTTTTTTTTTTTTTTTTTTTTTTTTTTTTTTTTTTTTTTTTTTTTTTTTTTTTTTTTTTTTTTTT ppppppppppppppppppppppppppppppppppppppppppppppppppppppppppppppppppppppppppppppppppppppppppppppppppppppppppppppppppppppppppppppppoooooooooooooooooooooooooooooooooooooooooooooooooooooooooooooooooooooooooooooooooooooooooooooooooooooooooooooooooooooooooooooooooooooooooooooooooooooffffffffffffffffffffffffffffffffffffffffffffffffffffffffffffffffff ppppppppppppppppppppppppppppppppppppppppppppppppppppppppppppppppppppppppppppppppppppppppppppppppppppppppppppppppppppppppppppppppppppppppppppppppppiiiiiiiiiiiiiiiiiiiiiiiiiiiiiiiiiiiiiiiittttttttttttttttttttttttttttttttttttttttttttttttt
CCCCCCCCCCCCCCCCCCCCCCCCCCCCCCCCCCCCCCCCCCCCCCCCCCCCCCCCCCCCCCCCCCCCCCCCCCCCCCCCCCCCCCCCCCCCCCCCCCCCCCCCCCCCCCCCCCCCCCCCCCCCCCCCCCCCCCCCCCCCCCCCCCCCCCCCCCCCCCCCCCCCCCCCCCCCCCCCCCCCCCCCCCCCCCCCCCCCCCCCCCCCCCCCCCCCCCCCCCCCCCCCCCCCCCCCCCCCCCCCCCCCCCCCCCCCCCCCCCCCCCCCCCCCCCCCCCCCCCCCCCCCCCCCCCCoooooooooooooooooooooooooooooooooooooooooooooooooooooooooooooooooooooooooooooooooooooooooooooooooooooooooooooooooooooooooooooooooooooooooooooooooooooooooooooooooooooooooooooooooooooooooooooovvvvvvvvvvvvvvvvvvvvvvvvvvvvvvvvvvvvvvvvvvvvvvvvvvvvvvvvvvvvvvvvvvvvvvvvvvvvvvvvvvvvvvvvvvvvvvvvvvvvvvvvvvvvvvvvvvvvvvvvvvvvvvvvvvvvvvvvvvvvvvvvvvvvvvvvvvvvvvvvvvvvvveeeeeeeeeeeeeeeeeeeeeeeeeeeeeeeeeeeeeeeeeeeeeeeeeeeeeeeeeeeeeeeeeeeeeeeeeeeeeeeeeeeeeeeeeeeeeeeeeeeeeeeeeeeeeeeeeeeeeeeeeeeeeeeeeeeeeeeeeeeeeeeeeeeeeeeeeeeeeeeeeeeeeeeeeeeeeeeeeeeeeeeeeeeerrrrrrrrrrrrrrrrrrrrrrrrrrrrrrrrrrrrrrrrrrrrrrrrrrrrrrrrrrrrrrrrrrrrrrrrrrrrrrrrrrrrrrrrrrrrrrrrreeeeeeeeeeeeeeeeeeeeeeeeeeeeeeeeeeeeeeeeeeeeeeeeeeeeeeeeeeeeeeeeeeeeeeeeeeeeeeeeeeeeeeeeeeeeeeeeeeeeeeeeeeeeeeeeeeeeeeeeeeeeeedddddddddddddddddddddddddddddddddddddddddddddddddddddddddddddddddddddddddddddddddddddddddddddddddddddddddddddddddddddddddddddddddddddddddddddddssssssssssssssssssssssssssssssssssssssssssssssssssssssssssssssssssssssssssssssssssssssssssssssssssssssssssssssssssssssssssssssssssssssssssssssssssssssssssssssssssssssaaaaaaaaaaaaaaaaaaaaaaaaaaaaaaaaaaaaaaaaaaaaaaaaaaaaaaaaaaaaaaaaaaaaaaaaaaaaaaaaaaaaaaaaaaaaaaaaaaaaaaaaaaaaaaaaaaaaaaaaaaappppppppppppppppppppppppppppppppppppppppppppppppppppppppppppppppppppppppppppppppppppppppppppppppppprrrrrrrrrrrrrrrrrrrrrrrrrrrrrrrrrrrrrrrrrrrrrrrrrrrrrrrrrrrrrrrrrrrrrrrrrrrrrrroooooooooooooooooooooooooooooooooooooooooooooooooooooooooooooooooooooooooooooooooooooooooooooooolllllllllllllllllllllllllllllllllllllllllllllllllllllllllllllliiiiiiiiiiiiiiiiiiiiiiiiiiiiiiiiiiiiiiiiiiiiiiiiiiiiiiiiiiiiiiittttttttttttttttttttttttttttttttttttttttttttttttttttttttttttttttttttttttttttttttttttttttttttttttttttttttttttttttttttteeeeeeeeeeeeeeeeeeeeeeeeeeeeeeeeeeeeeeeeeeeeeeeeeeeeeeeeeeeeeeeeeeeeeeeeeeeeeeeeeeeeeeeeeeeeeeeeeeeeeeeeeeCCCCCCCCCCCCCCCCCCCCCCCCCCCCCCCCCCCCCCCCCCCCCCCCCCCCCCCCCCCCCCCCCCCCCCCCCCCCCCCCCCCCCCCCCCCCCCCCCCCCCCCCCCCCCCCCCCCCCCCCCCCCCCCCCCCCCCCCCCCCCCCCCCCCCCCCCCCCCCCCCCCCCCCCCCCCCCCCCCCCCCCCooooooooooooooooooooooooooooooooooooooooooooooooooooooooooooooooooooooooooooooooooooooooooooooooooooooooooooooooooooooooooooooooooooooooooooooooooooooovvvvvvvvvvvvvvvvvvvvvvvvvvvvvvvvvvvvvvvvvvvvvvvvvvvvvvvvvvvvvvvvvvvvvvvvvvvvvvvvvvvvvvvvvvvvvvvvvvvvvvvvvvvvvvvvvvvvvvvvvvvvvvvvvvvvvvvvvvvvvvvvvvvvvvvvvvvvvvvvvvvvvvvvvvvvveeeeeeeeeeeeeeeeeeeeeeeeeeeeeeeeeeeeeeeeeeeeeeeeeeeeeeeeeeeeeeeeeeeeeeeeeeeeeeeeeeeeeeeeeeeeeeeeeeeeeeeeeeeeeeeeeeeeeeeeeeeeeeeeeeeeeeeeeeeeeeeeeeeeeeeeeeeeeeeeeeeeeeeeeerrrrrrrrrrrrrrrrrrrrrrrrrrrrrrrrrrrrrrrrrrrrrrrrrrrrrrrrrrrrrrrrrrrrrrrrrrrrrrrrrrrrrrrrrrreeeeeeeeeeeeeeeeeeeeeeeeeeeeeeeeeeeeeeeeeeeeeeeeeeeeeeeeeeeeeeeeeeeeeeeeeeeeeeeeeeeeeeeeeeeeeeeeeeeeeeeeeeeeeeeeeeeeeeeeeeedddddddddddddddddddddddddddddddddddddddddddddddddddddddddddddddddddddddddddddddddddddddddddddddddddddddddddddddddddddddddddddddddddddddddddddddddddddddddddddddddddddddddddddddddddddddddddddddddddddddddddddddddddd
ssssssssssssssssssssssssssssssssssssssssssssssssssssssssssssssssssssssssssssssssssssssssssssssssssssssssssssssssssssssssssssaaaaaaaaaaaaaaaaaaaaaaaaaaaaaaaaaaaaaaaaaaaaaaaaaaaaaaaaaaaaaaaaaaaaaaaaaaaaaaaaaaaaaaaaaaaaaaaaaaaaaaaaaapppppppppppppppppppppppppppppppppppppppppppppppppppppppppppppppppppppppppppppppppppppppprrrrrrrrrrrrrrrrrrrrrrrrrrrrrrrrrrrrrrrrrrrrrrrrrrrrrrrrrrrrrrrrrrrrrrrrrrrrrrrrrrrrrrrrrrrrrrrrroooooooooooooooooooooooooooooooooooooooooooooooooooooooooooooooooooooooooooooooooooooooooooooooooooooooooooooooooolllllllllllllllllllllllllllllllllllllllllllllllllllllllllllllllllliiiiiiiiiiiiiiiiiiiiiiiiiiiiiiiiiiiiiiiiiiiiiiiiiiiiiiiiiiiiiiiitttttttttttttttttttttttttttttttttttttttttttttttttttttttttttttttttttttttttttttttttttttttttttttttttttttttttttteeeeeeeeeeeeeeeeeeeeeeeeeeeeeeeeeeeeeeeeeeeeeeeeeeeeeeeeeeeeeeeeeeeeeeeeeeeeeeeeeeeeeeeeeeeeeee
AAAAAAAAAAAAAAAAAAAAAAAAAAAAAAAAAAAAAAAAAAAAAAAAAAAAAAAAAAAAAAAAAAAAAAAAAAAAAAAAAAAAAAAAAAAAAAAAAAAAAAAAAAAAAAAAAAAAAAAAAAAAAAAAAAAAAAAAAAAAAAAAAAAAAAAAAAAAAAAAAAAAAAAAAAAAAAAAAAAAAAAAAAAAAAAAAAAAAAAAAAAAAAAAAAAAAAAAAAAAAAAAAAAlllllllllllllllllllllllllllllllllllllllllllllllllllllllllllllllllllllllllllllllllllllllllllllllllllllllllllllllllllllllllllllllllllllllllllllllllllllllllllllllllllllllllllllllllllllllllluuuuuuuuuuuuuuuuuuuuuuuuuuuuuuuuuuuuuuuuuuuuuuuuuuuuuuuuuuuuuuuuuuuuuuuuuuuuuuuuuuuuuuuuuuuuuuuuuuuuuuuuuuuuuuuuuuuuuuuuuuuuuuuuuuuuuuuuuuuuuuuuuuuuvvvvvvvvvvvvvvvvvvvvvvvvvvvvvvvvvvvvvvvvvvvvvvvvvvvvvvvvvvvvvvvvvvvvvvvvvvvvvvvvvvvvvvvvvvvvvvvvvvvvvvvvvvvvvvvvvvvvvvvvvvvvvvvvvvvvvvvvvvvvvvvvvvvvvvvvvvvvvvvvvvvvvvvvvvvvvvvvvvvviiiiiiiiiiiiiiiiiiiiiiiiiiiiiiiiiiiiiiiiiiiiiiiiiiiiiiiiiiiiiiiiiiiiiiiiiiiiiiiiiiiiiiiiiiiiiiiiiiiiiiiiiiiuuuuuuuuuuuuuuuuuuuuuuuuuuuuuuuuuuuuuuuuuuuuuuuuuuuuuuuuuuuuuuuuuuuuuuuuuuuuuuuuuuuuuuuuuuuuuuuuuuuuuuuuuuuuuuuuuuuuuummmmmmmmmmmmmmmmmmmmmmmmmmmmmmmmmmmmmmmmmmmmmmmmmmmmmmmmmmmmmmmmmmmmmmmmmmmmmmmmmmmmmmmmmmmmmmmmmmmmmmmmmmmmmmmmmmmmmmmmmmmmmmmmmmmmmmmmmmmmmmmmmmmmmmmmmmmmmmmmmmmmmmmmmmmmmmmmmmm
-----------------------------------------fffffffffffffffffffffffffffffffffffffffffffffffffffffffffffffffffffffffffffffffffffffffffffffffffffffffffffffffffffffffffffffffffffffffffffffffffffffffffffffffffffffiiiiiiiiiiiiiiiiiiiiiiiiiiiiiiiiiiiiiiiiiiiiiiiiiiiiiiiiiiiiiiiiiiiiiiiiiiiiiiiiiiiiiiiillllllllllllllllllllllllllllllllllllllllllllllllllllllllllllllllllllllllllllllllllllllllllllllllllllllllllllllllllllllllllllllllllllllllllllllllllllllllllllllllllllllllllllllllllllllllllleeeeeeeeeeeeeeeeeeeeeeeeeeeeeeeeeeeeeeeeeeeeeeeeeeeeeeeeeeeeeeeeeeeeeeeeeeeeeeeeeeeeeeeeeeeeeeeeeeeeeeeeeeeeeeeeeeeeeeeeeeeeeeeeeeeeeeeeeeeeeeeeeeeeeeeeeedddddddddddddddddddddddddddddddddddddddddddddddddddddddddddddddddddddddddddddddddddddddddddddddddddddddddddddddddddddddddffffffffffffffffffffffffffffffffffffffffffffffffffffffffffffffffffffffffffffffffffffffffiiiiiiiiiiiiiiiiiiiiiiiiiiiiiiiiiiiiiiiiiiiiiiiiiiiiiiiiiiiiiiiiiiiiiiisssssssssssssssssssssssssssssssssssssssssssssssssssssssssssssssssssssssssssssssssssssssssssssssssssssssssssssssssssssssssssssssssssssssssssssssssssssssssssssssssssssssssssssssssssssssssssssssssssssssssssssssssssssssssssssssssssssssssssssssssssssssssssssssssssssssuuuuuuuuuuuuuuuuuuuuuuuuuuuuuuuuuuuuuuuuuuuuuuuuuuuuuuuuuuuuuuuuuuuuuuuuuuuuuurrrrrrrrrrrrrrrrrrrrrrrrrrrrrrrrrrrrrrrrrrrreeeeeeeeeeeeeeeeeeeeeeeeeeeeeeeeeeeeeeeeeeeeeeeeeeeeeee
CCCCCCCCCCCCCCCCCCCCCCCCCCCCCCCCCCCCCCCCCCCCCCCCCCCCCCCCCCCCCCCCCCCCCCCCCCCCCCCCCCCCCCCCCCCCCCCoooooooooooooooooooooooooooooovvvvvvvvvvvvvvvvvvvvvvvvvvvvvvvvvvvvvvvvvvvvvvvvvvvvvvvvvvvvvvvvvveeeeeeeeeeeeeeeeeeeeeerrrrrrrrrrrrrrrrrrrrrrrrrrreeeeeeeeeeeeeeeeeeeddddddddddddddddddddddddddddddddddddddd ssssssssssssssssssssssssssssssssssssssssssssssssssssssssssaaaaaaaaaaaaaaaaaaapppppppppppppppppppppppppppppppppppppppppprrrrrrrrrrrrrrrrrrrrrrrrrrrrrrrrrrrroooooooooooooooooooooooooooooooooooooolllllllllllllllllllllllllllllllllllllllllllllllllllllllliiiiiiiiiiiiiiiiiiiiiiiiiiiiiiiiiiittttttttttttttttttttttttttttttttttttttttttttttttttttttttttttttttttttttttttttttttttttttttteeeeeeeeeeeeeeeeeeeeeeeeeeeeeeeeeeeeeeeeeeeeeeeeeeeeeeeeeeeeeeeeeeeeeeeeeeeeeeeeeeeeeeeeeeeeeeeeeeeeeeeeeeee15.9+1.7 ka(OSL DL-9-01)
Sap
rolit
e
Saprolite
Topof pit
CoveredsaproliteCovered
saprolite
Alluvium
-filledfissure
Covered saprolitePleistocenealluvial cobbles
Pleistocene alluvialcross-bedded sand
Pleistoceneoverbank alluvium
Figure 7. (a) Photographs from DL-9 showing basal alluvium of the Quaternary terrace sagging into an alluvium-filled fissure in SevierShale saprolite bedrock and horizontally bedded alluvium filling the sag trough. Trowel is 25 cm long. (b) Optically stimulated luminescence(OSL) sample DL-9-01 collection site within sandy alluvium fissure fill. Brunton compass is 15 cm long. (c) OSL sample DL-9-02 collectionsite within cross-bedded sands in the overlying alluvial terrace deposit. Locations are shown in Figure 6. (Photography by R. T. C.)
Paleoseismic Evidence for Multiple Mw ≥6 Earthquakes in the ETSZ during the Late Quaternary 9
BSSA Early Edition

site DL-9 (OSL sample DL-9-02) has an age of 21:8! 1:4 ka(Figs. 6b and 7c; Table 1). This age is from undeformedalluvium above alluvium-filled fissures. Two OSL samplescollected at the surface 11 m apart along the map-view traceof the alluvium-filled fissure at site DL-6 had OSL ages of15:5! 1:7 ka at DL-6-01 (upslope) and 4:9! 0:7 ka atDL-6-02 (downslope) (Fig. 4a; Table 1). Terrace alluviumfrom a fissure branch in the southwest wall of trench 2(DL-6-03) has an OSL age of 11:9! 1:4 ka (Figs. 3c,dand 4a; Table 1). Terrace alluvium filling a fissure at siteDL-9 (Fig. 2) yielded an OSL age of 15:9! 1:7 ka (Figs. 6band 7b; DL-9-01 in Table 1).
Discussion
Quaternary terrace alluvium and Sevier Shale bedrocksaprolite are two very different materials with differentphysical properties. Terrace alluvium is unconsolidated,nearly cohesionless sediment with soil development in theupper portions, whereas Sevier Shale saprolite is cohesivewith bedding planes and Paleozoic joints forming weaksurfaces. Some younger fractures postdating Quaternaryalluvium/colluvium may be shear fractures related to ETSZfaults. In weak, homogenous Quaternary alluvium, deforma-tion is concentrated along discreet faults. In Sevier Shale sap-rolite, deformation is distributed diffusely on bedding planesand joints that are weak surfaces that commonly require alower threshold of stress to activate than is required to formnew fractures. In some areas of the Sevier Shale outcrop atsite DL-6, however, small faults curve away from beddingplanes and pre-existing joints, suggesting that orientations ofpre-existing surfaces are not fully compatible withQuaternary stresses. Additionally, in Quaternary alluvium,thrust motion is toward the northwest, whereas in SevierShale saprolite thrust motion is toward the west-southwest,further indicating that material properties may have had aninfluence on direction of displacement.
Crosscutting Relationships of Fractures, Faults, andSediments
Site DL-6. The large (>20 cm wide) northeast-strikingfissure that is cut by the northeast-striking thrust at siteDL-6 is similar to complex coseismic damage described atsites of strike-slip fault surface ruptures of recent decades(Fu et al., 2004; Li et al., 2010; Liu-Zeng et al., 2010;Lin et al., 2011; Villamor et al., 2012). However, the fissureis also typical of bending moment extension in the crest of asurficial fold (Yu et al., 2010), and because the thrust at DL-6merges down-dip with a bedding plane in shale saprolite bed-rock, we suspect that this thrust is due to flexural beddingplane slip during fault-propagation folding above the tipof a blind fault at depth.
The maximum principal compressive stress (σ1) of theregional stress field in the ETSZ is subhorizontal (SHmax) andoriented N70°E (Zoback and Zoback, 1991; Hurd andZoback, 2012), which is subparallel to the majority of mea-
Table1
Optically
Stim
ulated
Lum
inescence(O
SL)AgesandAssociatedLaboratoryDataforAllu
vium
-FillingFissures
atSitesDL-6
andDL-9
andin
situ
Terrace
Allu
vium
atSite
DL-9
(DL-9-02)
Field
Num
ber*
Laboratory
Num
ber*
Depth
(m)
Equivalent
Dose(G
ray)
†Uranium
(ppm
)‡Thoriu
m(ppm
)‡K
2O
(%)‡
H2O
(%)
Cosmic
dose
(mGray/yr)§
TotalD
oseRate
(mGray/yr)
OSL
Age
(yr)||
DL-6-01
UIC3217
140.08±
4.01
3.4±
0.1
16.2
±0.1
0.61
±0.01
5±
20.12
±0.01
2.59
±0.13
15,450
±1,745
DL-6-02
UIC3215
0.3
17.05±
2.25
4.5±
0.1
16.2
±0.1
0.61
±0.01
5±
20.12
±0.01
3.49
±0.21
4,890±
700
DL-6-03
UIC3222
118.14±
1.95
1.5±
0.1
8.0±
0.1
0.56
±0.01
5±
20.12
±0.01
1.53
±0.08
11,880
±1,420
DL-9-01
UIC3221
139.60±
3.83
2.8±
0.1
12.3
±0.1
0.97
±0.01
5±
20.12
±0.01
2.50
±0.13
15,865
±1,735
DL-9-02
UIC3323
2.5
38.39±
1.36
2.0±
0.1
9.1±
0.1
0.70
±0.01
10±
30.14
±0.01
1.76
±0.09
21,765
±1,445
*Analyseswereperformed
bySteven
L.Fo
rman
atLum
inescenceDatingResearchLaboratory,
University
ofIllinois-Chicago.
† Equivalentdoseanalyzed
underb
lue-lig
htexcitatio
n(470!
20nm
)bysinglealiquotregenerationprotocols(M
urrayandWintle,2003).T
hecoarse-grained
(150–250μm
)quartz
fractio
nwas
analyzed.
‡ U,Th,
andK
2O
contentanalyzed
byinductivelycoupledplasma-massspectro
metry
byActivationLaboratoriesLtd.,Ontario,Canada.
§ Cosmic
dose
rate
component
isfrom
PrescottandHutton(1994).
|| Agesc
alculatedusingtheminim
umagemodelof
Galbraithetal.(1999)b
ecause
ofhigh
overdispersion
values
(>35%),which
weightsforthe
youngestequivalentdose
populatio
n.Allerrors
are1σ
,andages
werecalculated
from
A.D.2000.
10 K. F. Warrell, R. T. Cox, R. D. Hatcher Jr., J. D. Vaughn, and R. Counts
BSSA Early Edition
sured slickenlines in Sevier Shale saprolite at site DL-6 butstrongly oblique to the northwest-trending slickenlines onthe Quaternary thrust at site DL-6. Azimuths of bedrock frac-tures measured in shale and siltstone in the Blue Ridge Foot-hills near Pigeon Forge, Tennessee, and the Valley and Ridgenear Oak ridge, Tennessee, contain populations of fractureswith azimuths centered at N55°E–N75°E, N80°W, andN45°W (Hatcher et al., 2012, their fig. 12). The near-verticalfracture sets striking N55°E–N75°E and N40°W–N50°W inbedrock at DL-6 are likely pre-existing Paleozoic or Meso-zoic fractures based on comparisons with those measured inthe Blue Ridge Foothills and western Valley and Ridge, butthey are suitably oriented for reactivation as strike-slip faultsin the current stress regime. One set of northwest-trendingfractures is continuous on both sides of the thrust fault atDL-6 and appears to slightly disturb the bedrock-alluvium
contact (at E/F11 in Fig. 4a); several splays off this fractureset curve northeast, and some appear to merge with the fault(at K12.5 in Fig. 4a). This fracture set may be either a reac-tivated Paleozoic set or a younger set that formed during re-cent faulting. Farther west (from C11 to E17 in Fig. 4a), aprominent, single northwest-trending fracture truncatesmany smaller fractures, but no displacement is present, sug-gesting that it is an old (Paleozoic?) fracture that forms abarrier to later fracture propagation.
Absence of the sinistral strike-slip fault in the footwallof the thrust fault suggests it may be a tear fault in the thrusthanging wall that was coeval with thrusting. The tear faultinterpretation is consistent with the near-perpendicularnorthwest strike of the strike-slip fault to the northeast strikeof the thrust fault and with its near-parallel strike to slicken-lines plunging S28°E on the thrust near trench 2 (at P6 in
Figure 8. Structures at DL-6 related to earthquake 3 (location shown in Fig. 4). (a) A fault-line scarp produced by erosion during summer2012 high water along the Quaternary thrust, exposed just east of trench 2 (Fig. 3), view to the southwest. Slickenlines oriented down the dipof the fault are present on the scarp face. (Photograph by R. D. H.) (b) The thrust truncates a west-trending branch of the main alluvium-filledfissure. Scale is 10 cm long. (Photograph by K. F. W.) (c) The thrust also truncates the main fissure at its southern extension. Scale is 10 cmlong. (Photograph by K. F. W.) (d) A sinistral strike-slip fault offsets the main fissure ∼10 cm. Scale is 30 cm long. (Photograph by J. D. V.)
Paleoseismic Evidence for Multiple Mw ≥6 Earthquakes in the ETSZ during the Late Quaternary 11
BSSA Early Edition

Fig. 4a). A slight change of the fissure width across the sin-istral fault suggests that it has oblique north-down, left-lateral slip.
Site DL-9. Large (>20 cm wide) alluvium-filled fissures atsite DL-9 are parallel and collinear with the large alluvium-filled fissure at site DL-6 and appear to be a continuouscoeval zone of fissures trending northeast, subparallel toETSZ seismicity. Fissures taper downward at sites DL-6and DL-9 and terminate at ∼4 m depth below the base ofthe terrace deposit. They taper downslope (Figs. 4 and 6,southward at DL-6 and eastward at DL-9) indicating theyformed before the modern topography developed. Fissuringonly disturbs the basal cobble terrace alluvium at site DL-9(Fig. 7c), consistent with initial formation of a zone of fis-
sures before deposition of the overlying cross-bedded sandyterrace alluvium at DL-9 (Fig. 9b).
That the collinear fissures at sites DL-6 and DL-9 seemto comprise a zone that crosses the French Broad River val-ley argues against landsliding into the valley as the origin ofthe fissures. Rather, they may have formed in response tonear-surface extension in the hinge of a neotectonic fault-propagation fold that is parallel or subparallel to an activefault. No fault cuts the Quaternary alluvium or bedrock atthe surface at site DL-9. Thus we interpret that a blind faultunderlies the site, consistent with the Quaternary thrust at siteDL-6 being a secondary near-surface fault that may havepropagated from a bedrock bedding plane during flexural-slip folding above the tip of a propagating blind faultat depth.
(d)Site DL-9 Site DL-6
French Broad River
Soil
Incision by French Broad River post 21.8 ka terrace deposition at site DL-9
4 mLB
(a)
(f)
LB LB
Site DL-9 Site DL-6
~25 katerrace
French Broad River
>112 katerrace
Sevier Shale saprolite
Ultisol Ultisol
∼ 25 kaLiquefaction bodies
(earthquake 1; predates ultisol)
1.3 km
Site DL-9 Site DL-6
French Broad River
UltisolUltisol
Renewedfissure
opening
Renewedfissure
opening
Thrusting at DL-6 and renewed fissure opening(earthquake 3; ∼ 15.7 ka)
(b)Site DL-9 Site DL-6
French Broad River
Initial fissuring (earthquake 2; 23 - 22 ka)
LB
Site DL-9 Site DL-6
French Broad River
UltisolUltisol
Backwasting Backwasting
Backwasting of valley walls and deposition of slope sediment post 21.8 ka
Slopesediment
(e)
(c)Site DL-9 Site DL-6
21.8 katerrace
French Broad River
Deposition of 21.8 ka terrace alluvium at site DL-9
LB
Figure 9. Schematic illustration (not to scale) of the timeline of events at DL-6 and DL-9 near Dandridge, Tennessee. Age constraintswere obtained by OSL dating of alluvium (Table 1) and by degree of soil development. Possible paleoearthquakes are numbered. (a) Hypo-thetical setting of site DL-6 and DL-9 during deposition of basal cobble alluvium at DL-9. The >112 ka OSL age, Ultisol development, andliquefaction bodies (related to earthquake 1) are adopted from Hatcher et al. (2012). (b) Initial development of cobble alluvium-filled fissuresduring earthquake 2 prior to the deposition of overlying point bar and floodplain alluvium at site DL-9. (c) Lateral migration of the Pleis-tocene French Broad River, and deposition of upper alluvium at site DL-9 ∼21:8 ka (OSL sample DL-9-02; Table 1). (d) Incision by theFrench Broad River and abandonment of the terrace at site DL-9 post 21.8 ka. (e) Backwasting of the French Broad River valley walls anddeposition of slope sediment over exposed cobble alluvium-filled fissures. (f) Thrusting and renewed opening of alluvium-filled fissures atsites DL-6 and DL-9 (earthquake 3) ∼15:7 ka (OSL age of fissure fill from samples DL-6-01 and DL-9-01). Additional seismic events maybe associated with events on the timeline, but these events lack sufficient evidence to be classified as paleoearthquakes.
12 K. F. Warrell, R. T. Cox, R. D. Hatcher Jr., J. D. Vaughn, and R. Counts
BSSA Early Edition

N70°E-striking, systematic joints in Quaternary terracealluvium at DL-9 are parallel to Quaternary σ1 and to slick-enlines on shear planes at site DL-6. These joints postdateOSL sample DL-9-02 (21.8 ka) and are overprinted by mod-erate Ultisol development near the surface of the terrace.
Relative Timing and Magnitude of Seismic Events
Hatcher et al. (2012) reported that deformation at DL-6provided evidence of at least two strong earthquakes afterdeposition of the alluvial terrace. The first of these twoevents liquefied the alluvium. Fractures that cross-cut theliquefaction features and the Ultisol soil profile are evidenceof a second earthquake that postdates the Ultisol (severalthousands to a few tens of thousands of years ago).
OSL ages suggest that several earthquakes may have in-itiated and later renewed fissuring at sites DL-6 and DL-9,similar to episodes of fissuring in Canterbury, New Zealand(Quigley et al., 2016). As stated in the Site DL-9 section, weinterpret fissures at these two sites to be parts of a formerlycontinuous zone of fissures that extended across the FrenchBroad Valley and potentially beyond (Fig. 9b). Initial fissur-ing predates deposition of undeformed terrace alluvium atsite DL-9 (OSL sample DL-9-02, 21.8 ka; Table 1). Becausethe basal conglomerate of the DL-9 terrace is deformed bycollapse into fissures, we interpret the timing of initial fissur-ing to be immediately prior to 21.8 ka. Initial fissuring ac-companied fault-propagation folding and the relatedpaleoearthquake. Thrusting at site DL-6 cross-cuts fissures,suggesting a later paleoearthquake.
Stream incision and backwasting of terrace depositsafter 21.8 ka exposed downslope fissure segments to sedi-ment younger than the original terrace cover. OSL samplesDL-6-01, DL-6-02, DL-6-03, and DL-9-01 (Table 1) yieldages of fissure fill that are younger than the preserved terra-ces at sites DL-6 and DL-9. Agreement of OSL ages DL-6-01 (15:5! 1:7 ka) and DL-9-01 (15:9! 1:7 ka) suggeststhat a paleoearthquake accompanying thrusting at siteDL-6 may have renewed opening of fissures at ∼15:7 ka.We interpret N70°E-striking systematic joints in late Pleisto-cene terrace alluvium at site DL-9 as possibly coeval withthrusting and renewed fissure opening ∼15:7 ka.
A timeline of events at DL-6 and DL-9 can be formedfrom the data collected for this study and by Hatcher et al.(2012) (Fig. 9). Formation of liquefaction features in terracealluvium (>112 ka) at site DL-6 predates strong Ultisoldevelopment. We suggest that pedogenic clay enrichment re-duced the liquefaction potential and prevented later liquefac-tion events. This pre-Ultisol event (earthquake 1) predatesthe opening of bedrock fissures (earthquake 2) that werefilled from above by terrace alluvium at site DL-6 and atDL-9 (21–23 ka), which in turn predate the thrust (earth-quake 3) at DL-6. We suggest that fissures formed alongthe hinge of a fault-propagation fold during earthquake 2 asthe thrust fault tip propagated nearer to the land surface, laterrupturing the surface during earthquake 3. Coeval renewal of
fissure opening at both sites DL-6 and DL-9∼15:7 ka suggeststhat this is the timing of the significant paleoearthquake thataccompanied thrusting at site DL-6 (earthquake 3). N70°E-striking systematic joints that are overprinted by the Ultisolat site DL-9 (Fig. 6) occurred at some time in the late Pleis-tocene and may have accompanied development of theN65°E-trending slickenlines on red sandy clay-filled shearplanes in saprolite at site DL-6 (Fig. 4). The difference betweenthe northwest-trending slickenlines on the thrust and the south-west-trending slickenlines on minor shear planes at DL-6 sug-gests that these structures may record separate earthquakes.OSL ages from samples DL-6-02 and DL-6-03 may record re-newed fissure opening related to earthquakes ∼11:9 and∼4:9 ka, but more age data are needed to assess the signifi-cance of these dates with respect to paleoearthquakes. It shouldbe noted that crosscutting relationships only provide relativeages for these features, and the time between some eventscould range from centuries to days or hours, similar to strongaftershocks that followed the 1811–1812 earthquakes in theNew Madrid seismic zone and the 2010–2011 Canterburyearthquake sequence in New Zealand (e.g., Guccione, 2005;Quigley et al., 2013).
The estimated magnitude of the earthquake producingthe DL-6 thrust fault with 1 m of displacement isMw ≥6:5! 0:2, using the 95% confidence interval of theempirical relation between maximum displacement and mag-nitude derived by Wells and Coppersmith (1994). FollowingBiasi and Weldon (2006), this magnitude value is in agree-ment with the moment magnitude value (M0 6.7) for whichthe probability distribution function for earthquake magni-tude is maximized given an observed displacement of 1 m.
Our measured displacement may not be the same as thedisplacement on the seismogenic fault at depth, but theamount of seismic energy needed to produce secondary fault-ing with 1 m of displacement likely requires as much or moredisplacement on the main seismogenic fault. Furthermore,earthquake focal mechanism solutions show that fault move-ment in the ETSZ is mostly strike-slip (Chapman et al.,1997), and northeast-striking faults are favorably orientedfor strike-slip reactivation in the modern stress field (Zoback,1992). Strike-slip fault systems are characterized by complexbranching flower-structure geometries in the near surface(Davison, 1994; Hauksson et al., 2002). If thrusting atDL-6 is related to a strike-slip flower structure, the observed1 m of slip at DL-6 may be only a component of the total slipduring earthquake 3 with additional coeval slip on othersplays of the fault system. Thus, Mw 6.5 is a minimumestimate of magnitude for earthquake 3. Overall, the paleo-seismic data at DL-6 and DL-9 provide evidence for threelarge paleoearthquakes (one or moreMw ≥6) during the lateQuaternary (Fig. 9).
Conclusions
1. Cross-cutting relationships of faults, fissures, liquefactionbodies, and soil horizons mapped at DL-6 and DL-9
Paleoseismic Evidence for Multiple Mw ≥6 Earthquakes in the ETSZ during the Late Quaternary 13
BSSA Early Edition
indicate a history of three large earthquakes, at least one ofwhich exceeded Mw 6, on a northeast-trending fault zonewithin the last 200 ka. All three earthquakes are late Pleis-tocene events, and OSL dating suggests two occurredwithin the last 25 ka. However, these ages may be tooyoung because of cryptic pedogenic mixing and bioturba-tion. Earthquake 1 is recorded by a liquefaction body thatpredates strong soil development in the terrace alluvium. Athrust fault displacing >112 ka terrace alluvium (earth-quake 3) truncates a fissure filled with terrace alluvium,indicating that the fissure formed during a separate, earlierevent (earthquake 2). The fissuring event (earthquake 2)postdates late Pleistocene terrace alluvium.
2. A large proportion of slickenline (57% verge N50°E–N70°E) and fracture (55% trend N50°E–N80°E) azimuthsmeasured within Paleozoic shale saprolite at DL-6 arenearly parallel to the current maximum compressivestress (SHmax # N70°E; Hurd and Zoback, 2012), sug-gesting they may be Quaternary structures.
3. The data presented here support the occurrence of large(Mw ≥6) prehistoric earthquakes in the ETSZ. Thesedata fortify the need for additional studies to readdressseismic-hazard estimates in the ETSZ.
Data and Resources
Earthquake epicenters used in this study were obtainedfrom the U.S. Geological Survey (USGS) at earthquake.usgs.gov (last accessed October 2014). A negative of the aerialphotograph in Figure 2 is available at the National Archivesin 8601 Adelphi Road, College Park, Maryland 20740-6001,and a print may be purchased. The archived 1939 topo-graphic map was obtained from the USGS and is freely avail-able at http://landmarkhunter.com/quad/40725 (last accessedMay 2017).
Acknowledgments
This research was supported by Grant NRC-HQ-11-G-04-0085 fromthe U.S. Nuclear Regulatory Commission (NRC) to the University of Ten-nessee–Knoxville, but the views herein do not necessarily represent those ofthe NRC or the U.S. Government. The principal investigators greatly appre-ciate this support. We thank Rich Briggs, Mark Quigley, and an anonymousreviewer for constructive comments on the article. We thank Steven L. For-man (Baylor University) for the optically stimulated luminescence (OSL)analyses reported in this article. We also thank Tennessee Valley Authorityscientists for their cooperation, especially Tyler Ferguson and Jeff Munsey.Additional thanks to Andrew L. Wunderlich, cartographer, Tectonics andStructural Geology Research, University of Tennessee for graphics assis-tance; Nancy L. Meadows, assistant to Hatcher, for help improving the ar-ticle; Sarah A. Blankenship, University of Tennessee Anthropology, for fieldassistance with gridding and archaeological observations at Douglas Reser-voir field sites; and Ann E. Walker, Mary S. Biswal, and Taylor Armstrongfor field assistance with mapping.
References
Allmendinger, R. W., N. Cardozo, and D. Fisher (2012). Structural GeologyAlgorithms: Vectors and Tensors, Cambridge University Press,Cambridge, United Kingdom, 1–289.
Bastin, S. H., M. C. Quigley, and K. Bassett (2015). Paleoliquefaction inChristchurch, New Zealand, Geol. Soc. Am. Bull. 127, 1348–1365.
Biasi, G. P., and R. J. Weldon (2006). Estimating surface rupture length andmagnitude of paleoearthquakes from point measurements of rupturedisplacement, Bull. Seismol. Soc. Am. 96, 1612–1623.
Bockholt, B. M, C. A. Langston, and M. Withers (2015). Local magnitudeand anomalous amplitude distance decay in the eastern Tennessee seis-mic zone, Seismol. Res. Lett. 86, 1040–1050.
Bollinger, G. A., M. C. Chapman, and M. S. Sibol (1993). A comparison ofearthquake damage areas as a function of magnitude across the UnitedStates, Bull. Seismol. Soc. Am. 83, 1064–1080.
Burton, W. C., R. W. Harrison, D. B. Spears, N. H. Evans, and S. Mahan(2015). Geologic framework and evidence for neotectonism in the epi-central area of the 2011 Mineral, Virginia, earthquake, in The 2011Mineral, Virginia, Earthquake, and Its Significance for Seismic Haz-ards in Eastern North America, J. W. Horton Jr., M. C. Chapman, andR. A. Green (Editors), Geol. Soc. Am. Spec. Papers 509, 345–376.
Carpenter, N. S., E. W. Woolery, and Z. Wang (2014). The Mw 4.2 PerryCounty, Kentucky, earthquake of 10 November 2012: Evidence of theeastern Tennessee seismic zone in southeastern Kentucky, Seismol.Res. Lett. 85, 931–939.
Chapman, M. C., C. A. Powell, G. Vlahovic, and M. S. Sibol (1997). Astatistical analysis of earthquake focal mechanisms and epicenterlocations in the eastern Tennessee seismic zone, Bull. Seismol. Soc.Am. 87, 1522–1536.
Cooley, M. T. (2014). A new set of focal mechanisms and a geodynamicmodel for the eastern Tennessee seismic zone, M.S. Thesis, Universityof Memphis, Tennessee, 50 pp.
Cooley, M. T., C. A. Powell, and E. Choi (2014). A new set of focal mech-anisms and a geodynamic model for the eastern Tennessee seismiczone, American Geophysical Union, Fall Meeting 2014, AbstractNumber T13B–4635.
Davison, I. (1994). Linked fault systems: Extensional, strike-slip and con-tractional, in Continental Deformation, P. L. Hancock (Editor), Perga-mon Press, New York, New York, 121–142.
Dunn, M. M., and M. C. Chapman (2006). Fault orientation in the easternTennessee seismic zone: A study using the double-difference earth-quake location algorithm, Seismol. Res. Lett. 77, 494–504.
Feng, L., R. T. Cox, and R. D. Hatcher (2015). Distribution of Quaternaryfractures and folds in the East Tennessee seismic zone, Geol. Soc. Am.Abstr. Progr. 47, 7.
Fu, B., Y. Awataa, J. Dub, and W. He (2004). Surface deformations asso-ciated with the 2001Mw-7.8 Kunlun earthquake, northern Tibet: Geo-morphic growth features along a major strike-slip fault, Eng. Geol. 75,325–339.
Galbraith, R. F., R. G. Roberts, G. M. Laslett, H. Yoshida, and J. M. Olley(1999). Optical dating of single and multiple grains of quartzfrom Jinmium rock shelter, northern Australia, Archaeometry 41,339–364.
Glasbrenner, J. C., R. D. Hatcher, R. T. Cox, and E. Gamble (2014). Possibleevidence for Quaternary deformation in the east Tennessee seismiczone, Geol. Soc. Am. Abstr. Progr. 46, 593.
Guccione, M. J. (2005). Late Pleistocene and Holocene paleoseismology ofan intraplate seismic zone in a large alluvial valley, the New Madridseismic zone, Central USA, Tectonophysics 408, 237–264.
Hardeman, W. D., R. A. Miller, and G. D. Swingle (1966). Geologic map ofTennessee, East Sheet, Tennessee Division of Geology Geologic Map,Scale 1:250,000.
Hatcher, R. D., Jr., P. J. Lemiszki, and J. B. Whisner (2007). Boundaries andinternal deformation in the curved southern Appalachian foreland fold-thrust belt, in Whence the Mountains? Inquiries into the Evolution ofOrogenic Systems: A Volume in Honor of Raymond A. Price, J. W.Sears, T. Harms, and C. Evenchick (Editors), Geological Society ofAmerica Special Papers 433, 243–276.
Hatcher, R. D., Jr., J. D. Vaughn, and S. F. Obermeier (2012). Large earth-quake paleoseismology in the East Tennessee seismic zone: Resultsof an 18-month pilot study, in Recent Advances in North American
14 K. F. Warrell, R. T. Cox, R. D. Hatcher Jr., J. D. Vaughn, and R. Counts
BSSA Early Edition

Paleoseismology and Neotectonics East of the Rockies, R. T. Cox,O. L. Boyd, and J. Locat (Editors), Geological Society of AmericaSpecial Papers 493, 111–142.
Hauksson, E., L. M. Jones, and K. Hutton (2002). The 1999 Hector Mineearthquake sequence: Complex conjugate strike-slip faulting, Bull.Seismol. Soc. Am. 92, 1154–1170.
Hough, S. E. (2012). Initial assessment of the intensity distribution of the2011 Mw 5.8 Mineral, Virginia, earthquake, Seismol. Res. Lett. 83,649–657.
Hurd, O., and M. D. Zoback (2012) Intraplate earthquake, regional stressand fault mechanics in the central and eastern U.S. and southeasternCanada, Tectonophysics 581, 182–192.
King, E. R., and I. Zietz (1978). New York–Alabama lineament—Geophysical evidence for a major crustal break in basement beneathAppalachian basin, Geology 6, 312–318.
Li, C., W. Zheng, and W. Wang (2010). Trenching exposures of thesurface rupture of 2008 Mw 7.9 Wenchuan earthquake, China:Implications for coseismic deformation and paleoseismology alongthe Central Longmen Shan thrust fault, J. Asian Earth Sci. 40,825–843.
Lin, A., G. Rao, D. Jia, X. Wu, B. Yan, and R. Zhikun (2011). Co-seismicstrike-slip surface rupture and displacement produced by the 2010Mw 6.9 Yushu earthquake, China, and implications for Tibetan tecton-ics, J. Geodyn. 52, 249–259.
Liu-Zeng, J., L. Wen, J. Sun, Z. Zhang, G. Hu, X. Xing, L. Zeng, and Q. Xu(2010). Surficial slip and rupture geometry on the Beichuan fault nearHongkou during the Mw 7.9 Wenchuan earthquake, China, Bull.Seismol. Soc. Am. 100, 2615–2650.
Murray, A. S., and A. G. Wintle (2003). The single aliquot regenerative doseprotocol: Potential for improvements in reliability, Radiat. Meas. 37,377–381.
Petersen, M. D., M. P. Moschetti, P. M. Powers, C. S. Mueller, K. M. Haller,A. D. Frankel, Y. Zeng, S. Rezaeian, S. C. Harmsen, O. S. Boyd, et al.(2014). Documentation for the 2014 update of the United Statesnational seismic hazard maps, U.S. Geol. Surv. Open-File Rept.2014-1091, 243 pp.
Powell, C. A., and M. C. Chapman (2012). The relationship between earth-quake locations and velocity structure in the Eastern Tennessee seismiczone, Seismol. Res. Lett. 83, 454.
Powell, C. A., G. A. Bollinger, M. C. Chapman, M. S. Sibol, A. C. Johnston,and R. L. Wheeler (1994). A seismotectonic model for the 300-kilometer-long Eastern Tennessee seismic zone, Science 264, 686–688.
Powell, C. A., M. M. Withers, R. T. Cox, G. Vlahovic, and P. Arroucau(2014). Crustal velocity structure associated with the eastern Tennes-see seismic zone: VP and VS images based upon local earthquaketomography, J. Geophys. Res. 119, 464–489.
Prescott, J. R., and J. T. Hutton (1994). Cosmic ray contributions to doserates for luminescence and ESR dating: Large depths and long-termtime variations, Radiat. Meas. 23, 497–500.
Quigley, M., S. Bastin, and B. Bradley (2013). Recurrent liquefaction inChristchurch, New Zealand during the Canterbury earthquakesequence, Geology 41, 419–422.
Quigley, M. C., M. W. Hughes, B. A. Bradley, S. van Ballegooy, C. Reid, J.Morgenroth, T. Horton, B. Duffy, and J. R. Pettinga (2016). The 2010–2011 Canterbury earthquake sequence: Environmental effects, seismictriggering thresholds and geologic legacy, Tectonophysics 672/673,228–274.
Steltenpohl, M. G., I. Zietz, J. W. Horton Jr., and D. L. Daniels (2010).New York–Alabama lineament: A buried right-slip fault bordering theAppalachians and mid-continent North America, Geology 38, 571–574.
Villamor, P., N. Litchfield, D. Barrell, R. Van Dissen, S. Hornblow, M.Quigley, S. Levick, W. Ries, B. Duffy, J. Begg, et al. (2012). Map ofthe 2010 Greendale fault surface rupture, Canterbury, New Zealand: Ap-plication to land use planning, New Zeal. J. Geol. Geophys. 55, 223–230.
Vlahovic, G., C. A. Powell, M. C. Chapman, and M. S. Sibol (1998). Jointhypocenter-velocity inversion for the eastern Tennessee seismic zone,J. Geophys. Res. 103, 4879–4896.
Wells, D. L., and K. J. Coppersmith (1994). New empirical relationshipsamong magnitude, rupture length, rupture width, rupture area, andsurface displacement, Bull. Seismol. Soc. Am. 84, 974–1002.
Whisner, S. C., R. D. Hatcher Jr., and J. W. Munsey (2003). Disturbedsediments in the East Tennessee seismic zone: Evidence for large pre-historic earthquakes in east Tennessee? Southeast. Geol. 42, 67–82.
Yu, G., X. Xiwei, Y. Klinger, G. Diao, G. Chen, X. Feng, C. Li, A. Zhu, R.Yuan, T. Guo, et al. (2010). Fault-scarp features and cascading-rupturemodel for the Mw 7.9 Wenchuan earthquake, eastern Tibetan plateau,China, Bull. Seismol. Soc. Am. 100, 2590–2614.
Zoback, M. D., and M. L. Zoback (1991). Tectonic stress field of NorthAmerica and relative plate motions, in Neotectonics of North America,Geology of North America Decade Map, D. B. Slemmons, E. R. Eng-dahl, M. D. Zoback, and D. D. Blackwell (Editors), Vol. 1, GeologicalSociety of America, Boulder, Colorado, 339–366.
Zoback, M. L. (1992). Stress field constraints on intraplate seismicity ineastern North America, J. Geophys. Res. 97, no. B8, 11,761–11,782.
Department of Earth and Planetary SciencesUniversity of Tennessee306 Earth and Planetary Sciences BuildingKnoxville, Tennessee 37996
(K.F.W., R.D.H.)
Department of GeosciencesUniversity of Memphis1 Johnson HallMemphis, Tennessee [email protected]
(R.T.C.)
Keen Geoserve, LLC, retired325 East Vine StreetDexter, Missouri 63841
(J.D.V.)
SubstrataGraphics LLC7658 Henry Knox DriveLorton, Virginia 22079
(R.C.)
Manuscript received 25 May 2016;Published Online 27 June 2017
Paleoseismic Evidence for Multiple Mw ≥6 Earthquakes in the ETSZ during the Late Quaternary 15
BSSA Early Edition