bupa insurance limited annual report and accounts for the...
TRANSCRIPT

Bupa Insurance Limited
Annual Report and Accounts for the financial year ended
31 December 2017
Registered Office:
1 Angel Court
London
EC2R 7HJ
Registered number: 3956433

Contents:
Strategic Report ...................................................................................................................................................................................1
Directors’ Report ..................................................................................................................................................................................5
Statement of Directors’ Responsibilities ..............................................................................................................................................7
Independent Auditor’s Report to the Members of Bupa Insurance ....................................................................................................8
Statement of Profit and Loss Account .............................................................................................................................................. 12
Statement of Other Comprehensive Income .................................................................................................................................... 13
Balance Sheet ................................................................................................................................................................................... 14
Statement of Changes in Equity ....................................................................................................................................................... 16
Notes to the Financial Statements .................................................................................................................................................... 17

1 Bupa Insurance Limited Registered number: 3956433
Strategic Report for the financial year ended 31 December 2017
The Directors present their annual report and the financial statements of Bupa Insurance Limited (the “Company”) for the
financial year ended 31 December 2017.
Principal activities
The Company is the UK’s largest health insurer and a leading provider of international health insurance providing medical cover
to 2.7m customers worldwide.
The Company is wholly owned by the Bupa Group (Bupa), an international healthcare group, providing insurance, treatment in
clinics, dental centres and hospitals, and running care homes. Bupa has 16.0m health insurance customers, provides
healthcare to over 14.5m people in its clinics and hospitals, and look after over 25.7k aged care residents, employing 78,000
people principally in Australia, the UK, Spain and Hong Kong. Bupa was established in 1947 as a company without
shareholders which means it can make customers its absolute focus. Bupa reinvests its profits into providing more and better
healthcare that will benefit customers now and in the future.
We are driven by Bupa’s purpose, helping people live longer, healthier, happier lives, It defines everything we do for our
customers, inspiring and motivating us to improve our performance. The Company provides personal, corporate and small to
medium enterprise (SME) health insurance, as well as inward reinsurance and a small number of ancillary insurance products,
such as cash plans, dental and travel insurance.
The two main health insurance segments are domestic private medical insurance (PMI) predominantly in the UK market; and
international private medical insurance (IPMI) provided for individual consumers and employees requiring cover beyond their
usual country of residence.
The principal operations take place in the UK, with branches sited in Denmark, Cyprus, Malta and Switzerland. Operational
services, including the provision of mediation and administrative services are provided by Bupa Insurance Services Limited and
some smaller group companies located in Egypt and Hong Kong.
Key performance indicators
2017 2016
£’m £’m
Net premiums earned 2,275 2,250
Profit before taxation
160.5 133.5
Loss ratio
72% 73%
Combined operating ratio
94% 95%
Insured lives
2.7 2.9
Solvency II (SII) coverage ratio (estimated)1 187% 160%
1The Solvency Capital Position and related disclosures are estimated values
Results
The Company saw a 20% rise in profit before taxation to £160.5m (2016: £133.5m) driven by an increase in revenue largely due to foreign currency movements, lower claims and a reduction in operating expenses, partly offset by lower investment returns, net of interest income due to a favourable settlement of a Danish tax tribunal. The increase in total revenue of 1% reflects the benefit of a favourable US dollar exchange rate against the backdrop of challenging markets. UK PMI consumer sales increased compared to 2016. SME (UK PMI) revenue grew. These were offset by falling UK corporate revenue which was impacted by the trend for corporates to use Health Trusts rather that insured schemes. IPMI revenue grew overall as a result of an increase in corporate which more than offset reductions in consumer and SME. The combined ratio improved to 94% (2016: 95%), driven by favourable performance in UK PMI partially offset by increasing claims in IPMI.
Strategic Report (continued) for the financial year ended 31 December 2017
2 Bupa Insurance Limited Registered number: 3956433
Development
The economic and regulatory environments in our markets are constantly changing. Customer experience is becoming an increasingly important differentiator, with technology playing a crucial role. The UK economy grew 1% in the first nine months of the year, the slowest rate for the January to September period since 2009. The UK Government increased the Insurance Premium Tax to 12% in June, affecting affordability for health insurance customers. Hospital price inflation is also driving up costs for customers. The Company is working to ensure the fees charged by hospitals are fair and reasonable. Our enhanced care pathways and better healthcare cost management have improved the customer experience and claims performance. In November, the Company launched Cancer Direct Access self-referral service (UK PMI), offering customers faster access to diagnosis and treatment without needing to see their GP first. We are the first healthcare organisation in the UK to offer such a comprehensive service. The IPMI market remains competitive, with global insurers traditionally focused on company plans increasingly looking to offer individual products. Throughout 2017, the Company refined its IPMI market strategy and started a programme to strengthen distribution, improve customer engagement and review the products and service offering to our IPMI customers. Progress has been made in the customer service metrics and retention levels. The Company acted quickly to manage an incident in which a portion of IPMI customer data was inappropriately copied and removed. We have brought in additional security checks and are tightening information security and data protection controls across the whole company. Principal risks and uncertainties
Both the business performance and operations are subject to a number of risks and uncertainties. The Directors consider that the key risks and uncertainties relate to external market conditions, insurance risk, regulatory risk and operational risk including information security risk. Performance is monitored by the Board and senior management using operational, financial and other data. The Company Chief Risk Officer provides regular reporting to the Board Risk Committee on the risk profile of the Company and the key mitigation activities in place.
Market and competitor activity
PMI markets are highly competitive with companies seeking to attract customers through new products and benefits. There is also demand for innovation to meet the different needs of corporate customers and individuals. The Company keeps its competitive position in each of its markets under continuous scrutiny and regularly reviews strategic and tactical objectives. There will be operational, commercial and legal impacts for the Company from the UK’s decision to leave the EU. We are putting contingency plans in place to address a range of scenarios, including changes to cross-border financial services regulation.
Insurance risk
The Company seeks to take insurance risk, in the natural course of business, within the Board’s risk appetite.
There is a risk that the frequency, size or timing of claims on insurance policies varies from that expected, leading to an
unexpected impact on financial returns. By virtue of being in the medical insurance business, the Company is exposed to a
number of factors affecting its insurance risk, including macroeconomic trends, medical inflation, shifts in demographics,
changes in population health, developments in healthcare delivery and technology, catastrophes and statistical fluctuation.
Each of these factors could affect product pricing, reserving, claim risk accumulation, as well as the lapse and persistency
behaviour of current and prospective customers.
Insurance risks are managed in a variety of ways. The Company’s size and experience enables it to achieve stability in provider
contracting for UK operations and it benefits from the geographic diversification elsewhere. The company uses its data and
experience to develop actuarial models of products and pricing. In addition, the operations apply controls to underwriting and
claims settlement. A significant mitigating factor is that the vast majority of business written is for short-term risks, which enable
regular opportunities for re-pricing in the event of changes in claims trends. Refer to management of insurance risk in note
23.1.
Government and regulatory policy change
As part of the strategic planning process, analysis is performed of the impact of possible political change on the Company’s business model. The Company seeks to maintain a constructive dialogue with governments in its main areas of operation,

Strategic Report (continued) for the financial year ended 31 December 2017
3 Bupa Insurance Limited Registered number: 3956433
promoting the benefits of high-quality, private healthcare alongside public provision. This risk is also mitigated by the international diversification of its operations.
Operational Risk
A detailed Business Continuity Plan for all businesses with dedicated specialised resource is in place to ensure appropriate operation of key processes and controls. Business continuity issues are reported to the Executive Risk Committee, with significant issues being escalated to the Board Risk Committee, which is responsible for ensuring appropriate controls are in place to mitigate potential risks. Information security risks, including those associated with non-compliance with data protection, privacy and information governance requirements remain key risks for the Company as they are for all insurance companies. There are extensive programmes of work across the Company to ensure that controls are in place and strengthened where necessary to address these risks, including enhancing our event monitoring and incident management. The services provided by the Company are underpinned by information technology systems and infrastructure that enable the delivery of core processes and products. Failure of these systems may reduce the ability of the Company to deliver products and services to its customer base or increase the risk of information security breaches. The Company’s IT services are provided by Bupa Insurance Services Limited, which is responsible for the development, maintenance and monitoring of IT services. A programme of work is in place to ensure the continued development and enhancement of all IT services to provide the levels of services required by the business and adequately protect sensitive customer and business data. A number of change programmes are underway including enhancements to information security and governance and responding to the UK’s decision to leave the EU. This introduces risks in relation to the capacity and capability of staff and senior management to continue to deliver on the strategic objectives and the change programmes. The Company is focused on ensuring it has the right levels and amount of experience and succession plans to manage the business and deliver on change management, supported by a simple more automated operating model and enhanced ways of delivering training. Regulatory Risk
The Company seeks to comply with all regulatory standards and to maintain awareness of, and where possible, anticipate regulatory change. Its principal financial regulators are the UK’s Prudential Regulation Authority (PRA) and the Financial Conduct Authority (FCA), with which the Board and senior managers maintain a close supervisory relationship. The Company seeks to mitigate the risk that it may fail to meet regulatory requirements through the effective operation of the governance framework, and in particular the three lines of defence model which helps to ensure the identification and management of all relevant requirements and associated risks.
Solvency
The Company maintains regulatory capital in line with its capital management objective as set out in note 24.
The Company is subject to the requirements of the SII Directive and must hold sufficient Eligible Own Funds to cover its
Solvency Capital Requirement (SCR). The SII Eligible Own Funds as at 31 December 2017 were £527m (2016: £433m), well in
excess of the SCR.
Solvency II Capital position
2017 2016
£’m1 £'m
Eligible Own Funds 527 433
Solvency Capital Requirement 281 271
Surplus 245 162
Solvency ratio 187% 160% 1The Solvency Capital Position and related disclosures are estimated values
Eligible Own Funds
2017 2016
£’m1 £'m
IFRS Equity attributable to shareholders 246 210
Valuation differences 63 54
Foreseeable dividend - (25)
Subordinated debt 370 384
Capital tiering restriction (152) (190)
Solvency II Eligible Own Funds 527 433 1The Solvency Capital Position and related disclosures are estimated values

Strategic Report (continued) for the financial year ended 31 December 2017
4 Bupa Insurance Limited Registered number: 3956433
Components of Own Funds
2017 2016
£’m1 £'m
Unrestricted Tier 1 309 238
Restricted Tier 1 77 59
Tier 2 141 136
Eligible Own Funds 527 433 1The Solvency Capital Position and related disclosures are estimated values
Solvency II Capital Requirements
The SCR is calculated in accordance with the Standard Formula specified in the SII legislation. The Company has obtained
approval from the Prudential Regulation Authority (PRA) to substitute the insurance premium risk parameter in the formula with
an Undertaking Specific Parameter (USP) which reflects the Company’s own loss experience.
Analysis of the Solvency Capital Requirement
% of diversified SCR1 2017 2016
Premium & Reserve Risk 37% 38%
Operational Risk 21% 22%
Market Risk 16% 17%
Mid-term Lapse Risk 15% 16%
Counterparty Risk 8% 4%
Pandemic Risk 3% 3%
100% 100% 1The Solvency Capital Position and related disclosures are estimated values
Future Outlook
Looking ahead, the Company expects slower growth in the health insurance sector. Economic and political conditions will be testing. Internal controls, particularly information security, will continue to be high on our agenda. We’re confident that focusing on our customers’ needs, delivering high quality services and having great people will help the Company grow in a sustainable way.
Registered office:
1 Angel Court
London
EC2R 7HJ
6 March 2018
F Harris
Director

5 Bupa Insurance Limited Registered number: 3956433
Directors’ Report for the financial year ended 31 December 2017
Results and dividends
The profit for the financial year after taxation amounted to £109.1m (2016: £107.7m). The Directors declared three interim
dividends of £25.0m, £50.0m and £5.9m during the year ended 31 December 2017 (2016: £410.5m).
Impact of Companies (Audit, Investigations and Community Enterprise) Act 2004
As at the date of this report, indemnities are in force under which the Company has agreed to indemnify the Directors, to the
extent permitted by law and the Company's Articles of Association, in respect of all losses arising out of, or in connection with,
the execution of their powers, duties and responsibilities, as Directors of the Company.
Directors
Details of the present Directors and any other persons who served as a Director during the financial year are set out below
R A Phipps (Chairman)
F Harris S Kenton (appointed 5 April 2017)
M C Ledlie
S J O’Connor
A P Perry (appointed 29 March 2017)
M Potkins (resigned 29 March 2017)
D W Smith (appointed 29 August 2017)
C E Thompson
A Morrison (Company Secretary) (appointed 1 January 2017)
Employees
Details of the number of persons employed and gross remuneration are contained in note 4 to the financial statements. Every
effort is made by the Directors and management to inform, consult and encourage the full involvement of staff on matters
concerning them as employees and affecting the Company’s performance.
Employment of disabled persons
The Company is committed to providing equal opportunities to employees. The employment of disabled persons is included in
this commitment and the recruitment, training, career development; and promotion of disabled persons is based on the
aptitudes and abilities of the individual. Should employees become disabled during employment, every effort would be made to
continue their employment and, if necessary, appropriate training would be provided.
Employment policy
The Company continues to regard communication with its employees as a key aspect of its policies. Information is given to
employees about employment matters and about the financial and economic factors affecting performance through
management channels. Employees are encouraged to discuss operational and strategic issues with their line management and
to make suggestions aimed at improving performance.
The Bupa People Manager Expectations clearly sets out management expectations, including the need to listen to employees
needs and issues. Speak up provides the opportunity for all employees to raise their views anonymously. The approach to
managing performance includes setting performance expectations. Schemes exist to incentivise, recognise and reward
performance.

Directors’ Report (continued) for the financial year ended 31 December 2017
6 Bupa Insurance Limited Registered number: 3956433
Disclosure of information to auditors
The Directors who held office at the date of approval of this Directors’ Report confirm that:
So far as that each Director is aware, there is no relevant audit information of which the Company's auditor is
unaware; and
Each Director has taken all the steps that ought to have been taken as a Director in order to be aware of any
information needed by the Company's auditors in connection with preparing their report and to establish that the
Company's auditor is aware of that information.
This confirmation is given and should be interpreted in accordance with the provisions of Section 418 of the Companies Act
2006.
Auditors
Pursuant to Section 487 of the Companies Act 2006, the auditor will be deemed to be reappointed and KPMG LLP will
therefore continue in office.
Registered office:
1 Angel Court
London
EC2R 7HJ
6 March 2018
F Harris
Director

7 Bupa Insurance Limited Registered number: 3956433
Statement of Directors’ Responsibilities for the financial year ended 31 December 2017
The Directors are responsible for preparing the Strategic Report, the Directors' Report and the financial statements in
accordance with applicable law and regulations.
Company law requires the Directors to prepare financial statements for each financial year. Under that law they have elected to
prepare the financial statements in accordance with UK Accounting Standards and applicable law (UK Generally Accepted
Accounting Practice), including FRS 101 Reduced Disclosure Framework.
Under company law the Directors must not approve the financial statements unless they are satisfied that they give a true and
fair view of the state of affairs of the Company and of the profit and loss of the Company for that period. In preparing these
financial statements, the Directors are required to:
select suitable accounting policies and then apply them consistently;
make judgements and estimates that are reasonable and prudent;
state whether applicable UK Accounting Standards have been followed, subject to any material departures disclosed
and explained in the financial statements;
assess the Company’s ability to continue as a going concern, disclosing, as applicable, matters related to going
concern; and
use the going concern basis of accounting unless they either intend to liquidate to Company or to cease operations,
or have no realistic alternative to do so.
The Directors are responsible for keeping adequate accounting records that are sufficient to show and explain the Company's transactions and disclose with reasonable accuracy at any time the financial position of the Company and enable them to ensure that the financial statements comply with the Companies Act 2006. They are responsible for such internal control as they determine is necessary to enable the preparation of financial statements that are free from material misstatement, whether due to fraud or error, and have general responsibility for taking such steps as are reasonably open to them to safeguard the assets of the Company and to prevent and detect fraud and other irregularities.
The Directors are responsible for the maintenance and integrity of the Company’s corporate and financial information included
on the Group’s website. Legislation in the UK governing the preparation and dissemination of financial statements may differ
from legislation in other jurisdictions.
8 Bupa Insurance Limited Registered number: 3956433
Independent Auditor’s Report to the
Members of Bupa Insurance
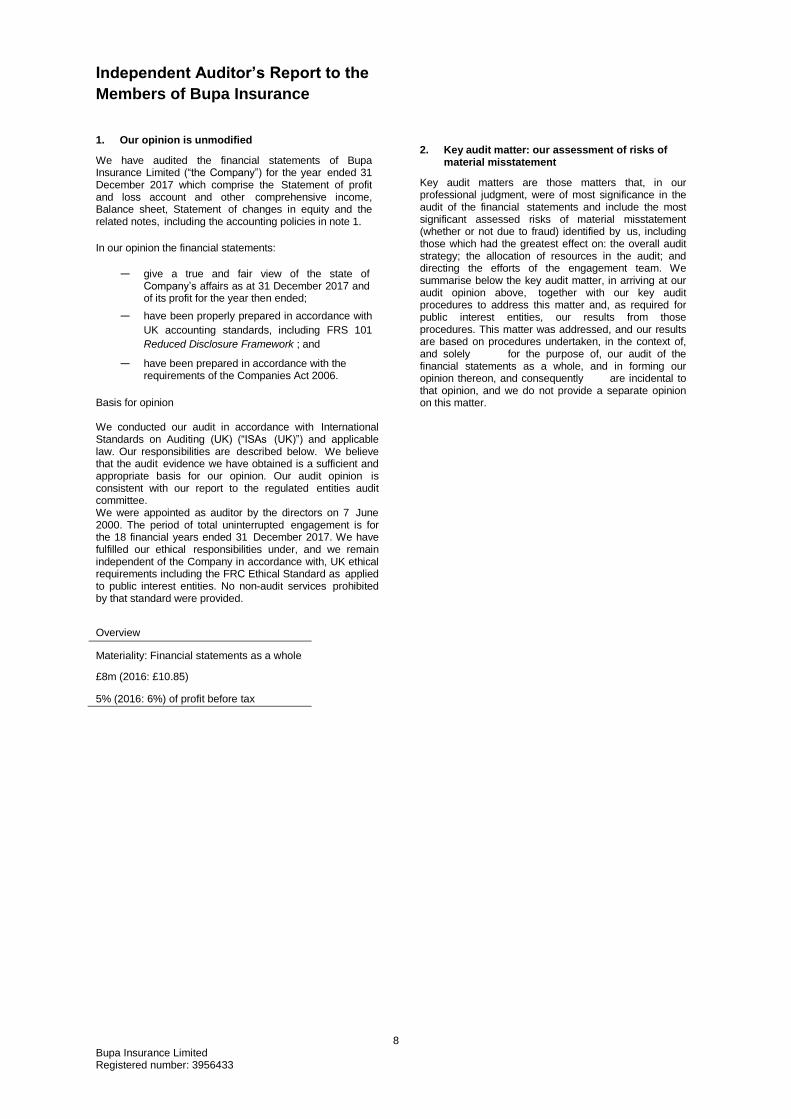
1. Our opinion is unmodified
We have audited the financial statements of Bupa Insurance Limited (“the Company”) for the year ended 31 December 2017 which comprise the Statement of profit and loss account and other comprehensive income, Balance sheet, Statement of changes in equity and the related notes, including the accounting policies in note 1.
In our opinion the financial statements:
— give a true and fair view of the state of Company’s affairs as at 31 December 2017 and of its profit for the year then ended;
— have been properly prepared in accordance with
UK accounting standards, including FRS 101
Reduced Disclosure Framework ; and
— have been prepared in accordance with the requirements of the Companies Act 2006.
Basis for opinion We conducted our audit in accordance with International Standards on Auditing (UK) (“ISAs (UK)”) and applicable law. Our responsibilities are described below. We believe that the audit evidence we have obtained is a sufficient and appropriate basis for our opinion. Our audit opinion is consistent with our report to the regulated entities audit committee. We were appointed as auditor by the directors on 7 June 2000. The period of total uninterrupted engagement is for the 18 financial years ended 31 December 2017. We have fulfilled our ethical responsibilities under, and we remain independent of the Company in accordance with, UK ethical requirements including the FRC Ethical Standard as applied to public interest entities. No non-audit services prohibited by that standard were provided.
Overview
Materiality: Financial statements as a whole
£8m (2016: £10.85)
5% (2016: 6%) of profit before tax
2. Key audit matter: our assessment of risks of material misstatement
Key audit matters are those matters that, in our professional judgment, were of most significance in the audit of the financial statements and include the most significant assessed risks of material misstatement (whether or not due to fraud) identified by us, including those which had the greatest effect on: the overall audit strategy; the allocation of resources in the audit; and directing the efforts of the engagement team. We summarise below the key audit matter, in arriving at our audit opinion above, together with our key audit procedures to address this matter and, as required for public interest entities, our results from those procedures. This matter was addressed, and our results are based on procedures undertaken, in the context of, and solely for the purpose of, our audit of the financial statements as a whole, and in forming our opinion thereon, and consequently are incidental to that opinion, and we do not provide a separate opinion on this matter.

Independent Auditor’s Report to the Members of Bupa Insurance (continued)
9 Bupa Insurance Limited Registered number: 3956433
The Risk Our response
Valuation of insurance contract liabilities
Subjective valuation
Our procedures included:
(£239 million; 2016: £268 million) Refer to page 6 (Regulated Entities Audit Committee Report), page 19 (accounting policy) and page 31 (financial disclosures).
The valuation of insurance contract liabilities requires significant judgement and actuarial expertise. Calculation of the actuarial best estimate and the margin over best estimate uses historical data, which is sensitive to external inputs including claims cost inflation and medical trends, and requires assumptions to be made in respect of current and future experience. Small changes in the assumptions and estimates used to value the insurance contract liabilities can have a significant impact on the overall liability valuation.
Controls design, observation and operation: testing the design, implementation and operating effectiveness of the key controls over the provisioning process, including controls over the completeness and accuracy of the data supporting key calculations, such as the data in respect of current and historical claims; Benchmarking assumptions: considering the Company’s reserving methodology and claims experience against industry practice.
Our actuarial expertise: using our own actuarial specialists, inspecting the claims reserving report and evaluating and challenging the assumptions relating to current and future experience, including cost inflation and medical trends, and margin estimates. This is done by comparing them to expectations based on the Company’s historical experience, current trends and our own industry knowledge;
Sensitivity analysis: considering sensitivity analyses completed by the Company to assess the adequacy of liabilities in the event of severe but possible adverse deviations in key assumptions;
Independent re-performance: calculating our own estimate of the liability for a private medical insurance using the Company’s data, and comparing to the liability calculated by the Company, and considering the impact of any significant differences.
Assessing transparency: assessing the Company’s disclosures relating to the insurance contract liabilities, in particular in relation to key and sensitive assumptions.
Our results: We found the valuation of the insurance contract liabilities to be acceptable.

10 Bupa Insurance Limited Registered number: 3956433
3. Key audit matter: our assessment of risks of material misstatement
Materiality for the financial statements as a whole was set at £8m (2016: £10.85m), determined with reference to a benchmark of profit before tax, of which it represents 5% (2016: 6%).
We agreed to report to the Regulated Entities Audit Committee any corrected or uncorrected identified misstatements exceeding £0.4m (2016: £0.5m), in addition to other identified misstatements that warranted reporting on qualitative grounds.
Our audit of the Company was undertaken to the materiality level specified above and was performed at the Company’s head office in London, Brighton and Manchester.
4. We have nothing to report on the strategic report and the directors’ report We are required to report to you if we have concluded that the use of the going concern basis of accounting is inappropriate or there is an undisclosed material uncertainty that may cast significant doubt over the use of that basis for a period of at least twelve months from the date of approval of the financial statements. We have nothing to report in these respects. 5. We have nothing to report on the strategic report and the directors’ report The directors are responsible for the strategic report and the directors’ report. Our opinion on the financial statements does not cover those reports and we do not express an audit opinion thereon. Our responsibility is to read the strategic report and the directors’ report and, in doing so, consider whether, based on our financial statements audit work, the information therein is materially misstated or inconsistent with the financial statements or our audit knowledge. Based solely on that work:
— we have not identified material misstatements in those reports;
— in our opinion the information given in the strategic report and the directors’ report for the financial year is consistent with the financial statements; and
— in our opinion those reports have been prepared in accordance with the Companies Act 2006.
6. We have nothing to report on the other matters on which we are required to report by exception
Under the Companies Act 2006, we are required to report to you if, in our opinion:
— adequate accounting records have not been kept by the Company, or returns adequate for our audit have not been received from branches not visited by us; or
— the financial statements are not in agreement with the accounting records and returns; or
— certain disclosures of directors’ remuneration specified by law are not made; or
— we have not received all the information and explanations we require for our audit.
— we have nothing to report in these respects.
7. Respective responsibilities
Directors’ responsibilities
As explained more fully in their statement set out on page 7, the Directors are responsible for: the preparation of the financial statements including being satisfied that they give a true and fair view; such internal control as they determine is necessary to enable the preparation of financial statements that are free from material misstatement, whether due to fraud or error; assessing the Company’s ability to continue as a going concern, disclosing, as applicable, matters related to going concern; and using the going concern basis of accounting unless they either intend to liquidate the Company or to cease operations, or

11 Bupa Insurance Limited Registered number: 3956433
have no realistic alternative but to do so.
Auditor’s responsibilities
Our objectives are to obtain reasonable assurance about whether the financial statements as a whole are free from material misstatement, whether due to fraud, other irregularities, or error, and to issue our opinion in an auditor’s report. Reasonable assurance is a high level of assurance, but does not guarantee that an audit conducted in accordance with ISAs (UK) will always detect a material misstatement when it exists. Misstatements can arise from fraud, other irregularities or error and are considered material if, individually or in aggregate, they could reasonably be expected to influence the economic decisions of users taken on the basis of the financial statements. The risk of not detecting a material misstatement resulting from fraud or other irregularities is higher than for one resulting from error, as they may involve collusion, forgery, intentional omissions, misrepresentations, or the override of internal control and may involve any area of law and regulation not just those directly affecting the financial statements.
A fuller description of our responsibilities is provided on the FRC’s website at www.frc.org.uk/auditorsresponsibilities.
Irregularities – ability to detect
Our audit aimed to detect non-compliance with relevant laws and regulations (irregularities) that could have a material effect on the financial statements. We identified relevant areas of laws and regulations from our sector experience, through discussion with the directors (as required by auditing standards), and from inspection of the Company’s regulatory correspondence.
We had regard to laws and regulations in areas that directly affect the financial statements including financial reporting (including related company legislation) and taxation legislation. We considered the extent of compliance with those laws and regulations as part of our procedures on the related financial statements items.
In addition we considered the impact of laws and regulations in the specific areas of regulatory capital recognising the financial and regulated nature of the Company’s activities. With the exception of any known or possible non-compliance, and as required by auditing standards, our work in respect of these was limited to enquiry of the directors and inspection of regulatory and legal correspondence.
We communicated identified laws and regulations throughout our team and remained alert to any indications of non-compliance throughout the audit. As with any audit, there remained a higher risk of non- detection of irregularities, as these may involve collusion, forgery, intentional omissions, misrepresentations, or the override of internal controls.
8. The purpose of our audit work and to whom we owe our responsibilities
This report is made solely to the Company’s members, as a body, in accordance with Chapter 3 of Part 16 of the Companies Act 2006. Our audit work has been undertaken so that we might state to the Company’s members those matters we are required to state to them in an auditor’s report and for no other purpose. To the fullest extent permitted by law, we do not accept or assume responsibility to anyone other than the Company and the Company’s members, as a body, for our audit work, for this report, or for the opinions we have formed.
Ben Priestley (Senior Statutory Auditor)
for and on behalf of KPMG LLP, Statutory Auditor
Chartered Accountants 15 Canada Square London
E14 5GL
6 March 2018

12 Bupa Insurance Limited Registered number: 3956433
Statement of Profit and Loss Account for the financial year ended 31 December 2017
All profits are derived from continuing operations.
2017
2016 (restated
1)
TECHNICAL ACCOUNT Notes £'000 £'000
Revenues
Gross premiums written 2 2,383,852 2,379,001
Outward reinsurance premiums (103,128) (106,588)
Premiums written, net of reinsurance 2 2,280,724 2,272,413
Change in the gross provision for unearned premiums
208 (16,503)
Reinsurers' share of change in the gross provision for unearned premiums (5,516) (5,940)
(5,308) (22,443)
Net premiums earned 2 2,275,416 2,249,970
Other technical income, net of reinsurance 4,615 5,014
Total revenues 2,280,031 2,254,984
Gross claims paid
(1,748,198) (1,727,513)
Reinsurers' share of claims paid 83,641 92,683
Gross claims paid net of reinsurance (1,664,557) (1,634,830)
Gross change in the provision for claims
23,662 (14,334)
Reinsurers' share of change in the provision (4,174) (1,054)
19,488 (15,388)
Net claims incurred 2 (1,645,069) (1,650,218)
Net operating expenses 3 (490,000) (495,192)
Total claims and expenses (2,135,069) (2,145,410)
Profit before financial income and expense 144,962 109,574
NON-TECHNICAL ACCOUNT Investment income 5 34,964 27,390
Unrealised gains on investments
18,134 46,307
Investment expenses 6 (29,699) (49,759)
Unrealised losses on investments
(7,841) (9)
Net financial income 15,558 23,929
Profit before taxation expense 160,520 133,503
Taxation on profit on ordinary activities 8 (51,381) (25,825)
Profit for the financial year 109,139 107,678
1Restated, see note 27 for further details
Notes 1-27 form part of these financial statements.

13 Bupa Insurance Limited Registered number: 3956433
Statement of Other Comprehensive Income
for the financial year ended 31 December 2017
For the year ended
31 December 2017
For the year ended
31 December 2016
Note £'000 £'000
Profit for the financial year 109,139 107,678
Other Comprehensive Income
Items that will not be reclassified to the profit and loss account
Unrealised (loss)/gain on revaluation of property
- (34)
Deferred tax released on sale of property 21 8,136 263
Total items that will not be reclassified to the profit and loss account 8,136 229
Items that may be reclassified subsequently to the profit and loss account
Unrealised gains on available-for-sale assets
224 378
Other Comprehensive Income for the year 8,360 607
Total Comprehensive Income for the year 117,499 108,285
Notes 1-27 form part of these financial statements.

14 Bupa Insurance Limited Registered number: 3956433
Balance Sheet
as at 31 December 2017
2017 2016
(restated1)
ASSETS Notes £'000 £'000
Investments Investment property 9 50,590 19,035
Property, plant and equipment 10 - 1,178
Investment in subsidiary undertakings 12 - 2,904
Financial investments 13 697,719 745,322
748,309 768,439
Reinsurers' share of technical provisions Provision for unearned premiums 19 27,225 34,711
Claims outstanding 19 10,994 15,042
38,219 49,753
Debtors Debtors arising out of direct insurance operations: Policyholders
672,588 674,954
Intermediaries
1,643 1,450
Debtors arising out of reinsurance operations
79,350 48,352
Other debtors 14 203,991 109,882
957,572 834,638
Assets held for sale 11 - 68,500
Cash at bank and in hand 15 263,208 242,556
Prepayments and accrued income Deferred acquisition costs 16 63,499 58,060
Other prepayments and accrued income 5,430 5,865
68,929 63,925
Total assets 2,076,237 2,027,811 1 Restated, see note 27 for further details
Notes 1-27 form part of these financial statements.
Balance sheet (continued) as at 31 December 2017
15 Bupa Insurance Limited Registered number: 3956433
2017 2016
(restated1)
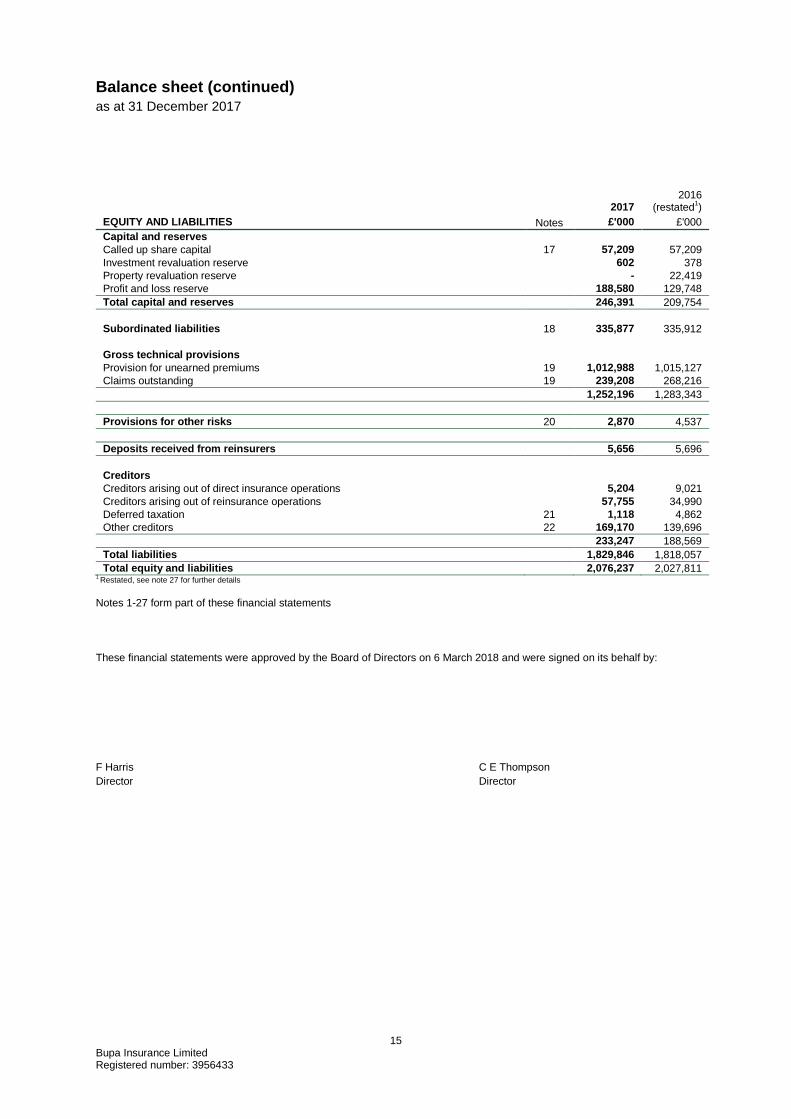
EQUITY AND LIABILITIES Notes £'000 £'000
Capital and reserves Called up share capital 17 57,209 57,209
Investment revaluation reserve
602 378
Property revaluation reserve
- 22,419
Profit and loss reserve 188,580 129,748
Total capital and reserves 246,391 209,754
Subordinated liabilities 18 335,877 335,912
Gross technical provisions Provision for unearned premiums 19 1,012,988 1,015,127
Claims outstanding 19 239,208 268,216
1,252,196 1,283,343
Provisions for other risks 20 2,870 4,537
Deposits received from reinsurers 5,656 5,696
Creditors Creditors arising out of direct insurance operations
5,204 9,021
Creditors arising out of reinsurance operations
57,755 34,990
Deferred taxation 21 1,118 4,862
Other creditors 22 169,170 139,696
233,247 188,569
Total liabilities 1,829,846 1,818,057
Total equity and liabilities 2,076,237 2,027,811 1 Restated, see note 27 for further details
Notes 1-27 form part of these financial statements
These financial statements were approved by the Board of Directors on 6 March 2018 and were signed on its behalf by:
F Harris C E Thompson
Director Director

16 Bupa Insurance Limited Registered number: 3956433
Statement of Changes in Equity
for the financial year ended 31 December 2017
Share capital
account
Share premium account
Investment revaluation
reserve
Property revaluation
reserve
Profit and loss
reserve Total
£'000 £'000 £'000 £'000 £'000 £'000
For the year ended 31 December 2017 At beginning of period 57,209 - 378 22,419 129,748 209,754
Profit for the year - - - - 109,139 109,139
Other Comprehensive Income / (Expense) Realised revaluation profit on disposal of property - - - (30,555) 30,555 -
Unrealised gains on available-for-sale assets - - 224 - - 224
Deferred tax released on sale of property - - - 8,136 - 8,136
Total Comprehensive Income for the period - - 224 (22,419) 139,694 117,499
Transactions with owners recorded directly in equity Dividends paid - - - - (80,862) (80,862)
At end of year 57,209 - 602 - 188,580 246,391
For the year ended 31 December 2016 At beginning of period 357,209 68,561 - 25,691 60,508 511,969
Profit for the year - - - - 107,678 107,678
Other Comprehensive Income / (Expense) Realised revaluation profit on disposal of property - - - (3,501) 3,501 -
Unrealised gains on available-for-sale assets - - 378 - - 378
Unrealised loss on revaluation of property - - - 229 - 229
Total Comprehensive Income for the period - - 378 (3,272) 111,179 108,285 Transactions with owners recorded directly in equity Capital reduction (300,000) (68,561) - - 368,561 -
Dividends paid - - - - (410,500) (410,500)
At end of year 57,209 - 378 22,419 129,748 209,754
Notes 1-27 form part of these financial statements
17 Bupa Insurance Limited Registered number: 3956433
Notes to the Financial Statements
for the financial year ended 31 December 2017
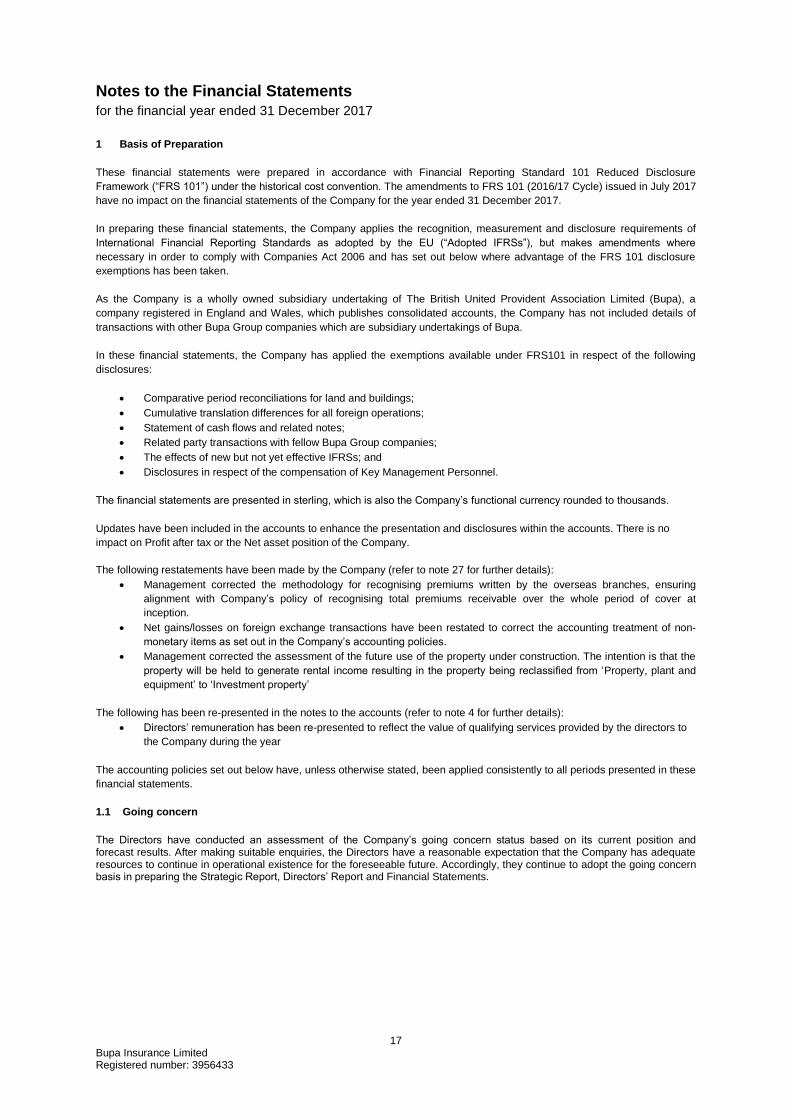
1 Basis of Preparation
These financial statements were prepared in accordance with Financial Reporting Standard 101 Reduced Disclosure
Framework (“FRS 101”) under the historical cost convention. The amendments to FRS 101 (2016/17 Cycle) issued in July 2017
have no impact on the financial statements of the Company for the year ended 31 December 2017.
In preparing these financial statements, the Company applies the recognition, measurement and disclosure requirements of
International Financial Reporting Standards as adopted by the EU (“Adopted IFRSs”), but makes amendments where
necessary in order to comply with Companies Act 2006 and has set out below where advantage of the FRS 101 disclosure
exemptions has been taken.
As the Company is a wholly owned subsidiary undertaking of The British United Provident Association Limited (Bupa), a
company registered in England and Wales, which publishes consolidated accounts, the Company has not included details of
transactions with other Bupa Group companies which are subsidiary undertakings of Bupa.
In these financial statements, the Company has applied the exemptions available under FRS101 in respect of the following
disclosures:
Comparative period reconciliations for land and buildings;
Cumulative translation differences for all foreign operations;
Statement of cash flows and related notes;
Related party transactions with fellow Bupa Group companies;
The effects of new but not yet effective IFRSs; and
Disclosures in respect of the compensation of Key Management Personnel.
The financial statements are presented in sterling, which is also the Company’s functional currency rounded to thousands.
Updates have been included in the accounts to enhance the presentation and disclosures within the accounts. There is no
impact on Profit after tax or the Net asset position of the Company.
The following restatements have been made by the Company (refer to note 27 for further details):
Management corrected the methodology for recognising premiums written by the overseas branches, ensuring
alignment with Company’s policy of recognising total premiums receivable over the whole period of cover at
inception.
Net gains/losses on foreign exchange transactions have been restated to correct the accounting treatment of non-
monetary items as set out in the Company’s accounting policies.
Management corrected the assessment of the future use of the property under construction. The intention is that the
property will be held to generate rental income resulting in the property being reclassified from ‘Property, plant and
equipment’ to ‘Investment property’
The following has been re-presented in the notes to the accounts (refer to note 4 for further details):
Directors’ remuneration has been re-presented to reflect the value of qualifying services provided by the directors to
the Company during the year
The accounting policies set out below have, unless otherwise stated, been applied consistently to all periods presented in these
financial statements.
1.1 Going concern
The Directors have conducted an assessment of the Company’s going concern status based on its current position and forecast results. After making suitable enquiries, the Directors have a reasonable expectation that the Company has adequate resources to continue in operational existence for the foreseeable future. Accordingly, they continue to adopt the going concern basis in preparing the Strategic Report, Directors’ Report and Financial Statements.
Notes to the Financial Statements (continued) for the financial year ended 31 December 2017
18 Bupa Insurance Limited Registered number: 3956433
1.2 Foreign currencies
a) Foreign branches
The activities of the foreign branches are carried out as an extension of the Company. All foreign branches have a sterling
functional currency. Should the functional currency of a branch be assessed as non-sterling, the assets and liabilities are
translated from their functional currency into sterling at the exchange rate at the Balance sheet date. Income and expenses are
translated at average rates for the period, provided that the average rate approximates the rates ruling at the date of the
transactions. Foreign exchange differences arising on translation are recognised in other comprehensive income. On the
disposal of a foreign branch, the foreign exchange amount accumulated in reserves related to that foreign branch is reclassified
to profit and loss as part of the gains or loss on disposal.
b) Foreign transactions
Transactions in foreign currencies other than the functional currency of the Company are translated to the respective functional
currency of the Company or its foreign operations. Realised exchange differences arising on transactions of foreign currency
amounts are recorded in the Profit and Loss Account.
Monetary assets and liabilities denominated in foreign currencies are translated into the functional currency at the exchange
rate ruling at the Balance Sheet date; the resulting foreign exchange gain or loss is recognised in operating expenses, except
where the gain or loss arises on financial assets or liabilities and then it is presented in financial income or expense as
appropriate. Non-monetary assets and liabilities denominated in a foreign currency at historic cost are translated using the
exchange rate at the date of the transaction; no exchange differences therefore arise. Non-monetary assets and liabilities
denominated in a foreign currency at fair value are translated using the exchange rate ruling at the date that the fair value was
determined.
1.3 Investment properties
Investment properties are physical assets that are not occupied by the Company and are leased to Group companies to generate rental income or held by the Company for capital appreciation or both. Investment properties are measured at fair value, determined individually, on a basis appropriate to the purpose for which the property is intended and with regard to recent market transactions for similar properties in the same location. In an active market, the portfolio is valued annually by an independent valuer, holding a recognised and relevant professional qualification, and with recent experience in the location and category of investment property being valued.
Any gain or loss arising from a change in the fair value is recognised in the Income Statement within financial income and expense. Property that is being constructed or developed for future use as Investment property is classified as Investment property. Investment property under construction is initially measured at cost less any impairment loss, and is measured at fair value upon completion. 1.4 Tangible fixed assets and depreciation
Fixtures and equipment are stated at historical cost less accumulated depreciation and recognised impairment losses.
Depreciation on other items of property, plant and equipment is calculated using the straight line method to allocated cost less
residual value over estimated useful lives as follows:
Depreciation is charged to the profit and loss on a straight line basis over its expected useful life, as follows:
Computer Equipment 3 Years
Fixtures & Fittings 3 to 8 Years
Depreciation methods, useful lives and residual values are reviewed at each balance sheet date.
No depreciation is charged on assets in the course of construction. Assets classified as work in progress are reviewed for
impairment at each balance sheet date or when an indication of impairment arises.
Impairment reviews are undertaken where there are indicators that the carrying value may not be recoverable. An impairment
loss on assets carried at cost is recognised in the Profit and Loss account to reduce the carrying value to the recoverable
amount.

Notes to the Financial Statements (continued) for the financial year ended 31 December 2017
19 Bupa Insurance Limited Registered number: 3956433
1.5 Provisions and other risks
A provision is recognised in the Balance Sheet when the Company has a present legal or constructive obligation as a result of
a past event, and it is probable that an outflow of economic benefits will be required to settle the obligation that can be reliably
estimated. If the effect is material, provisions are determined by discounting the expected future cash flows at a pre-taxation
rate that reflects current market assessments of the time value of money and, where appropriate, the risks specific to the
liability. Although provisions are made where payments can be reliably estimated, the amounts provided are based upon a
number of assumptions that are inherently uncertain and therefore the amount that is ultimately paid could differ from the
amount recorded.
1.6 Basis of accounting for underwriting activities
Underwriting activities are accounted for on an annual “accident year” basis.
a) Other technical income
Revenue from contracts entered into by the Company that do not result in the transfer of significant insurance risk to the
Company is recognised as the services are provided and is presented as other technical income. These contracts mainly relate
to the administration of claims funds on behalf of corporate customers.
b) Net premiums earned
Net premiums earned represent the premiums earned relating to risk exposure for the reported financial year. They comprise
gross premiums written, net of reinsurance, adjusted for the change in the gross provision for unearned premiums during the
financial year.
The unearned premium provision represents the proportion of premiums written in the financial year that relate to periods of risk
in future accounting years.
Premiums are shown gross of commissions payable and net of insurance premium taxes that may apply in certain jurisdictions.
c) Outward reinsurance premiums
Outward reinsurance premiums represent the reinsurance premiums payable for contracts entered into that relate to risk
mitigation for the reported financial year. These comprise written premiums ceded to reinsurers, adjusted for the reinsurers’
share of the movement in the gross provision for unearned premiums.
In cases where the Company cedes reinsurance for the purpose of limiting its net loss potential, the arrangements do not
relieve the Company of its direct obligations under insurance policies written.
Premiums, losses and other amounts relating to reinsurance treaties are recognised over the period from inception of a treaty
to expiration of the related business. The actual profit and loss is therefore recognised not at inception but as such profit and
loss emerges. Any initial reinsurance commission is recognised on the same basis as the acquisition costs incurred.
d) Net claims incurred
The gross technical provision for claims represents the estimated liability arising from claims episodes in current and preceding
financial years which have not yet given rise to claims paid. The provision includes an allowance for claims management and
handling expenses.
The gross technical provision for claims is estimated based on current information and the ultimate liability may vary as a result
of subsequent information and events. Adjustments to the amount of claims provision for prior years are included in the
technical account in the financial year in which the change is made.
Provision is made for unexpired risks where the claims and administrative expenses likely to arise after the end of the financial
year, in respect of contracts commencing before that date, are expected to exceed the related unearned premiums, less related
deferred acquisition costs. The methods used and estimates made for claims provisions are reviewed regularly.
e) Reinsurers’ share of claims
Reinsurers’ share of claims incurred represents recoveries from reinsurers on claims paid, adjusted for the reinsurers’ share of
the change in the gross technical provision for claims. The recoverable balances due from reinsurers are assessed for
impairment at each balance sheet date. Impairments are accounted for within the technical account on an incurred loss basis.

Notes to the Financial Statements (continued) for the financial year ended 31 December 2017
20 Bupa Insurance Limited Registered number: 3956433
f) Acquisition costs
Acquisition costs included within net operating expenses, represent commissions payable and other direct expenses related to
the acquisition of insurance contract revenues written during the financial year. Acquisition costs that have been paid that relate
to subsequent periods are deferred and recognised in the technical account across the period in which the benefit has been
recognised, on a straight line basis.
1.7 Taxation and deferred taxation
The taxation expense on the profit for the year comprises current and deferred taxation.
Current taxation comprises the expected tax payable or receivable on the taxable profit and loss for the period using taxation
rates enacted or substantively enacted at the balance sheet date, and any adjustments to the tax payable or receivable in
respect of previous years.
Deferred taxation is provided in full on all timing differences that have originated, but not reversed, at the balance sheet date
which result in an obligation to pay more, or a right to pay less or to receive more taxation benefits, with the following
exceptions:
Provision is made for taxation on gains arising from the revaluation of property to its market value, the fair value
adjustment of fixed assets, or gains on disposal of fixed assets that have been rolled over into replacement assets,
only to the extent that, at the Balance Sheet date there is a binding agreement to dispose of the assets concerned
and without it being possible to claim rollover relief. However, no provision is made where, on the basis of all
available evidence at the Balance Sheet date, it is more likely than not that the taxable gain will be rolled over into
replacement assets and charged to tax only where the replacement assets are sold.
Provision is made for deferred taxation that would arise on remittance of the retained earnings of overseas
subsidiaries only to the extent that, at the Balance Sheet date, dividends have been accrued as receivable.
Deferred taxation assets are recognised only to the extent that it is considered more likely than not that there will be suitable
taxable profits from which the underlying timing differences can be deducted.
1.8 Related party transactions
As the Company is a wholly owned subsidiary undertaking of The British United Provident Association Limited (Bupa), a
company registered in England and Wales, which publishes consolidated accounts, the Company has not included details of
transactions with other Bupa Group companies which are subsidiary undertakings of Bupa.
FRS 101 also exempts entities from disclosure of compensation for key management personnel as required by IAS 24. There
were no other related party transactions.
Where the Company enters into financial guarantee contracts to guarantee the indebtedness of other companies within the
Group, the Company designates these as insurance arrangements, and accounts for them as such. In this respect, provision
for expected claims is made on an incurred basis.
1.9 Investment income and expenses
Investment income comprises interest receivable, realised gains on investments, changes in the fair value of items recognised
at fair value through profit and loss, changes in the fair value of derivatives and foreign exchange gains and losses. Interest
income except in relation to assets classified as fair value through profit and loss, is recognised in the non-technical account as
it accrues, using the effective interest method.
Investment expenses include interest payable on borrowings, realised losses on investments, changes in the fair value of items
recognised at fair value through profit and loss, changes in the fair value of derivatives and other investment expenses.
A gain or loss on a financial investment is only realised on disposal or transfer, and is the difference between the proceeds
received, net of transaction costs, and its original cost or amortised cost, as appropriate.
Changes in the value of financial assets designated as at fair value through profit and loss are recognised within investment
income or expense as an unrealised gain or loss while the asset is held, this represents the difference between the carrying
value at the year end and the carrying value at the previous year end or purchase value during the year, less the reversal of
previously recognised unrealised gains and losses in respect of disposals made during the year.

Notes to the Financial Statements (continued) for the financial year ended 31 December 2017
21 Bupa Insurance Limited Registered number: 3956433
1.10 Financial Investments
The Company has classified its financial investments into the following categories: available-for-sale, at fair value through profit
and loss, held to maturity and loans and receivables. The Directors determine the classification of all financial investments at
initial recognition. Financial investments are derecognised when the rights to receive cash flows from the financial investments
have expired or where the Company has transferred substantially all risks and rewards of ownership.
a) Available-for-sale
Available-for-sale assets are non-derivative financial assets designated on initial recognition as available for sale or any other
instruments that are not classified in the below categories. Available-for-sale assets are measured at fair value in the balance
sheet. Fair value changes on available-for-sale assets are recognised directly in equity, through other comprehensive income,
except for interest and foreign exchange gains or losses which are recognised through profit and loss. The cumulative gain or
loss that was recognised in equity is recognised in the profit and loss when an available-for-sale financial asset is
derecognised.
b) Financial investment at fair value through profit and loss
Financial investments designated at fair value through profit and loss consist of investments or instruments where management
makes decisions based upon their fair value.
The investments are carried at fair value, with gains and losses arising from changes in this value recognised in the Profit and
Loss Account in the period in which they arise. The fair values of quoted investments in active markets are based on current bid
prices.
c) Loans and receivables
Loans and receivables are non-derivative financial investments with fixed or determinable payments that are not quoted in an
active market and are carried at amortised cost calculated using the effective interest method, less impairment losses.
d) Held to maturity investments
Held to maturity investments are non-derivative financial assets which are quoted on an active market, with fixed or
determinable payments and fixed maturity that an entity has the positive intention and ability to hold to maturity. This is
assessed at each reporting date. Held to maturity investments are measured at amortised cost using the effective interest
method, less any impairment losses.
Any discount or premium on purchase is amortised at the effective interest rate over the life of the investment through the Profit
and Loss Account.
1.11 Derivative financial instruments
Derivative financial instruments consist of currency forward contracts and swaps. Derivatives are recognised initially at fair
value; attributable transaction costs are recognised in the profit and loss account when incurred. Subsequent to initial
recognition, derivatives are measured at fair value, and changes therein are recognised immediately in the profit and loss
account.
The fair value of a financial instrument is defined as the amount at which a financial instrument could be exchanged in an arm’s
length transaction between informed and willing parties.
1.12 Investment in subsidiaries
Investments in subsidiary undertakings, are valued at fair value. Cost is used where this is a reasonable approximation of the
fair value.
1.13 Debtors
Debtors, including insurance debtors are carried at amortised cost less impairment losses.

Notes to the Financial Statements (continued) for the financial year ended 31 December 2017
22 Bupa Insurance Limited Registered number: 3956433
1.14 Impairment of financial assets
Financial assets comprise financial investments and trade and other debtors. If they are not already held at fair value, financial
assets are assessed at each reporting date (or when there is an indication of impairment) to determine whether there is any
objective evidence that they are impaired. A financial asset is considered impaired if objective evidence indicates that one or
more events that have occurred since the initial recognition of the asset have had a negative impact on the estimated future
cash flows of that asset.
An impairment loss in respect of a financial investment measured at amortised cost is calculated as the difference between its
carrying amount and the present value of the estimated future cash flows discounted at the effective interest rate at the date the
investment was made.
Significant financial assets are tested for impairment on an individual basis. All impairment losses are recognised in the profit
and loss account.
1.15 Subordinated liabilities
Subordinated liabilities are stated at amortised cost using the effective interest method. The coupon payable on the loan is
recognised as an investment expense within net financial expense.
1.16 Creditors
Creditors are carried at amortised cost.
1.17 Assets held for sale
Non-current assets are classified as held for sale where their carrying amount will be recovered principally through a sale
transaction rather than continuing use, where a sale is highly probable within one year and where the asset is available for
immediate sale in its present condition.
Non-current assets held for sale are recognised at the lower of carrying amount and fair value less costs to sell.
Accounting estimates and judgements
The preparation of financial statements in conformity with FRS 101 requires the use of certain accounting estimates and
assumptions that affect the reported assets, liabilities, income and expenses. It also requires the Directors to exercise
judgement in applying the Company’s accounting policies. The estimates and assumptions are based on historical experience
and other related variables, updated to reflect current trading performance. The estimates and assumptions are reviewed on an
ongoing basis and are considered to be appropriate but actual results may differ from these estimates.
Judgements made by management in applying the Company’s accounting policies that have a significant effect on the financial
statements, and estimates with a significant risk of material adjustment in subsequent periods, are set out below and in more
detail in the related notes.
Insurance accounting (note 19)
Financial investments (notes 13)
2 Analysis of underwriting results
(i) Analysis by class
Premiums written Premiums earned Claims incurred
£’000 £’000 £’000
2017 Direct insurance: accident and health
2,106,680 2,107,871 (1,519,330)
Inward reinsurance
277,172 276,189 (205,206)
Outward reinsurance
(103,128) (108,644) 79,467
2,280,724 2,275,416 (1,645,069)
2016 (restated1)
Direct insurance: accident and health
2,106,783 2,094,379 (1,565,800)
Inward reinsurance
272,218 268,119 (176,047)
Outward reinsurance
(106,588) (112,528) 91,629
2,272,413 2,249,970 (1,650,218)

Notes to the Financial Statements (continued) for the financial year ended 31 December 2017
23 Bupa Insurance Limited Registered number: 3956433
(ii) Analysis by type
Gross premiums written
2017 2016 (restated1)
£'000 £'000
Group
1,282,513 1,272,727
Individual 1,101,339 1,106,274
2,383,852 2,379,001
(iii) Segmental analysis of gross premiums written
Gross premiums
written
£'000
2017 UK PMI
1,546,072
IPMI
837,780
2,383,852
2016 (restated1)
UK PMI
1,583,850
IPMI
795,151
2,379,001
Geographic
Gross premiums
written
£'000
2017 United Kingdom
2,258,254
EU member states
42,875
Rest of the world
82,723
2,383,852
2016 (restated1)
United Kingdom
2,251,875
EU member states
40,626
Rest of the world 86,500
2,379,001
Geographical analysis is based on where the business is written.
1 Refer note 27 for additional details.

Notes to the Financial Statements (continued) for the financial year ended 31 December 2017
24 Bupa Insurance Limited Registered number: 3956433
3 Net Operating Expenses
2017
2016 (restated)
1
£'000 £'000
Commission and other acquisition costs
144,785 144,535
Changes in deferred acquisition costs
(5,439) (2,765)
Staff costs (see note 4)
3,286 3,131
Net gain on foreign exchange transactions
(5,191) (2,749)
Expenses payable to Bupa Group companies
347,297 348,684
Reinsurers share of expenses
(10,671) (10,830)
Other operating expenses
15,933 15,186
490,000 495,192 1 Refer note 27 for additional details.
4 Staff costs and Directors’ remuneration
All of the Company’s employees work in our Copenhagen office. All other staff are remunerated and employed through the
Company’s service company, Bupa Insurance Services Limited and recharged to Bupa Insurance Limited.
(i) Staff costs
The average number of employees was as follows: 2017 2016
Employees 48 47
2017 2016
Administration 44 44
Sales 4 3
48 47
2017 2016
£'000 £'000
Wages and salaries
2,592 2,528
Social security costs
395 360
Pension costs 299 243
3,286 3,131

Notes to the Financial Statements (continued) for the financial year ended 31 December 2017
25 Bupa Insurance Limited Registered number: 3956433
(ii) Directors’ remuneration
2017 2016
£'000 £'000
Emoluments
1,126 1,001
Company contributions to defined contribution pension schemes
11 9
Amounts receivable under long-term incentive schemes 82 291
1,219 1,301
The emoluments of the directors are borne entirely by other Group companies. The table above reflects the value of the
qualifying services provided by the directors to the Company during the year.
There is One director who is a member of a Bupa defined benefit pension scheme (2016: One).
The remuneration of the highest paid Director was:
2017 2016
£'000 £'000
Emoluments
300 293
Company contributions to defined contribution pension schemes
6 -
Amounts receivable under long-term incentive schemes 22 177
328 470
5 Investment income
2017 2016
£'000 £'000
Income from Bupa Group undertakings:
Interest receivable
113 1,699
Rental income
5,119 5,772
Income from deposits with credit institutions
4,332 6,863
Realised capital gains on investments1
6,937 5,355
Interest receivable on overseas tax refunds
14,339 -
Realised foreign exchange gains 4,124 7,701
34,964 27,390 1 Includes profit on sale of subsidiary, see note 12 for further details 6 Investment expenses
2017 2016
£'000 £'000
Interest payable to Bupa Group undertakings
20,624 20,641
Realised foreign exchange losses
4,480 25,074
Realised losses on other investments
894 387
Investment management expenses payable to Bupa Group undertakings
1,011 1,128
Other interest payable 2,690 2,529
29,699 49,759

Notes to the Financial Statements (continued) for the financial year ended 31 December 2017
26 Bupa Insurance Limited Registered number: 3956433
7 Expenses and auditor’s remuneration
2017 2016
£'000 £'000
Fees payable to the Company's auditors for the audit services 759 646
Non-audit assurance services 95 400
854 1,046
Fees for the audit of the Company represent the amount payable to the Company's auditors.
8 Taxation on profit on ordinary activities
(i) Analysis of taxation charge in the financial year
2017 2016
£'000 £'000
Current tax UK corporation taxation on profit for the financial year
29,824 27,040
Double taxation relief
(3,705) (2,877)
Foreign taxation on income for the financial year
3,705 2,877
Adjustments in respect of prior periods
17,165 (54)
Total current taxation 46,989 26,986
Deferred tax Origination and reversal of temporary differences
4,392 (706)
Changes in taxation rate
- 85
Adjustments in respect of prior periods - (540)
Total deferred taxation 4,392 (1,161)
Total taxation on profit on ordinary activities 51,381 25,825
The total taxation expense recognised in the profit and loss account of £51,381k (2016: £25,825k) represents a headline
effective tax rate of 32.0% (2016: 19.3%) against a statutory UK prevailing tax rate of 19.25% (2016: 20.00%).

Notes to the Financial Statements (continued) for the financial year ended 31 December 2017
27 Bupa Insurance Limited Registered number: 3956433
(ii) Reconciliation of effective tax rate
The differences between the total current taxation charge shown above and the amount calculated by applying the standard
rate of UK corporation taxation to the profit before taxation is as follows:
2017 2016
£'000 £'000
Profit on ordinary activities before taxation
160,520 133,503
Taxation on profit on ordinary activities at standard UK corporation taxation rate of 19.25% (2016: 20.00%)
30,895 26,700
Effects of: Non-taxable income
(1,245) (412)
Expenses not deductible for taxation purposes
406
Transfer pricing adjustment
(90) (79)
Deferred taxation adjustments in respect of prior periods
- (540)
Unwind of deferred tax on the disposal of a property
4,813 -
Changes in taxation rate
(562) 210
Adjustments in respect of Group Relief not paid for in previous years
42,040 -
Adjustments in respect of current income tax of previous years
2,825 (54)
Overseas tax refunds
(27,701)
Total current taxation charge for the year 51,381 25,825
As at 31 December 2017, the company had deductible temporary differences relating to unrelieved foreign tax of £2,312k
(2016: £2,575k) for which no deferred taxation asset was recognised due to uncertainty of utilisation of those temporary
differences.
9 Investment properties
2017
2016 (restated
1)
£'000 £'000
At 1 January
19,035 500
Additions
31,555 18,535
At 31 December 50,590 19,035 1 Refer note 27 for additional details.
10 Property, plant and equipment
Equipment Total
2017 £'000 £'000
Cost or valuation
At beginning of period 3,059 3,059
Disposal
(3,059) (3,059)
At end of year - -
Depreciation
At beginning of period 1,881 1,881
Charge for the year
(318) (318)
Disposal
(1,563) (1,563)
At end of year - -
Net book value at end of year - -
Net book value at beginning of year (restated1) 1,178 1,178
1 Refer note 27 for additional details.

Notes to the Financial Statements (continued) for the financial year ended 31 December 2017
28 Bupa Insurance Limited Registered number: 3956433
11 Assets held for sale
2017 2016
£'000 £'000
Transfer from property, plant and equipment
- 69,000
Costs to sell - (500)
- 68,500
On 22 December 2017, assets previously classified as held for sale were sold. Due to additional costs to sell, profit on disposal
was nil.
12 Investment in subsidiary undertakings
Cash proceeds of £8.8m were received on the sale of Bupa Insurance (Bolivia) SA, which completed on 15 December 2017,
with a net gain on disposal of £5.9m, recognised in investment income (note 5).
The investment in subsidiary undertaking related solely to Bupa Insurance (Bolivia) S.A, an insurance company incorporated in
Bolivia, in which the Company held a 100% investment in ordinary shares, registered office Santa Cruz - AV. San Martin No
1800, Equipetrol, Bolivia.
13 Financial investments
Carrying
value Fair value Carrying value Fair value
2017 2017 2016 2016
£'000 £'000 £'000 £'000
Non-current
Available-for-sale Corporate debt securities
171,024 171,024 133,006 133,006
Designated at fair value through the profit and loss Corporate debt securities and secured loans
183,709 183,709 172,190 172,190
Government debt securities
28,651 28,651 23,618 23,618
Pooled investment funds
85,081 85,081 81,269 81,269
Held to maturity Corporate debt securities
12,919 12,993 12,916 13,043
Loans and receivables Deposits with credit institutions
65,423 66,269 100,511 102,584
Total non-current 546,807 547,727 523,510 525,710
Current Available-for-sale Corporate debt securities
27,575 27,575 - -
Designated at fair value through the profit and loss Pooled investment funds
40,020 40,020 39,841 39,841
Held to maturity Corporate debt securities
- - 60,302 60,388
Loans and receivables Deposits with credit institutions
83,317 83,430 121,669 122,178
Total current 150,912 151,025 221,812 222,407
Total 697,719 698,752 745,322 748,117
Financial investments are held at fair value aside from corporate debt securities held to maturity and loans and receivables
which are held at amortised cost. The fair value of these are shown in the table above.
Available-for-sale assets are held at fair value, changes in the fair value are recognised directly in equity.

Notes to the Financial Statements (continued) for the financial year ended 31 December 2017
29 Bupa Insurance Limited Registered number: 3956433
Fair value of Financial Investments
The fair value of a financial instrument is defined as the amount at which a financial instrument could be exchanged in an arm’s
length transaction between informed and willing parties. The fair value of the Company’s financial instruments are calculated
based on quoted prices at the balance sheet date, or discounted expected future principal and interest cash flows.
Financial instruments carried at fair value are measured using different valuation methods categorised into a 3 level hierarchy.
The different levels have been defined by reference to the lowest level input that is significant to the fair value measurement, as
follows:
Level 1: quoted prices (unadjusted) in active markets for identical assets or liabilities;
Level 2: inputs other than quoted prices included within level 1 that are observable for the asset or liability, either
directly (i.e. as prices) or indirectly (i.e. derived from prices); and
Level 3: inputs for the asset or liability that are not based on observable market data (unobservable inputs)
An analysis is as follows:
Level 1 Level 2 Total
At 31 December 2017 £'000 £'000 £'000
Available-for-sale
Corporate debt securities 198,599 - 198,599
Designated at fair value through the profit and loss
Corporate debt securities and secured loans - 183,709 183,709
Government debt securities - 28,651 28,651
Pooled investment funds 125,101 - 125,101
Held to maturity
Corporate debt securities 12,993 - 12,993
Loans and receivables
Deposits with credit institutions - 149,699 149,699
336,693 362,059 698,752
At 31 December 2016 Available-for-sale
Corporate debt securities 133,006 - 133,006
Designated at fair value through the profit and loss
Corporate debt securities and secured loans - 172,190 172,190
Government debt securities - 23,618 23,618
Pooled investment funds 121,110 - 121,110
Held to maturity
Corporate debt securities 73,431 - 73,431
Loans and receivables
Deposits with credit institutions - 224,762 224,762
327,547 420,570 748,117

Notes to the Financial Statements (continued) for the financial year ended 31 December 2017
30 Bupa Insurance Limited Registered number: 3956433
14 Other debtors
2017 2016
£'000 £'000
Amounts owed by Bupa Group undertakings
120,139 59,011
Corporation tax receivable
58,908 38,232
Derivative assets
3,111 3,508
Trade debtors
57 57
Other debtors
21,776 9,074
Total 203,991 109,882
The carrying value of debtors is a reasonable approximation of the fair value.
All derivatives are disclosed as level two in the three level hierarchy. The Company holds foreign currency forward contracts to
mitigate the Company’s currency exposure. Please refer to note 23.2 Foreign exchange risk for more details
15 Cash at bank and in hand
2017 2016
£'000 £'000
Cash at bank and in hand
262,155 242,112
Restricted access deposits 1,053 444
263,208 242,556
The restricted access deposits of £1,053k (2016: £444k) relate to claims funds held on behalf of corporate customers. These
amounts may be used only to discharge those obligations and potential liabilities if and when they crystallise.
Cash at bank and in hand includes £187,486k (2016: £125,337k) of cash equivalents.
16 Deferred acquisition costs
The movement in deferred acquisition costs is as follows:
2017 2016
£'000 £'000
At the beginning of the year
58,060 54,975
Acquisition costs deferred
86,523 84,703
Acquisition costs released to Income Statement
(81,084) (81,618)
At end of year 63,499 58,060
17 Called up share capital
2017 2016
£'000 £'000
Allotted, called up and fully paid 57,208,702 ordinary shares of £1 each (2016: 57,208,702 ordinary shares of £1
each) 57,209 57,209

Notes to the Financial Statements (continued) for the financial year ended 31 December 2017
31 Bupa Insurance Limited Registered number: 3956433
18 Subordinated debt
2017 2016
£'000 £'000
Subordinated loan 335,877 335,912
The Company has a £330.0m subordinated loan from Bupa Finance plc (the Lender). The loan has no fixed repayment date
but is callable on 16 September 2020. Interest is payable at the following rates:
At 6.250% p.a. to the first call date of 16 September 2020.
Subsequently at a rate per annum which is determined by the Lender to be the aggregate of 2.725% and the gross
redemption yield of the benchmark gilt in respect of that reset interest calculation period.
In the event of the winding up of the Company, the claims of the Lender are subordinated in right of payment to the claims of
the other creditors of the Company.
The fair value of the subordinated loan is £361,818k (2016: £350,769k).
19 Gross Technical provisions
2017
Gross Reinsurance Net
£’000 £’000 £’000
Analysis of movement in provision for unearned premiums
At beginning of year
1,015,127 (34,711) 980,416
Written premiums in respect of future periods
2,383,852 (103,128) 2,280,724
Earned in the year
(2,385,991) 110,614 (2,275,377)
At end of year 1,012,988 (27,225) 985,763
Analysis of movement in provision for claims
At beginning of year
268,216 (15,042) 253,174
Cash paid to settle claims
(1,748,198) 83,641 (1,664,557)
Decrease for prior years' claims
(6,930) 2,325 (4,605)
Increase for current year claims
1,732,479 (82,805) 1,649,674
Foreign exchange
(6,359) 887 (5,472)
At end of year 239,208 (10,994) 228,214
2016 (restated
1)
Gross Reinsurance Net
£’000 £’000 £’000
Analysis of movement in provision for unearned premiums
At beginning of year
994,481 (35,903) 958,578
Written premiums in respect of future periods
2,379,001 (106,588) 2,272,413
Earned in the year
(2,360,873) 107,780 (2,253,093)
Transfer from fellow Group undertaking
2,518 - 2,518
At end of year 1,015,127 (34,711) 980,416
Analysis of movement in provision for claims
At beginning of year
235,395 (11,665) 223,730
Cash paid to settle claims
(1,686,061) 33,982 (1,652,079)
Decrease for prior years' claims
- 1,650 1,650
Increase for current year claims
1,700,395 (34,578) 1,665,817
Transfer
2,529 (2,529) -
Foreign exchange
15,958 (1,902) 14,056
At end of year 268,216 (15,042) 253,174 1Restated, see note 27 for further details.

Notes to the Financial Statements (continued) for the financial year ended 31 December 2017
32 Bupa Insurance Limited Registered number: 3956433
Assumptions for general insurance business
The process of recognising liabilities arising from general insurance entails the estimation of future payments to settle incurred
claims and associated claims handling expenses, as well as assessing whether additional provisions for unexpired risk are
required. The principal assumptions in the estimation of the liability relate to the expected frequency, severity and settlement
patterns of insurance claims, which are expected to be consistent with recently observed experience and trends. The aim of
claims reserving is to select assumptions and reserving methods that will produce the best estimate of the future cash outflows
for the subject claims; it is an uncertain process which also requires judgements to be made. The resulting provisions for
outstanding claims incorporate a margin for adverse deviation, over and above the best estimate liability, the quantum of which
reflects the level of this uncertainty.
Estimation techniques are used in the calculation of the claims outstanding which are valued at a point estimate. The claims
outstanding comprises the estimated costs of claims and claims handling expense for the two claims components as follows:
• Claims reported but not paid
• Claims incurred but not reported (IBNR)
Claims reported but not paid are computed from direct data extraction from claims administration and accounting systems. For
IBNR the method of computation is based upon the development of previously settled claims and the extrapolation of payments
to date for each prior month.
Claims development patterns are analysed; where distinct sub-portfolios with different claims cost and development
characteristics exist, further analysis is undertaken to derive assumptions for reserving that are appropriate and can be applied
to relatively homogeneous groups of policies. Such sub-portfolios may be defined by product line, risk profile, geography or
market sector. Various established reserving methods for general insurance are considered, typically basic chain ladder,
Bornhuetter-Ferguson and pure risk cost methods. Additional consideration is given to the treatment of large claims, claim
seasonality, claims inflation and currency effects, for which appropriate adjustments to assumptions and methods are made.
While there is some diversity in the development profile of health insurance claims across the Company, such claims are
generally highly predictable in both frequency and average amount, and claims are settled quickly following the medical event
for which the benefit is claimed. Medical expenses claims are typically, substantially fully-settled within just a few months.
Claims management practices such as pre-authorisation of the claim with the insured, electronic claims settlement and
effective network provider arrangements can reduce the development period to four to six months.
Insurance provisions are best estimates. Actual experience of claims costs and/or administrative expenses may well vary from
that anticipated in the reserving estimates.
Liability adequacy testing
Liability adequacy tests are performed for all insurance portfolios. For short duration contracts, a premium deficiency is
recognised if the sum of expected costs of future claims and claim adjustment expenses, capitalised deferred acquisition costs,
and maintenance expenses exceeds the corresponding unearned premiums, while considering anticipated investment income.
Such a deficiency would be immediately recognised in the Profit and Loss Account.
20 Provisions for other risks
Regulatory Other Total
2017 £'000 £'000 £'000
At beginning of year
369 4,168 4,537
Transfer from general accruals
2,089 - 2,089
Charged to profit and loss account
4,360 4 4,364
Utilisation of the provision
(6,449) (831) (7,280)
Released in the year
(42) (794) (836)
Foreign exchange - (4) (4)
At end of year 327 2,543 2,870
Regulatory provisions relate to levies payable to the PRA and the FCA. Such levies are generally determined on a capped
percentage of revenues basis. Payments are normally made annually, although the frequency may be increased or decreased
at the discretion of the regulatory body. The provision is a best estimate of the forthcoming payments considering the likely
liability and expected business performance.
Other provisions relate principally to possible insurance premium tax (IPT) payments and legal, contract and customer
remediation provisions.
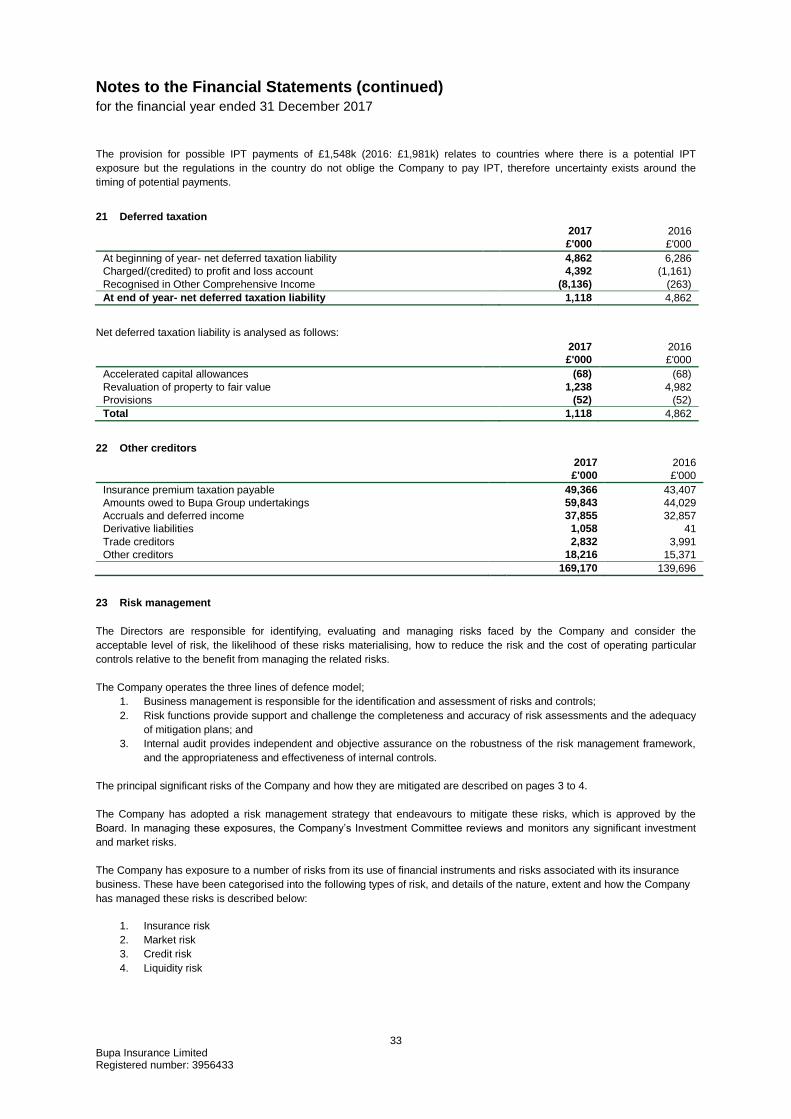
Notes to the Financial Statements (continued) for the financial year ended 31 December 2017
33 Bupa Insurance Limited Registered number: 3956433
The provision for possible IPT payments of £1,548k (2016: £1,981k) relates to countries where there is a potential IPT
exposure but the regulations in the country do not oblige the Company to pay IPT, therefore uncertainty exists around the
timing of potential payments.
21 Deferred taxation
2017 2016
£'000 £'000
At beginning of year- net deferred taxation liability
4,862 6,286
Charged/(credited) to profit and loss account
4,392 (1,161)
Recognised in Other Comprehensive Income (8,136) (263)
At end of year- net deferred taxation liability 1,118 4,862
Net deferred taxation liability is analysed as follows:
2017 2016
£'000 £'000
Accelerated capital allowances
(68) (68)
Revaluation of property to fair value
1,238 4,982
Provisions
(52) (52)
Total 1,118 4,862
22 Other creditors
2017 2016
£'000 £'000
Insurance premium taxation payable
49,366 43,407
Amounts owed to Bupa Group undertakings
59,843 44,029
Accruals and deferred income
37,855 32,857
Derivative liabilities
1,058 41
Trade creditors
2,832 3,991
Other creditors
18,216 15,371
169,170 139,696
23 Risk management
The Directors are responsible for identifying, evaluating and managing risks faced by the Company and consider the
acceptable level of risk, the likelihood of these risks materialising, how to reduce the risk and the cost of operating particular
controls relative to the benefit from managing the related risks.
The Company operates the three lines of defence model;
1. Business management is responsible for the identification and assessment of risks and controls; 2. Risk functions provide support and challenge the completeness and accuracy of risk assessments and the adequacy
of mitigation plans; and
3. Internal audit provides independent and objective assurance on the robustness of the risk management framework,
and the appropriateness and effectiveness of internal controls.
The principal significant risks of the Company and how they are mitigated are described on pages 3 to 4.
The Company has adopted a risk management strategy that endeavours to mitigate these risks, which is approved by the
Board. In managing these exposures, the Company’s Investment Committee reviews and monitors any significant investment
and market risks.
The Company has exposure to a number of risks from its use of financial instruments and risks associated with its insurance
business. These have been categorised into the following types of risk, and details of the nature, extent and how the Company
has managed these risks is described below:
1. Insurance risk
2. Market risk
3. Credit risk
4. Liquidity risk

Notes to the Financial Statements (continued) for the financial year ended 31 December 2017
34 Bupa Insurance Limited Registered number: 3956433
23.1 Insurance risk
Underwriting risk
Underwriting risk affects future cash flows of the Company. It can be subdivided into claims risk and pricing risk which
represent the risk of adverse variances in claims outflows and premium inflows respectively.
Pricing risk arises from routine revisions to premium tariffs and from the processes, in certain businesses, to set bespoke
premiums for large corporate health insurance customers. The adequacy of pricing rests on thorough actuarial analyses of past
and most recent claims levels, combined with forward projections of the most recent observed trends. Pricing risk affects only
future cash flows since new tariffs impact on levels of premium earned when health insurance contracts renew.
The Company mainly writes annually renewable health insurance contract. The annual renewability feature permits tariff
revisions to be made in response to changes in claim experience. This is a significant mitigant to pricing risk. The Company
underwrites no material business that commits it to cover risks at premiums fixed beyond a twelve month period from inception
or renewal.
Claims risk is managed and controlled by means of pre-authorisation of claims, outpatient benefit limits, the use of consultant
networks and agreed networks of hospitals and charges.
Specific claims management processes vary across the Company depending on local conditions and practice.
Future adverse claims experience, for example, that which is caused by external factors such as medical inflation, will affect
cash flows after the date of the financial statements.
Generally, the Company’s health insurance contracts contain terms and conditions that provide for the reimbursement of
incurred medical expenses for treatment related to acute medical conditions. The contracts do not provide for capital sums or
indemnified amounts. Therefore claims experience is necessarily underpinned by prevailing rates of illness. Additionally, claims
risk is generally mitigated by the Company’s control processes to ensure that both the treatments and the consequent
reimbursements are appropriate.
Reserving risk
Reserving risk is the risk that technical provisions for claims incurred prove to be insufficient. There is a relatively low exposure
to reserving risk due to the short-term nature of claims development patterns. The short-tail nature of the Company’s insurance
contracts means that movements in claims development assumptions are generally not significant. The development patterns
are kept under constant review to maintain the validity of the assumptions and hence, the validity of the estimation of technical
provisions.
The amount of claims provision at any given time that relates to potential claims payments that have not been settled within one
year is not material. Also, it is possible to estimate with reasonable confidence the outstanding amounts for such late-settled
claims.
Other risks relating to underwriting health
Claims provisions are not discounted. The premium provisions are discounted but their short-term nature means that changes
in interest rates have no impact on reserving risk. In addition, the future premium income and claims outflows of health
insurance premium liabilities are not affected by changes in interest rates. However, changes to inflationary factors such as
wage inflation and medical cost inflation affect the value of future claims outflows.
None of the Company’s insurance contracts contain embedded derivatives so the contracts do not in that respect give rise to
interest rate risk. The Company is exposed to foreign currency risk through some claims which are settled in a local currency.
Where possible these liabilities are matched to assets in the relevant currency to provide an economic hedge to this exposure.
The majority of the Company’s activities are single line health portfolios. Even though only one line of business is involved, the
Company does not have significant concentrations of insurance risk for the following reasons:
product diversity between domestic and expatriate, and individual and corporate health insurance; and
a variety of claims type exposures across diverse medical providers - consultants, nursing staff, clinics, individual
hospitals and hospital groups.
Only in select circumstances does the Company use reinsurance. Reinsurance contracts give rise to credit risk as disclosed in
note 23.3.

Notes to the Financial Statements (continued) for the financial year ended 31 December 2017
35 Bupa Insurance Limited Registered number: 3956433
Geographical concentrations of risk
The company is exposed to the risk that a single event occurs in a location which would result in a large number of claims
arising under a group risk policy. This is mitigated by diversifying the Company’s portfolio of risk across several countries.
Catastrophe risk
A natural disaster or a man-made disaster could potentially lead to a large number of claims and thus higher than expected
claims costs. In the majority of jurisdictions the Company is not liable to such claims. Where the Company is liable, these risks
are further reduced by excess of loss cover by Bupa and external providers. Bupa’s Centre Actuarial function oversees and
implements strategic improvements to ensure overall adequacy of these arrangements.
23.2 Market risk
Market risk is the risk of adverse financial impact due to changes in fair values of future cash flows of financial instruments from
fluctuations in interest rates, foreign exchange rates, commodity prices, credit spread and equity prices. The focus of the
Company’s long-term financial strategy is to facilitate growth without undue balance sheet risk.
The Company actively manages price risk by ensuring that the majority of its cash and investments are held with highly rated
credit institutions.
Where the Company has moved away from money market investments and invested in a limited portfolio of absolute return
assets (principally bonds), the Company uses a value at risk analysis (VaR95) to quantify risk, taking account of asset volatility
and correlation between asset classes. This portfolio was £305,386k at 31 December 2017 (2016: £293,554k) and the 1 year
VaR figure attributable to the portfolio is £32,352k at 31 December 2017 (2016: £24,500k).
Foreign exchange risk
The Company is exposed to foreign exchange risks arising from commercial transactions and from recognising assets,
liabilities and investments in overseas operations. The Company is exposed to both transaction and translation risk.
Transactional exposures arise as a result of differences between the currency of local revenues and costs. Key exposures are
to the US dollar, United Arab Emirates dirham, Hong Kong dollar, Singapore dollar, Euro, Danish krone, Swiss franc and
Australian dollar. Programmes are in place to hedge a significant proportion of forecast foreign currency exposure of Economic
Balance sheet through forward foreign exchange contacts for the coming year. These contracts are not designated hedges,
The remaining currency exposures are deemed to be acceptable but are kept under review by management.
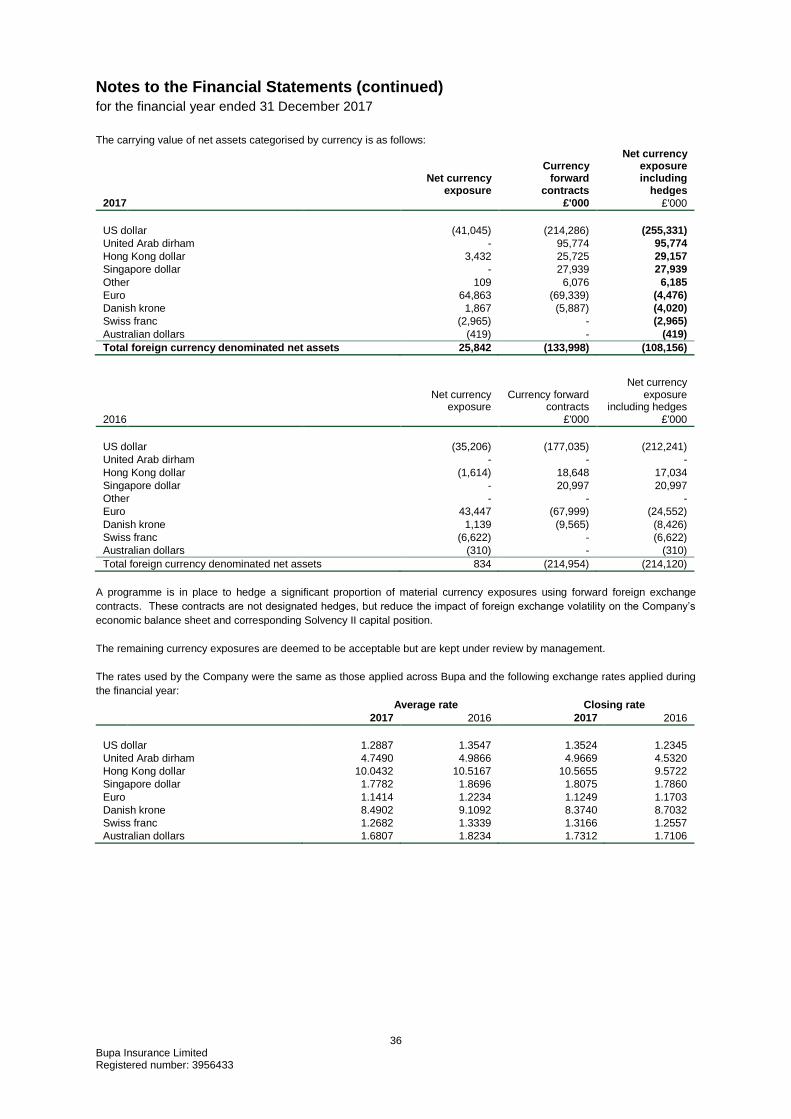
Notes to the Financial Statements (continued) for the financial year ended 31 December 2017
36 Bupa Insurance Limited Registered number: 3956433
The carrying value of net assets categorised by currency is as follows:
Net currency exposure
Currency forward
contracts
Net currency exposure including
hedges
2017 £'000 £'000
US dollar
(41,045) (214,286) (255,331)
United Arab dirham
- 95,774 95,774
Hong Kong dollar
3,432 25,725 29,157
Singapore dollar
- 27,939 27,939
Other
109 6,076 6,185
Euro
64,863 (69,339) (4,476)
Danish krone
1,867 (5,887) (4,020)
Swiss franc
(2,965) - (2,965)
Australian dollars (419) - (419)
Total foreign currency denominated net assets 25,842 (133,998) (108,156)
Net currency
exposure Currency forward
contracts
Net currency exposure
including hedges
2016 £'000 £'000
US dollar
(35,206) (177,035) (212,241)
United Arab dirham
- - -
Hong Kong dollar
(1,614) 18,648 17,034
Singapore dollar
- 20,997 20,997
Other
- - -
Euro
43,447 (67,999) (24,552)
Danish krone
1,139 (9,565) (8,426)
Swiss franc
(6,622) - (6,622)
Australian dollars
(310) - (310)
Total foreign currency denominated net assets 834 (214,954) (214,120)
A programme is in place to hedge a significant proportion of material currency exposures using forward foreign exchange
contracts. These contracts are not designated hedges, but reduce the impact of foreign exchange volatility on the Company’s
economic balance sheet and corresponding Solvency II capital position.
The remaining currency exposures are deemed to be acceptable but are kept under review by management.
The rates used by the Company were the same as those applied across Bupa and the following exchange rates applied during
the financial year:
Average rate Closing rate
2017 2016 2017 2016
US dollar 1.2887 1.3547 1.3524 1.2345
United Arab dirham 4.7490 4.9866 4.9669 4.5320
Hong Kong dollar 10.0432 10.5167 10.5655 9.5722
Singapore dollar 1.7782 1.8696 1.8075 1.7860
Euro 1.1414 1.2234 1.1249 1.1703
Danish krone 8.4902 9.1092 8.3740 8.7032
Swiss franc 1.2682 1.3339 1.3166 1.2557
Australian dollars 1.6807 1.8234 1.7312 1.7106

Notes to the Financial Statements (continued) for the financial year ended 31 December 2017
37 Bupa Insurance Limited Registered number: 3956433
The impact of a hypothetical 10% strengthening and weakening of Sterling against the currencies below, with all other variables
constant, would have increased / (decreased) profit before taxation and reserves by the amounts shown below:
Strengthening
10% Weakening 10%
(Losses)/gains included in
profit and loss account
Gains/(losses) included in
profit and loss account
£'000 £'000
2017
US dollar
17,639 (21,558)
United Arab dirham
(8,707) 10,642
Danish krone
(4,879) 5,964
Hong Kong dollar
(2,651) 3,240
Singapore dollar
(2,540) 3,104
Other
(463) 566
Euro 11 (13)
Total sensitivity (1,590) 1,945
2016
US dollar
24,375 (29,791)
United Arab dirham
- -
Danish krone
586 (716)
Hong Kong dollar
(1,549) 1,893
Singapore dollar
(1,909) 2,333
Other
413 (505)
Euro
1,176 (1,437)
Total sensitivity 23,092 (28,223)
Interest rate risk Interest rate risk is the risk that the fair value or future cash flows of a financial instrument will fluctuate because of changes in
market interest rates.
The Company is exposed to interest rate risk arising from fluctuations in market rates. This affects the return on floating rate
assets, the cost of floating rate liabilities and the balance sheet value of its investment in fixed rate bonds. Floating rate assets
represent a natural hedge for floating rate liabilities. The net balance on which the Company was exposed as at 31 December
2017 was £752,228k (2016: £826,502k).
The Company’s sole interest bearing financial liability is the £330.0m subordinated debt (see note 18). This is a fixed interest
liability which has no repayment date, however the interest rate is due to be reset in 2020.
The impact of a hypothetical rise of 100 bps in interest rates at the reporting date, on an annualised basis, would have
decreased profit and reserves by £3,538k (2016: increase £1,730k). This analysis assumes that all other variables, in particular
foreign exchange rates, remain constant.
The impact of a hypothetical fall of 100 bps in interest rates on an annualised basis would have the inverse effect to that stated
in the previous paragraph.
23.3 Credit risk
Credit risk is the risk that the Company will suffer a financial loss as a result of a counterparty failing to meet all or part of their
contractual obligations. Bupa Group Treasury manages the Company’s credit risk under the guidance of the Investment
Committee.
Investment exposure with external counterparties is managed by ensuring there is a sufficient spread of investments and that
all counterparties are rated at least ‘A’ by two of the three key rating agencies used by the Company (unless specifically
approved by the Investment Committee).

Notes to the Financial Statements (continued) for the financial year ended 31 December 2017
38 Bupa Insurance Limited Registered number: 3956433
The investment profile at 31 December is as follows:
2017 2016
£'000 £'000
Investment grade counterparties
821,827 875,878
Non-investment grade counterparties 139,100 112,000
Total 960,927 987,878
Investment grade counterparties include cash at bank and in hand of £263,208k (2016: £242,556k). The investments which are
held with non-investment grade counterparties are classed as debt securities and loans. Non-investment grade counterparties
are those rated below BBB- / Baa3.
Information regarding the ageing of financial investments, assets arising from insurance operations, and the value of the
impairment made against these assets, is provided below:
2017
Neither past due or
impaired
0-3 months
3-6 months
6 months - 1 year
Impairment Total
carrying value
£'000 £'000 £'000 £'000 £'000 £'000
Debt securities and other loans 423,878 - - - - 423,878
Pooled investment funds 125,101 - - - - 125,101
Deposits with credit institutions 148,740 - - - - 148,740
Reinsurers' share of insurance provisions 38,219 - - - - 38,219
Debtors arising out of insurance operations
2
664,826 46,331 16,123 28,082 (1,781) 753,581
Other debtors 203,991 - - - - 203,991
Total 1,604,755 46,331 16,123 28,082 (1,781) 1,693,510
2016 (restated1)
Neither past due or
impaired
0-3 months
3-6 months
6 months - 1 year
Impairment Total
carrying value
£'000 £'000 £'000 £'000 £'000 £'000
Debt securities and other loans 402,032 - - - - 402,032
Pooled investment funds 121,110 - - - - 121,110
Deposits with credit institutions 222,180 - - - - 222,180
Reinsurers' share of insurance provisions 49,753 - - - - 49,753
Debtors arising out of insurance operations
2
609,066 91,687 9,219 16,955 (2,171) 724,756
Other debtors 109,882 - - - - 109,882
Total 1,514,023 91,687 9,219 16,955 (2,171) 1,629,713 1Restated, see note 27 for further details.
2Comprises debtors arising out of policyholder and intermediary insurance operations and reinsurance operations.
The carrying amount of the financial investments and assets arising from insurance operations shown above of £1,693,510k
(2016: £1,629,713k) included on the Balance Sheet, represents the maximum credit exposure.
The movement in the allowance for impairment in respect of financial investments and assets arising from insurance operations
during the year was as follows:
2017 2016
£'000 £'000
At beginning of year
2,171 1,879
Impairment loss recognised in year
347 455
Bad debt provision released in year
(740) (58)
Foreign exchange 3 (105)
Total 1,781 2,171

Notes to the Financial Statements (continued) for the financial year ended 31 December 2017
39 Bupa Insurance Limited Registered number: 3956433
Offsetting Financial Assets and Financial Liabilities
a) Financial assets
The following financial assets are subject to offsetting, enforceable master netting arrangement and similar agreements.
Gross
amounts of recognised
financial assets
Gross amounts of recognised
financial liabilities set
off in the balance
sheet
Net amounts of financial
assets/ Liabilities
presented in the balance
sheet
Related amounts not set off in the balance sheet
Net amount Financial
instruments
Cash collateral received
£'000 £'000 £'000 £'000 £'000 £'000
As at 31 December 2017 Derivative financial assets 3,111 - 3,111 923 3,252 (1,064)
Derivative financial liabilities (1,058) - (1,058) (923) - (135)
Cash and cash equivalents 291,569 (28,361) 263,208 - - 263,208
Other debtors 200,880 - 200,880 - - 200,880
Other payables (168,112) - (168,112) - (3,252) (164,860)
Total 326,390 (28,361) 298,029 - - 298,029
Gross
amounts of recognised
financial assets
Gross amounts of recognised
financial liabilities set
off in the balance
sheet
Net amounts of financial
assets/ Liabilities
presented in the balance
sheet
Related amounts not set off in the balance sheet
Net amount Financial
instruments
Cash collateral received
£'000 £'000 £'000 £'000 £'000 £'000
As at 31 December 2016 Derivative financial assets 3,508 - 3,508 84 - 3,424
Derivative financial liabilities - (41) (41) (84) - 43
Cash and cash equivalents 273,548 (30,992) 242,556 - - 242,556
Other debtors 106,374 - 106,374 - - 106,374
Other payables (139,655) - (139,655) - - (139,655)
Total 243,775 (31,033) 212,742 - - 212,742
For the financial assets and liabilities subject to enforceable master netting arrangements or similar arrangements above, each
agreement between the Group and the counterparty allows for net settlement of the relevant financial assets and liabilities with
both elect to settle on net basis. In the absence of such an election, financial assets and liabilities will be settled on a gross
basis, however, each party to the master netting agreement or similar agreement will have the option to settle all such amounts
on a net basis in the event of default of the other party.
23.4 Liquidity risk
Liquidity risk is the risk that the Company will not have available funds to meet its liabilities when they fall due.
The Company enjoys a strong liquidity position and adheres to strict liquidity management policies as set by its Investment
Committee.
Liquidity is managed by currency and by considering the segregation of accounts required for regulatory purposes.

Notes to the Financial Statements (continued) for the financial year ended 31 December 2017
40 Bupa Insurance Limited Registered number: 3956433
The contractual maturities of financial liabilities and the expected maturities of other liabilities including estimated interest
payments of the Company as at 31 December are as follows:
2017
Subordinated
liabilities
Provision under
insurance contracts
issued
Creditors arising out of
insurance and
reinsurance operations
Other creditors
Derivative liabilities Total
£'000 £'000 £'000 £'000 £'000 £'000
2018
20,625 1,252,196 5,656 168,112 1,058 1,447,647
2019
20,625 - - - - 20,625
2020
350,625 - - - - 350,625
2021
- - - - - -
2022
- - - - - -
2023-2027
- - - - - -
After 2027 - - - - - -
Total 391,875 1,252,196 5,656 168,112 1,058 1,818,897
Carrying value 335,877 1,252,196 5,656 168,112 1,058 1,762,899
2016 (restated1)
Subordinated
liabilities
Provision under
insurance contracts
issued
Creditors arising out of
insurance and reinsurance operations
Other creditors
Derivative liabilities Total
£'000 £'000 £'000 £'000 £'000 £'000
2017
20,625 1,283,342 44,011 139,655 41 1,487,674
2018
20,625 - - - - 20,625
2019
20,625 - - - - 20,625
2020
350,625 - - - - 350,625
2021
- - - - - -
2022-2026
- - - - - -
After 2026 - - - - - -
Total 412,500 1,283,342 44,011 139,655 41 1,879,549
Carrying value 335,912 1,283,342 44,011 139,655 41 1,802,961 1Restated, see note 27 for further details

Notes to the Financial Statements (continued) for the financial year ended 31 December 2017
41 Bupa Insurance Limited Registered number: 3956433
The Company manages investment liquidity against a target benchmark of four months’ duration for deposits with financial
institutions and takes actions around this target based on future market expectations The maturity profile of financial assets at
31 December is as follows:
2017
Cash at bank and
hand
Deposits with credit
institutions
Govern-ment debt securities
Corporate debt
securities and other
loans
Pooled investment
funds Total
£'000 £'000 £'000 £'000 £'000 £'000
2018 263,208 83,317 - 27,575 40,020 414,120
2019 - 65,423 - 83,365 - 148,788
2020 - - - 96,492 - 96,492
2021 - - - 45,211 - 45,211
2022 - - - 119,320 - 119,320
2023-2027 - - - - 85,081 85,081
After 2027 - - 28,651 23,264 - 51,915
Total 263,208 148,740 28,651 395,227 125,101 960,927
2016 Cash at bank
and hand
Deposits with credit
institutions
Government debt
securities
Corporate debt
securities and other
loans
Pooled investment
funds Total £'000 £'000 £'000 £'000 £'000 £'000
2017 242,556 121,669 - 60,302 39,841 464,368
2018 - 35,085 - 112,482 81,269 228,836
2019 - 65,426 - 163,164 - 228,590
2020 - - - - - -
2021 - - - 14,916 - 14,916
2022-2026 - - 23,618 27,550 - 51,168
After 2026 - - - - - -
Total 242,556 222,180 23,618 378,414 121,110 987,878
24 Capital management
The Company’s capital management objective is to maintain sufficient capital to safeguard the Company’s ability to continue as
a going concern and to protect the interests of all of its customers, investors, regulator and trading partners while also efficiently
deploying capital and managing risk to sustain ongoing business development.
The Company manages its capital resources in line with the Group’s Capital Management Policy, which is reviewed on an
annual basis.
The Company has issued a £330.0m (2016: £330.0m) callable subordinated perpetual loan. This loan is accounted for as a
liability in these financial statements but is, to the extent that it is eligible, treated as solvency capital for regulatory and
management purposes.
The Company’s capital position is kept under constant review and is reported monthly to the Board.
The Company is subject to the requirements of the SII Directive and must hold sufficient capital to cover its Solvency Capital
Requirement (SCR). In addition, the Company maintains a buffer in excess of this capital requirement, specified in line with the
capital risk appetite set by the Board. The SCR is calculated in accordance with the Standard Formula specified in the SII
regulations. The Company has obtained approval from the Prudential Regulation Authority (PRA) to substitute the premium risk
parameter in the formula with an Undertaking Specific Parameter (USP), which reflects the Company’s own loss experience.
At least annually, the Company carries out an Economic Capital Assessment (ECA) in which it makes its own quantification of
how much capital is required to support its risks. The ECA is used to assess how well the Standard Formula SCR reflects the
Company’s actual risk profile.
The ECA forms part of the Own Risk and Solvency Assessment (ORSA) which comprises all the activities by which the
Company establishes the level of capital required to meet its solvency needs over the planning period given the Company’s
strategy and risk appetite. The conclusions from these activities are summarised in the ORSA Report which is reviewed by the
Risk Committee, approved by the Board and submitted to the PRA at least annually.

Notes to the Financial Statements (continued) for the financial year ended 31 December 2017
42 Bupa Insurance Limited Registered number: 3956433
The Company’s Eligible Own Funds, determined in accordance with the SII valuation rules, were £527m1 (2016: £433m) which
was in excess of the estimated SCR of £281m1 (2016: £271m). This represented a solvency coverage ratio of 187%
1 (2016:
160%). This increase in coverage is due to profit after tax during the period
Other than disclosed above there have been no changes to what is managed as capital or the Company’s capital management
objectives, policies or procedures during the year.
¹The Solvency Capital Position and related disclosures are estimated values.
25 Contingent liabilities, guarantees and other financial commitments
(i) Contingent liabilities
Under a Group registration, the Company is jointly and severally liable for Value Added Tax (VAT) due by certain other Group
Companies.
The Company has contingent liabilities arising in the ordinary course of business, including losses which might arise from
litigation, from which it is anticipated that the likelihood of any material unprovided liabilities arising is remote.
(ii) Guarantees
On 15 December 2004, Bupa Finance plc issued £330.0m callable subordinated perpetual guaranteed bonds on the London
Stock Exchange. Bupa Insurance Limited acted as the guarantor in the issue, irrevocably guaranteeing the bond on a
subordinated basis. Were the Company to repay part or all of the guaranteed bonds, the amount would be deducted from
balances owed to Bupa Finance plc. The guarantee has been designated as an insurance contract.
(iii) Financial commitments
The Company had no financial commitments at the Balance Sheet date.
26 Immediate and ultimate parent company
The immediate parent undertaking of the Company is Bupa Finance plc, a company incorporated in England and Wales, the
registered office of which is, 1 Angel Court, London, EC2R 7HJ.
The ultimate parent undertaking of the Company, and the largest group into which these financial statements are consolidated,
is The British United Provident Association Limited (Bupa), a company incorporated in England and Wales, the registered office
of which is, 1 Angel Court, London, EC2R 7HJ. The consolidated financial statements of Bupa are prepared in accordance with
International Financial Reporting Standards as adopted by the EU and are available to the public. The smallest group into
which these financial statements are consolidated is that headed by Bupa Finance plc.
Copies of the accounts of both companies can be obtained from The Registrar of Companies, Cardiff, CF14 3UZ.
27 Prior year adjustments
The following restatements have been made by the Company:
Management corrected the methodology for recognising premiums written by the overseas branches, ensuring
alignment with Company’s policy of recognising total premiums receivable over the whole period of cover at
inception. The correction resulted in: an increase in ‘Gross premiums written’ of £656k with no impact on ‘Net
premiums earned;’ and an increase in ‘Debtors arising out of direct insurance operations: Policyholders’ with a
corresponding increase in the ‘Provision for unearned premiums.’
Net gains/losses on foreign exchange transactions have been restated to correct the accounting treatment of non-
monetary items as set out in the Company’s accounting policies. The correction resulted in: a decrease in ‘Change in
the gross provision for unearned premiums’ of £26,697k with a corresponding decrease in ‘Net operating expenses.’
Management corrected the assessment of the future use of the property under construction. The intention is that the
property will be held to generate rental income resulting in the property being reclassified from ‘Property, plant and
equipment’ to ‘Investment property.’ The adjustment amounted to £19,035k.
The restatements have a no impact on Profit after tax and no impact on the Company’s Net asset position. The tables below
reflect the impact of the restatements on the financial statement line items affected.

Notes to the Financial Statements (continued) for the financial year ended 31 December 2017
43 Bupa Insurance Limited Registered number: 3956433
Statement of Profit and Loss Account (extract) for the financial year ended 31 December 2016
2016
Adjustment 2016
(restated1)
TECHNICAL ACCOUNT £'000 £’000 £'000
Revenues Gross premiums written 2,378,345 656 2,379,001
Outward reinsurance premiums (106,588) - (106,588)
Premiums written, net of reinsurance 2,271,757 656 2,272,413
Change in the gross provision for unearned premiums 10,850 (27,353) (16,503)
Reinsurers' share of change in the gross provision for unearned premiums (5,940) - (5,940)
4,910 (27,353) (22,443)
Net premiums earned 2,276,667 (26,697) 2,249,970
Total revenues 2,281,681 (26,697) 2,254,984
Net claims incurred (1,650,218) - (1,650,218)
Net operating expenses (521,889) 26,697 (495,192)
Total claims and expenses (2,172,107) 26,697 (2,145,410)
Profit for the financial year 107,678 - 107,678
Balance Sheet (extract) as at 31 December 2016
2016
Adjustment 2016
(restated1)
ASSETS £'000 £’000
Investments
Investment property - 19,035 19,035
Property, plant and equipment 20,213 (19,035) 1,178
Investment in subsidiary undertakings 2,904 - 2,904
Financial investments 745,322 - 745,322
768,439 - 768,439
Debtors
Debtors arising out of direct insurance operations:
Policyholders 668,244 6,710 674,954
Intermediaries 1,450 - 1,450
Debtors arising out of reinsurance operations 48,352 - 48,352
Other debtors 109,882 - 109,882
827,928 6,710 834,638
Total assets 2,021,101 6,710 2,027,811
LIABILITIES
Gross technical provisions
Provision for unearned premiums 1,008,417 6,710 1,015,127
Claims outstanding 268,216 - 268,216
1,276,633 6,710 1,283,343
Total liabilities 1,811,347 6,710 1,818,057
Net Assets 2,021,101 6,710 2,027,811