burden of musculoskeletal diseases in the...edward h. yelin, phd bone and joint decade the bone and...
TRANSCRIPT


The Burden of Musculoskeletal Diseases in the UnitedStates is a joint project of the American Academy ofOrthopaedic Surgeons, American Academy ofPhysical Medicine and Rehabilitation, AmericanCollege of Rheumatology, American Society for Boneand Mineral Research, Arthritis Foundation,National University of Health Sciences, OrthopaedicResearch Society, Scoliosis Research Society, and theUnited States Bone and Joint Decade.
Management Oversight Team andMajor Contributing Organizations
Joshua J. Jacobs, MD Chair, Management Oversight Team, The Burden of Musculoskeletal Diseases in the United States
Gunnar B. J. Andersson, MD, PhDJohn-Erik Bell, MDStuart L. Weinstein, MDAmerican Academy of Orthopaedic Surgeons (AAOS)
John P. Dormans, MDScoliosis Research Society (SRS)
Steve M. Gnatz, MD, MHAAmerican Academy of Physical Medicine and
Rehabilitation (AAPM&R)
Nancy Lane, MDUnited States Bone and Joint Decade (USBJD)
J. Edward Puzas, PhDOrthopaedic Research Society (ORS)President, United States Bone and Joint Decade
(USBJD)
E. William St. Clair, MDEdward H. Yelin, PhDAmerican College of Rheumatology (ACR)
Additional Contributing Organizations
American Society for Bone and Mineral Research (ASBMR)
Arthritis FoundationNational University of Health Sciences
Project CoordinatorSylvia I. Watkins-Castillo, PhD
StaffRobert H. Haralson, III, MD, MBA, Medical Director,
AAOSToby R.W. King, CAE, Executive Director, USBJDAmy Miller, Senior Director, Research, Training and
Quality, ACRThomas E. Stautzenbach, MA, MBA, CAE, Executive
Director, AAPM&RCharles M. Turkelson, PhD, Director, Research and
Scientific Affairs, AAOSMarilyn Fox, PhD, Director, Publications, AAOSMary Steermann Bishop, Senior Manager, Production
& Archives, AAOSCourtney Astle, Assistant Production Manager, AAOS
Cover DesignRick Cosaro, Cosaro & Associates, Ltd.
The material presented in The Burden of Musculoskeletal Diseases in theUnited States is made available for informational purposes only. Thismaterial is not intended to suggest procedures or course oftreatment, only to provide an interpretation of available data on theincidence and prevalence of most major musculoskeletal conditions.
All rights reserved. No part of this publication may be reproduced,stored in retrieval system, or transmi�ed, in any form, or by anymeans, electronic, mechanical, photocopying, recording, orotherwise, without prior wri�en permission from the publisher.Copyright © 2008 by the American Academy of OrthopaedicSurgeons.ISBN 978-0-89203-533-5
The Burden of Musculoskeletal Diseases in the United States 6300 N. River RoadRosemont, IL 60018United States of America1-800-626-6726
Suggested citation: United States Bone and Joint Decade: The Burdenof Musculoskeletal Diseases in the United States. Rosemont, IL:American Academy of Orthopaedic Surgeons;2008.
Visit www.boneandjointburden.org forupcoming new chapters and an electronic version ofthis publication.
ii The Burden of Musculoskeletal Diseases in the United States - Copyright © 2008

iiiThe Burden of Musculoskeletal Diseases in the United States - Copyright © 2008
Authors and Reviewers Gunnar B. J. Andersson, MD, PhDJeannette Bouchard Kevin J. Bozic, MD, MBARobert M. Campbell, Jr., MDMiriam G. Cisternas, MSAdolfo Correa, MD. MPH, PhD Felicia Cosman, MDJanet D. Cragan, MD, MPHKristen D’Andrea, BANancy DoernbergJohn P. Dormans, MD, FACSAnn L. Elderkin, PA Zarina Fershteyn, MPHAimee J. Foreman, MASteven Gitelis, MDSteve M. Gnatz, MD, MHARobert H. Haralson, III, MD, MBACharles G. (Chad) Helmick, MDSerena Hu, MDJeffrey N. Katz, MDToby King, CAERon Kirk, MA, DC
Steven M. Kurtz, PhDNancy Lane, MDAssia Miller, MD, MPHReba L. Novich, MSWRichard Olney, MD, MPHPeter Panopalis, MDDavid J. Pasta, MSAndrew N. Pollak, MDJ. Edward Puzas, PhDB. Steven Richards, III, MDJohn P. Sestito, JD, MSCsaba Siffel, MD, PhDPaul D. Sponseller, MDE. William St. Clair, MDAndrew Stuart, MAKimberly J. Templeton, MDGeorge Thompson, MDLaura Tosi, MDWilliam G. Ward, Sr., MDSylvia I. Watkins-Castillo, PhDStuart L. Weinstein, MDJames G. Wright, MD, MPH, FRCSCEdward H. Yelin, PhD
Bone and Joint Decade
The Bone and Joint Decade is an international collaborative movement sanctioned by the United Nations/WorldHealth Organization and working to improve the quality of life for people with musculoskeletal conditions andto advance the understanding, prevention and treatment of these conditions.
Officially proclaimed by the U.S. President, the United States Bone and Joint Decade (USBJD) 2002-2011 has beenendorsed by all 50 States and more than one hundred national health care professional, patient and public organizations, all 125 U.S. medical schools and many colleges of medicine.
The goal of the United States Bone and Joint Decade is to improve bone and joint health by enhancing collaborative efforts among individuals and organizations in order to raise awareness of the growing burden ofmusculoskeletal disorders on society, to promote wellness and prevent musculoskeletal disease, and to advanceresearch that will lead to improvements in prevention, diagnosis and treatment.
www.usbjd.org [email protected]: 847-384-4010

iv

The Burden of Musculoskeletal Diseases in the United States - Copyright © 2008 v
vii Preface
ix Foreword
1 Chapter 1: Burden of Musculoskeletal Disease Overview
21 Chapter 2: Spine: Low Back and Neck Pain
55 Chapter 3: Spinal Deformity and Related Conditions
71 Chapter 4: Arthritis and Related Conditions
97 Chapter 5: Osteoporosis and Bone Health
123 Chapter 6: Musculoskeletal Injuries
163 Chapter 7: Congenital and Infantile Developmental Conditions of the Musculoskeletal System
175 Chapter 8: Neoplasms of Bone and Connective Tissue
195 Chapter 9: Health Care Utilization and Economic Cost of Musculoskeletal Diseases
227 Appendices
243 Index
Table of Contents

vi

Preface
viiThe Burden of Musculoskeletal Diseases in the United States - Copyright © 2008
It is with pleasure that I introduce you to thispublication of the Burden of MusculoskeletalDiseases in the United States, the timely resultof a partnership between the AmericanAcademy of Orthopaedic Surgeons and anumber of other organizations supportingthe U.S. Bone and Joint Decade (2002-2011).The level of disease recognition that theDecade has provided has done much to pushthe state of the science forward, and this newpublication presents a snapshot of how farwe have come since its predecessor, the 1999Musculoskeletal Conditions in the United States,was released.
Although many advances have been made,musculoskeletal conditions remain common,chronic, and costly—and potentiallydisabling—to an increasingly grayingpopulation with high expectations of thehealth system. With the National Center forHealth Statistics’ 2005 National HealthInterview Survey as a solid base, thispublication examines such issues as spinalproblems, arthritis and joint pain,osteoporosis, injuries, congenital conditions,
neoplasms, and health care utilization andcosts. The biomedically inclined reader willfind within these pages both food for thoughtand a call to action.
The plight of millions of Americans whoselives are affected by the physical, financial,and emotional demands of musculoskeletalconditions make the findings of Burdendifficult to ignore. I encourage you to readand digest its contents, and to appropriate foryourself those parts within your specificareas of interest or expertise.
Stephen I. Katz, MD, PhDDirector National Institute of Arthritis andMusculoskeletal and Skin DiseasesNational Institutes of HealthBethesda, MarylandJanuary 10, 2008

viii

The Burden of Musculoskeletal Diseases in the United States - Copyright © 2008 ix
ForewordMusculoskeletal disorders and diseases are theleading cause of disability in the United Statesand account for more that one-half of all chronicconditions in people over 50 years of age indeveloped countries. The economic impact ofthese conditions is also staggering. In 2004, thesum of the direct expenditures in health carecosts and the indirect expenditures in lost wagesfor persons with a musculoskeletal diseasediagnosis has been estimated to be $849 billiondollars, or 7.7% of the national gross domesticproduct.
Beyond these statistics, the human toll in terms ofthe diminished quality of life is immeasurable.This situation is unlikely to improve in theforeseeable future and will likely be intensifiedby current demographic trends, including thegraying of the baby boomer population, theepidemic of morbid obesity, and the higherrecreational activity levels of our elderlypopulation.
Despite these compelling facts, the investment inmusculoskeletal research in the United States lagsbehind other chronic conditions. Whilemusculoskeletal diseases are common, disablingand costly, they remain under-appreciated, underrecognized, and under-resourced by our nationalpolicy makers.
In March 2002, President George W. Bushdeclared the years 2002–2011 the National Boneand Joint Decade. The mission of the U.S. Boneand Joint Decade is to “promote and facilitatecollaboration among organizations committed toimproving bone and joint health througheducation and research.”
This volume serves the mission of the decade inthat several professional organizations concernedwith musculoskeletal health have collaborated totabulate up-to-date data on the burden of
musculoskeletal diseases to educate health careprofessionals, policy makers, and the public. Theinformation presented here is an update of twoprevious editions entitled MusculoskeletalConditions in the United States, published in 1992and 1999 by the American Academy ofOrthopaedic Surgeons. The present volume,renamed The Burden of Musculoskeletal Diseases inthe United States, represents a true collaboration ofa coalition of professional organizationscommitted to the mission of the U.S. Bone andJoint Decade.
These data should stimulate increased investmentin basic, translational, clinical, and health policyresearch to delineate the underlying mechanismsof these diseases and their response to treatment.Through such research, novel preventive andtherapeutic approaches with protential tomitigate the societal and personal impact ofmusculoskeletal disease will emerge.
Joshua J. Jacobs, MDChair, Management Oversight Team, Burden ofMusculoskeletal Diseases in the United States,American Academy of Orthopaedic Surgeons
John P. Dormans, MDScoliosis Research Society
Steve M. Gnatz, MD, MHAAmerican Academy of Physical Medicine andRehabilitation
Nancy Lane, MDUnited States Bone and Joint Decade
J. Edward Puzas, PhDOrthopaedic Research Society
E. William St. Clair, MDAmerican College of Rheumatology

Musculoskeletal conditions are among the mostdisabling and costly conditions suffered byAmericans. In March 2002, President George W.Bush proclaimed the years 2002–2011 as theUnited States Bone and Joint Decade, providingnational recognition to the fact thatmusculoskeletal disorders and diseases are theleading cause of physical disability in thiscountry.1,2
As the U.S. population rapidly ages in the next 25years, musculoskeletal impairments will increasebecause they are most prevalent in the oldersegments of the population. By the year 2030, thenumber of individuals in the United States olderthan the age of 65 is projected to double, withpersons aged 85 and over the most rapidlyexpanding segment of society. In Europe, by 2010,for the first time there will be more people olderthan 60 years of age than people younger than 20years of age.3 Health care services worldwide willbe facing severe financial pressures in the next 10to 20 years due to the escalation in the numbers ofpeople affected by musculoskeletal diseases. Boneand joint disorders account for more than one-half of all chronic conditions in people older than50 years of age in developed countries, and arethe most common cause of severe, long-term painand disability.4
The goal of the United States Bone and JointDecade is to improve the quality of life for peoplewith musculoskeletal conditions and to advanceunderstanding and treatment of these conditionsthrough research, prevention, and education. Thecornerstone of the Bone and Joint Decademovement is the burden of musculoskeletaldisease, defined as the incidence and prevalence
of musculoskeletal conditions; the resources usedto prevent, care, and cure for them; and theimpact on individuals, families, and society. Theimpact of musculoskeletal diseases includes lossof productivity for persons who live with amusculoskeletal condition that reduces theirability to work and perform activities of dailyliving, and those persons who die prematurelyfrom a musculoskeletal condition. It also takesinto consideration the quality of life, pain,discomfort, and disability for disabled personsand their relatives and friends. Direct costs of theburden of musculoskeletal disease includehospital inpatient, hospital emergency andoutpatient services, physician outpatient services,other practitioner services, home health care,prescription drugs, nursing home cost,prepayment and administration and non-healthsector costs. Indirect cost relates to morbidity andmortality, including the value of productivitylosses due to premature death due to a diseaseand the value of lifetime earnings.
Musculoskeletal conditions are not among the topten health conditions funded by research.5 Inspite of the widespread prevalence ofmusculoskeletal conditions, this is primarily dueto the low mortality from musculoskeletalconditions in comparison with other healthconditions. However, the morbidity cost ofmusculoskeletal conditions is tremendous, asmusculoskeletal conditions often restrict activitiesof daily living, cause lost work days, and are thesource of lifelong pain.
In 1998, the Institute of Medicine wrote that “insetting national priorities NIH should strengthenits analysis in the use of health data, such as
Chapter 1
Burden of Musculoskeletal Disease Overview
The Burden of Musculoskeletal Diseases in the United States - Copyright © 2008 1

burdens of disease, and of data on the impact ofresearch and the health of the public.”6 Nationalhealth data in several countries show thatmusculoskeletal conditions rank among the tophealth concerns for citizens in the United Statesand worldwide. By current estimates, over 40% ofthe disabling conditions of persons aged 18 yearsand over are musculoskeletal related, yet researchfunding to alleviate this major health conditionremains substantially below that of other majorhealth conditions, such as cancer, respiratory, andcirculatory (e.g., heart) diseases. Funding for theNational Institute of Arthritis andMusculoskeletal and Skin Diseases (NIAMS)began in 1987. In subsequent years, researchfunding for these conditions has declined andsince 2000 routinely less than 2% of the NationalInstitutes of Health (NIH) budget has beenappropriated to musculoskeletal disease researchannually. (Table 1.1)
Clearly, musculoskeletal conditions are common,disabling, and costly. Yet they remain under-recognized, under-appreciated, andunder-resourced. This book provides a strongcase for the immediate and ongoing need tounderstand and support musculoskeletalconditions and reduce the burden it brings to ourpeople.
Section 1.1: Prevalence of Select MedicalConditions in the U.S. Population
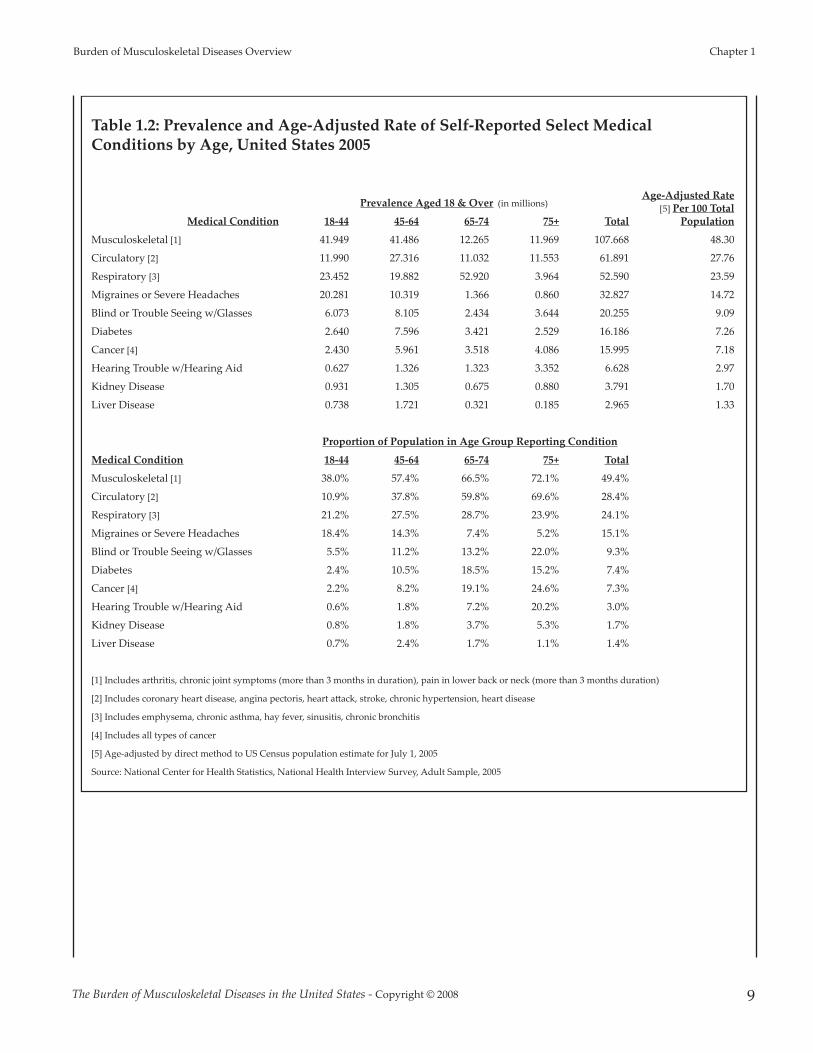
Musculoskeletal medical conditions werereported by 107.67 million adults in the U.S. in2005 in the National Health Interview Survey(NHIS), representing nearly one in two personsaged 18 and over of the estimated 2005population. The rate of chronic musculoskeletalconditions found in the adult population is nearlytwice that of chronic circulatory conditions,which include coronary and heart conditions, andmore than twice that of all chronic respiratory
conditions. On an age adjusted basis, whichaccounts for differences in the age distribution ofthe health care database sample and the actualpopulation, musculoskeletal conditions arereported by more than 48% of the population, or48.3 persons per 100 population. This compares toa rate of 27.8 and 23.6 per 100 population forcirculatory and respiratory conditions,respectively. (Table 1.2 and Graph 1.1.1) TheNHIS annual survey of self-reported healthconditions is used throughout this chapter tohighlight chronic health conditions of the U.S.population.
Musculoskeletal conditions are found among allage groups, with the proportion of personsreporting these conditions increasing with age.Musculoskeletal conditions are reported bynearly three of four (72%) persons aged 75 yearsand over, compared to approximately 69%reporting circulatory conditions. (Table 1.2)
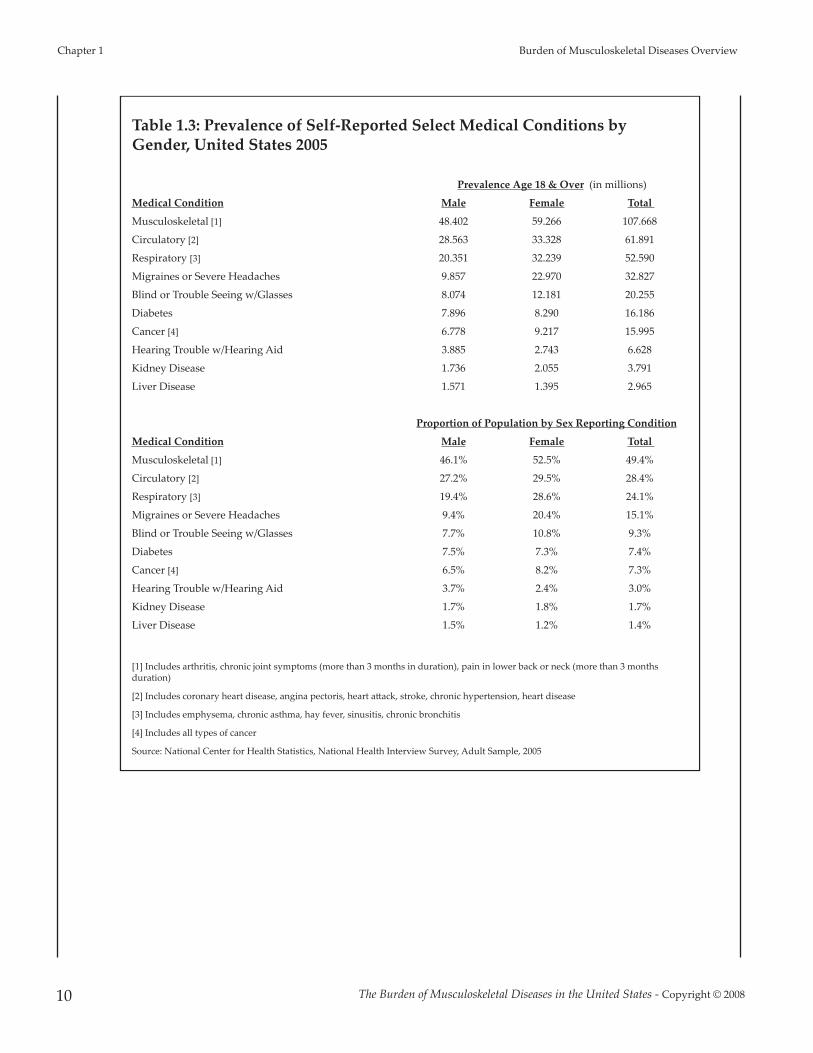
Females, in general, on an age-adjusted basis,report a higher rate of occurrence than males formost major medical conditions. Among females,musculoskeletal conditions are reported at a rateof 52.5 cases per 100 population, while amongmales the rate is 46.1 per 100. (Table 1.3)
The Burden of Musculoskeletal Diseases in the United States - Copyright © 2008
Chapter 1 Burden of Musculoskeletal Diseases Overview
2
Graph 1.1.1: Prevalence of Self-Reported Primary MedicalConditions for Persons Aged 18 and Over, United States2005
[1] Age-adjusted by direct method to U.S. Census population estimate forJuly 1, 2005Source: National Center for Health Statistics, National Health InterviewSurvey, Adult Sample, 2005
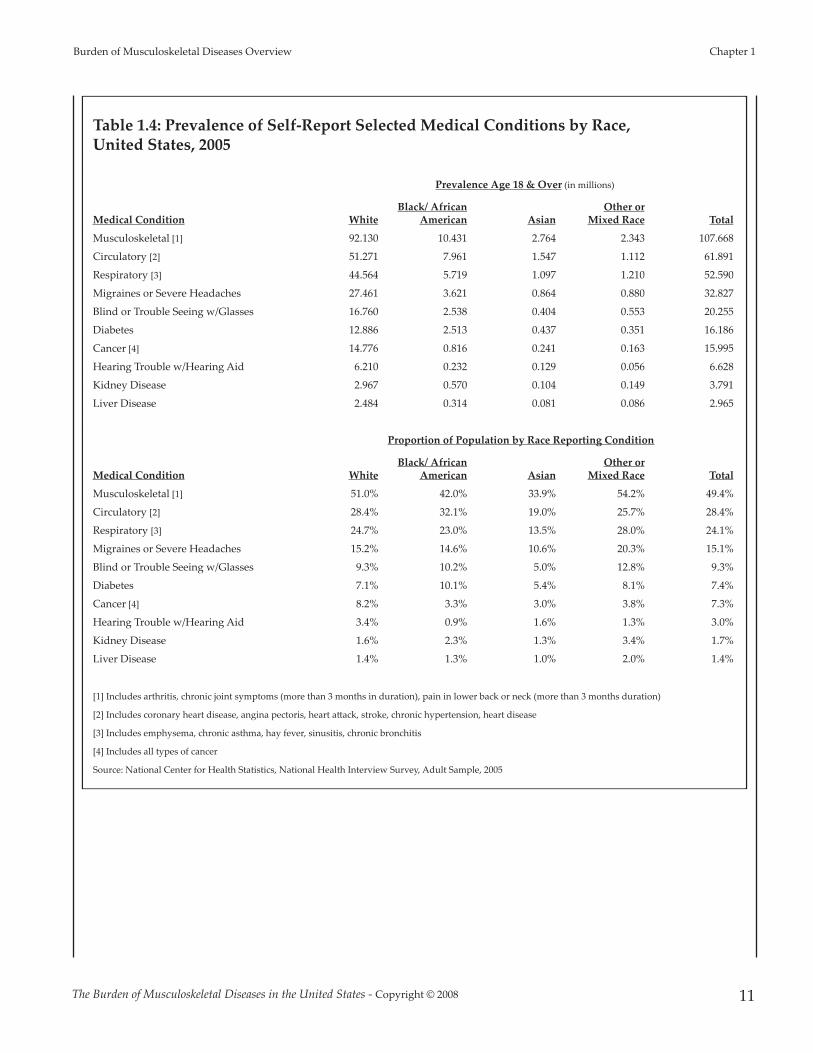
Musculoskeletal conditions are reportedproportionally between all race groups, with theexception of persons of the Asian race, where onein three, compared to the one in two of other racegroups, is likely to report a musculoskeletalcondition. (Table 1.4)
Section 1.1.1: Musculoskeletal, Circulatory, andRespiratory Conditions
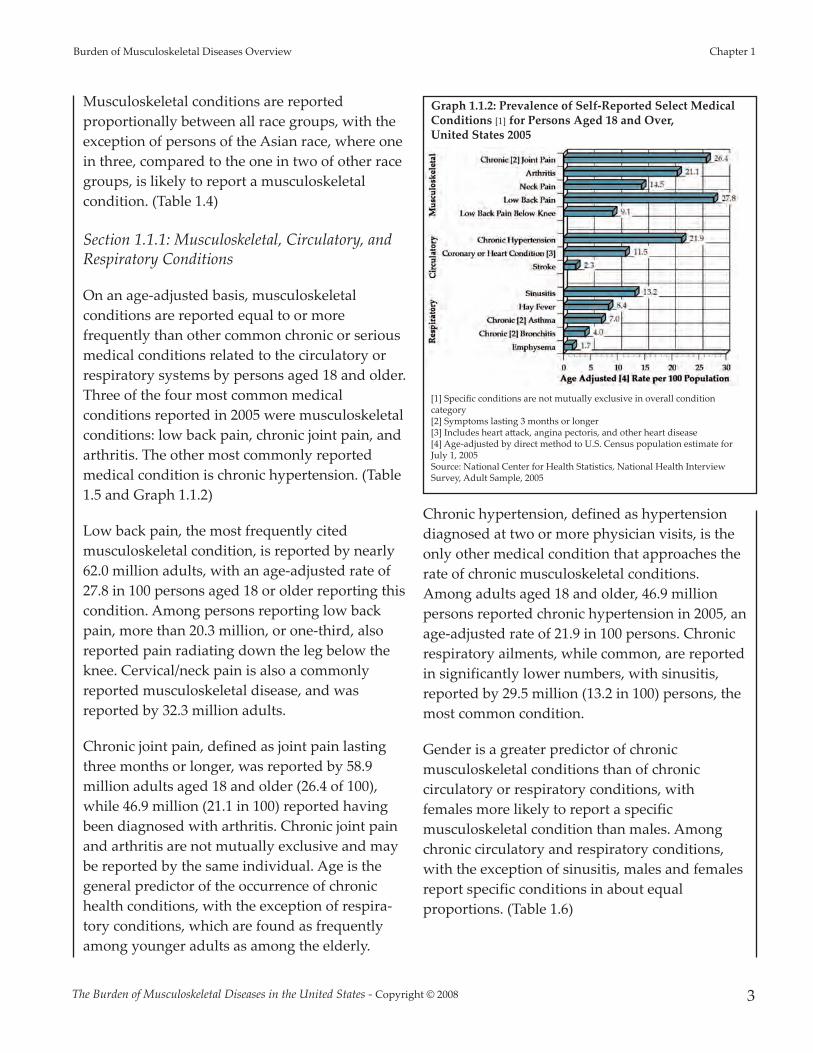
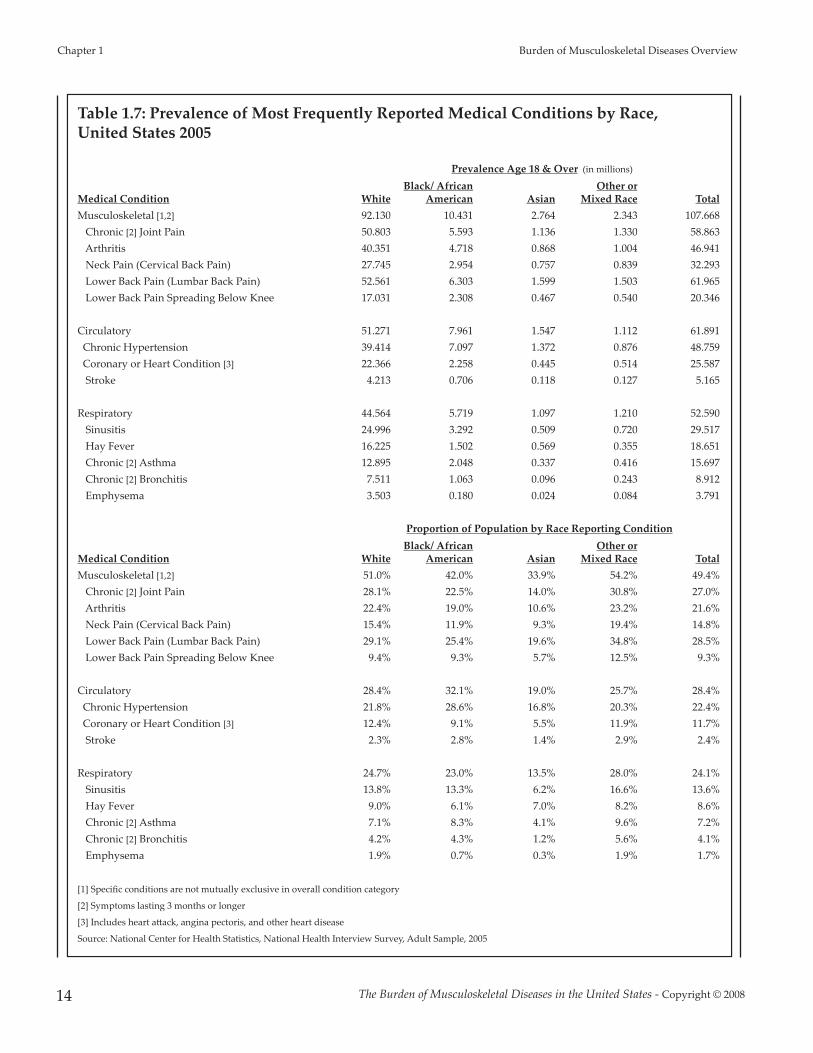
On an age-adjusted basis, musculoskeletalconditions are reported equal to or morefrequently than other common chronic or seriousmedical conditions related to the circulatory orrespiratory systems by persons aged 18 and older.Three of the four most common medicalconditions reported in 2005 were musculoskeletalconditions: low back pain, chronic joint pain, andarthritis. The other most commonly reportedmedical condition is chronic hypertension. (Table1.5 and Graph 1.1.2)
Low back pain, the most frequently citedmusculoskeletal condition, is reported by nearly62.0 million adults, with an age-adjusted rate of27.8 in 100 persons aged 18 or older reporting thiscondition. Among persons reporting low backpain, more than 20.3 million, or one-third, alsoreported pain radiating down the leg below theknee. Cervical/neck pain is also a commonlyreported musculoskeletal disease, and wasreported by 32.3 million adults.
Chronic joint pain, defined as joint pain lastingthree months or longer, was reported by 58.9million adults aged 18 and older (26.4 of 100),while 46.9 million (21.1 in 100) reported havingbeen diagnosed with arthritis. Chronic joint painand arthritis are not mutually exclusive and maybe reported by the same individual. Age is thegeneral predictor of the occurrence of chronichealth conditions, with the exception of respira-tory conditions, which are found as frequentlyamong younger adults as among the elderly.
Chronic hypertension, defined as hypertensiondiagnosed at two or more physician visits, is theonly other medical condition that approaches therate of chronic musculoskeletal conditions.Among adults aged 18 and older, 46.9 millionpersons reported chronic hypertension in 2005, anage-adjusted rate of 21.9 in 100 persons. Chronicrespiratory ailments, while common, are reportedin significantly lower numbers, with sinusitis,reported by 29.5 million (13.2 in 100) persons, themost common condition.
Gender is a greater predictor of chronicmusculoskeletal conditions than of chroniccirculatory or respiratory conditions, withfemales more likely to report a specificmusculoskeletal condition than males. Amongchronic circulatory and respiratory conditions,with the exception of sinusitis, males and femalesreport specific conditions in about equalproportions. (Table 1.6)
The Burden of Musculoskeletal Diseases in the United States - Copyright © 2008 3
Burden of Musculoskeletal Diseases Overview Chapter 1
Graph 1.1.2: Prevalence of Self-Reported Select MedicalConditions [1] for Persons Aged 18 and Over, United States 2005
[1] Specific conditions are not mutually exclusive in overall conditioncategory[2] Symptoms lasting 3 months or longer[3] Includes heart a�ack, angina pectoris, and other heart disease[4] Age-adjusted by direct method to U.S. Census population estimate forJuly 1, 2005Source: National Center for Health Statistics, National Health InterviewSurvey, Adult Sample, 2005

As is seen with chronic musculoskeletalconditions, chronic circulatory and respiratoryconditions are reported at lower rates by personsof the Asian race than other races. (Table 1.7)
Section 1.1.2: Chronic Joint Pain
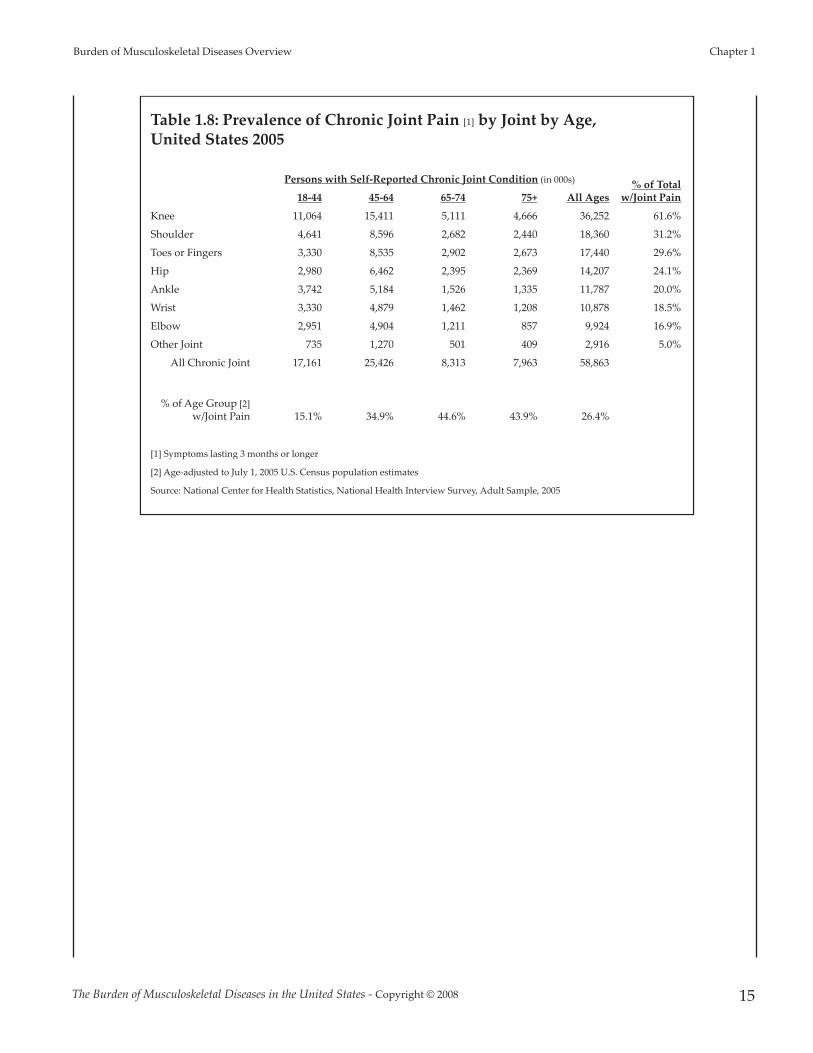
Among the nearly 59 million persons reportingchronic joint pain, knee pain is the mostfrequently cited, with more than 36.2 millionpersons reporting knee pain in 2005. Knee painis reported by all age groups in the age 18 andover population. Shoulder pain, reported by 18.3million persons aged 18 and older, is the secondmost common joint for chronic pain, and isreported more frequently by persons aged 45 to64 than by other age groups. Pain in the toesand/or fingers is reported by more than 17.7million persons, again more frequently reportedin the 45 to 64 age group. Chronic hip pain isreported by 14.2 million persons. Overall, personsaged 65 and older report chronic joint pain more
frequently than younger persons. (Table 1.8 andGraph 1.1.3)
Section 1.2: Activity Limitation Due to SelectMedical Conditions
Participants in the 2005 NHIS survey were askedabout limitations they experience in activities of
daily living due to medical conditions. More than29 million adults aged 18 years and over, or 13%of the population, report they have difficultyperforming routine daily activities of life withoutassistance due to medical conditions. An
additional 5.27 million children between theages of 1 and 17 years are reported by theirparents as needing assistance in dailyactivities expected for their age due to amedical condition. (Table 1.9)
The most frequently cited medical conditionfor which persons report limitations in theactivities of daily life is musculoskeletal.Nearly 15 million adults aged 18 and overare limited by one or more musculoskeletalconditions, including arthritis orrheumatism, back or neck problems, fractureor bone/joint injury, a missing or amputatedlimb, or a musculoskeletal connective tissue
condition. (Graph 1.2.1) Overall, 13% of adultsaged 18 and over have reduced quality of life dueto medical conditions, and more than one-half ofthese are due to musculoskeletal conditions.(Graph 1.2.2)
Reflecting the overall prevalence of medicalconditions in females, females are also more
The Burden of Musculoskeletal Diseases in the United States - Copyright © 2008
Chapter 1 Burden of Musculoskeletal Diseases Overview
4
Graph 1.1.3: Proportion of Population [1] Reporting Joint Pain [2],United States 2005
[1] Age-adjusted to July 1, 2005 U.S. Census population estimates[2] Symptoms lasting 3 months or longerSource: National Center for Health Statistics, National Health Interview Survey, AdultSample, 2005
Graph 1.2.1: Self-Reported Prevalance of Impairment inActivities of Daily Living Due to Select Medical Conditionsfor Persons Aged 18 and Older, United States 2005
[1] Includes arthritis/rheumatism condition, back or neck problem, fracture/bone/joint injury, musculoskeletal/connective tissue condition, missing oramputated limb/finger/digit.[2] Includes heart or hypertension, stroke, circulation problem.Source: National Center for Health Statistics, National Health InterviewSurvey, Person Sample, 2005

likely to report impairment in activities of dailyliving than are males. This is particularly true formusculoskeletal conditions, with 62% of femaleadults aged 18 and over reporting they arelimited in activities of daily living. (Table 1.10)
Members of the white, black/African American,and “other race” populations report limitationsdue to medical conditions in approximately thesame proportions. Members of the Asian race aresomewhat less likely to report limitations inactivities of daily living due to a medicalcondition. (Table 1.11)
Section 1.3: Lost Work Days and Bed Days
Musculoskeletal conditions are also the greatestcause of total lost work days and medical beddays in the U.S.. One in six persons (16%)employed in the previous 12 months in the U.S. atthe time of the survey reported lost work daystotaling nearly 437.6 million days as a result ofmusculoskeletal conditions. Chronic circulatoryconditions accounted for 236 million lost workdays, while chronic respiratory conditionsaccounted for 216 million. On average, workerslost 12 days in a 12 month period due tomusculoskeletal conditions. (Table 1.12)
More than one in five persons (21%) reported atleast one bed day in the previous 12 months dueto a musculoskeletal condition, with total beddays due to musculoskeletal conditions reportedat more than 810.3 million. An average 40 beddays per person was reported. (Table 1.13)
Musculoskeletal conditions accounted for one-half of both lost work days and bed days due to
The Burden of Musculoskeletal Diseases in the United States - Copyright © 2008 5
Burden of Musculoskeletal Diseases Overview Chapter 1
[1] Includes arthritis/rheumatism condition,back or neck problem, fracture/bone/jointinjury, musculoskeletal/connective tissuecondition, missing or amputatedlimb/finger/digit.Source: National Center for HealthStatistics, National Health Interview Survey,Person Sample, 2005
Graph 1.2.2: Self-Reported Impairment in Activities ofDaily Living for Persons Due to Select MedicalConditions by Age, United States 2005
Graph 1.3.1: Proportion of Total Lost Work Days forPersons Aged 18 and Over by Major Medical Condition, United States 2005
Respondents reported “Yes” when asked "Are you limited in any way in anyactivities because of physical, mental or emotional problems."
Respondents reporting a limitation reported “Yes” when asked if limitationwas caused by "arthritis/rheumatis; back/neck problem; fracture/bone/jointinjury; other injury; heart problem; stroke; hypertension."
Lost work days due to multiple conditions possible.
Source: National Center for Health Statistics, National Health InterviewSurvey, Adult Sample, 2005
Graph 1.3.2: Proportion of Total Bed Days for PersonsAged 18 and Over by Major Medical Condition, UnitedStates 2005
Respondents reported “Yes” when asked "Are you limited in any way in anyactivities because of physical, mental or emotional problems."
Respondents reporting a limitation reported 'Yes' when asked if limitationwas caused by "arthritis/rheumatis; back/neck problem; fracture/bone/jointinjury; other injury; heart problem; stroke; hypertension."
Bed days due to multiple conditions possible.
Source: National Center for Health Statistics, National Health InterviewSurvey, 2005

major medical conditions in 2005. (Graphs 1.3.1and 1.3.2) Compared to circulatory andrespiratory conditions, musculoskeletalconditions accounted for more than twice thenumber of lost work days of either of these twoconditions, and 36% and 45% more bed days thancirculatory and respiratory conditions,respectively. (Graph 1.3.3)
Major musculoskeletal causes of lost work daysand medical bed days are chronic joint pain,arthritis, and cervical/neck and low back pain.(Graph 1.3.4) Persons reporting low back painthat radiates below the knee reported one of thehighest average number of lost work days (30.1)and the highest average number of medical beddays (47.4). Circulatory conditions reported as the
cause of lost work days, on average, resulted ina slightly higher average number of work dayslost per worker than did musculoskeletalconditions (15.3 versus 12.3, respectively), butaccounted for substantially lower average beddays (21.4 versus 39.5, respectively). (Tables1.12 and 1.13)
Overall, the high proportion of workersreporting lost work days or bed days as aresult of a musculoskeletal condition results inan economic burden on the economy that istwice that reported for chronic circulatory orchronic respiratory conditions.
Section 1.4: Summary Health CareUtilization and Economic Cost ofMusculoskeletal Diseases
The annual average proportion of the U.S.population with a musculoskeletal conditionrequiring medical care has increased by morethan two percentage points over the past decadeand now constitutes more than 30% of thepopulation. The increasing prevalence ofmusculoskeletal conditions, along with a growingand aging population, has resulted in a more than41% increase in total aggregate direct cost to treatpersons with a musculoskeletal condition. In2002-2004, the annual average cost, in 2004dollars, for musculoskeletal health care wasestimated to be $510 billion, the equivalent of4.6% of the national gross domestic product(GDP). Indirect cost, expressed primarily as wagelosses for persons aged 18 to 64 with a work
The Burden of Musculoskeletal Diseases in the United States - Copyright © 2008
Chapter 1 Burden of Musculoskeletal Diseases Overview
6
Graph 1.3.3: Total Productivity Loss Due to SelectMedical Conditions [1,2] for Persons Aged 18 and Over,United States, 2005
[1] Reported “Yes” to at least one of the 23 medicalconditions (70% of the weighted population).Multiple conditions resulting in bed days possible.[2] Symptoms lasting 3 months or longer OR 2 ormore physician visits[3] Includes heart a�ack, angina pectoris, and otherheart diseaseSource: National Center for Health Statistics,National Health Interview Survey, Adult Sample,2005
Graph 1.3.4: Total Productivity Loss Due to SelectMusculoskeletal Conditions [1,2] for Persons Aged 18 andOver, United States 2005
[1] Reported “Yes” to at least one of the 23medical conditions. Multiple conditionsresulting in bed days possible.[2] Symptoms lasting 3 months or longer OR 2or more physician visitsSource: National Center for Health Statistics,National Health Interview Survey, AdultSample, 2005
history, added another $339 billion, or 3.1% of theGDP, to the cost associated with these conditions.Estimated incremental cost, that proportion oftotal direct cost associated with treatmentincurred beyond that of persons of similardemographic and health characteristics but whodo not have one or more musculoskeletal diseases(i.e., likely attributable to a musculoskeletaldisease), is estimated to be $156.7 billion, with anannual indirect incremental cost estimate of$110.5 billion.
Treatments that mitigate the long-term impacts ofmusculoskeletal conditions and return persons tofull and active lives are needed.
1. Weinstein S: 2000-2010: The Bone and Joint Decade. JBone Joint Surg Am 2000;82:1-3.
2. A Proclamation by the President of the United States ofAmerica: National Bone and Joint Decade Proclamation:National Bone and Joint Decade, 2002-2011. Office of thePress Secretary, 2002.
3. Murray CJL, Lopez AD: The Global Burden of Disease: AComprehensive Assessment of Mortality and Disability fromDiseases, Injuries, and Risk Factors in 1990 and Projected to2020. Cambridge, MA: Harvard University Press, 1996.
4. Conference proceedings: The bone and joint decade2000-2010 for prevention and treatment ofmusculoskeletal disorders. Lund, Sweden. Acta Orthop.Scand. Suppl.; 1998:218.
5. Michaud CM, Murray CJL, Bloom BR: Burden ofdisease: implications for future research. JAMA2001;285:535-539.
6. Committee on the NIH Research Priority-SettingProcess, Institute of Medicine: Scientific opportunitiesand public needs: Improving setting and public input.Institute of Medicine of the National Academies, 1998.
The Burden of Musculoskeletal Diseases in the United States - Copyright © 2008 7
Burden of Musculoskeletal Diseases Overview Chapter 1

The Burden of Musculoskeletal Diseases in the United States - Copyright © 2008
Chapter 1 Burden of Musculoskeletal Diseases Overview
8
Section 1.5: Burden of Musculoskeletal Diseases Overview Data Tables
Table 1.1: National Institutes of Health (NIH) Funding, 2000-2006
National Institutes of Health (NIH) Organizations
Mean % of Total NIH Funding
2000-2006
NCI National Cancer Institute 17.5%
NIAID National Institute of Allergy and Infectious Diseases 12.6%
NHLBI National Heart, Lung, and Blood Institute 10.7%
NIGMS National Institute of General Medical Sciences 7.1%
NIDDK National Institute of Diabetes and Digestive and Kidney Diseases 6.6%
NINDS National Institute of Neurological Disorders and Stroke 5.5%
NIMH National Institute of Mental Health 5.1%
NICHD National Institute of Child Health and Human Development 4.6%
NCRR National Center for Research Resources 4.0%
NIA National Institute on Aging 3.7%
NIDA National Institute on Drug Abuse 3.7%
NIEHS National Institute of Environmental Health Sciences 2.6%
NEI National Eye Institute 2.4%
NIAMS National Institute of Arthritis and Musculoskeletal and Skin Diseases 1.9%
NHGRI National Human Genome Research Institute 1.8%
NIAAA National Institute on Alcohol Abuse and Alcoholism 1.6%
NIDCR National Institute of Dental and Craniofacial Research 1.4%
NIDCD National Institute on Deafness and Other Communication Disorders 1.4%
NLM National Library of Medicine 1.1%
NIBIB National Institute of Biomedical Imaging and Bioengineering 0.7%
NCMHD National Center on Minority Health and Health Disparities 0.6%
NINR National Institute of Nursing Research 0.5%
NCCAM National Center for Complementary and Alternative Medicine 0.4%
FIC John E. Fogarty International Center for Advanced Study in the Health Sciences 0.2%
ODOffice of the Director (includes Office of AIDS Research and Office of Research onWomen's Health) 1.2%
Total Funding (in 000s) $ 24,783,710
Source: NIH Almanac-Appropriations. Available at: h�p://www.nih.gov/about/almanac/appropriations/index.htm Accessed: October 15, 2007.
The Burden of Musculoskeletal Diseases in the United States - Copyright © 2008 9
Burden of Musculoskeletal Diseases Overview Chapter 1
Table 1.2: Prevalence and Age-Adjusted Rate of Self-Reported Select MedicalConditions by Age, United States 2005
Age-Adjusted Rate[5] Per 100 Total
Population
Prevalence Aged 18 & Over (in millions)
Medical Condition 18-44 45-64 65-74 75+ Total
Musculoskeletal [1] 41.949 41.486 12.265 11.969 107.668 48.30
Circulatory [2] 11.990 27.316 11.032 11.553 61.891 27.76
Respiratory [3] 23.452 19.882 52.920 3.964 52.590 23.59
Migraines or Severe Headaches 20.281 10.319 1.366 0.860 32.827 14.72
Blind or Trouble Seeing w/Glasses 6.073 8.105 2.434 3.644 20.255 9.09
Diabetes 2.640 7.596 3.421 2.529 16.186 7.26
Cancer [4] 2.430 5.961 3.518 4.086 15.995 7.18
Hearing Trouble w/Hearing Aid 0.627 1.326 1.323 3.352 6.628 2.97
Kidney Disease 0.931 1.305 0.675 0.880 3.791 1.70
Liver Disease 0.738 1.721 0.321 0.185 2.965 1.33
Proportion of Population in Age Group Reporting Condition
Medical Condition 18-44 45-64 65-74 75+ Total
Musculoskeletal [1] 38.0% 57.4% 66.5% 72.1% 49.4%
Circulatory [2] 10.9% 37.8% 59.8% 69.6% 28.4%
Respiratory [3] 21.2% 27.5% 28.7% 23.9% 24.1%
Migraines or Severe Headaches 18.4% 14.3% 7.4% 5.2% 15.1%
Blind or Trouble Seeing w/Glasses 5.5% 11.2% 13.2% 22.0% 9.3%
Diabetes 2.4% 10.5% 18.5% 15.2% 7.4%
Cancer [4] 2.2% 8.2% 19.1% 24.6% 7.3%
Hearing Trouble w/Hearing Aid 0.6% 1.8% 7.2% 20.2% 3.0%
Kidney Disease 0.8% 1.8% 3.7% 5.3% 1.7%
Liver Disease 0.7% 2.4% 1.7% 1.1% 1.4%
[1] Includes arthritis, chronic joint symptoms (more than 3 months in duration), pain in lower back or neck (more than 3 months duration)
[2] Includes coronary heart disease, angina pectoris, heart a�ack, stroke, chronic hypertension, heart disease
[3] Includes emphysema, chronic asthma, hay fever, sinusitis, chronic bronchitis
[4] Includes all types of cancer
[5] Age-adjusted by direct method to US Census population estimate for July 1, 2005
Source: National Center for Health Statistics, National Health Interview Survey, Adult Sample, 2005
The Burden of Musculoskeletal Diseases in the United States - Copyright © 2008
Chapter 1 Burden of Musculoskeletal Diseases Overview
10
Table 1.3: Prevalence of Self-Reported Select Medical Conditions byGender, United States 2005
Prevalence Age 18 & Over (in millions)
Medical Condition Male Female Total
Musculoskeletal [1] 48.402 59.266 107.668
Circulatory [2] 28.563 33.328 61.891
Respiratory [3] 20.351 32.239 52.590
Migraines or Severe Headaches 9.857 22.970 32.827
Blind or Trouble Seeing w/Glasses 8.074 12.181 20.255
Diabetes 7.896 8.290 16.186
Cancer [4] 6.778 9.217 15.995
Hearing Trouble w/Hearing Aid 3.885 2.743 6.628
Kidney Disease 1.736 2.055 3.791
Liver Disease 1.571 1.395 2.965
Proportion of Population by Sex Reporting Condition
Medical Condition Male Female Total
Musculoskeletal [1] 46.1% 52.5% 49.4%
Circulatory [2] 27.2% 29.5% 28.4%
Respiratory [3] 19.4% 28.6% 24.1%
Migraines or Severe Headaches 9.4% 20.4% 15.1%
Blind or Trouble Seeing w/Glasses 7.7% 10.8% 9.3%
Diabetes 7.5% 7.3% 7.4%
Cancer [4] 6.5% 8.2% 7.3%
Hearing Trouble w/Hearing Aid 3.7% 2.4% 3.0%
Kidney Disease 1.7% 1.8% 1.7%
Liver Disease 1.5% 1.2% 1.4%
[1] Includes arthritis, chronic joint symptoms (more than 3 months in duration), pain in lower back or neck (more than 3 monthsduration)
[2] Includes coronary heart disease, angina pectoris, heart a�ack, stroke, chronic hypertension, heart disease
[3] Includes emphysema, chronic asthma, hay fever, sinusitis, chronic bronchitis
[4] Includes all types of cancer
Source: National Center for Health Statistics, National Health Interview Survey, Adult Sample, 2005
The Burden of Musculoskeletal Diseases in the United States - Copyright © 2008 11
Burden of Musculoskeletal Diseases Overview Chapter 1
Table 1.4: Prevalence of Self-Report Selected Medical Conditions by Race, United States, 2005
Prevalence Age 18 & Over (in millions)
Medical Condition WhiteBlack/ African
American AsianOther or
Mixed Race Total
Musculoskeletal [1] 92.130 10.431 2.764 2.343 107.668
Circulatory [2] 51.271 7.961 1.547 1.112 61.891
Respiratory [3] 44.564 5.719 1.097 1.210 52.590
Migraines or Severe Headaches 27.461 3.621 0.864 0.880 32.827
Blind or Trouble Seeing w/Glasses 16.760 2.538 0.404 0.553 20.255
Diabetes 12.886 2.513 0.437 0.351 16.186
Cancer [4] 14.776 0.816 0.241 0.163 15.995
Hearing Trouble w/Hearing Aid 6.210 0.232 0.129 0.056 6.628
Kidney Disease 2.967 0.570 0.104 0.149 3.791
Liver Disease 2.484 0.314 0.081 0.086 2.965
Proportion of Population by Race Reporting Condition
Medical Condition WhiteBlack/ African
American AsianOther or
Mixed Race Total
Musculoskeletal [1] 51.0% 42.0% 33.9% 54.2% 49.4%
Circulatory [2] 28.4% 32.1% 19.0% 25.7% 28.4%
Respiratory [3] 24.7% 23.0% 13.5% 28.0% 24.1%
Migraines or Severe Headaches 15.2% 14.6% 10.6% 20.3% 15.1%
Blind or Trouble Seeing w/Glasses 9.3% 10.2% 5.0% 12.8% 9.3%
Diabetes 7.1% 10.1% 5.4% 8.1% 7.4%
Cancer [4] 8.2% 3.3% 3.0% 3.8% 7.3%
Hearing Trouble w/Hearing Aid 3.4% 0.9% 1.6% 1.3% 3.0%
Kidney Disease 1.6% 2.3% 1.3% 3.4% 1.7%
Liver Disease 1.4% 1.3% 1.0% 2.0% 1.4%
[1] Includes arthritis, chronic joint symptoms (more than 3 months in duration), pain in lower back or neck (more than 3 months duration)
[2] Includes coronary heart disease, angina pectoris, heart a�ack, stroke, chronic hypertension, heart disease
[3] Includes emphysema, chronic asthma, hay fever, sinusitis, chronic bronchitis
[4] Includes all types of cancer
Source: National Center for Health Statistics, National Health Interview Survey, Adult Sample, 2005

The Burden of Musculoskeletal Diseases in the United States - Copyright © 2008
Chapter 1 Burden of Musculoskeletal Diseases Overview
12
Table 1.5: Prevalence of Most Frequently Reported Medical Conditions by Age, United States 2005
Prevalence Age 18 & Over (in millions)Age-Adjusted
Rate [4] per 100 Total
PopulationMedical Condition 18-44 45-64 65-74 75+ TotalMusculoskeletal [1 2] 41.949 41.486 12.265 107.668 48.30
Chronic [2] Joint Pain 17.161 25.426 8.313 7.963 58.863 26.40 Arthritis 8.624 20.780 8.609 8.927 46.941 21.06 Neck Pain (Cervical Back Pain) 14.076 13.018 2.906 2.293 32.293 14.49 Lower Back Pain (Lumbar Back Pain) 27.632 22.784 5.906 5.64 61.965 27.79 Lower Back Pain Spreading Below Knee 7.007 9.030 2.267 2.042 20.346 9.13
Circulatory 11.990 27.316 11.032 61.891 27.76 Chronic Hypertension 8.067 22.521 9.127 9.044 48.759 21.87 Coronary or Heart Condition [3] 4.763 9.822 4.927 6.071 25.587 11.48 Stroke 0.401 1.558 1.144 2.063 5.165 2.32
Respiratory 23.452 19.882 52.920 52.590 23.59 Sinusitis 12.875 11.831 2.683 2.126 29.517 13.24 Hay Fever 8.566 7.750 1.438 0.897 18.651 8.37 Chronic [2] Asthma 7.746 5.281 1.600 1.07 15.697 7.04 Chronic [2] Bronchitis 3.504 3.544 1.026 0.838 8.912 4.00 Emphysema 0.341 1.430 1.070 0.951 3.791 1.70
Proportion of Population in Age Group Reporting ConditionMedical Condition 18-44 45-64 65-74 75+ TotalMusculoskeletal [1,2] 38.0% 57.4% 66.5% 72.1% 49.4%
Chronic [2] Joint Pain 15.5% 35.2% 45.1% 48.0% 27.0%Arthritis 7.8% 28.7% 46.7% 53.8% 21.6%Neck Pain (Cervical Back Pain) 12.7% 18.0% 15.8% 13.8% 14.8%Lower Back Pain (Lumbar Back Pain) 25.0% 31.5% 32.0% 34.0% 28.5%Lower Back Pain Spreading Below Knee 6.3% 12.5% 12.3% 12.3% 9.3%
Circulatory 10.9% 37.8% 59.8% 69.6% 28.4%Chronic Hypertension 7.3% 31.2% 49.5% 54.5% 22.4%Coronary or Heart Condition [3] 4.3% 13.6% 26.7% 36.6% 11.7%Stroke 0.4% 2.2% 6.2% 12.4% 2.4%
Respiratory 21.2% 27.5% 28.7% 23.9% 24.1%Sinusitis 11.7% 16.4% 14.5% 12.8% 13.6%Hay Fever 7.8% 10.7% 7.8% 5.4% 8.6%Chronic [2] Asthma 7.0% 7.3% 8.7% 6.4% 7.2%Chronic [2] Bronchitis 3.2% 4.9% 5.6% 5.0% 4.1%Emphysema 0.3% 2.0% 5.8% 5.7% 1.7%
[1] Specific conditions are not mutually exclusive in overall condition category
[2] Symptoms lasting 3 months or longer
[3] Includes heart a�ack, angina pectoris, and other heart disease
[4] Age-adjusted by direct method to US Census population estimate for July 1, 2005
Source: National Center for Health Statistics, National Health Interview Survey, Adult Sample, 2005

The Burden of Musculoskeletal Diseases in the United States - Copyright © 2008 13
Burden of Musculoskeletal Diseases Overview Chapter 1
Table 1.6: Prevalence of Most Frequently Reported Medical Conditions byGender, United States 2005
Prevalence Age 18 & Over (in millions)
Medical Condition Males Females Total Musculoskeletal [1,2] 48.402 59.266 107.668
Chronic [2] Joint Pain 25.967 32.896 58.863Arthritis 18.261 28.681 46.941Neck Pain (Cervical Back Pain) 13.022 19.271 32.293Lower Back Pain (Lumbar Back Pain) 27.502 34.463 61.965Lower Back Pain Spreading Below Knee 8.481 11.865 20.346
Circulatory 28.563 33.328 61.891Chronic Hypertension 22.171 26.588 48.758Coronary or Heart Condition [3] 12.538 13.049 25.587Stroke 2.239 2.926 5.165
Respiratory 20.351 32.239 52.590Sinusitis 10.170 19.346 29.517Hay Fever 7.983 10.668 18.651Chronic [2] Asthma 5.348 10.349 15.697Chronic [2] Bronchitis 2.886 6.026 8.912Emphysema 2.061 1.730 3.791
Proportion of Population by Sex Reporting ConditionMedical Condition Males Females Total Musculoskeletal [1,2] 46.1% 52.5% 49.4%
Chronic [2] Joint Pain 24.7% 29.1% 27.0%Arthritis 17.4% 25.4% 21.6%Neck Pain (Cervical Back Pain) 12.4% 17.1% 14.8%Lower Back Pain (Lumbar Back Pain) 26.2% 30.5% 28.5%Lower Back Pain Spreading Below Knee 8.1% 10.5% 9.3%
Circulatory 27.2% 29.5% 28.4%Chronic Hypertension 21.1% 23.6% 22.4%Coronary or Heart Condition [3] 12.0% 11.6% 11.7%Stroke 2.1% 2.6% 2.4%
Respiratory 19.4% 28.6% 24.1%Sinusitis 9.7% 17.1% 13.6%Hay Fever 7.6% 9.5% 8.6%Chronic [2] Asthma 5.1% 9.2% 7.2%Chronic [2] Bronchitis 2.8% 5.3% 4.1%Emphysema 2.0% 1.5% 1.7%
[1] Specific conditions are not mutually exclusive in overall condition category
[2] Symptoms lasting 3 months or longer
[3] Includes heart a�ack, angina pectoris, and other heart disease
Source: National Center for Health Statistics, National Health Interview Survey, Adult Sample, 2005
The Burden of Musculoskeletal Diseases in the United States - Copyright © 2008
Chapter 1 Burden of Musculoskeletal Diseases Overview
14
Table 1.7: Prevalence of Most Frequently Reported Medical Conditions by Race, United States 2005
Prevalence Age 18 & Over (in millions)
Medical Condition WhiteBlack/ African
American AsianOther or
Mixed Race TotalMusculoskeletal [1,2] 92.130 10.431 2.764 2.343 107.668
Chronic [2] Joint Pain 50.803 5.593 1.136 1.330 58.863Arthritis 40.351 4.718 0.868 1.004 46.941Neck Pain (Cervical Back Pain) 27.745 2.954 0.757 0.839 32.293Lower Back Pain (Lumbar Back Pain) 52.561 6.303 1.599 1.503 61.965Lower Back Pain Spreading Below Knee 17.031 2.308 0.467 0.540 20.346
Circulatory 51.271 7.961 1.547 1.112 61.891Chronic Hypertension 39.414 7.097 1.372 0.876 48.759Coronary or Heart Condition [3] 22.366 2.258 0.445 0.514 25.587Stroke 4.213 0.706 0.118 0.127 5.165
Respiratory 44.564 5.719 1.097 1.210 52.590Sinusitis 24.996 3.292 0.509 0.720 29.517Hay Fever 16.225 1.502 0.569 0.355 18.651Chronic [2] Asthma 12.895 2.048 0.337 0.416 15.697Chronic [2] Bronchitis 7.511 1.063 0.096 0.243 8.912Emphysema 3.503 0.180 0.024 0.084 3.791
Proportion of Population by Race Reporting Condition
Medical Condition WhiteBlack/ African
American AsianOther or
Mixed Race TotalMusculoskeletal [1,2] 51.0% 42.0% 33.9% 54.2% 49.4%
Chronic [2] Joint Pain 28.1% 22.5% 14.0% 30.8% 27.0%Arthritis 22.4% 19.0% 10.6% 23.2% 21.6%Neck Pain (Cervical Back Pain) 15.4% 11.9% 9.3% 19.4% 14.8%Lower Back Pain (Lumbar Back Pain) 29.1% 25.4% 19.6% 34.8% 28.5%Lower Back Pain Spreading Below Knee 9.4% 9.3% 5.7% 12.5% 9.3%
Circulatory 28.4% 32.1% 19.0% 25.7% 28.4%Chronic Hypertension 21.8% 28.6% 16.8% 20.3% 22.4%Coronary or Heart Condition [3] 12.4% 9.1% 5.5% 11.9% 11.7%Stroke 2.3% 2.8% 1.4% 2.9% 2.4%
Respiratory 24.7% 23.0% 13.5% 28.0% 24.1%Sinusitis 13.8% 13.3% 6.2% 16.6% 13.6%Hay Fever 9.0% 6.1% 7.0% 8.2% 8.6%Chronic [2] Asthma 7.1% 8.3% 4.1% 9.6% 7.2%Chronic [2] Bronchitis 4.2% 4.3% 1.2% 5.6% 4.1%Emphysema 1.9% 0.7% 0.3% 1.9% 1.7%
[1] Specific conditions are not mutually exclusive in overall condition category
[2] Symptoms lasting 3 months or longer
[3] Includes heart a�ack, angina pectoris, and other heart disease
Source: National Center for Health Statistics, National Health Interview Survey, Adult Sample, 2005
The Burden of Musculoskeletal Diseases in the United States - Copyright © 2008 15
Burden of Musculoskeletal Diseases Overview Chapter 1
Table 1.8: Prevalence of Chronic Joint Pain [1] by Joint by Age, United States 2005
Persons with Self-Reported Chronic Joint Condition (in 000s) % of Total w/Joint Pain18-44 45-64 65-74 75+ All Ages
Knee 11,064 15,411 5,111 4,666 36,252 61.6%
Shoulder 4,641 8,596 2,682 2,440 18,360 31.2%
Toes or Fingers 3,330 8,535 2,902 2,673 17,440 29.6%
Hip 2,980 6,462 2,395 2,369 14,207 24.1%
Ankle 3,742 5,184 1,526 1,335 11,787 20.0%
Wrist 3,330 4,879 1,462 1,208 10,878 18.5%
Elbow 2,951 4,904 1,211 857 9,924 16.9%
Other Joint 735 1,270 501 409 2,916 5.0%
All Chronic Joint 17,161 25,426 8,313 7,963 58,863
% of Age Group [2]w/Joint Pain 15.1% 34.9% 44.6% 43.9% 26.4%
[1] Symptoms lasting 3 months or longer
[2] Age-adjusted to July 1, 2005 U.S. Census population estimates
Source: National Center for Health Statistics, National Health Interview Survey, Adult Sample, 2005

The Burden of Musculoskeletal Diseases in the United States - Copyright © 2008
Chapter 1 Burden of Musculoskeletal Diseases Overview
16
Table 1.9: Self-Reported Impairment in Activities of Daily Living for Persons Due toSelect Medical Conditions by Age, United States 2005
Prevalence of Reported Impairment (in 000s)
Condition 1-17 18-44 45-64 65-74 75+Total Aged18 & Over
Musculoskeletal [1] 227 2,618 6,003 2,523 3,836 14,979
Circulatory [2] * 6,610 3,042 1,710 2,778 8,139
Depression/Anxiety/Emotional Problem [3] 743 1,238 1,604 180 268 3,290
Diabetes * 303 1,448 733 720 3,204
Respiratory (Lung Breathing Problem) 488 493 1,108 549 676 2,827
Nervous System [4]/Sensory Organ 95 865 1,096 354 373 2,689
Vision Problem 153 249 706 392 797 2,144
Hearing Problem 187 165 366 228 637 1,396
Cancer * 135 537 323 373 1,367
Birth Ddefect/MentalRetardation/Developmental 904 NA NA NA NA NA
Total All Conditions 5,270 6,512 11,160 4,662 7,175 29,059
% of Total 2005 U.S. Population
All Medical Conditions 7.2% 5.7% 15.3% 25.0% 39.5% 13.0%
Musculoskeletal Conditions 0.2% 2.3% 8.2% 13.5% 21.1% 6.7%
[1] Includes arthritis/rheumatism condition, back or neck problem, fracture/bone/joint injury, musculoskeletal/connective tissue condition, missing oramputated limb/finger/digit in 0-17 population defined as injury or bone/joint/muscle problem
[2] Includes heart or hypertension, stroke, circulation problem
[3] In 0-17 population, defined as emotional/behavioral problem
[4] In 0-17 population, defined as epilepsy/seizures
* Reported number does not meet sample size reliability
Source: National Center for Health Statistics, National Health Interview Survey, Person Sample, 2005

The Burden of Musculoskeletal Diseases in the United States - Copyright © 2008 17
Burden of Musculoskeletal Diseases Overview Chapter 1
Table 1.10: Self-Reported Impairment in Activities of Daily Living for Persons Aged 18and Over Due to Select Medical Conditions by Gender, United States 2005
Prevalence of Reported Impairment for Persons Age 18 and Over (in 000s)
Males Females Total
Condition Prevalence % of Total Prevalence % of Total Prevalence
Musculoskeletal [1] 5,692 38.0% 9,287 62.0% 14,979
Circulatory 3,768 46.3% 4,371 53.7% 8,139
Depression/Anxiety/Emotional Problem 1,324 40.2% 1,966 59.8% 3,290
Diabetes 1,318 41.1% 1,886 58.9% 3,204
Respiratory 1,213 42.9% 1,614 57.1% 2,827
Nervous System/Sensory Organ 1,065 39.6% 1,624 60.4% 2,689
Vision Problem 887 41.4% 1,257 58.6% 2,144
Hearing Problem 721 51.6% 674 48.3% 1,396
Cancer 657 48.1% 710 51.9% 1,367
[1] Includes arthritis/rheumatism condition, back or neck problem, fracture/bone/joint injury, musculoskeletal/connective tissue condition, missing oramputated limb/finger/digit
Source: National Center for Health Statistics, National Health Interview Survey, Person Sample, 2005
Table 1.11: Self-Reported Impairment in Activities of Daily Living for Persons Aged 18and Over Due to Select Medical Conditions by Race, United States 2005
Prevalence of Reported Impairment for Persons Age 18 and Over (in 000s)
WhiteBlack/ African
American AsianOther or
Mixed Race
TotalPrevalenceCondition Prevalence
% of Total Prevalence
% of Total Prevalence
% of Total Prevalence
% of Total
Musculoskeletal [1] 12,606 7.0% 1,757 7.0% 277 3.0% 338 8.1% 14,979
Circulatory 6,632 3.7% 1,162 4.8% 190 2.2% 155 4.0% 8,139
Depression/Anxiety/Emotional Problem 2,726 1.5% 384 1.5% 56 0.6% 124 3.0% 3,290
Diabetes 2,472 1.4% 562 2.3% 93 1.0% 77 1.8% 3,204
Respiratory 2,373 1.3% 352 1.4% 22 0.2% 80 1.9% 2,827
Nervous System/Sensory Organ 2,239 1.2% 337 1.4% 44 0.5% 70 1.7% 2,689
Vision Problem 1,774 1.0% 266 1.1% 55 0.6% 49 1.2% 2,144
Hearing Problem 1,198 0.7% 112 0.4% 44 0.5% 43 1.0% 1,396
Cancer 1,182 0.7% 149 0.6% 19 0.2% 17 0.4% 1,367
[1] Includes arthritis/rheumatism condition, back or neck problem, fracture/bone/joint injury, musculoskeletal/connective tissue condition, missing oramputated limb/finger/digit
Source: National Center for Health Statistics, National Health Interview Survey, Person Sample, 2005

The Burden of Musculoskeletal Diseases in the United States - Copyright © 2008
Chapter 1 Burden of Musculoskeletal Diseases Overview
18
Table 1.12: Lost Work Days from Self-Reported Select Medical Conditions for PersonsAged 18 and Over, United States 2005
Condition
Total # w/Condition
(in 000s)
% U. S. PopulationReporting Lost Work
Days as a Result ofMedical Condition
Total #Reporting Lost Work
Days (in 000s)
Total WorkDays Lost
(in 000s)
Average WorkDays Lost per
Condition
All Conditions [1] 152,543 31.3% 68,222 652,984 9.6
Musculoskeletal 107,668 16.4% 35,655 437,593 12.3
Circulatory 31,190 7.1% 15,461 236,158 15.3
Respiratory 52,589 9.0% 19,617 216,040 11.0
Musculoskeletal Conditions
Chronic [2] Joint Pain 58,863 8.2% 17,948 263,647 14.7
Arthritis 46,941 5.6% 12,191 211,516 17.4
Neck Pain (Cervical Back Pain) 32,294 5.4% 11,805 167,757 14.2
Lower Back Pain (Lumbar Back Pain) 61,965 9.9% 21,657 288,789 13.3
Lower Back Pain Spreading Below Knee 20,346 2.9% 6,230 135,922 21.8
Circulatory
Chronic [2] Hypertension 24,207 5.4% 11,723 175,845 15.0
Coronary or Heart Condition [3] 25,583 2.7% 5,854 104,992 17.9
Stroke 5,166 0.2% 533 16,057 30.1
Respiratory
Sinusitis 59,517 5.5% 12,011 143,017 11.9
Hay Fever 18,651 3.4% 7,403 82,704 11.2
Chronic [2] Asthma 15,697 2.6% 5,595 69,752 12.5
Chronic [2] Bronchitis 8,912 1.5% 3,177 55,984 17.6
Emphysema 3,791 0.2% 435 9,864 22.7
Migraines/Severe Headaches 32,826 6.6% 14,302 181,283 12.7
Cancer 15,995 1.6% 3,420 77,287 22.6
[1] Reported ”Yes” to at least one of the 23 medical conditions (70% of the weighted population). Multiple conditions resulting in lost work days possible.
[2] Symptoms lasting 3 months or longer OR 2 or more physician visits
[3] Includes heart a�ack, angina pectoris, and other heart disease
Source: National Center for Health Statistics, National Health Interview Survey, Adult Sample Level File, 2005

The Burden of Musculoskeletal Diseases in the United States - Copyright © 2008 19
Burden of Musculoskeletal Diseases Overview Chapter 1
Table 1.13: Bed Days from Self-Reported Select Medical Conditions for Persons Aged 18and Over, United States 2005
Condition
% U.S. PopulationReporting Bed Days
as a Result ofMedical Condition
Total # Reporting Bed Days
Total Bed Days
(in 000s)
Average Bed Days per
Condition All Conditions [1] 35.0% 76,170 1,001,761 13.2 Musculoskeletal 20.9% 20,492 810,366 39.5 Circulatory 11.3% 24,596 525,267 21.4 Respiratory 11.5% 25,039 450,594 18.0
Musculoskeletal ConditionsChronic [2] Joint Pain 12.0% 26,120 587,049 22.5 Arthritis 9.4% 20,492 510,573 24.9 Neck Pain (Cervical Back Pain) 7.4% 16,105 420,628 26.1 Lower Back Pain (Lumbar Back Pain) 13.3% 28,966 622,283 21.5 Lower Back Pain Spreading Below Knee 5.1% 11,074 525,267 47.4
CirculatoryChronic [2] Hypertension 8.6% 18,767 414,510 22.1 Coronary or Heart Condition [3] 5.4% 11,824 306,294 25.9 Stroke 1.1% 2,472 109,606 44.3
RespiratorySinusitis 6.8% 14,779 286,716 19.4 Hay Fever 3.9% 8,531 153,153 18.0 Chronic [2] Asthma 3.7% 8,099 181,761 22.4 Chronic [2] Bronchitis 2.4% 5,181 142,190 27.4 Emphysema 0.9% 1,909 85,571 44.8
Migraines/Severe Headaches 8.5% 18,415 386,144 21.0 Cancer 2.9% 6,408 187,650 29.3
[1] Reported "Yes" to at least one of the 23 medical conditions (70% of the weighted population). Multiple conditions resulting in bed days possible.
[2] Symptoms lasting 3 months or longer OR 2 or more physician visits
[3] Includes heart a�ack, angina pectoris, and other heart disease
Source: National Center for Health Statistics, National Health Interview Survey, Adult Sample Level File, 2005

Lumbar/low back pain and cervical/neck pain areamong the most common physical conditionsrequiring medical care and affecting anindividual’s ability to work and manage the dailyactivities of life. Back pain is also the mostcommon physical condition for which patientsvisit their doctor. In a given year, between 12%and 15% of the United States population will visittheir physician with a complaint of back pain.Over the past 7 years, this rate has shown a slow,but steady, increase. In 2004, more than 44.6million patients visited a physician with acomplaint of back pain.
Joint pain, also called musculoskeletal pain, frommild strains to severe disabling conditions, affectsmany. In the United States, two major annualhealth care surveys are conducted by the NationalCenter for Health Statistics to identify theincidence and prevalence of select healthconditions. One of the conditions included isreferred to as “joint pain.” In reality it is not painarising from a joint, but rather a musculoskeletalpain in a defined body area. Joint pain is amongthe most frequently reported conditions in bothsurveys.
Back pain, including cervical/neck pain andlumbar/low back pain, is more common thansevere headaches or allergies resulting from hayfever or sinus conditions. In recent years, between43%1 and 60%2 of adult persons in the UnitedStates reported experiencing neck or low backpain in the previous 3 months, while severeheadache or migraine was reported by 15%. Hayfever or sinusitis was reported by 9% and 14%,respectively, in a previous 12-month period. Backpain is also reported more frequently than othermusculoskeletal pain, including pain in the arm,shoulder, hip, or knee. Low back pain prevalenceincreases with age, while neck pain tends to peakin the 45 to 64 age range.
Eleven percent (11%) of the population aged 18 orolder report they have a physical, mental, oremotional problem or illness that precludes work;20% of persons with either low back or neck painreport they cannot work, while 33% of personswith multiple back pain sites are unable to work.Back pain also greatly limits the type andduration of work a person can do. Three of fourpersons with multiple back pain sites report worklimitations.
Estimated annual direct medical costs for allspine related conditions for the years 2002-2004were $193.9 billion, with $30.3 billion estimated asthe incremental cost directly related to spine pain.(Chapter 9: Health Care Utilization and EconomicCost of Musculoskeletal Diseases.) In addition,annual indirect costs of $14.0 billion in lost wageswere incurred as a result of spine disorders.
Back pain often results from complex conditionsthat are not easily understood. Many areprobably related to degeneration, but the actualunderlying cause of a back pain episode is oftenuncertain. Thus, in reviewing administrative datasets for prevalence of conditions, it is important torealize that diagnostic categories may beinaccurate, reflecting the probable diagnosisrather than the definitive diagnosis.
Section 2.1: Low Back and Joint Pain
In 2004, between 30% and 40% of people in theUnited States report they experienced low backpain in a previous 3 month period in the two self-reported health conditon national health surveys.(Tables 2.1 and 2.2 and Graph 2.1.1) Among thosepersons reporting low back pain, approximately25% also experienced pain radiating into the leg.An additional 15% to 20% of persons reportedexperiencing neck pain. Overall, about one in two
Chapter 2
Spine: Low Back and Neck Pain
The Burden of Musculoskeletal Diseases in the United States - Copyright © 2008 21

persons report experiencing back pain at leastonce a year. This is a greater rate of pain than isreported for hips, knees, legs, shoulders, and theupper limb (arm, elbow, wrist, and hands).Approximately one-half of all persons reportingjoint pain experience it in more than one site. Thisis true for persons reporting back pain and forpersons reporting joint pain other than back pain.The most frequently reported single site of jointpain is in the lower back.
Back pain is reported in similar rates byfemales and males. The rates are also similarin all age groups over the age of 18 (Graphs2.1.2 and 2.1.3) and in all racial groups.(Tables 2.3 and 2.4) Back pain is notselective, but is a major health concern forpersons of all ages and ethnic backgroundsin the United States. On average, nearly 5%of all annual health care visits to physicians,emergency departments, outpatient clinics,as well as hospitalizations are for treatmentof back pain.
The epidemiology of low back pain is notwell understood and the overall prevalence,as supported by health care assessmentdatabases, remains unclear. In 2005, 40.5
million patient visits to hospitals and physicianoffices had low back pain as the first diagnosis.More than 3 out of 4 visits were to a physician’soffice, but 4% entailed hospitalization. (Tables 2.5and 2.5a and Graph 2.1.4) The two majordiagnostic categories in patients with low backpain are disc degeneration and “back injury.”
The most common diagnosis in patients with lowback pain is disc degeneration. Until recently,degenerative back pain was thought to beprimarily the result of use or wear and tear.Recent studies, however, have shown a stronggenetic link.3 Intervertebral disc degeneration is acommon and natural process of the human spine.Degeneration occurs gradually with aging and
Graph 2.1.1: Prevalence of Self-Reported Joint Pain by Site forPersons Aged 18 and Over in Two National Health Surveys, United States 1999-2005
[1] Source: National Center for Health Statistics, NationalHealth and Nutrition Examination Survey Data, 1999-2004[2] Source: National Center for Health Statistics, NationalHealth Interview Survey, Adult Sample, 2005
Graph 2.1.2: Distribution of Back Pain by Site for PersonsAged 18 and Over, United States 1999-2004
Source: National Center for Health Statistics, National Health and NutritionExamination Survey, 1999-2004
Graph 2.1.3: Distribution of Joint Pain Other than BackPain by Site for Persons Aged 18 and Over, United States1999-2004
Source: National Center for Health Statistics, National Health and NutritionExamination Survey, 1999-2004
Graph 2.1.4: Distribution of Health Care Visits for LowBack Pain, United States 2004
[1] Source: Agency for Healthcare Research and Quality, Healthcare Cost andUtilization Project, Nationwide Inpatient Sample, 2004[2] Source: National Center for Health Statistics, National HospitalAmbulatory Medical Care Survey, Hospital Emergency, 2004[3] Source: National Center for Health Statistics, National HospitalAmbulatory Medical Care Survey, Outpatient, 2004[4] Source: National Center for Health Statistics, National AmbulatoryMedical Care Survey, 2004
22
Chapter 2 Spine: Low Back and Neck Pain
The Burden of Musculoskeletal Diseases in the United States - Copyright © 2008

can alter the biomechanics and function of thespine. Although these changes go unnoticed inmany persons, in others they manifest in backpain and sometimes even neurologicalcompromise.
In this discussion we are dividing the diagnosticcodes into three groups: back disorders, discdisorders, and back injuries. This approach waschosen to allow comparison to earlier editions ofthis text. Back disorders include inflammatoryspine conditions, spondylosis, spinal stenosis,lumbago, sciatica, backache, and disorders of thesacrum (ICD-9-CM codes 720, 721, and 724). Disc
disorders include herniations, disc degeneration,and post laminectomy syndromes (ICD-9-CMcode 722). Back injuries include fractures,dislocation, and sprains (ICD-9-CM codes 805,806, 839, 846, and 847). This division, while usefulin analyzing the databases, may not alwaysaccurately reflect the primary diagnosis. Furtherthere is some overlap. For example, a patient withback pain of unknown origin could be given adiagnosis of lumbago, placing him or her in theback disorder category; a diagnosis of discdegeneration, falling into the disc disordercategory; or a diagnosis of back strain, falling into
the back injury category. Unfortunately, databasesdo not permit diagnostic verification, andsometimes a diagnosis is provided primarily forreimbursement purposes.
Back disorders accounted for 65% of 2004 lowback pain health care resource visits. Bothphysician office visits and outpatient hospitalvisits in 2004 were predominantly for backdisorders, and 62% of hospitalizations were forback disorders. (Table 2.5a and Graph 2.1.5)
Disc disorders, which include disc displacement(herniation) and degeneration, accounted forabout one-half (17%) of the remaining low backpain resource visits. Disc disorders comprised27% of the hospitalizations in 2004, but only 2%of emergency room visits.
Back injury, which includes fractures, sprains,and strains, often reported as caused by over-exertion or overuse, accounted for the remaining18% of 2004 low back pain resource visits. Backinjuries accounted for 27% of emergency roomvisits in 2004, but only 11% of hospitalizations.
The incidence of low back pain is greatest inpersons of young adult and middle age. In 2004,74% of all health care visits for low back painwere made by persons between the ages of 18 and64. (Table 2.5 and Graph 2.1.6) Low back pain inthis group is often accompanied by reducedability to work or inability to work at all. Thesocioeconomic impact of low back pain, includingboth direct and indirect costs of health care and
[1] Source: Agency for Healthcare Research andQuality, Healthcare Cost and Utilization Project,Nationwide Inpatient Sample, 2004[2] Source: National Center for Health Statistics,National Hospital Ambulatory Medical CareSurvey, Hospital Emergency, 2004[3] Source: National Center for Health Statistics,National Hospital Ambulatory Medical CareSurvey, Outpatient, 2004[4] Source: National Center for Health Statistics,National Ambulatory Medical Care Survey, 2004
Graph 2.1.5: Distribution of Health Care Resource Use forLow Back Pain by Type of Diagnosis, United States, 2004
Graph 2.1.6: Distribution of Low Back Pain Health Care Resource Visits by Age, United States 2004
Sources: Agency for Healthcare Research and Quality, Healthcare Cost andUtilization Project, Nationwide Inpatient Sample, 2004; National Center forHealth Statistics, National Hospital Ambulatory Medical Care Survey,Hospital Emergency, 2004; National Center for Health Statistics, NationalHospital Ambulatory Medical Care Survey, Outpatient, 2004; NationalCenter for Health Statistics, National Ambulatory Medical Care Survey, 2004
Spine: Low Back and Neck Pain Chapter 2
23The Burden of Musculoskeletal Diseases in the United States - Copyright © 2008

disability attendant to the disorder, has beenestimated to exceed $100 billion each year.4
Back disorders are found more frequently amongpersons aged 75 and over than in any other agegroup, accounting for 81% of health care visits inthis age group in 2004. (Table 2.5a and Graph2.1.7) This is probably a reflection of theprevalence of spinal stenosis in elderly patients.Among the small percentage of persons with lowback pain who are younger than 18, backdisorders represented 76% of their visits; the
balance of visits for low back pain among theyoung were due to back injuries. Disc herniationsand disc degeneration are rare in this age group.Lumbar back injuries accounted for 28% of thehealth care visits among persons aged 18 to 44,the highest proportion of all age groups. Discdisorders were seen most frequently amongpersons aged 45 to 74, accounting for 20% of 2004health care visits for low back pain in that agegroup.
The average age of persons hospitalized in 2004for low back pain was 59.8 years. This comparesto an average age of 42.0 years for persons
visiting an emergency department, 48.1 years forvisits to an outpatient department, and 51.7 yearsfor visits to a physician. (Table 2.5)
Persons hospitalized for low back pain in 2004spent an average of 4½ days in the hospital.(Table 2.8 and Graph 2.1.8) Persons hospitalized
for lumbar back injuries were hospitalized for thelongest period of time, an average of more thanseven days.
Low back pain is found more frequently amongfemales than males, with females representing56% of the 2004 health care visits. Males wereseen more often for low back injuries (19% ofvisits) and disc disorders (22%) than werefemales; 70% of the female visits for low backpain were diagnosed as back disorders. Again,this is probably a reflection of the prevalence ofspinal stenosis. (Table 2.5 and Graph 2.1.9)
Overall, lumbar/low back pain accounted for 1 in25 health care resource visits in 2004. Thestaggering impact of low back pain on both thehealth care resources in the United States and thedisability inflicted on the individual is difficult tofully quantify.
Graph 2.1.7: Distribution of Health Care Resource Usefor Low Back Pain by Type and Age, United States 2004
Sources: Agency for Healthcare Research and Quality, Healthcare Cost andUtilization Project, Nationwide Inpatient Sample, 2004; National Center forHealth Statistics, National Hospital Ambulatory Medical Care Survey,Hospital Emergency, 2004; National Center for Health Statistics, NationalHospital Ambulatory Medical Care Survey, Outpatient, 2004; National Centerfor Health Statistics, National Ambulatory Medical Care Survey, 2004
Graph 2.1.8: Average Length of Hospital Stay for LumbarSpine Diagnosis, United States 2004
[1] Source: Agency for Healthcare Research and Quality, Healthcare Cost andUtilization Project, Nationwide Inpatient Sample, 2004[2] Source: National Center for Health Statistics, National Hospital DischargeSurvey, 2004
24
Chapter 2 Spine: Low Back and Neck Pain
The Burden of Musculoskeletal Diseases in the United States - Copyright © 2008

Section 2.2: Cervical/Neck Pain
Cervical/neck pain is a very common reason forvisiting a doctor. In 2004, 16.4 million patientvisits, or 1.5% of all health care visits to hospitalsand physician offices, were for neck pain. Fourout of five (80%) of the visits were to physicianoffices, while only 3% of patients withcervical/neck pain were hospitalized. (Table 2.6aand Graph 2.2.1)
In presenting health care resource utilization forcervical pain, three categories of cervical pain areaddressed. One is labeled cervical disc disorders,and includes disc displacements, herniations, anddisc degeneration (ICD-9-CM code 722). A secondgroup is cervical injuries, and includes sprains,strains, and fractures (ICD-9-CM codes 805, 806,839, and 847). A third group, referred to ascervical disorders, includes pain caused by otherdisease entities, including cervical spondylosisand stenosis (ICD-9-CM codes 721 and 723).
Cervical disorders accounted for 59% of healthcare visits for upper back pain in 2004. (Table2.6a) Patients with cervical disorders are treatedprimarily in outpatient settings, accounting for67% of cervical pain patient visits in hospital
outpatient settings and 63% of physicians officevisits.
Cervical disc disorders accounted for only 11% ofall neck pain health care visits in 2004, but wereresponsible for 31% of hospitalizations. (Table2.6a and Graph 2.2.2) Neck injuries accounted for30% of all neck pain. This is a much higherpercentage than found in low back pain injuries.The majority of patients with cervical injurieswere treated in an outpatient setting, andaccounted for 69% of all emergency departmentvisits for cervical/ neck pain.
Graph 2.1.9: Distribution of Health Care Resource Use forLow Back Pain by Type and Gender, United States 2004
Sources: Agency for Healthcare Research and Quality, Healthcare Cost andUtilization Project, Nationwide Inpatient Sample, 2004; National Center forHealth Statistics, National Hospital Ambulatory Medical Care Survey,Hospital Emergency, 2004; National Center for Health Statistics, NationalHospital Ambulatory Medical Care Survey, Outpatient, 2004; National Centerfor Health Statistics, National Ambulatory Medical Care Survey, 2004
Graph 2.2.1: Distribution of Health Care Visits forCervical/Neck Pain, United States 2004
[1] Source: Agency for Healthcare Research and Quality, Healthcare Cost andUtilization Project, Nationwide Inpatient Sample, 2004[2] Source: National Center for Health Statistics, National HospitalAmbulatory Medical Care Survey, Hospital Emergency, 2004[3] Source: National Center for Health Statistics, National HospitalAmbulatory Medical Care Survey, Outpatient, 2004[4] Source: National Center for Health Statistics, National AmbulatoryMedical Care Survey, 2004
Graph 2.2.2: Distribution of Health Care Resource Use forCervical/Neck Pain by Diagnosis Type, United States,2004
[1] Source: Agency for Healthcare Research and Quality, Healthcare Cost andUtilization Project, Nationwide Inpatient Sample, 2004[2] Source: National Center for Health Statistics, National HospitalAmbulatory Medical Care Survey, Hospital Emergency, 2004[3] Source: National Center for Health Statistics, National HospitalAmbulatory Medical Care Survey, Outpatient, 2004[4] Source: National Center for Health Statistics, National AmbulatoryMedical Care Survey, 2004
Spine: Low Back and Neck Pain Chapter 2
25The Burden of Musculoskeletal Diseases in the United States - Copyright © 2008
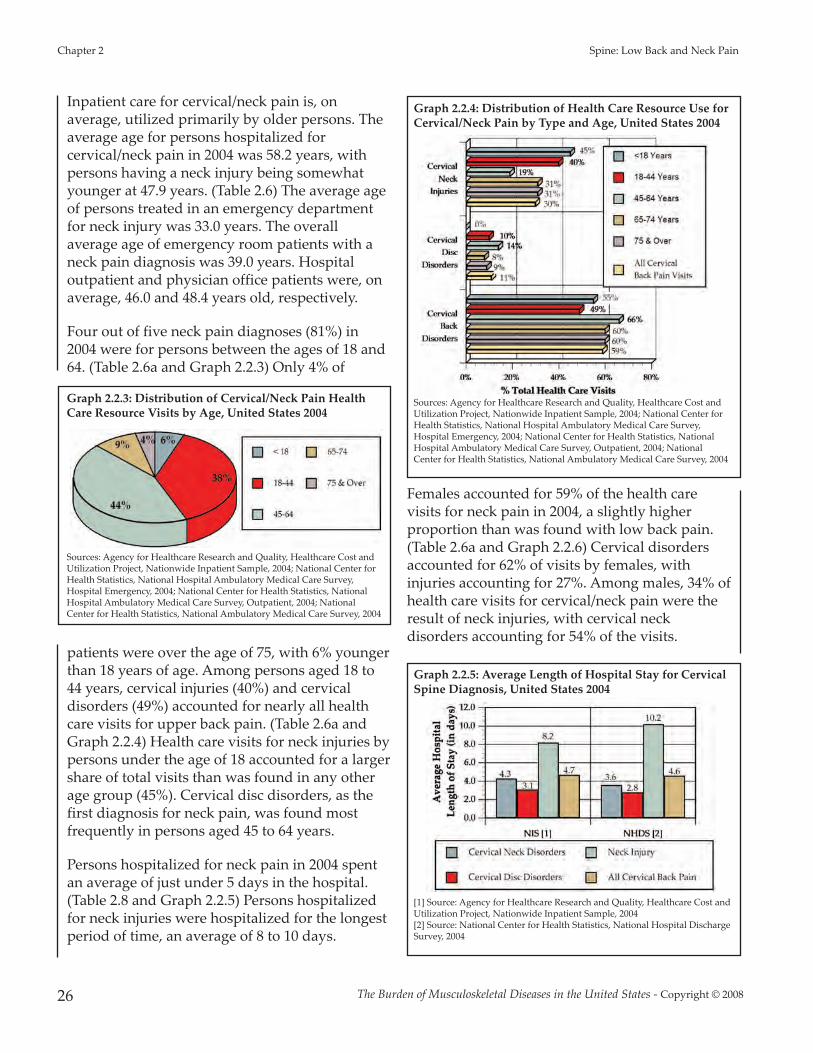
Inpatient care for cervical/neck pain is, onaverage, utilized primarily by older persons. Theaverage age for persons hospitalized forcervical/neck pain in 2004 was 58.2 years, withpersons having a neck injury being somewhatyounger at 47.9 years. (Table 2.6) The average ageof persons treated in an emergency departmentfor neck injury was 33.0 years. The overallaverage age of emergency room patients with aneck pain diagnosis was 39.0 years. Hospitaloutpatient and physician office patients were, onaverage, 46.0 and 48.4 years old, respectively.
Four out of five neck pain diagnoses (81%) in2004 were for persons between the ages of 18 and64. (Table 2.6a and Graph 2.2.3) Only 4% of
patients were over the age of 75, with 6% youngerthan 18 years of age. Among persons aged 18 to44 years, cervical injuries (40%) and cervicaldisorders (49%) accounted for nearly all healthcare visits for upper back pain. (Table 2.6a andGraph 2.2.4) Health care visits for neck injuries bypersons under the age of 18 accounted for a largershare of total visits than was found in any otherage group (45%). Cervical disc disorders, as thefirst diagnosis for neck pain, was found mostfrequently in persons aged 45 to 64 years.
Persons hospitalized for neck pain in 2004 spentan average of just under 5 days in the hospital.(Table 2.8 and Graph 2.2.5) Persons hospitalizedfor neck injuries were hospitalized for the longestperiod of time, an average of 8 to 10 days.
Females accounted for 59% of the health carevisits for neck pain in 2004, a slightly higherproportion than was found with low back pain.(Table 2.6a and Graph 2.2.6) Cervical disordersaccounted for 62% of visits by females, withinjuries accounting for 27%. Among males, 34% ofhealth care visits for cervical/neck pain were theresult of neck injuries, with cervical neckdisorders accounting for 54% of the visits.
Graph 2.2.3: Distribution of Cervical/Neck Pain HealthCare Resource Visits by Age, United States 2004
Sources: Agency for Healthcare Research and Quality, Healthcare Cost andUtilization Project, Nationwide Inpatient Sample, 2004; National Center forHealth Statistics, National Hospital Ambulatory Medical Care Survey,Hospital Emergency, 2004; National Center for Health Statistics, NationalHospital Ambulatory Medical Care Survey, Outpatient, 2004; NationalCenter for Health Statistics, National Ambulatory Medical Care Survey, 2004
Graph 2.2.4: Distribution of Health Care Resource Use forCervical/Neck Pain by Type and Age, United States 2004
Sources: Agency for Healthcare Research and Quality, Healthcare Cost andUtilization Project, Nationwide Inpatient Sample, 2004; National Center forHealth Statistics, National Hospital Ambulatory Medical Care Survey,Hospital Emergency, 2004; National Center for Health Statistics, NationalHospital Ambulatory Medical Care Survey, Outpatient, 2004; NationalCenter for Health Statistics, National Ambulatory Medical Care Survey, 2004
Graph 2.2.5: Average Length of Hospital Stay for CervicalSpine Diagnosis, United States 2004
[1] Source: Agency for Healthcare Research and Quality, Healthcare Cost andUtilization Project, Nationwide Inpatient Sample, 2004[2] Source: National Center for Health Statistics, National Hospital DischargeSurvey, 2004
26
Chapter 2 Spine: Low Back and Neck Pain
The Burden of Musculoskeletal Diseases in the United States - Copyright © 2008

Section 2.3: Burden of Back Pain
While lumbar/low back pain is more commonthan cervical/neck pain, together they accountedfor 5%, or 1 in 20, health care visits in 2004.(Tablas 2.7 and 2.7a and Graph 2.3.1) The majorityof visits (78%) were physician office visits. Overthe past 7 years, physician office visits for backpain have increased steadily. In 1998, 12% of thepopulation aged 18 and over visited a physicianfor back pain, accounting for 32 million visits. In2004, the proportion of the population visitingtheir physician for back pain had increased tomore than 15%, and the total number of visitsincreased to nearly 45 million. (Table 2.9 andGraph 2.3.2)
The financial cost associated with back pain isobviously enormous and unfortunately rising.Greater understanding of the causes of back painand its resultant disability is needed to thwartand reduce this rising trend. Understanding whydisc degeneration causes pain in some yet not inothers is needed to address the burden of painand disability and the significant economicimpact low back pain treatment creates on healthcare resources each year.
Section 2.3.1: Limitations Resulting fromBack Pain
More than one in ten persons (11%) over the ageof 18 in the United States report health careproblems limit their ability to work, and one inthree (32%) report their health limits the amountor type of work they can perform. An additional8% of the population report that their ability towalk is impacted by their health. Pain is a majorcause of these limitations. Back pain is cited morefrequently than any other pain entity (e.g., head,shoulder, leg, foot) by persons reporting work orwalking limitations. (Table 2.10 and Graph 2.3.3)
Graph 2.2.6: Distribution of Health Care Resource Use forCervical/Neck Pain by Type and Gender, United States2004
Sources: Agency for Healthcare Research and Quality, Healthcare Cost andUtilization Project, Nationwide Inpatient Sample, 2004; National Center forHealth Statistics, National Hospital Ambulatory Medical Care Survey,Hospital Emergency, 2004; National Center for Health Statistics, NationalHospital Ambulatory Medical Care Survey, Outpatient, 2004; National Centerfor Health Statistics, National Ambulatory Medical Care Survey, 2004
Graph 2.3.1: Spine Diagnosis Visits as a Proportion of AllHealth Care Visits, United States 2004
[1] Source: Agency for Healthcare Research and Quality, Healthcare Cost andUtilization Project, Nationwide Inpatient Sample, 2004[2] Source: National Center for Health Statistics, National HospitalAmbulatory Medical Care Survey, Hospital Emergency, 2004[3] Source: National Center for Health Statistics, National HospitalAmbulatory Medical Care Survey, Outpatient, 2004[4] Source: National Center for Health Statistics, National AmbulatoryMedical Care Survey, 2004
Graph 2.3.2: Trend in Number and Proportion of thePopulation with Physician Visits for Back Pain, United States 1998-2004
Source: National Center for HealthStatistics, National Ambulatory MedicalCare Survey, 1998-2004
Spine: Low Back and Neck Pain Chapter 2
27The Burden of Musculoskeletal Diseases in the United States - Copyright © 2008

Between 1999 and 2004, an average of 62% ofthe population who reported work orwalking limitations also reported they hadlow back pain. During this same time period,38% to 41% reported they had neck pain.Low back pain was reported nearly twice asoften as headaches or lower limb joint pain(hip, leg, foot) as the cause of work orwalking limitations.
Work limitations due to back pain arereported in similar proportion by males andfemales. The presence of back pain in morethan one site (e.g., low back, upper back,buttocks, neck, and spine) is more likely tobe the cause of work limitations than backpain that is localized.
Back pain severe enough to keep peoplefrom working at any occupation is mostlikely to be reported by individuals aged 65to 74, and may be the cause of involuntaryearly retirement. However, individuals in theprime working ages of 45 to 64 frequentlyreport back pain as the cause of theirinability to work at all; they also report thatthe pain places limitations on the amount ortype of work they can do in nearly the sameproportion as those aged 65 and older.Overall, 14% of the population aged 45 to 64
report they cannot work at all due to healthlimitations; among this group, 24% to 43% reportback pain as the cause. This compares to only10% of persons in this age group with total workrestrictions who report they have no back pain.Among the 32% of the population reportinglimitations in the amount or type of work theycan perform, the differences are even greater.Between 55% and 84% report back pain, whileonly 29% of those with no back pain report workrestrictions. (Table 2.11 and Graphs 2.3.4a-b)
In another national study, bed days and lost workdays were reported for persons self-reportingback pain in the previous 3 months. Of the total144.1 million persons reporting back pain,approximately one in four (33.7 million) reportedthey spent one or more days in bed due to back
Graph 2.3.3: Proportion of Persons Aged 18 and OverReporting Pain Limits Ability to Walk or Work by PainSite, United States 1999-2004
Source: National Center for HealthStatistics, National Health andNutrition Examination Survey Data,1999-2004
Graph 2.3.4a: Proportion of Persons Aged 18 or Older with WorkHistory for Whom Pain Limits Their Ability to Work by Age,United States 1999-2004
Source: National Center for Health Statistics, National Health and NutritionExamination Survey Data, 1999-2004
Graph 2.3.4b: Proportion of Persons Aged 18 or Older with WorkHistory for Whom Pain Limits the Amount of Work They CanPerform by Age, United States 1999-2004
Source: National Center for Health Statistics, National Health and NutritionExamination Survey Data, 1999-2004
28
Chapter 2 Spine: Low Back and Neck Pain
The Burden of Musculoskeletal Diseases in the United States - Copyright © 2008

pain. With an average of 9.3 days bed daysreported, persons in the United States spent atotal of 313.5 million days in bed due to back painin 2004. In addition, 25.9 million personsreporting back pain also reported losing anaverage of 7.2 work days. (Table 2.12 and Graphs2.3.5a-b) Hence, in 2004, an estimated 186.7million work days were lost due to back pain.
The most severe pain, resulting in the highestaverage number of bed and lost work days, wasreported by persons with low back pain andradiating leg pain. This group of 20.3 millionpersons spent an average of 19.9 days in bed andlost an average of 12.9 work days. They probably
include most patients with disc herniation andsymptomatic spinal stenosis. In all instances,females reported higher levels of back pain andmore bed and lost work days than did males.
Section 2.4: Spine Procedures
While nonsurgical treatment for back pain is thetreatment of choice, when back pain becomes sodisabling that patients can no longer function inthe activities of daily living, spine surgery may beperformed. Three procedures account for 83% ofspine procedures. The most frequently performedspine procedure in 2004 was a diskectomy,accounting for 34% of spine proceduresperformed in an inpatient setting. Spinal fusionprocedures accounted for 32% of all spineprocedures performed in 2004, and wereperformed on more than one-half of spine painpatients hospitalized. (Table 2.13 and Graph 2.4.1)Spinal decompression, which may or may not beperformed in conjunction with a spinal fusion,accounted for 17% of all spine procedures.
Section 2.4.1: Spinal Fusion
The rate of spinal fusion procedures has risenrapidly over the past several decades. Spinalfusion is performed either alone or in conjunctionwith decompression and/or reduction of a spinedeformity. Fusion is performed on the cervical,thoracic and lumbar regions of the spine. Theincrease in spinal fusion rates has beendocumented by several authors, with increasedrates of 55% between 1979 and 19905; 220%between 1990 and 20016; and 250% between 1990and 20037 cited. Revision fusion rates have beenreported at increased rates of 180% between 1990and 2003.7
Increased rates of spinal fusion have been notedsince the 1980s. Likely explanations for theseincreases are advances in technology, includingthe development of new diagnostic techniquesand new implant devices that allow for bettersurgical management; increased training in spinalsurgery; and the aging of the population withinherent medical problems.
Graph 2.3.5b: Average Bed Days for Persons 18 and OverReporting Back Pain by Pain Site, United States 2005
Graph 2.3.5a: Average Lost Work Days for Persons 18 andOver with Work History Reporting Back Pain by PainSite, United States 2005
Source: National Center for Health Statistics, National Health InterviewSurvey, 2005
Source: National Center for Health Statistics, National Health InterviewSurvey, 2005
Spine: Low Back and Neck Pain Chapter 2
29The Burden of Musculoskeletal Diseases in the United States - Copyright © 2008

Lumbar spinal fusion rates have increased morerapidly than the rates for cervical or thoracicfusion and are increasingly being performed onan older population. Rates of lumbar fusion varydramatically among geographic regions,hospitals, and even between surgeons in thesame hospital, indicating that the outcomes andindications for lumbar fusion vary.8 The primarydiagnosis for several conditions have shownincreased rates of fusion, with disc degenerationoutpacing those of spondylolysis/spondylolisthesis and spinal stenosis.6
Since the mid-1980s, cervical spinal fusion rateshave been reported at 25% of the rates of lumbarfusion. Wide geographic variation is found in therates of both cervical and lumbar fusion.9However, cervical rates may have been affectedby reporting procedures, as it was not until 1995that multilevel spinal procedures were reportedwith more than one procedural code. Between1985 and 1996, cervical spinal fusion procedureswere reported at an increate rate of 310%, whilethe same author reports increased rates of 286%in lumbar and 358% in thoracic fusion rates.9
In more recent years, 1998 to 2004, spinal fusionrates based on the Nationwide Inpatient Sample(NIS) have shown a continued rise, increasing by54%. (Table 2.14 and Graph 2.4.2) This growthreflects a primary fusion procedure rate per
100,000 persons of 81.2 in 1998 and 114.8in 2004. However, data from 2004 showeda slight decline from 2003 in this growthcurve. Whether this is an indication of aslowing of the spinal fusion proceduresrate or an anomaly in the 2004 dataremains to be seen in future years.
Between 1998 and 2004, the rate ofrevision fusion procedures increased by70%. The revision rate over this 7 yearperiod had a fluctuating rate, but overallcontinued growth. In 1998, revision spinalfusions were performed at a rate of 4.4 per100,000 persons. By 2004, the rate hadincreased to 6.9 per 100,000 persons.
During this 1998 to 2004 period, the cost ofperforming spinal fusion procedures increased by111% for a primary spinal fusion and 145% for a
revision spinal fusion procedure. In 2004, themean hospital cost, as reported in the NationalInpatient Sample for a primary spinal fusion was$56,000 and a revision spinal fusion was $63,000.
Combining the increased rate of procedures withthe increasing cost of performing them, the
Graph 2.4.1: Spine Procedures as Proportion of Total Procedures andof All Spine Patients, United States 2004
Source: Agency for Healthcare Research and Quality, Healthcare Cost and UtilizationProject, Nationwide Inpatient Sample, 2004
Graph 2.4.2: Seven Year Trend in Spinal Fusion Procedures,United States 1998-2004
Source: Agency for HealthcareResearch and Quality, HealthcareCost and Utilization Project,Nationwide Inpatient Sample,1998-2004
30
Chapter 2 Spine: Low Back and Neck Pain
The Burden of Musculoskeletal Diseases in the United States - Copyright © 2008
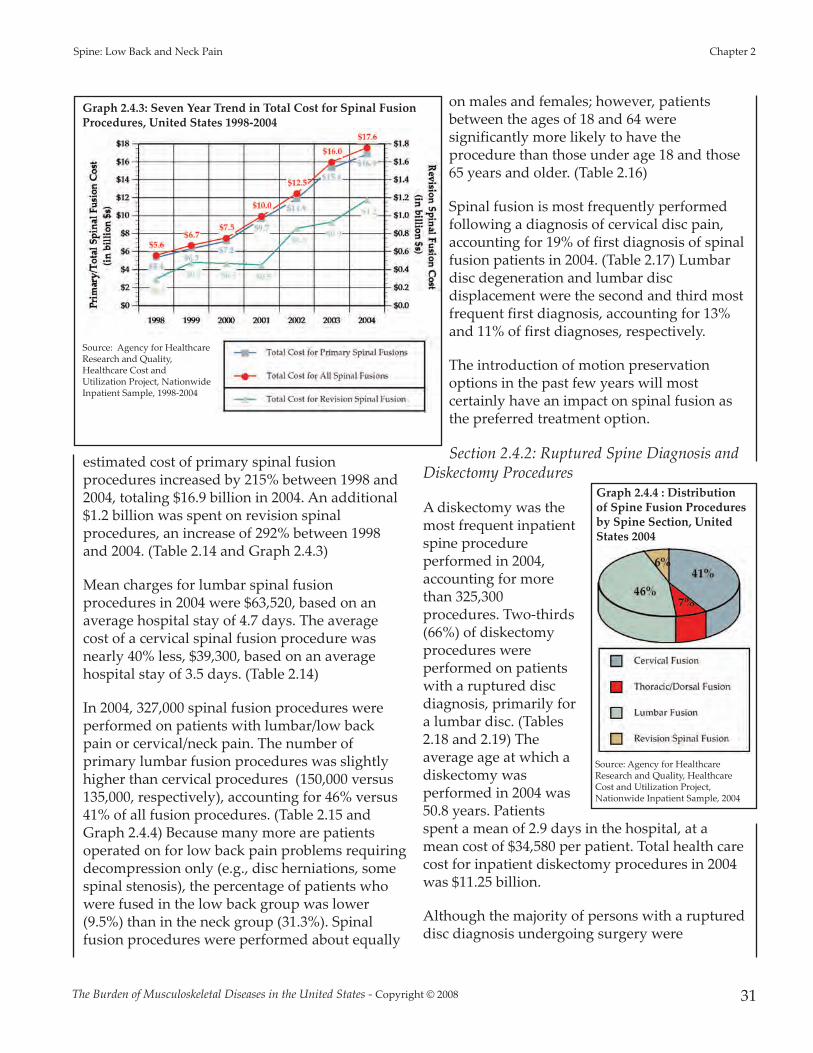
estimated cost of primary spinal fusionprocedures increased by 215% between 1998 and2004, totaling $16.9 billion in 2004. An additional$1.2 billion was spent on revision spinalprocedures, an increase of 292% between 1998and 2004. (Table 2.14 and Graph 2.4.3)
Mean charges for lumbar spinal fusionprocedures in 2004 were $63,520, based on anaverage hospital stay of 4.7 days. The averagecost of a cervical spinal fusion procedure wasnearly 40% less, $39,300, based on an averagehospital stay of 3.5 days. (Table 2.14)
In 2004, 327,000 spinal fusion procedures wereperformed on patients with lumbar/low backpain or cervical/neck pain. The number ofprimary lumbar fusion procedures was slightlyhigher than cervical procedures (150,000 versus135,000, respectively), accounting for 46% versus41% of all fusion procedures. (Table 2.15 andGraph 2.4.4) Because many more are patientsoperated on for low back pain problems requiringdecompression only (e.g., disc herniations, somespinal stenosis), the percentage of patients whowere fused in the low back group was lower(9.5%) than in the neck group (31.3%). Spinalfusion procedures were performed about equally
on males and females; however, patientsbetween the ages of 18 and 64 weresignificantly more likely to have theprocedure than those under age 18 and those65 years and older. (Table 2.16)
Spinal fusion is most frequently performedfollowing a diagnosis of cervical disc pain,accounting for 19% of first diagnosis of spinalfusion patients in 2004. (Table 2.17) Lumbardisc degeneration and lumbar discdisplacement were the second and third mostfrequent first diagnosis, accounting for 13%and 11% of first diagnoses, respectively.
The introduction of motion preservationoptions in the past few years will mostcertainly have an impact on spinal fusion asthe preferred treatment option.
Section 2.4.2: Ruptured Spine Diagnosis andDiskectomy Procedures
A diskectomy was themost frequent inpatientspine procedureperformed in 2004,accounting for morethan 325,300procedures. Two-thirds(66%) of diskectomyprocedures wereperformed on patientswith a ruptured discdiagnosis, primarily fora lumbar disc. (Tables2.18 and 2.19) Theaverage age at which adiskectomy wasperformed in 2004 was50.8 years. Patientsspent a mean of 2.9 days in the hospital, at amean cost of $34,580 per patient. Total health carecost for inpatient diskectomy procedures in 2004was $11.25 billion.
Although the majority of persons with a ruptureddisc diagnosis undergoing surgery were
Graph 2.4.3: Seven Year Trend in Total Cost for Spinal FusionProcedures, United States 1998-2004
Source: Agency for HealthcareResearch and Quality,Healthcare Cost andUtilization Project, NationwideInpatient Sample, 1998-2004
Graph 2.4.4 : Distributionof Spine Fusion Proceduresby Spine Section, UnitedStates 2004
Source: Agency for HealthcareResearch and Quality, HealthcareCost and Utilization Project,Nationwide Inpatient Sample, 2004
Spine: Low Back and Neck Pain Chapter 2
31The Burden of Musculoskeletal Diseases in the United States - Copyright © 2008

hospitalized in 2004, the health care impact andcost of a ruptured, or herniated, disc is muchmore severe due to only 7% of patients with thisdiagnosis being hospitalized. The majority of thetotal 5 million persons diagnosed with a ruptureddisc in 2004 were seen in a physician’s office.(Table 2.18 and Graph 2.4.5) A ruptured disk
occurs primarilybetween the agesof 18 and 64 (83%of diagnoses);rarely does itoccur in personsunder the age of18 or over theage of 75. (Graph2.4.6)
The meannumber ofdiskectomyproceduresreported by theNationalHospitalDischargeSurvey over thepast 10 years is299,000 per year,with a range of279,000 to324,000fluctuatingaround thismean. (Table 2.20and Graph 2.4.7)
Section 2.5: NeuromusculoskeletalConditions
The spinal column is an extremely complexbiomechanical structure with intimateneurological, muscular, and ligamentousinterfaces. Functional and structural disorders ofthe spine often produce symptomatologyaffecting contiguous structures and regions. Theresultant types of disorders affecting multipledomains have been referred to asneuromusculoskeletal or spine-related disorders.Included in this group are spinal subluxations,spinal sprains and strains, cervical, thoracic,lumbar and pelvic symptoms and ill-definedconditions; and spine-related (cervico-genic)headaches. These types of conditions areprevalent, disturbing, and compromising topatients’ functional abilities. In 2004, over 111million patient visits were attributed to disordersin the neuromusculoskeletal category. In part, thereason for the ill-defined nature of some of theseconditions may lie in the intrinsic complexity ofthe spinal column and the multiple structures andsystems with which it interfaces. For example,individuals with chronic lumbar and pelvic painmay also complain of depression, digestiveproblems, and sexual dysfunction. Many patientswith chronic cervical symptoms suffer fromheadaches as well.
Since 1999, neuromusculoskeletal complaintshave shown a steady increase in incidence. Thisincrease may be associated with the increasinglysedentary lifestyle of Americans and the marked
Graph 2.4.5: Health Care Visits forRuptured Spine by Location, United States 2004
Graph 2.4.6: Health Care Visits forRuptured Spine by Age, UnitedStates 2004
Sources: Agency for Healthcare Research andQuality, Healthcare Cost and Utilization Project,Nationwide Inpatient Sample, 2004; NationalCenter for Health Statistics, National HospitalAmbulatory Medical Care Survey, HospitalEmergency, 2004: National Center for HealthStatistics, National Hospital Ambulatory MedicalCare Survey, Outpatient, 2004; National Centerfor Health Statistics, National AmbulatoryMedical Care Survey, 2004
[1] Source: Agency for Healthcare Research andQuality, Healthcare Cost and Utilization Project,Nationwide Inpatient Sample, 2004[2] Source: National Center for Health Statistics,National Hospital Ambulatory Medical CareSurvey, Hospital Emergency, 2004[3] Source: National Center for Health Statistics,National Hospital Ambulatory Medical CareSurvey, Outpatient, 2004[4] Source: National Center for Health Statistics,National Ambulatory Medical Care Survey, 2004
Graph 2.4.7: Ten-Year Trend in Spinal DiskectomyProcedures, United States 1996-2005
Source: National Center for Health Statistics, National Hospital DischargeSurvey, 1996-2005
32
Chapter 2 Spine: Low Back and Neck Pain
The Burden of Musculoskeletal Diseases in the United States - Copyright © 2008

Spine: Low Back and Neck Pain Chapter 2
33The Burden of Musculoskeletal Diseases in the United States - Copyright © 2008
increase in occupational and recreational use ofcomputers with attendant ergonomic risks. Theproportionate rise in cervical and thoracic andlumbar spine symptoms and ill-definedconditions has been similar in distribution since1999. In 2004, the number of patient visits relatedto cervical spine symptoms and ill-definedconditions (34.1 million) were approximatelyequal in number to visits for similar lumbar spinedisorders (34.9 million). In 2004, thoracicsymptoms and ill-defined disorders numbered18.3 million, while pelvic disorders numbered13.2 million. Females are more prone than malesto these spine-related disorders across a range ofcategories.
Section 2.6: Economic Cost of SpineConditions
Chapter 9 summarizes the cost of musculoskeletalconditions based on analysis of the MedicalExpenditures Panel Survey (MEPS) from 1996 to2004. The MEPS, which began in 1996, is a set oflarge-scale surveys of families and individuals,their medical providers (doctors, hospitals,pharmacies, etc.), and their employers. MEPScollects data on the specific health services thatAmericans use, how frequently they use them,the cost of these services, and how they are paidfor, as well as data on the cost, scope, and breadthof health insurance held by and available to U.S.workers. Currently MEPS collects data from twomajor components: households and insurancecompanies. The Household Component (MEPS-HC) provides data from individual householdsand their members, which is supplemented bydata from their medical providers. The InsuranceComponent (MEPS-IC) is a separate survey ofemployers that provides data on employer-basedhealth insurance. MEPS also includes a MedicalProvider Component (MEPS-MPC), that covershospitals, physicians, home health care providers,and pharmacies identified by MEPS-HCrespondents. Its purpose is to supplement and/orreplace information received from the MEPS-HCrespondents.10
As with the National Health Interview Survey(NHIS), data in the household component is self-reported. Self-reported data from availabledatabases indicates a range in the prevalence ofall specific conditions. As noted earlier in thischapter, more than 44.6 million persons visitedtheir physician with a complaint of back pain in2004, while 94.3 persons self-reported low back orneck pain in 2005 in the NHIS. Economicprojections are based on the MEPS self-reportedspine conditions, or 32.7 million incidences.
The estimated annual cost for medical care ofspine conditions, discussed in Chapter 9, both asa primary condition and secondary to anothercondition, in 2004 was $193.9 billion or anaverage of $5,923 for each of the 32.7 millionpersons who reported having a spine condition.Of this total, $30.3 billion is estimated as theincremental cost directly related to spineconditions. A breakdown of the $193.9 billion costdue to spine conditions shows 34% forambulatory care, 32% for emergency room orinpatient care, 20% for prescription drugs, and14% for other expenses. The cost of spineconditions, in 2004 dollars, rose from $130.2billion in 1996 to $193.9 billion in 2004, anincrease of 49%. The increasing cost ofprescription drugs accounts for the largestpercentage of this total cost increase, rising from13% of total cost to 20% over the 9-year period.Earnings loss, or indirect costs, due to spineconditions for persons between the ages of 18 to64 years with a work history was estimated at$22.4 billion per year between 2000 and 2004.
1. National Center for Health Statistics: National HealthInterview Survey, Adult Sample Level File, 2005.
2. National Center for Health Statistics: National Healthand Nutrition Examination Survey Data, 1998-2004.
3. Battie MC, Videman T: Lumbar disc degeneration:Epidemiology and genetics. J Bone Joint Surg Am2006;88:3-9.
4. Katz J: Lumbar disc disorders and low-back pain:socioeconomic factors and consequences. J Bone JointSurg Am 2006;88:21-24.
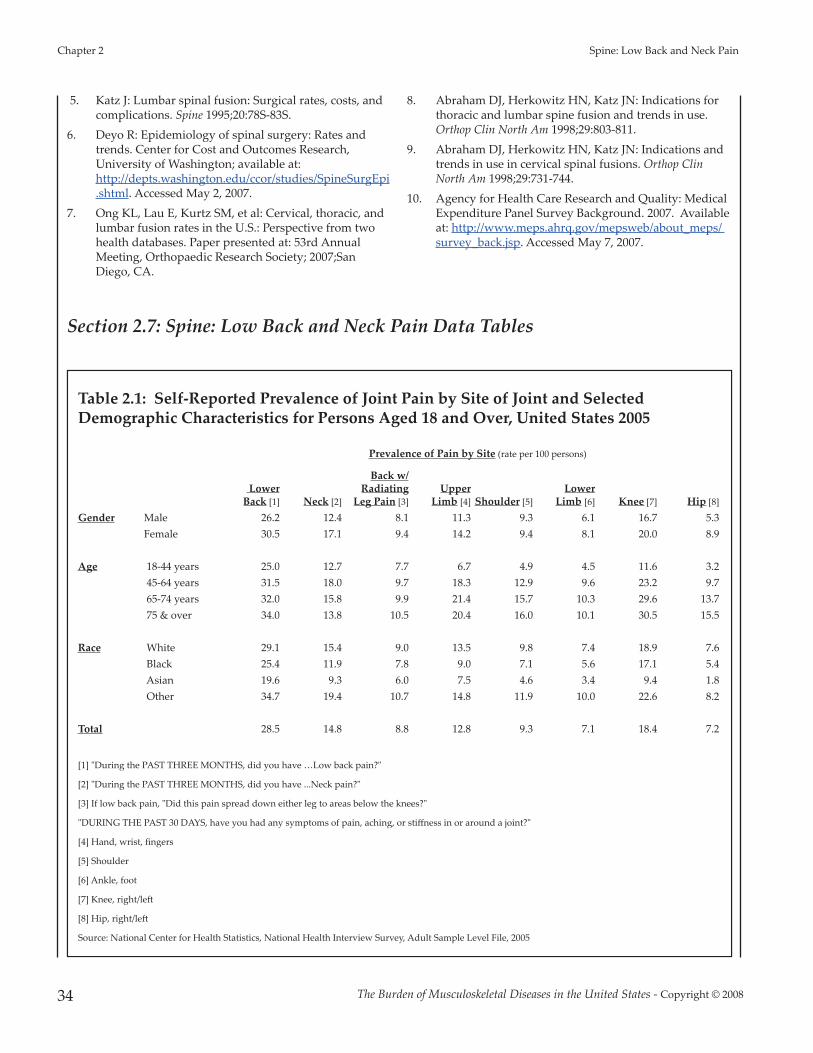
The Burden of Musculoskeletal Diseases in the United States - Copyright © 2008
Chapter 2 Spine: Low Back and Neck Pain
34
5. Katz J: Lumbar spinal fusion: Surgical rates, costs, andcomplications. Spine 1995;20:78S-83S.
6. Deyo R: Epidemiology of spinal surgery: Rates andtrends. Center for Cost and Outcomes Research,University of Washington; available at:http://depts.washington.edu/ccor/studies/SpineSurgEpi.shtml. Accessed May 2, 2007.
7. Ong KL, Lau E, Kurtz SM, et al: Cervical, thoracic, andlumbar fusion rates in the U.S.: Perspective from twohealth databases. Paper presented at: 53rd AnnualMeeting, Orthopaedic Research Society; 2007;SanDiego, CA.
8. Abraham DJ, Herkowitz HN, Katz JN: Indications forthoracic and lumbar spine fusion and trends in use.Orthop Clin North Am 1998;29:803-811.
9. Abraham DJ, Herkowitz HN, Katz JN: Indications andtrends in use in cervical spinal fusions. Orthop ClinNorth Am 1998;29:731-744.
10. Agency for Health Care Research and Quality: MedicalExpenditure Panel Survey Background. 2007. Availableat: http://www.meps.ahrq.gov/mepsweb/about_meps/ survey_back.jsp. Accessed May 7, 2007.
Section 2.7: Spine: Low Back and Neck Pain Data Tables
Table 2.1: Self-Reported Prevalence of Joint Pain by Site of Joint and SelectedDemographic Characteristics for Persons Aged 18 and Over, United States 2005
Prevalence of Pain by Site (rate per 100 persons)
Lower Back [1] Neck [2]
Back w/Radiating
Leg Pain [3]Upper
Limb [4] Shoulder [5]Lower
Limb [6] Knee [7] Hip [8]
Gender Male 26.2 12.4 8.1 11.3 9.3 6.1 16.7 5.3 Female 30.5 17.1 9.4 14.2 9.4 8.1 20.0 8.9
Age 18-44 years 25.0 12.7 7.7 6.7 4.9 4.5 11.6 3.2 45-64 years 31.5 18.0 9.7 18.3 12.9 9.6 23.2 9.7 65-74 years 32.0 15.8 9.9 21.4 15.7 10.3 29.6 13.7 75 & over 34.0 13.8 10.5 20.4 16.0 10.1 30.5 15.5
Race White 29.1 15.4 9.0 13.5 9.8 7.4 18.9 7.6 Black 25.4 11.9 7.8 9.0 7.1 5.6 17.1 5.4 Asian 19.6 9.3 6.0 7.5 4.6 3.4 9.4 1.8 Other 34.7 19.4 10.7 14.8 11.9 10.0 22.6 8.2
Total 28.5 14.8 8.8 12.8 9.3 7.1 18.4 7.2
[1] "During the PAST THREE MONTHS, did you have …Low back pain?"
[2] "During the PAST THREE MONTHS, did you have ...Neck pain?"
[3] If low back pain, "Did this pain spread down either leg to areas below the knees?"
"DURING THE PAST 30 DAYS, have you had any symptoms of pain, aching, or stiffness in or around a joint?"
[4] Hand, wrist, fingers
[5] Shoulder
[6] Ankle, foot
[7] Knee, right/le�
[8] Hip, right/le�
Source: National Center for Health Statistics, National Health Interview Survey, Adult Sample Level File, 2005
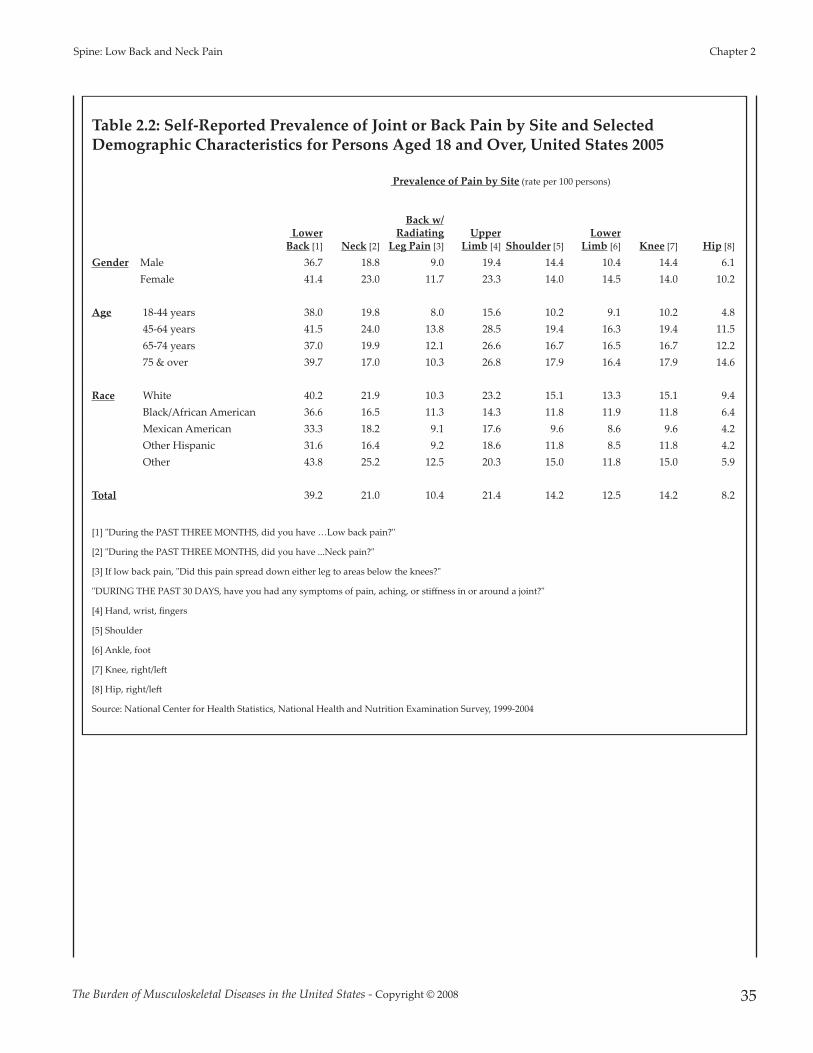
The Burden of Musculoskeletal Diseases in the United States - Copyright © 2008 35
Spine: Low Back and Neck Pain Chapter 2
Table 2.2: Self-Reported Prevalence of Joint or Back Pain by Site and SelectedDemographic Characteristics for Persons Aged 18 and Over, United States 2005
Prevalence of Pain by Site (rate per 100 persons)
Lower Back [1] Neck [2]
Back w/Radiating
Leg Pain [3]Upper
Limb [4] Shoulder [5]Lower
Limb [6] Knee [7] Hip [8]
Gender Male 36.7 18.8 9.0 19.4 14.4 10.4 14.4 6.1 Female 41.4 23.0 11.7 23.3 14.0 14.5 14.0 10.2
Age 18-44 years 38.0 19.8 8.0 15.6 10.2 9.1 10.2 4.8 45-64 years 41.5 24.0 13.8 28.5 19.4 16.3 19.4 11.5 65-74 years 37.0 19.9 12.1 26.6 16.7 16.5 16.7 12.2 75 & over 39.7 17.0 10.3 26.8 17.9 16.4 17.9 14.6
Race White 40.2 21.9 10.3 23.2 15.1 13.3 15.1 9.4 Black/African American 36.6 16.5 11.3 14.3 11.8 11.9 11.8 6.4 Mexican American 33.3 18.2 9.1 17.6 9.6 8.6 9.6 4.2 Other Hispanic 31.6 16.4 9.2 18.6 11.8 8.5 11.8 4.2 Other 43.8 25.2 12.5 20.3 15.0 11.8 15.0 5.9
Total 39.2 21.0 10.4 21.4 14.2 12.5 14.2 8.2
[1] "During the PAST THREE MONTHS, did you have …Low back pain?"
[2] "During the PAST THREE MONTHS, did you have ...Neck pain?"
[3] If low back pain, "Did this pain spread down either leg to areas below the knees?"
"DURING THE PAST 30 DAYS, have you had any symptoms of pain, aching, or stiffness in or around a joint?"
[4] Hand, wrist, fingers
[5] Shoulder
[6] Ankle, foot
[7] Knee, right/le�
[8] Hip, right/le�
Source: National Center for Health Statistics, National Health and Nutrition Examination Survey, 1999-2004

The Burden of Musculoskeletal Diseases in the United States - Copyright © 2008
Chapter 2 Spine: Low Back and Neck Pain
36
Table 2.3: Distribution of Back Pain by Site and Selected Demographic Characteristicsfor Persons Aged 18 and Over, United States 1999-2004
Proportion of Persons Reporting Back Pain
Lower Back Pain Only [1]
Upper Back Pain Only [2] Bu�ocks [3]
Neck and Spine Only [4]
Multiple BackPain Sites [5]
Gender Male 28% 5% 6% 22% 40%Female 25% 5% 9% 17% 44%
Age 18-44 years 28% 6% 4% 20% 42%45-64 years 23% 5% 10% 18% 44%65-74 years 26% 4% 12% 21% 38%75 & over 33% 6% 11% 14% 36%
Race White 25% 5% 7% 20% 43%Black/African American 39% 3% 7% 15% 36%Mexican American 27% 3% 8% 23% 40%Other Hispanic 25% 8% 8% 17% 43%Other 28% 3% 4% 23% 42%
Total 26% 5% 7% 19% 42%
[1] "With respect to pain problem, located in …low back pain?"
[2] "With respect to pain problem, located in …upper back pain?"
[3] "With respect to pain problem, located in …bu�ocks?"
[4] "With respect to pain problem, located in …neck and spine?"
[5]"With respect to pain problem, located in …multiple sites of back"
Source: National Center for Health Statistics. National Health and Nutrition Examination Survey Data, 1999-2004.

The Burden of Musculoskeletal Diseases in the United States - Copyright © 2008 37
Spine: Low Back and Neck Pain Chapter 2
Table 2.4: Distribution Joint Pain by Site and Selected Demographic Characteristics forPersons Aged 18 and Over, United States 1999-2004
Proportion of Persons Reporting Joint Pain (excluding back pain)
Hip Pain Only [1]
Knee PainOnly [2]
Lower LimbPain Only [3]
Shoulder Pain Only [4]
Upper LimbPain Only [5]
Multiple Pain Sites [6]
Gender Male 3% 21% 7% 8% 16% 45%Female 5% 18% 7% 5% 14% 52%
Age 18-44 years 3% 22% 8% 8% 17% 42%45-64 years 4% 18% 6% 5% 13% 53%65-74 years 5% 16% 8% 5% 13% 54%75 & over 6% 15% 6% 5% 13% 54%
Race White 4% 18% 7% 6% 15% 49%Black/African American 5% 26% 10% 7% 10% 43%Mexican American 3% 17% 5% 5% 19% 50%Other Hispanic 5% 21% 4% 9% 20% 41%Other 4% 15% 5% 10% 13% 52%
Total 4% 19% 7% 6% 15% 49%
[1] "With respect to pain problem, located in …hip pain?"
[2] "With respect to pain problem, located in …knee pain?"
[3] "With respect to pain problem, located in …leg, foot pain?"
[4] "With respect to pain problem, located in …shoulder pain?"
[5] "With respect to pain problem, located in …elbow, wrist or finger pain"
[6] "With respect to pain problem, located in …multiple joint pain sites"
Source: National Center for Health Statistics. National Health and Nutrition Examination Survey Data, 1999-2004.

The Burden of Musculoskeletal Diseases in the United States - Copyright © 2008
Chapter 2 Spine: Low Back and Neck Pain
38
Table 2.5: Prevalence of Lumbar and Low Back Disorders by Gender and Age, United States 2004
Gender Age (in years) Ave Age Total Male Female <18 18-44 45-64 65-74 75 & over for Dx
Hospital Discharges [1] Total Number of Hospital Discharges for Low Back Disorders (in 000s)
Back Disorders 1,051 418 631 * 195 340 194 314 61.8 Disc Disorders 456 204 250 * 126 172 73 84 56.5 Back Injury 181 85 96 * 54 37 21 63 57.8 All Lumbar/Low Back Pain 1,585 665 915 14 356 516 269 428 59.8
Hospital Emergency Room Visits [2] Total Number of Emergency Room Visits for Low Back Disorders (in 000s)
Back Disorders 2,985 1,427 1,558 85 1,589 933 170 208 43.3 Disc Disorders 114 58 56 * 54 56 * * 45.5 Back Injury 1,792 803 989 89 1,125 429 66 84 39.0 All Lumbar/Low Back Pain 4,646 2,156 2,490 168 2,617 1,342 232 287 42.0
Hospital Outpatient Visits [3] Total Number of Outpatient Department Visits for Low Back Disorders (in 000s)
Back Disorders 2,269 909 1,360 69 902 835 281 182 48.8 Disc Disorders 270 111 159 * 115 102 38 * 49.8 Back Injury 368 168 200 * 236 84 24 * 42.4 All Lumbar/Low Back Pain 2,760 1,140 1,620 74 1,179 975 329 204 48.1
Physician Office Visits [4] Total Number of Physician Visits for Low Back Disorders (in 000s)
Back Disorders 21,813 8,306 13,507 679 6,171 9,067 2,765 3,130 52.7 Disc Disorders 6,497 3,893 2,604 * 2,074 3,056 951 416 52.2 Back Injury 5,454 2,601 2,853 167 2,461 1,913 664 249 47.2 All Lumbar/Low Back Pain 31,540 13,752 17,788 846 9,907 12,926 4,219 3,641 51.7
Total Health Care Visits for Lumbar/Low Back Pain, 2004 Total Number of Health Care Visits for Low Back Disorders (in 000s)
Back Disorders 28,118 11,060 17,056 833 8,857 11,175 3,410 3,834 Disc Disorders 7,337 4,266 3,069 * 2,369 3,386 1,062 500 Back Injury 7,795 3,657 4,138 256 3,876 2,463 775 396
All Lumbar/Low Back Pain 40,531 17,713 22,813 1,102 14,059 15,759 5,049 4,560 Percent of Total 44% 56% 3% 35% 39% 12% 11%
Hospital Discharges [1] 1,585 665 915 14 356 516 269 428 59.8 Hospital Emergency Room Visits [2] 4,646 2,156 2,490 168 2,617 1,342 232 287 42.0 Hospital Outpatient Visits [3] 2,760 1,140 1,620 74 1,179 975 329 204 48.1 Physician Office Visits [4] 31,540 13,752 17,788 846 9,907 12,926 4,219 3,641 51.7
All Lumbar/Low Back Pain Diagnoses 40,531 17,713 22,813 1,102 14,059 15,759 5,049 4,560 Percent of Total 44% 56% 3% 35% 39% 12% 11%
* Estimate does not meet standards for reliability
[1] Source: Agency for Healthcare Research and Quality, Healthcare Cost and Utilization Project, Nationwide Inpatient Sample, 2004
[2] Source: National Center for Health Statistics, National Hospital Ambulatory Medical Care Survey, Hospital Emergency, 2004
[3] Source: National Center for Health Statistics, National Hospital Ambulatory Medical Care Survey, Outpatient, 2004
[4] Source: National Center for Health Statistics, National Ambulatory Medical Care Survey, 2004

The Burden of Musculoskeletal Diseases in the United States - Copyright © 2008 39
Spine: Low Back and Neck Pain Chapter 2
Table 2.5a: Prevalence Rate of Lumbar and Low Back Disorders by Gender and Age,United States 2004
Gender Age (in years)
Total Male Female <18 18-44 45-64 65-74 75 & over
Hospital Discharges [1] Proportion of Hospital Discharges for Low Back DisordersBack Disorders 62% 59% 65% * 52% 62% 67% 68%Disc Disorders 27% 29% 26% * 34% 31% 25% 18%Back Injury 11% 12% 10% * 14% 7% 7% 14%
All Lumbar/Low Back Pain (in 000s) 1,585 665 915 14 356 516 269 428
Hospital Emergency Room Visits [2] Proportion of Emergency Room Visits for Low Back DisordersBack Disorders 61% 62% 60% 49% 57% 66% 72% 71%Disc Disorders 2% 3% 2% * 2% 4% * * Back Injury 37% 35% 38% 51% 41% 30% 28% 29%
All Lumbar/Low Back Pain (in 000s) 4,646 2,156 2,490 168 2,617 1,342 232 287
Hospital Outpatient Visits [3] Proportion of Hospital Outpatient Department Visits for Low Back DisordersBack Disorders 78% 77% 79% 100% 72% 82% 82% 100%Disc Disorders 9% 9% 9% * 9% 10% 11% * Back Injury 13% 14% 12% * 19% 8% 7% *
All Lumbar/Low Back Pain (in 000s) 2,760 1,140 1,620 74 1,179 975 329 204
Physician Office Visits [4] Proportion of Physician Office Visits for Low Back DisordersBack Disorders 65% 56% 71% 80% 58% 65% 63% 82%Disc Disorders 19% 26% 14% * 19% 22% 22% 11%Back Injury 16% 18% 15% 20% 23% 14% 15% 7%
All Lumbar/Low Back Pain (in 000s) 31,540 13,752 17,788 846 9,907 12,926 4,219 3,641
Total Health Care Visits for Lumbar and Low Back Pain, 2004Proportion of Health Care Visits for Low Back Disorders
Back Disorders 65% 58% 70% 76% 59% 66% 65% 81%Disc Disorders 17% 22% 13% * 16% 20% 20% 11%Back Injury 18% 19% 17% 24% 26% 14% 15% 8%
All Lumbar/Low Back Pain (in 000s) 40,531 17,713 22,813 1,102 14,059 15,759 5,049 4,560
% by Resource
TotalDiagnoses
Low Back Disordersas % of Total
Low BackDisorders
All MedicalConditions
Hospital Discharges [1] 36,626 4.3% 3.9% 3.3%Hospital Emergency Room Visits [2] 110,216 4.2% 11.5% 10.0%Hospital Outpatient Visits [3] 84,994 3.2% 6.8% 7.7%Physician Office Visits [4] 868,560 3.6% 77.8% 78.9%
All Lumbar/Low Back Pain Diagnoses(in 000s) 1,100,396 3.7% 40,531 1,100,396
* Estimate does not meet standards for reliability
[1] Source: Agency for Healthcare Research and Quality, Healthcare Cost and Utilization Project, Nationwide Inpatient Sample, 2004
[2] Source: National Center for Health Statistics, National Hospital Ambulatory Medical Care Survey, Hospital Emergency, 2004
[3] Source: National Center for Health Statistics, National Hospital Ambulatory Medical Care Survey, Outpatient, 2004
[4] Source: National Center for Health Statistics, National Ambulatory Medical Care Survey, 2004

The Burden of Musculoskeletal Diseases in the United States - Copyright © 2008
Chapter 2 Spine: Low Back and Neck Pain
40
Table 2.6: Prevalence of Neck and Cervical Spine Disorders by Gender and Age, United States 2004
Gender Age (in years) Ave Age Total Male Female <18 18-44 45-64 65-74 75 & over for Dx
Hospital Dischargess [1] Total Number of Hospital Discharges for Cervical Pain Disorders (in 000s)
Cervical Disorders 252 114 138 * 49 104 44 51 58.2 Cervical Disc Disorders 145 66 78 * 42 72 16 15 53.4 Neck Injury 73 42 30 * 30 18 * 13 47.9 All Cervical/Neck Pain 431 203 227 9 112 173 62 75 55.2
Hospital Emergency Room Visits [2] Total Number of Emergency Room Visits for Cervical Pain Disorders (in 000s)
Cervical Disorders 654 277 377 76 350 168 * * 39.0 Cervical Disc Disorders * * * * * * * * * Neck Injury 1,490 657 833 212 919 267 63 29 33.0 All Cervical/Neck Pain 2,127 927 1,200 276 1,265 430 104 52 35.0
Hospital Outpatient Visits [3] Total Number of Outpatient Department Visits for Cervical Pain Disorders (in 000s) Cervical Disorders 523 234 289 21 225 207 54 * 45.1 Cervical Disc Disorders 120 47 72 * 38 72 * * 51.3 Neck Injury 137 60 77 20 62 24 * * 46.5All Cervical/Neck Pain 763 330 433 42 321 297 66 36 46.0
Physician Office Visits [4] Total Number of Physician Visits for Cervical Pain Disorders (in 000s)
Cervical Disorders 8,638 3,235 5,403 437 2,481 4,571 842 307 49.5 Cervical Disc Disorders 1,690 727 962 * 581 957 115 38 50.2 Neck Injury 3,445 1,653 1,792 204 1,543 1,136 422 140 45.5 All Cervical/Neck Pain 13,104 5,293 7,811 641 4,475 6,249 1,274 466 48.4
Total Health Care Visits for Lumbar and Low Back Pain, 2004Total Number of Health Care Visits for Cervical Pain Disorders (in 000s)
Cervical Disorders 10,067 3,860 6,207 534 3,105 5,050 940 358 Cervical Disc Disorders 1,955 840 1,112 * 661 1,101 131 53 Neck Injury 5,145 2,412 2,732 436 2,554 1,445 485 182
All Cervical/Neck Pain 16,425 6,753 9,671 968 6,173 7,149 1,506 629 Percent of Total 41% 59% 6% 38% 44% 9% 4%
Hospital Discharges [1] 431 203 227 9 112 173 62 75 55.2 Hospital Emergency Room Visits [2] 2,127 927 1,200 276 1,265 430 104 52 35.0 Hospital Outpatient Visits [3] 763 330 433 42 321 297 66 36 46.0 Physician Office Visits [4] 13,104 5,293 7,811 641 4,475 6,249 1,274 466 48.4
All Cervical/Neck Pain Diagnoses 16,425 6,753 9,671 968 6,173 7,149 1,506 629 Percent of Total 41% 59% 6% 38% 44% 9% 4%
* Estimate does not meet standards for reliability
[1] Source: Agency for Healthcare Research and Quality, Healthcare Cost and Utilization Project, Nationwide Inpatient Sample, 2004
[2] Source: National Center for Health Statistics, National Hospital Ambulatory Medical Care Survey, Hospital Emergency, 2004
[3] Source: National Center for Health Statistics, National Hospital Ambulatory Medical Care Survey, Outpatient, 2004
[4] Source: National Center for Health Statistics, National Ambulatory Medical Care Survey, 2004

The Burden of Musculoskeletal Diseases in the United States - Copyright © 2008 41
Spine: Low Back and Neck Pain Chapter 2
Table 2.6a: Prevalence Rate of Neck and Cervical Spine Disorders by Gender and Age,United States 2004
Gender Age (in years)
Total Male Female <18 18-44 45-64 65-74 75 & over
Hospital Discharges [1] Proportion of Hospital Discharges for Cervical Pain Disorders Cervical Disorders 54% 51% 56% * 40% 54% 73% 65%Cervical Disc Disorders 31% 30% 32% * 35% 37% 27% 19%Neck Injury 16% 19% 12% * 25% 9% * 16%All Cervical/Neck Pain 431 203 227 9 112 173 62 75
Hospital Emergency Room Visits [2] Proportion of Emergency Room Visits for Cervical Pain Disorders Cervical Disorders 31% 30% 31% 26% 28% 39% * * Cervical Disc Disorders * * * * * * * * Neck Injury 69% 70% 69% 74% 72% 61% 100% 100%All Cervical/Neck Pain 2,127 927 1,200 276 1,265 430 104 52
Hospital Outpatient Visits [3] Proportion of Outpatient Department Visits for Cervical Pain Disorders Cervical Disorders 67% 69% 66% 51% 69% 68% 100% * Cervical Disc Disorders 15% 14% 16% * 12% 24% * * Neck Injury 18% 18% 18% * 19% 8% * * All Cervical/Neck Pain 763 330 433 42 321 297 66 36
Physician Office Visits [4] Proportion of Physician Visits for Cervical Pain Disorders Cervical Disorders 63% 58% 66% 68% 54% 69% 61% 63%Cervical Disc Disorders 12% 13% 12% * 13% 14% 8% 8%Neck Injury 25% 29% 22% 32% 34% 17% 31% 29%All Cervical/Neck Pain 13,104 5,293 7,811 641 4,475 6,249 1,274 466
Total Health Care Visits for Lumbar and Low Back Pain, 2004 Proportion of Health Care Visits for Cervical Pain Disorders
Cervical Disorders 59% 54% 62% 55% 49% 66% 60% 60%Cervical Disc Disorders 11% 12% 11% * 10% 14% 8% 9%Neck Injury 30% 34% 27% 45% 40% 19% 31% 31%
All Cervical/Neck Pain 16,425 6,753 9,671 968 6,173 7,149 1,506 629 % by Resource
TotalDiagnoses
Cervical Disorders as % of Total
CervicalDisorders
All MedicalConditions
Hospital Discharges [1] 36,626 1.2% 2.6% 3.3%Hospital Emergency Room Visits [2] 110,216 1.9% 12.9% 10.0%Hospital Outpatient Visits [3] 84,994 0.9% 4.6% 7.7%Physician Office Visits [4] 868,560 1.5% 79.8% 78.9%
All Cervical/Neck Pain Diagnoses 1,100,396 1.5% 16,425 1,100,396
* Estimate does not meet standards for reliability
[1] Source: Agency for Healthcare Research and Quality, Healthcare Cost and Utilization Project, Nationwide Inpatient Sample, 2004
[2] Source: National Center for Health Statistics, National Hospital Ambulatory Medical Care Survey, Hospital Emergency, 2004
[3] Source: National Center for Health Statistics, National Hospital Ambulatory Medical Care Survey, Outpatient, 2004
[4] Source: National Center for Health Statistics, National Ambulatory Medical Care Survey, 2004

The Burden of Musculoskeletal Diseases in the United States - Copyright © 2008
Chapter 2 Spine: Low Back and Neck Pain
42
Table 2.7: Summary of Resource Allocation of Total Health Care Occurrences for BackPain and Related Conditions by Gender and Age, United States 2004
Gender Age (in years) Ave
Age atDx
Diagnoses All
Conditions(in 000s)
Spine as% of All
Diagnoses Total Male Female <18 18-44 45-64 65-74 75 &over
Lumbar/Low Back Pain Total Number of Lumbar/Low Back Diagnoses (in 000s)
Hospital Discharges [1] 1,585 665 915 * 356 516 269 428 59.8 36,626 4.3%
Hospital Emergency Room Visits [2] 4,646 2,156 2,490 168 2,617 1,342 232 287 42.0 110,216 4.2%
Hospital Outpatient Visits [3] 2,760 1,140 1,620 74 1,179 975 329 204 48.1 84,994 3.2%
Physician Office Visits [4] 31,540 13,752 17,788 846 9,907 12,926 4,219 3,641 51.7 868,560 3.6%
All Lumbar/Low Back Pain Diagnoses 40,531 17,713 22,813 1,088 14,059 15,759 5,049 4,560 1,100,396 3.7%
Percent of Total 44% 56% 3% 35% 39% 12% 11%
Cervical/Neck Pain Total Number of Cervical/Neck Diagnoses (in 000s)
Hospital Discharges [1] 431 203 227 * 112 173 62 75 55.2 36,626 1.2%
Hospital Emergency Room Visits [2] 2,127 927 1,200 276 1,265 430 104 52 35.0 110,216 1.9%
Hospital Outpatient Visits [3] 763 330 433 42 321 297 66 36 46.0 84,994 0.9%
Physician Office Visits [4] 13,104 5,293 7,811 641 4,475 6,249 1,274 466 48.4 868,560 1.5%
All Cervical/Neck Pain Diagnoses 16,425 6,753 9,671 959 6,173 7,149 1,506 629 1,100,396 1.5%
Percent of Total 41% 59% 6% 38% 44% 9% 4%
Total Back Pain (Lumbar and Cervical) Diagnoses [5]
Total Number of Spinal Diagnoses (in 000s)
Hospital Discharges [1] 1,937 833 1,099 22 447 659 319 488 58.9 36,626 5.3%
Hospital Emergency Room Visits [2] 6,314 2,873 3,441 393 3,595 1,667 323 336 40.2 110,216 5.7%
Hospital Outpatient Visits [3] 3,332 1,380 1,953 114 1,396 1,209 374 239 47.9 84,994 3.9%
Physician Office Visits [4] 41,444 17,883 23,562 1,339 13,345 17,576 5,161 4,023 50.9 868,560 4.8%
All Back Pain Diagnoses 53,027 22,969 30,055 1,868 18,783 21,111 6,177 5,086 1,100,396 4.8%
Percent of Total 43% 57% 4% 35% 40% 12% 10%
* Estimate does not meet standards for reliability
[1] Source: Agency for Healthcare Research and Quality, Healthcare Cost and Utilization Project, Nationwide Inpatient Sample, 2004
[2] Source: National Center for Health Statistics, National Hospital Ambulatory Medical Care Survey, Hospital Emergency, 2004
[3] Source: National Center for Health Statistics, National Hospital Ambulatory Medical Care Survey, Outpatient, 2004
[4] Source: National Center for Health Statistics, National Ambulatory Medical Care Survey, 2004
[5] Diagnosis with both lumbar and cervical pain possible.

The Burden of Musculoskeletal Diseases in the United States - Copyright © 2008 43
Spine: Low Back and Neck Pain Chapter 2
Table 2.7a: Summary of Resource Allocation as a Proportion of Total Health CareOccurrences for Back Pain and Related Conditions by Gender and Age, United States 2004
Gender Age (in years) Ave
Age atDx
Diagnoses All
Conditions(in 000s)
Spine as% of All
Diagnoses Total Male Female <18 18-44 45-64 65-74 75 &over
Lumbar/Low Back Pain Proportion of Total Lumbar/Low Back Diagnoses
Hospital Discharges [1] 3.9% 3.8% 4.0% * 2.5% 3.3% 5.3% 9.4% 59.8 3.3% 4.3%
Hospital Emergency Room Visits [2] 11.5% 12.2% 10.9% 15.4% 18.6% 8.5% 4.6% 6.3% 42.0 10.0% 4.2%
Hospital Outpatient Visits [3] 6.8% 6.4% 7.1% 6.8% 8.4% 6.2% 6.5% 4.5% 48.1 7.7% 3.2%
Physician Office Visits [4] 77.8% 77.6% 78.0% 77.8% 70.4% 82.0% 83.6% 79.8% 51.7 78.9% 3.6%
All Lumbar/Low Back Pain Diagnoses 40,531 17,713 22,813 1,088 14,059 15,759 5,049 4,560 1,100,396 3.7%
Percent of Total 44% 56% 3% 35% 39% 12% 11%
Cervical/Neck Pain Proportion of Total Cervical/Neck Diagnoses
Hospital Discharges [1] 2.6% 3.0% 2.3% * 1.8% 2.4% 4.1% 11.9% 55.2 3.3% 1.2%
Hospital Emergency Room Visits [2] 12.9% 13.7% 12.4% 28.8% 20.5% 6.0% 6.9% 8.3% 35.0 10.0% 1.9%
Hospital Outpatient Visits [3] 4.6% 4.9% 4.5% 4.4% 5.2% 4.2% 4.4% 5.7% 46.0 7.7% 0.9%
Physician Office Visits [4] 79.8% 78.4% 80.8% 66.8% 72.5% 87.4% 84.6% 74.1% 48.4 78.9% 1.5%
All Cervical/Neck Pain Diagnoses 16,425 6,753 9,671 959 6,173 7,149 1,506 629 1,100,396 1.5%
Percent of Total 41% 59% 6% 38% 44% 9% 4%
Total Back Pain (Lumbar and Cervical) Diagnoses [5]
Proportion of Total Spinal Diagnoses
Hospital Discharges [1] 3.7% 3.6% 3.7% 1.2% 2.4% 3.1% 5.2% 9.6% 58.9 3.3% 5.3%
Hospital Emergency Room Visits [2] 11.9% 12.5% 11.4% 21.0% 19.1% 7.9% 5.2% 6.6% 40.2 10.1% 5.7%
Hospital Outpatient Visits [3] 6.3% 6.0% 6.5% 6.1% 7.4% 5.7% 6.1% 4.7% 47.9 7.7% 3.9%
Physician Office Visits [4] 78.2% 77.9% 78.4% 71.7% 71.0% 83.3% 83.6% 79.1% 50.9 78.9% 4.8%
All Back Pain Diagnoses 53,027 22,969 30,055 1,868 18,783 21,111 6,177 5,086 1,100,396 4.8%
Percent of Total 43% 57% 4% 35% 40% 12% 10%
* Estimate does not meet standards for reliability
[1] Source: Agency for Healthcare Research and Quality, Healthcare Cost and Utilization Project, Nationwide Inpatient Sample, 2004
[2] Source: National Center for Health Statistics, National Hospital Ambulatory Medical Care Survey, Hospital Emergency, 2004
[3] Source: National Center for Health Statistics, National Hospital Ambulatory Medical Care Survey, Outpatient, 2004
[4] Source: National Center for Health Statistics, National Ambulatory Medical Care Survey, 2004
[5] Diagnosis with both lumbar and cervical pain possible.

The Burden of Musculoskeletal Diseases in the United States - Copyright © 2008
Chapter 2 Spine: Low Back and Neck Pain
44
Table 2.8: Average Length of Hospital Stay (LOS)for Spine Diagnoses, United States 2004
Average LOS (in days)
NIS [1] NHDS [2]
Spinal Deformity & Related Conditions 5.5 5.1
Lumbar/Low Back Pain
Back Disorders 4.7 4.3
Disc Disorders 4.1 3.6
Back Injury 7.3 7.9
All Lumbar and Low Back Pain 4.8 4.5
Cervical/Neck Pain
Neck Disorders 4.3 3.6
Cervical Disc Disorders 3.1 2.8
Neck Injury 8.2 10.2
All Cervical Back Pain 4.7 4.6
Total 4.8 4.6
[1] Source: Agency for Healthcare Research and Quality, Healthcare Cost and UtilizationProject, Nationwide Inpatient Sample, 2004
[2] Source: National Center for Health Statistics, National Hospital Discharge Survey,2004

The Burden of Musculoskeletal Diseases in the United States - Copyright © 2008 45
Spine: Low Back and Neck Pain Chapter 2
Table 2.9: Trends in Physician Visits for Back Pain, United States 1998-2004
Physician Visits for Back PainTotal Number of Patients (in 000s)
1998 1999 2000 2001 2002 2003 2004Physician Visits for Lumbar/Low Back Pain
Back Disorders 15,885 14,787 16,151 21,195 20,040 22,446 21,813 Disc Disorders 3,004 4,563 3,728 5,318 4,997 4,095 6,497 Back Injury 5,252 8,027 6,835 5,152 7,351 5,728 5,454
Total, Back Pain 23,037 25,499 25,019 29,917 29,146 31,028 31,540
Physician Visits for Cervical/Neck PainNeck Disorders 4,337 5,430 4,8074 5,161 6,692 5,868 8,638 Disk Disorders 568 1,917 868 1,646 1,266 1,933 1,690 Neck Injury 4,324 3,804 2,936 3,223 4,777 3,306 3,445
Total, Cervical Back Pain 8,922 10,342 8,266 9,554 11,727 10,720 13,104
Physician Visits for Back Pain (Lumbar and Cervical)Total Visits 31,959 35,842 33,285 39,4714 40,872 41,748 44,644
Physician Visits for Back Pain as Proportion of Total PopulationProportion of Total U.S. Population [1]
1998 1999 2000 2001 2002 2003 2004Physician Visits for Lumbar/Low Back Pain
Back Disorders 5.9% 5.4% 5.7% 7.4% 6.9% 7.6% 7.4%Disc Disorders 1.1% 1.7% 1.3% 1.8% 1.7% 1.4% 2.2%Back Injury 1.9% 2.9% 2.4% 1.8% 2.5% 2.0% 1.8%
Total, Back Pain 8.5% 9.4% 8.8% 10.4% 10.0% 10.6% 10.6%
Physician Visits for Cervical/Neck PainCervical Disorders 1.6% 2.0% 1.7% 1.8% 2.3% 2.0% 2.9%Disk Disorders 0.2% 0.7% 0.3% 0.6% 0.4% 0.7% 0.6%Neck Injury 1.6% 1.4% 1.0% 1.1% 1.6% 1.1% 1.2%
Total, Cervical Back Pain 3.3% 3.8% 2.9% 3.3% 4.0% 3.7% 4.4%
Physician Visits for Back Pain (Lumbar and Cervical)Total Visits 11.8% 13.1% 11.7% 13.7% 14.0% 14.2% 15.1%
[1] Proportion of total population based on U.S. Census Population Estimates as of July 1 for each year.Source: National Center for Health Statistics, National Ambulatory Medical Care Survey,1998- 2004

The Burden of Musculoskeletal Diseases in the United States - Copyright © 2008
Chapter 2 Spine: Low Back and Neck Pain
46
Table 2.10: Work Limitations with Reported Joint or Back Pain forPersons Aged 18 and Over, United States 1999-2004
% Reporting Site Pain
Pain Site Reported
Pain Limits All Work
(11% of population)
Pain LimitsAmount of Work(32% of population)
Pain LimitsAbility to Walk(8% of population)
Low Back Pain 63% 62% 62%
Neck Pain 41% 40% 38%
Headaches 37% 35% 28%Lower Limb (Leg, Foot) 28% 28% 37%Upper limb (Shoulder, Girdle, Arm, Hand) 26% 26% 26%Head 16% 15% 12%Torso (Sternum, Chest, Abdomen) 9% 8% 7%
Source: National Center for Health Statistics. National Health and Nutrition Examination Survey Data, 1999-2004.
Table 2.11: Limitation in Work Due to Back Pain by Gender and Age for Persons Age 18and Over, United States 1999-2004
Proportion of Persons Reporting Work Limitations
Pain Keeps from Working [1] Back Pain Limits Amount of Work Can Do [2]
Status of Back Pain
With BackPain in One
Site [3]
With BackPain in
MultipleSites [4]
No BackPain
ReportedAll Pain
Sites
With BackPain in One
Site [3]
With BackPain in
MultipleSites [4]
No BackPain
ReportedAll Pain
Sites
Gender Male 18% 33% 8% 10% 51% 69% 25% 31%
Female 21% 33% 8% 11% 51% 75% 31% 34%
Age 18-44 years 13% 23% 4% 6% 39% 57% 14% 20%
45-64 years 24% 43% 10% 14% 55% 84% 29% 40%
65-74 years 30% 41% 11% 15% 74% 87% 39% 46%
75 & over 29% 31% 16% 18% 70% 82% 53% 56%
Total 20% 33% 8% 11% 51% 72% 25% 32%
[1] 11% of the population reports a long-term physical, mental or emotional problem keeps them from working.
[2] 32% of the population reports a long-term physical, mental or emotional problem limits the kind or amount of work they can do.
[3] "With respect to pain problem, located in …Low back pain, upper back pain, bu�ocks, neck and spine?"
[4] "With respect to pain problem, located in …multiple sites of back"
Source: National Center for Health Statistics. National Health and Nutrition Examination Survey Data, 1999-2004.

The Burden of Musculoskeletal Diseases in the United States - Copyright © 2008 47
Spine: Low Back and Neck Pain Chapter 2
Table 2.12: Bed and Lost Work Days Associated with Back Pain, United States 2005
Incidence ofReported
Condition (in 000s)
Incidence ofBed Days
(in 000s)
AverageNumber
of Bed Days
Total BedDays
(in 000s)
Incidence ofLost Work
Days (in 000s)
AverageNumber ofWork Days
Lost
Total LostWork Days
(in 000s)
Back/Neck Problem Causes Difficulty with ActivityMale 8,542 4,118 14.4 59,299 2,823 11.9 33,594 Female 11,268 6,514 17.6 114,646 3,537 13.8 48,811 Total 19,810 10,632 16.2 172,238 6,360 12.9 82,044
Neck Pain in Past 3 MonthsMale 13,022 5,998 11.1 66,578 4,774 6.8 32,463 Female 19,271 10,107 14.8 149,584 7,031 9.1 63,982 Total 32,294 16,105 13.3 214,197 11,805 8.1 95,621
Low Back Pain in Past 3 MonthsMale 27,502 11,357 8.1 91,992 9,844 6.3 62,017 Female 34,463 17,609 12.0 211,308 11,813 8.3 98,048 Total 61,965 28,966 10.2 295,453 21,657 7.3 158,096
Radiating Leg Pain (with Low Back Pain)Male 8,480 4,172 17.0 70,924 2,623 12.3 32,263 Female 11,865 6,902 21.9 151,154 3,608 13.5 48,708 Total 20,346 11,074 19.9 220,373 6,230 12.9 80,367
All Spine Pain or ProblemsMale 72,361 13,070 7.5 98,025 11,532 6.2 71,498 Female 71,810 20,644 10.8 222,955 14,394 8.1 116,591 Total 144,171 33,714 9.3 313,540 25,927 7.2 186,674
Source: National Center for Health Statistics, National Health Interview Survey, 2005
Table 2.13: Select Spine Procedures as a Proportion of AllSpine Procedures and Spine Patients, United States 2004
All Spine Procedures [1]
Procedure Number
% of TotalSpine
Procedures
% of TotalSpine
PatientsSpinal diskectomy 325,332 34.1% 56.8%Spinal fusion 307,878 32.3% 53.7%Spinal decompression 160,169 16.8% 27.9%Spinal refusion 18,935 2.0% 3.3%Kyphoplasty 6,221 0.7% 1.1%Vertebroplasty 3,344 0.4% 0.6%Other procedure 131,411 13.8% 22.9%All spine procedures 953,290 100.0% 166.3%Total spine procedure patients 573,170
[1] Multiple procedures performed on some patients
Source: Agency for Healthcare Research and Quality, Healthcare Cost and Utilization Project, NationwideInpatient Sample, 2004

The Burden of Musculoskeletal Diseases in the United States - Copyright © 2008
Chapter 2 Spine: Low Back and Neck Pain
48
Table 2.14: Seven-Year Trend in Spinal Fusion Procedures, United States 1998-2004
ICD-9-CM Description Year
Numberof
Patients
Rate ofYear-to-
YearIncrease
inPatients
Number of
Procedures[1]
Rate ofYear-to-
YearIncrease
inProcedures
MeanAge ofPatient
MeanLength of Stay
MeanHospitali-
zationCharge [2]
Rate ofYear-to-
YearIncreasein MeanCharge
TotalHospitali-
zation Charges
(in billions)
Rate ofYear-to-
YearIncreasein TotalHospitalCharges
81.00-81.08 Spinal Fusion
1998 204,000 220,000 49.0 4.7 $26 ,000 $5.351999 224,000 10% 243,000 11% 48.7 4.6 $29 ,000 10% $6.34 19%2000 242,000 8% 263,000 8% 49.4 4.3 $32 ,000 10% $7.18 13%2001 277,000 14% 305,000 16% 49.4 4.3 $35 ,000 10% $9.66 35%2002 289,000 5% 323,000 6% 50.2 4.4 $42 ,000 17% $11.87 23%2003 310,000 7% 350,000 8% 51.3 4.3 $50 ,000 21% $15.35 29%2004 307,000 -1% 307,000 -12% 51.8 4.5 $56 ,000 11% $16.87 10%
7-Year Change 50% 40% 111% 215%
81.30-81.393
Spinal Refusion [3]
1998 12,000 12,000 47.1 4.6 $26 ,000 $0.301999 14,000 23% 15,000 28% 48.6 4.9 $34 ,000 31% $0.48 60%2000 13,000 -9% 13,000 -12% 49.0 5.4 $39 ,000 13% $0.47 -2%2001 11,000 -14% 12,000 -11% 50.2 4.3 $40 ,000 4% $0.45 -4%2002 19,000 66% 20,000 71% 50.0 4.4 $46 ,000 14% $0.86 91%2003 17,000 -8% 19,000 -8% 51.0 4.4 $55 ,000 19% $0.93 8%2004 19,000 10% 19,000 2% 52.7 4.8 $63 ,000 16% $1.18 26%
7-Year Change 62% 61% 145% 292%
81.00-81.08+
81.30-81.393Total
1998 214,000 231,000 48.9 4.7 $26 ,000 $5.591999 236,000 10% 258,000 11% 48.6 4.6 $29 ,000 11% $6.71 20%2000 253,000 7% 277,000 7% 49.4 4.3 $32 ,000 10% $7.53 12%2001 285,000 13% 317,000 15% 49.5 4.3 $35 ,000 10% $9.97 32%2002 304,000 7% 343,000 8% 50.2 4.3 $42 ,000 17% $12.50 25%2003 324,000 6% 369,000 7% 51.3 4.2 $50 ,000 21% $16.01 28%2004 321,000 -1% 327,000 -11% 51.8 4.5 $56 ,000 11% $17.87 12%
7-Year Change 50% 41% 112% 220%
[1] Up to 15 diagnosis per patient were included multiple spine procedures per patient can be coded
[2] "Charge" refers to hospitalization charges and does not include professional (i.e., physician fees), drugs or non-covered charges
[3] Prior to 2002, spinal refusion procedures were coded to the single code, 81.09. In 2002, this code was dropped and multiple codes implemented.
Source: Agency for Healthcare Research and Quality, Healthcare Cost and Utilization Project, Nationwide Inpatient Sample, 1998-2004

The Burden of Musculoskeletal Diseases in the United States - Copyright © 2008 49
Spine: Low Back and Neck Pain Chapter 2
Table 2.15: Distribution of Spine Fusion Procedures by Spine Section,United States 2004
Spine Fusion Procedures [1]
Number
% of TotalSpine
FusionProcedures
% of TotalSpine
FusionPatients
% of TotalSpine
Patients
Cervical Fusion 134,761 41.2% 44.3% 6.6%
Thoracic or Dorsal Fusion 23,601 7.2% 7.8% 1.2%
Lumbar Fusion 149,516 45.7% 49.2% 7.3%
Spine Refusion Procedures 18,935 5.8% 6.2% 0.9%
Total Spinal Fusion or Refusion Procedures 326,813 100.0% 107.5% 16.1%
Total Spine Fusion Patients 303,904
All Spine Diagnosed Patients 2,036,165
[1] Multiple procedures performed on some patients
Source: Agency for Healthcare Research and Quality, Healthcare Cost and Utilization Project, Nationwide Inpatient Sample,2004
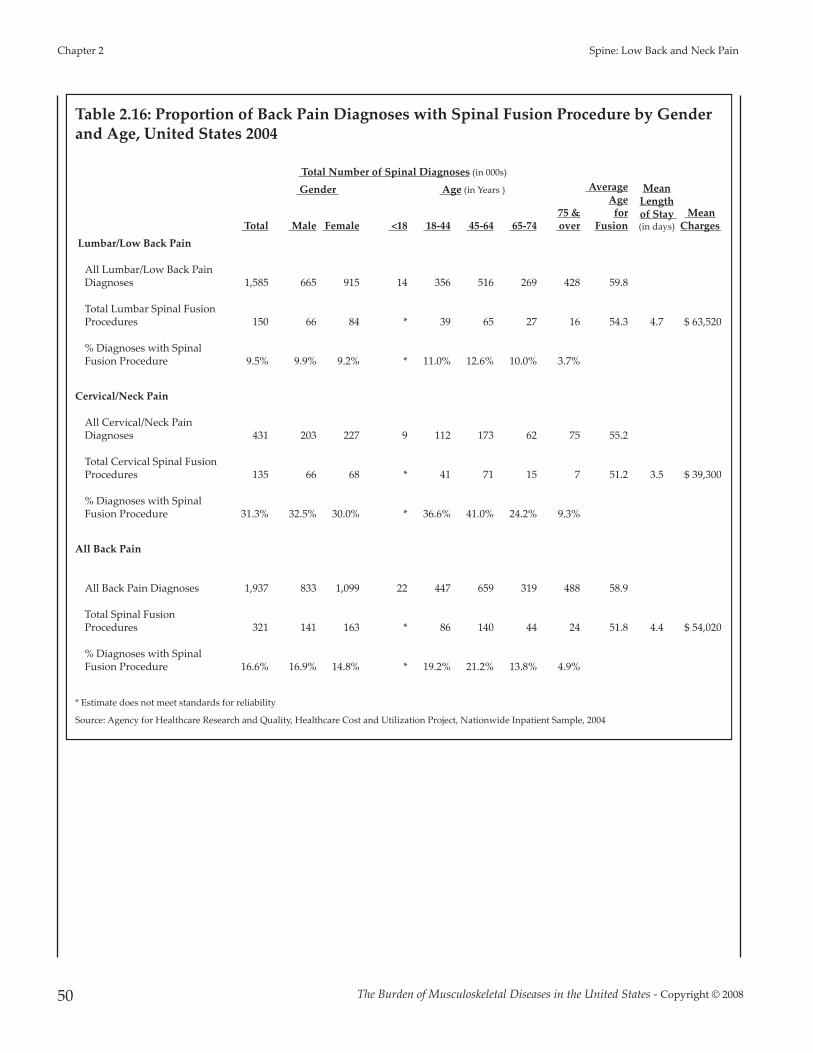
The Burden of Musculoskeletal Diseases in the United States - Copyright © 2008
Chapter 2 Spine: Low Back and Neck Pain
50
Table 2.16: Proportion of Back Pain Diagnoses with Spinal Fusion Procedure by Genderand Age, United States 2004
Total Number of Spinal Diagnoses (in 000s)
MeanLengthof Stay (in days)
MeanCharges
Gender Age (in Years ) AverageAgefor
Fusion Total Male Female <18 18-44 45-64 65-74 75 & over
Lumbar/Low Back Pain
All Lumbar/Low Back PainDiagnoses 1,585 665 915 14 356 516 269 428 59.8
Total Lumbar Spinal FusionProcedures 150 66 84 * 39 65 27 16 54.3 4.7 $ 63,520
% Diagnoses with SpinalFusion Procedure 9.5% 9.9% 9.2% * 11.0% 12.6% 10.0% 3.7%
Cervical/Neck Pain
All Cervical/Neck PainDiagnoses 431 203 227 9 112 173 62 75 55.2
Total Cervical Spinal FusionProcedures 135 66 68 * 41 71 15 7 51.2 3.5 $ 39,300
% Diagnoses with SpinalFusion Procedure 31.3% 32.5% 30.0% * 36.6% 41.0% 24.2% 9.3%
All Back Pain
All Back Pain Diagnoses 1,937 833 1,099 22 447 659 319 488 58.9
Total Spinal FusionProcedures 321 141 163 * 86 140 44 24 51.8 4.4 $ 54,020
% Diagnoses with SpinalFusion Procedure 16.6% 16.9% 14.8% * 19.2% 21.2% 13.8% 4.9%
* Estimate does not meet standards for reliability
Source: Agency for Healthcare Research and Quality, Healthcare Cost and Utilization Project, Nationwide Inpatient Sample, 2004

The Burden of Musculoskeletal Diseases in the United States - Copyright © 2008 51
Spine: Low Back and Neck Pain Chapter 2
Table 2.17: Primary (1st) Diagnosis for Spinal FusionProcedures, United States 2004
DiagnosisNumber ofDiagnoses
% of TotalSpinal Fusion
Procedures
Cervical Disc Displacement 49,667 19.4%
Lumbar Disc Degeneration 33,396 13.1%
Lumbar Disc Displacement 28,398 11.1%
Lumbar Spinal Stenosis 23,499 9.2%
Cervical Spondylosis 20,375 8.0%
Cervical Spondylosis with Myelopathy 16,841 6.6%
Lumbosacral Spondylosis 14,623 5.7%
Cervical Disc Displacement with Myelopathy 12,914 5.0%
Cervical Spinal Stenosis 8,496 3.3%
Cervical Disc Degeneration 7,756 3.0%
Idiopathic Scoliosis 6,724 2.6%
FX Lumbar Vertebra-Closed 3,204 1.3%
Lumbar Postlaminectomy Syndrome 2,325 0.9%
Scoliosis NEC 2,104 0.8%
All Other Diagnoses 25,595 10.0%
All Spine 1st Diagnoses 255,907 100.0%
Source: Agency for Healthcare Research and Quality, Healthcare Cost and Utilization Project, NationwideInpatient Sample, 2004

The Burden of Musculoskeletal Diseases in the United States - Copyright © 2008
Chapter 2 Spine: Low Back and Neck Pain
52
Table 2.18: Health Care Visits for Ruptured Spine and Spinal Diskectomy Procedures,United States 2004
Total Number of Spinal Diagnosis (in 000s)
% ofTotal
Visits
Gender Age (in years)
AverageAge
Health Care Visits for Ruptured(Herniated) Spine Diagnosis [1] Total Male Female <18 18-44 45-64 65-74
75 &over
Hospital Discharges [2] 347.5 170.4 175.1 0.8 126.8 145.5 42.4 31.2 51.4 7.0%
Hospital EmergencyDepartment Visits [3] 113.6 53.9 59.7 0.0 66.5 38.9 8.3 0.0 42.0 2.3%
Hospital Outpatient Visits [4] 198.9 69.1 129.8 0.0 78.7 96.7 19.9 3.6 48.7 4.0%
Physician Office Visits [5] 4,338.6 2,484.3 1,854.3 0.0 1,226.2 2,356.2 674.6 81.5 50.0 86.8%
All Ruptured Spine Diagnoses 4,998.6 2,777.7 2,218.9 0.8 1,498.2 2,637.3 745.2 116.3 100.0%
Percent of Total 55.6% 44.4% 0.0% 30.0% 52.8% 14.9% 2.3%
Spinal Diskectomy Procedure [6]
MeanLengthof Stay (in days)
MeanCharges
Hospital Discharges [2] 325.3 163.2 159.8 1.90 112.9 148.6 40.3 20.7 50.8 2.9 $ 34,580
Physician Office Visits [5]* 164.1 * * * * * * * * NA NA
Diskectomy Procedures 163.2 159.8 1.9 112.9 148.6 40.3 20.7
Percent of Total 50.5% 49.5% 0.6% 34.8% 45.8% 12.4% 6.4%
Proportion of Inpatient [1]Diskectomy Procedures withRuptured Spine Diagnosis 66% 70% 62% 67% 71% 69% 58% 40%
* Estimate does not meet standards for reliability
[1] ICD-9-CM diagnosis codes: 722.00, 722.10, 722.11, 722.20, 722.70, 722.71, 722.72, 722.73
[2] Source: Agency for Healthcare Research and Quality, Healthcare Cost and Utilization Project, Nationwide Inpatient Sample, 2004
[3] Source: National Center for Health Statistics, National Hospital Ambulatory Medical Care Survey, Hospital Emergency, 2004
[4] Source: National Center for Health Statistics, National Hospital Ambulatory Medical Care Survey, Outpatient, 2004
[5] Source: National Center for Health Statistics, National Ambulatory Medical Care Survey, 2004
[6] ICD-9-CM procedure codes: 805.00, 805.10

The Burden of Musculoskeletal Diseases in the United States - Copyright © 2008 53
Spine: Low Back and Neck Pain Chapter 2
Table 2.19: First Diagnosis for Spine Diskectomy Procedures, United States 2004
Diskectomy Procedures (in 000s)
Diagnosis Number % of Total
722.10 Displacement of lumbar intervertebral disc without myelopathy 135.5 41.7%
722.00 Displacement of cervical intervertebral disc without myelopathy 49.9 15.3%
722.52 Degeneration of lumbar intervertebral disc 22.4 6.9%
721.00 Cervical spondylosis without myelopathy 17.8 5.5%
724.02 Spinal stenosis: lumbar region 13.2 4.1%
721.10 Cervical spondylosis with myelopathy 11.9 3.7%
722.71 Intervertebral disc disorder with myelopathy: cervical 11.5 3.5%
721.30 Lumbosacral spondylosis without myelopathy 7.6 2.3%
738.40 Acquired spondylolisthesis 7.5 2.3%
722.40 Degeneration of cervical intervertebral disc 7.1 2.2%
723.00 Spinal stenosis of cervical region 6.5 2.0%
722.73 Intervertebral disc disorder with myelopathy: lumbar 4.3 1.3%
All Other Diagnoses 30.2 9.3%
All Primary 1st Diagnoses 325.2 100.0%
Source: Agency for Healthcare Research and Quality, Healthcare Cost and Utilization Project, Nationwide Inpatient Sample, 2004
Table 2.20: Diskectomy Procedure Trends, United States 1996-2005
Year 1996 1997 1998 1999 2000 2001 2002 2003 2004 200510-Year Mean
Procedures [1](to nearest 000) 285,000 281,000 303,000 303,000 279,000 289,000 319,000 317,000 324,000 292,000 299,000
[1] ICD-9-CM Procedure Code: 501.00
Source: National Center for Health Statistics Centers for Disease Control and Prevention, National Hospital Discharge Survey, 1996-2005. Data extracted andanalyzed by AAOS Dept. of Research and Scientific Affairs.

Chapter 3
Spinal Deformity and Related Conditions
The Burden of Musculoskeletal Diseases in the United States - Copyright © 2008 55
The term spinal deformity includes severalconditions in which the spine is abnormallycurved or aligned. One of the more frequentspinal deformities is scoliosis, or a side to sideabnormal curvature of the spine. Spinal deformityand scoliosis can be found at birth due to geneticcauses, develop during childhood, or develop latein life due to degenerative disc and joint disease.
Common signs of scoliosis are a prominentshoulder, shoulder blade, or chest wallasymmetry. Another sign is uneven hips with onehip seemingly higher than the other. (Figure 3.0.1)It is important not to confuse scoliosis with poor
posture and to realize that scoliosis will usuallynot disappear with age. Other deformities includekyphosis, an exaggerated rounding of the backthat may occur by itself or in conjunction withosteoporosis, and spondylolisthesis, a slippage ofone vertebra onto its neighboring vertebra. Avariety of other spinal deformity conditions willbe discussed in this chapter includingspondylolysis and Scheuermann kyphosis.
In spite of the severity of these conditions and theimpact they have on the lives of children andadults, the prevalence of spinal deformities inchildren under the age of 18 is difficult todetermine due to relatively low numbers and the
degree to which the condition manifests initiallyin pain or disability. Estimated prevalence ofspinal deformity conditions has been cited innumerous studies. (Table 3.1)
Section 3.1: Scoliosis and Spinal Deformityin Children
There are several different types of scoliosis. Themost common type of scoliosis is idiopathic,meaning the cause of the curve is unknown.Approximately 80 to 85% of scoliosis cases areidiopathic.1 Idiopathic scoliosis can initially occur
as early as the first 3 years of life (infantileidiopathic scoliosis), from 4 to 10 years of age(juvenile idiopathic scoliosis), or from 10 years ofage to skeletal maturity (adolescent idiopathicscoliosis). Adolescent idiopathic scoliosis is themost common type.
Scoliosis, if severe enough (>25°), is usuallytreated with bracing if the child is growing orwith surgery if the curvature is more severe (>45°-50°). The standard radiographic/x-raymeasurement technique for all forms of scoliosisis the Cobb angle measurement technique (Figure3.1.1), measured from the end-plates of themaximally tilted end vertebral bodies in a
Figure 3.0.1: Scoliosis

standingradiograph.2
Whether the curve is>25° or >40°-45°, thetreatment ispreventative innature, helping toavoid progression ofthe curve and moresignificant futureproblems if leftuntreated. While thispreventative aspectis hugely valuableand intuitivelyimportant, its benefitis difficult tomeasure from apublic health
standpoint, especially for rare conditions ofchildhood, such as juvenile and adolescentpediatric scoliosis.
Section 3.1.1: Adolescent Idiopathic Scoliosis
According to the Scoliosis Research Society (SRS),idiopathic scoliosis is diagnosed when a patienthas asymmetry on forward bending combinedwith a curve of at least 10°.3 By this definition,the prevalence of adolescent idiopathic scoliosisin children from 10 to 16 years of age is 2%-3%.(Table 3.2 and Graph 3.1.1) Though the male-to-female ratio for smaller curves is about equal,larger curves seem to be more common infemales. Similar results were found in a study
conducted in 1985, where 29,195 children werescreened for idiopathic scoliosis.4
Several studies have investigated the naturalhistory and natural course of curve progression inadolescent idiopathic scoliosis. All report thestrongest predictive factors in the development ofidiopathic scoliosis are age, magnitude of curve,and gender .5-9 Girls are more likely to haveadolescent idiopathic scoliosis than boys, andsome studies report the onset is earlier in girlsthan boys. A factor highly correlated with curveprogression is age at diagnosis; patientsdiagnosed at a younger age have a greater risk ofcurve progression. It should be noted, however,that those diagnosed at a younger age seem tohave a more favorable response to milder forms
of treatment, supporting school screening todetect and lead to earlier diagnosis for thosechildren with a smaller degree of curvature.
The Burden of Musculoskeletal Diseases in the United States - Copyright © 2008
Chapter 3 Spinal Deformity and Related Conditions
56
Figure 3.1.1: Cobb Angle
*Both lines are drawn along the end of thevertebrae that are most tilted from thehorizontal.**The Cobb angle is the angle formed bythe intersection of these two lines.
Graph 3.1.1: Prevalence of Adolescent Idiopathic Scoliosis
Data reprinted with permission from Weinstein SL. Adolescent idiopathicscoliosis: Prevalence and natural history. Instr Course Lect 1988;38:115–126.
Figure 3.1.2: Lenke Classification
Lumbar Spine Modifier
Curve Type (1-6)
Type 1(Main
Thoracic)
Type 2(Double
Thoracic)
Type 3(DoubleMajor)
Type 4(TripleMajor)
Type 5(TL/L)Major)
Type 6(TL/
L.MT)A
(No Curveto
Minimal Curve)1A* 2A* 3A* 4A*
B(Moderate
Curve)1B* 2B* 3B* 4B*
C(Large Curve)
1C* 2C* 3C* 4C* 5C* 6C*
Possible Sagi�alstructural criteria
(to determinespecific curve type)
NormalPT
KyphosisTL
KyphosisPT+TL
Kyphosis
* T5-12 sagi�al alignment modifier: ##, N, or + - : <10°N: 10°-40°+: >40°
Source: Lenke LG, Betz RR, Harms J, et al: Adolescent idiopathicscoliosis: A new classification to determine extent of spinalarthrodesis. J Bone Joint Surg Am 2001;83(8):1169-81.
≥20°
≥20°
≥20°
≥20°
*
* **86°
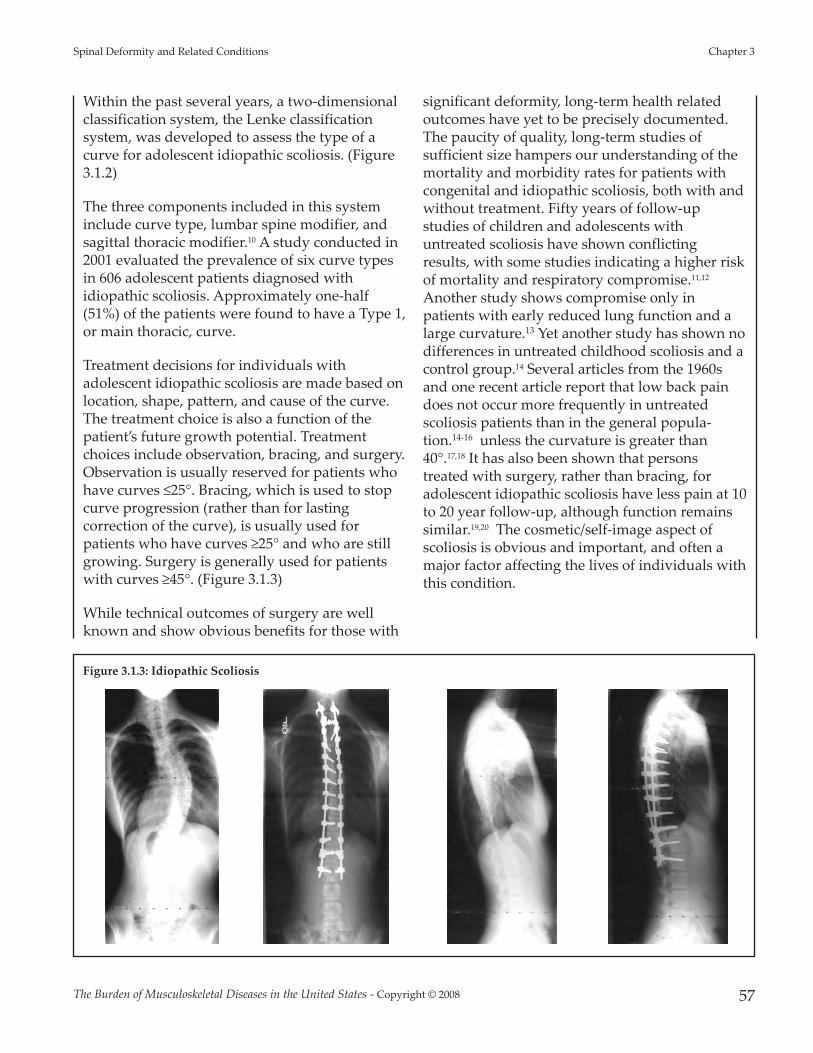
Within the past several years, a two-dimensionalclassification system, the Lenke classificationsystem, was developed to assess the type of acurve for adolescent idiopathic scoliosis. (Figure3.1.2)
The three components included in this systeminclude curve type, lumbar spine modifier, andsagittal thoracic modifier.10 A study conducted in2001 evaluated the prevalence of six curve typesin 606 adolescent patients diagnosed withidiopathic scoliosis. Approximately one-half(51%) of the patients were found to have a Type 1,or main thoracic, curve.
Treatment decisions for individuals withadolescent idiopathic scoliosis are made based onlocation, shape, pattern, and cause of the curve.The treatment choice is also a function of thepatient’s future growth potential. Treatmentchoices include observation, bracing, and surgery.Observation is usually reserved for patients whohave curves ≤25°. Bracing, which is used to stopcurve progression (rather than for lastingcorrection of the curve), is usually used forpatients who have curves ≥25° and who are stillgrowing. Surgery is generally used for patientswith curves ≥45°. (Figure 3.1.3)
While technical outcomes of surgery are wellknown and show obvious benefits for those with
significant deformity, long-term health relatedoutcomes have yet to be precisely documented.The paucity of quality, long-term studies ofsufficient size hampers our understanding of themortality and morbidity rates for patients withcongenital and idiopathic scoliosis, both with andwithout treatment. Fifty years of follow-upstudies of children and adolescents withuntreated scoliosis have shown conflictingresults, with some studies indicating a higher riskof mortality and respiratory compromise.11,12
Another study shows compromise only inpatients with early reduced lung function and alarge curvature.13 Yet another study has shown nodifferences in untreated childhood scoliosis and acontrol group.14 Several articles from the 1960sand one recent article report that low back paindoes not occur more frequently in untreatedscoliosis patients than in the general popula-tion.14-16 unless the curvature is greater than40°.17,18 It has also been shown that personstreated with surgery, rather than bracing, foradolescent idiopathic scoliosis have less pain at 10to 20 year follow-up, although function remainssimilar.19,20 The cosmetic/self-image aspect ofscoliosis is obvious and important, and often amajor factor affecting the lives of individuals withthis condition.
The Burden of Musculoskeletal Diseases in the United States - Copyright © 2008 57
Spinal Deformity and Related Conditions Chapter 3
Figure 3.1.3: Idiopathic Scoliosis

Section 3.1.2: Juvenile Idiopathic Scoliosis
In 12% to 21% of idiopathic scoliosis cases, thediagnosis is made between 4 and 10 years of age.When diagnosed at this age the condition iscalled juvenile idiopathic scoliosis.21 Between theages of 4 and 6, the female-to-male ratio ofjuvenile idiopathic scoliosis is 1:1; however, theratio of female to male cases rises to between 2:1and 4:1 in children between the ages of 4 and 10,and to 8:1 in children who are 10 years of age.21
Both right and left curves are found with equalfrequency for patients younger than 6 years, butrise to a 3:1 ratio of right versus left thoraciccurves after the age of 6.22
Observation is the main treatment for patientswith a small curve less than 20° to 25°. Follow-upvisits are recommended every 4, 6, 9, or 12months depending on the patient’s age, thedegree of the curve, and the characteristics of theclinical deformity.21
Curves between 25° and 50° are usually treatedwith bracing in this age group. Bracing can bedone either on a part-time or full-time basis,depending on the size of the curve as well as theage of the child.21 A study completed in 1982evaluating the success of bracing reported anexcellent prognosis when part-time bracing wasutilized for patients with a curve of ≤35° and rib-vertebra angle difference (RVAD)i of ≤20°;however, curves ≥45° and RVAD of ≥20° had aless favorable prognosis for successful treatmentwith bracing.21
Overall, the curve patterns in patients withjuvenile idiopathic scoliosis are similar to thosewith adolescent idiopathic scoliosis.Approximately 70% of patients with juvenileidiopathic scoliosis exhibit curve progression and
require some form of treatment. In a studyconducted in 1981, 55 of 98 patients (56%) withjuvenile idiopathic scoliosis required spinalsurgery.21 The most common and traditionalsurgery is posterior instrumentation and fusion.21
Section 3.1.3: Infantile Idiopathic Scoliosis
Infantile scoliosis currently accounts for less than1% of all cases of idiopathic scoliosis in theUnited States. Boys are affected by infantileidiopathic scoliosis at a higher rate than girls (3:2ratio).23 Infantile scoliosis curves tend to be left-sided (75%-90%). Past studies have indicated thisrare type of scoliosis occurs more frequently inEurope than in North America.24
Treatment for patients with infantile idiopathicscoliosis is determined by anticipated or actualcurve progression.23 In addition to measuring theCobb angle, the RVAD is used as a commonpredictor of curve progression.25 Patients with aCobb angle of ≤25° and a RVAD of ≤20° are at alow risk for progression and should be re-evaluated every 4 to 6 months.23
Nonoperative treatment, such as bracing orcasting, will be initiated if a curve progression of≥ 10° occurs. Surgical treatment should beconsidered when nonoperative measures,including both bracing and casting, are notsuccessful.23 Surgical treatment is utilized when acurve is ≥ 45° and progressive in an immaturechild.23 Overall, surgical methods are continuallyevolving with the goal of obtaining andmaintaining curve correction whilesimultaneously preserving or encouraging spinaland trunk growth.
Surgical options currently utilized includevarious types of spinal fusion orhemiepiphysiodesis, a minimally invasiveimplant procedure to slow progression of curvegrowth. Additional techniques include growing-rod instrumentation (rods that expand andsupport the deformed spine) and verticalexpandable (telescoping) prosthetic titanium rib(VEPTR) instrumentation.ii (Figure 3.1.4) The goal
The Burden of Musculoskeletal Diseases in the United States - Copyright © 2008
Chapter 3 Spinal Deformity and Related Conditions
58
i RVAD - Rib Vertebral Angle Degree: The angle formed on each sidebetween the apical thoracic vertebra and its corresponding rib. The rib-vertebra angle difference is the difference between the rib-vertebral angle onthe convexity of the curve subtracted from that on the concavity and may beeither a positive or negative value. In a normal spine the rib-vertebra angledifference at any vertebra is zero. Resolving curves are nearly always thoracicand when first seen the rib-vertebral angle difference is less than 20° in 80% ofpatients. The usual pattern is for the rib-vertebral angle difference to decreaseas the curve resolves. (Bradford Book, 1986) Available at:http://www.infantilescoliosis.org/terms.htm. Accessed October 3, 2007.

of using surgical methods is to halt theprogression of the curve and gain correction ofthe deformity, allowing maximum growth of thespine, lungs, and thoraciccage.23
Section 3.1.4: CongenitalScoliosis
Congenital scoliosis isbelieved to affectapproximately 1 child forevery 1000 live births.26 Thecause is unknown in mostcases but in some cases it isassociated with varioussyndromes. (Figure 3.1.5)Diagnosis is occasionallymade during prenatalultrasound. In cases ofcongenital scoliosis,additional congenitalconditions, such as chest wallmalformation or kidney orheart abnormalities, are oftenpresent. Treatment options for congenital
scoliosis are bracing and/orsurgery, and are similar tothose discussed for idiopathicscoliosis. Bracing is not aseffective for congenitalscoliosis as it is for idiopathicscoliosis.
Major abnormal spinaldeformity presenting duringinfancy or early childhoodposes a clinical problembecause of the anticipated longgrowth period (at least 10years); variable presentationand treatment methods; andthe length of time that must
pass before meaningful outcome results can beassessed in the small number of patients fordefinitive studies. Curves that result from
congenital scoliosis are often not treated as easilyas idiopathic curves because the deformity is inthe bones rather than the soft tissue, causing thecurve to be rigid.27
The Burden of Musculoskeletal Diseases in the United States - Copyright © 2008 59
Spinal Deformity and Related Conditions Chapter 3
Growing Rod VEPTR: Back view VEPTR: Side view
Defects of Segmentation
Bilateralfailure of
segmentation
Defects of Formation
Fully segmented Semi-segmented Incarcerated Nonsegmented
Unilateralpartial failureof formation
Hemivertebra Wedge Vertebra
Unilateral failure of
segmentation
Block Vertebra Block Vertebra Unilateral Bar & Hemivertebra
Figure 3.1.5: Congenital Anomalies
Unilateralcompletefailure offormation
ii Titanium Rib or VEPTR (Vertical Expandable Prosthetic Titanium Rib): Anexpandable titanium metal rod placed in a vertical position alongside thespine and attached to the ribs and pelvis or the spine. The VEPTR expandsand supports a deformed chest wall cavity giving the lungs room to operateand grow. Used to treat many chest wall deforming and/or spine defect diag-noses which result in Thoracic Insufficiency Syndrome. Available at:http://www.infantilescoliosis.org/terms.htm. Accessed October 3, 2007.
Figure 3.1.4: Infantile Idiopathic Scoliosis
Source: McMaster MJ: Congenital scoliosis, in: Weinstein SL (ed): The Pediatric Spine: Principles and Practice, ed 2.Philadelphia, PA: Lippinnco� Williams & Wilkins; 2001; p 163.

Section 3.1.5: Neuromuscular Scoliosis
Scoliosis also occurs in conjunction with severalcongenital conditions that occur in infancy orchildhood. These include muscular dystrophy,cerebral palsy, spina bifida, and spinal muscularatrophy. Scoliosis associated with theseconditions is referred to as neuromuscularscoliosis. Both the likelihood and the severity ofthe scoliosis generally increases with the severityof the underlying condition. For example, a childwith severe cerebral palsy who is unable to walkis more likely to have severe scoliosis than a childwith mild cerebral palsy who can walk. Theseconditions are also discussed in Chapter 6(Congenital and Infantile DevelopmentalConditions of the Musculoskeletal System.)
Cerebral palsy (CP) is defined as a non-progressive disturbance in the developing brainof the fetus or infant. Musculoskeletal problemsare frequently seen as a result of the motordisorder. The more common musculoskeletalproblem is scoliosis. Besides bracing, which isusually an ineffective form of treatment for moresevere muscular scoliosis, surgical procedures arefrequently indicated in pediatric patients with CP.In 2005, more than 100,000 children under the ageof 18 were disabled with CP, and its prevalencehas increased by 18% in the past two decades.28
In 1997, 37,000 pediatric patients were dischargedfrom hospitals with a diagnosis of CP. Amongthese patients, spinal fusion with instrumentationwas among the top five most commonlyperformed surgical procedures, and wasperformed on 765 patients that year in the UnitedStates. Treatment for CP with spinal fusionaccounted for more than 4,000 hospital days andcharges of nearly $40 million.28
The prevalence of spina bifida (a failure of thespine—usually, the lower spine—to close andform normally during fetal development) hasdecreased dramatically since the 1970s with theintroduction of folic acid into the diet of pregnantwomen. Since 1990, the annual incidence of spinabifida has been reported at 3.2 cases per 10,000live births, with no variation in ethnic groupsobserved.29
There are several different types of musculardystrophy (i.e., abnormal function of muscle), butall are genetic in cause and due to a lack ofprotein that helps muscle cells function. The mostcommon type is Duchenne muscular dystrophy,and it primarily affects males who inherit adefective gene through their mother.30 Duchennemuscular dystrophy occurs in approximately 1 in3500 live male births.30 Many patients withDuchenne muscular dystrophy develop scoliosisby the age of 12.31 Because muscular dystrophy isusually progressive, patients are typically treatedsurgically, usually with spinal fusion.32 Potentialadvantages of surgery include comfort and sittingtolerance, cosmetic improvement, elimination ofthe need for orthopaedic braces, ease of nursingcare for parents, and pain relief.
Spinal muscular atrophy (SMA) affects eightchildren out of every 100,000 live births. Theprevalence of scoliosis for patients with SMA isdirectly related to the severity of the disease andthe specific type of SMA that the patient has.33
SMA equally affects both females and males.34
There is no specific treatment for SMA, butbracing can slow the inevitable progression of ascoliotic curve and postpone surgical treatment insome cases. Surgical treatment is generally spinalfusion or a segmental spinal instrumentation, andis performed when the curve progresses togreater than 50° to 60°. The goal of surgicaltreatment is to improve balance and sittingcapability of the patient.33
Section 3.2: Other Childhood SpinalConditions
Additional spinal conditions seen in childreninclude spondylolysis, a stress fracture of thelower end of the spine; spondylolisthesis, acondition where one of the spinal vertebrae(usually in the lower/lumbar spine) slips forwardon the one below it; Scheuermann kyphosis, anoften painful condition manifested in exaggeratedroundness of the upper part of the spine; andothers. Occasionally, children have herniateddiscs that require surgical intervention. Childrenalso can have different types of spinal infections
The Burden of Musculoskeletal Diseases in the United States - Copyright © 2008
Chapter 3 Spinal Deformity and Related Conditions
60

and tumors. While most of these conditions arequite rare, they can cause significant disability ifnot recognized early and treated appropriately.Again, the preventative nature of treatment isintuitively obvious, but difficult to measure forthese rare conditions.
Section 3.2.1: Spondylolysis andSpondylolisthesis
Spondylolysis is disintegration or dissolution of avertebra. It is usually accompanied byspondylolisthesis, a forward displacement of alumbar vertebra on the one below it, especiallythe fifth lumbar vertebra on the sacrum,
producing pain by compression of nerve roots.(Figure 3.2.1) Although spondylolysis is virtuallynonexistent in newborns, by the age of 6 theincidence has reached approximately 6% for thegeneral pediatric population. Both spondylolysisand spondylolisthesis are found at higher levelsin certain populations. Examination of Eskimoskeletons indicates the incidence of spondylolysisis 13% in pediatric patients. A study conducted in1953 found an overall incidence of 4.2% in thegeneral pediatric population, with incidence of6.4% in white males, 2.8% in black males, 2.3% inwhite females, and 1.1% in black females. Mostreports have found a higher incidence ofspondylolysis in males than in females (2:1 ratio,respectively), although females have a higher riskof progression.35
Many children with spondylolysis do notexperience back pain and, therefore, may notrequire treatment. If the child remainsasymptomatic, he or she is examined every 3 to 6months; if the child begins to experience pain, abone scan and proper radiographs are often usedto reassess the situation and confirm thediagnosis. Conservative management, such asbracing, may help. Spondylolysis that progressesor remains painful in spite of conservativemeasures, and which interferes with dailyactivities, is treated with a localized spinal fusion.A similar observation/treatment pattern is usedfor children with spondylolisthesis. Surgery isrecommended if the slip of one vertebra over
another is greaterthan 50%. Overall,the goal of surgeryfor either conditionis to stabilize thespondylolyticsegment, preventfurther slippage,relieve pain and/ornerve rootirritation, andpreventneurologicaldeficit. Whenindicated, surgerycan help correct
hamstring tautness, poor posture, andabnormality of gait.34
Section 3.2.2: Scheuermann Kyphosis
Scheuermann kyphosis affects 0.4% to 8% ofhealthy children. Kyphosis is an exaggeratedoutward curvature of the thoracic region of thespinal column resulting in a rounded upper back.(Figure 3.2.2) There is no definitive answer towhether it affects males or females at higher rates,with prevalence leaning to both sexes found instudies.36 Patients who are skeletally mature withacceptable kyphosis (curvature) and noobservable symptoms do not require treatment. Ifthe individual is still growing and the kyphosis issevere, treatment is required, and bracing or
The Burden of Musculoskeletal Diseases in the United States - Copyright © 2008 61
Spinal Deformity and Related Conditions Chapter 3
Figure 3.2.1: Spondylolysis and Spondylolisthesis
Preoperative radiograph CT Scan Postoperative radiograph

casting is usually used, with surgery rarely indi-cated and only for skeletally mature patients withchronic back pain and a curve of more than 60°.34
Section 3.3: Adult Spinal Deformity andDegenerative Scoliosis
Deformity of the adult spine includes patientswith curvature of the spine (scoliosis) of varyingmagnitudes caused or impacted by degenerativedisc and joint disease. Adult scoliosis may be theresult of persistent or progressive deformity sinceadolescence or a new, de novo, onset of deformityas a result of degeneration or "aging" of the spine.Degenerative scoliosis accounts for the majorityof scoliosis cases in older populations aged 65years and older, as reflected in the low proportionof older patients with a diagnosis of primaryidiopathic scoliosis.
The prevalence of adult spinal deformity andscoliosis is not well established, with estimatesranging from 2.5% to 25% of the population.16, 37-41
A recent study reported mild to severe adultscoliosis prevalence as high as 68% in a healthy(no known scoliosis or spine surgery) populationaged 60 and over.42 Many cases of degenerativescoliosis are undiagnosed, but elderly patientsoften seek care because of back and leg pain thatmay be caused by scoliosis and associated spinalstenosis.
Degenerative scoliosis is one of the mostchallenging spine conditions to treat due to thevariability of the condition. It is generally thought
to originate with the degeneration of theintervertebral discs, which leads to misalignmentof the vertebral column. Degenerative scoliosis,particularly in the very elderly, is often associatedwith other conditions, such as osteoporosis.Treatment outcomes for both nonsurgical andsurgical procedures are not well documented;hence, recognition and earlier intervention areimportant to ward off the more complexproblems of adult scoliosis. The role played byundiagnosed, mild idiopathic adolescent scoliosison the development of degenerative scoliosis inlater life is unknown.
Section 3.4: Health Care Resource Use forSpinal Deformity in 2004
While the incidence of spinal deformity amongpatients seeking care in any given year can beestimated, the relatively low proportion of thepopulation seeking care for spinal deformityconditions precludes statistically reliablenumbers. In addition, many persons do not seekcare, or seek care for severe or disabling back orleg pain that is often caused by spinal deformity.Hence, the overall prevalence of spinal deformityin the total population is projected to be muchhigher than current data implies. Furthermore,degenerative scoliosis is rarely a primary, or 1st,
The Burden of Musculoskeletal Diseases in the United States - Copyright © 2008
Chapter 3 Spinal Deformity and Related Conditions
62
Graph 3.4.1: Health Care Resource Visits for SpinalDeformity and Related Conditions Diagnosis, United States 2004
[1] Source: Agency for Healthcare Research and Quality, Healthcare Costand Utilization Project, Nationwide Inpatient Sample, 2004[2] Source: National Center for Health Statistics, National HospitalAmbulatory Medical Care Survey, Hospital Emergency, 2004[3] Source: National Center for Health Statistics, National HospitalAmbulatory Medical Care Survey, Outpatient, 2004[4] Source: National Center for Health Statistics, National AmbulatoryMedical Care Survey, 2004* Estimate does not meet standards for reliability
Figure 3.2.2: Scheuermann Kyphosis
Note the increasedcurvature of the upperback associated withwedging and end plateirregularity of individualvertebrae at the apex.
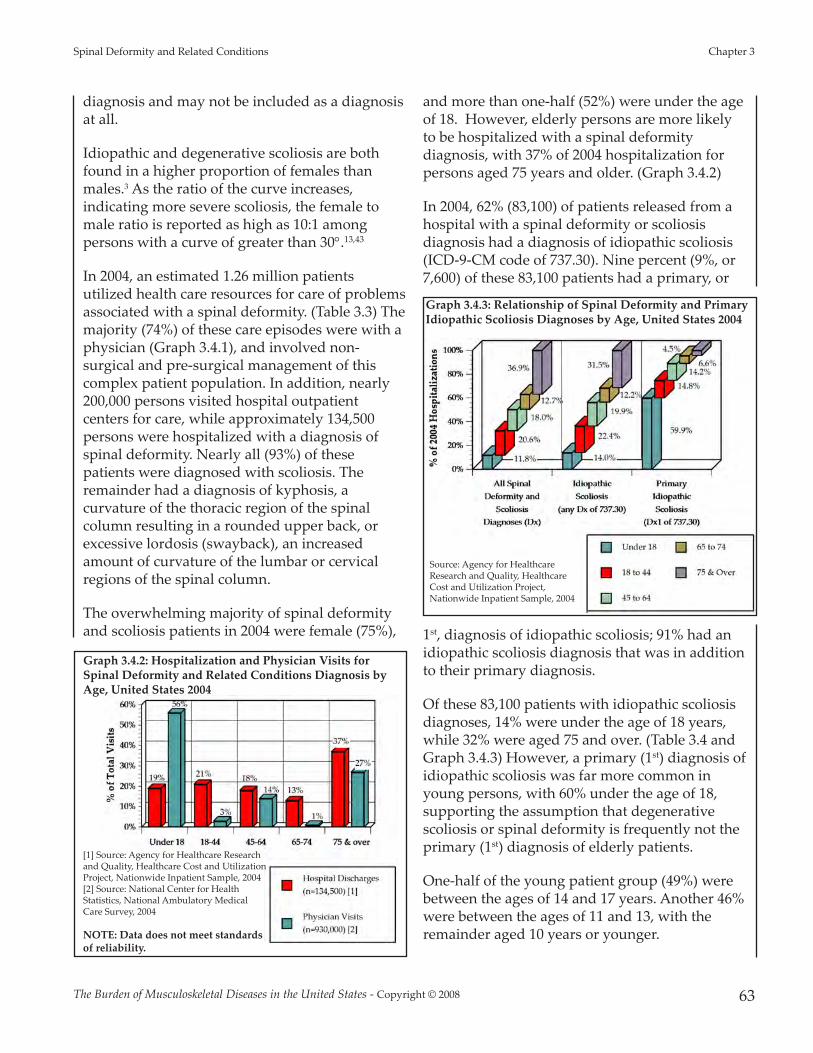
diagnosis and may not be included as a diagnosisat all.
Idiopathic and degenerative scoliosis are bothfound in a higher proportion of females thanmales.3 As the ratio of the curve increases,indicating more severe scoliosis, the female tomale ratio is reported as high as 10:1 amongpersons with a curve of greater than 30°.13,43
In 2004, an estimated 1.26 million patientsutilized health care resources for care of problemsassociated with a spinal deformity. (Table 3.3) Themajority (74%) of these care episodes were with aphysician (Graph 3.4.1), and involved non-surgical and pre-surgical management of thiscomplex patient population. In addition, nearly200,000 persons visited hospital outpatientcenters for care, while approximately 134,500persons were hospitalized with a diagnosis ofspinal deformity. Nearly all (93%) of thesepatients were diagnosed with scoliosis. Theremainder had a diagnosis of kyphosis, acurvature of the thoracic region of the spinalcolumn resulting in a rounded upper back, orexcessive lordosis (swayback), an increasedamount of curvature of the lumbar or cervicalregions of the spinal column.
The overwhelming majority of spinal deformityand scoliosis patients in 2004 were female (75%),
and more than one-half (52%) were under the ageof 18. However, elderly persons are more likelyto be hospitalized with a spinal deformitydiagnosis, with 37% of 2004 hospitalization forpersons aged 75 years and older. (Graph 3.4.2)
In 2004, 62% (83,100) of patients released from ahospital with a spinal deformity or scoliosisdiagnosis had a diagnosis of idiopathic scoliosis(ICD-9-CM code of 737.30). Nine percent (9%, or7,600) of these 83,100 patients had a primary, or
1st, diagnosis of idiopathic scoliosis; 91% had anidiopathic scoliosis diagnosis that was in additionto their primary diagnosis.
Of these 83,100 patients with idiopathic scoliosisdiagnoses, 14% were under the age of 18 years,while 32% were aged 75 and over. (Table 3.4 andGraph 3.4.3) However, a primary (1st) diagnosis ofidiopathic scoliosis was far more common inyoung persons, with 60% under the age of 18,supporting the assumption that degenerativescoliosis or spinal deformity is frequently not theprimary (1st) diagnosis of elderly patients.
One-half of the young patient group (49%) werebetween the ages of 14 and 17 years. Another 46%were between the ages of 11 and 13, with theremainder aged 10 years or younger.
The Burden of Musculoskeletal Diseases in the United States - Copyright © 2008 63
Spinal Deformity and Related Conditions Chapter 3
Graph 3.4.2: Hospitalization and Physician Visits forSpinal Deformity and Related Conditions Diagnosis byAge, United States 2004
[1] Source: Agency for Healthcare Researchand Quality, Healthcare Cost and UtilizationProject, Nationwide Inpatient Sample, 2004[2] Source: National Center for HealthStatistics, National Ambulatory MedicalCare Survey, 2004
NOTE: Data does not meet standardsof reliability.
Graph 3.4.3: Relationship of Spinal Deformity and PrimaryIdiopathic Scoliosis Diagnoses by Age, United States 2004
Source: Agency for HealthcareResearch and Quality, HealthcareCost and Utilization Project,Nationwide Inpatient Sample, 2004

Nearly all patient visits to a physician’s office in2004 with a primary (1st) diagnosis of idiopathicscoliosis (93%) were for patients under the age of18 years. Again, the majority (74%) were betweenthe ages of 14 and 17 years; however, childrenbetween the ages of 8 and 10 comprised 16% ofthe remaining patients, with the balance aged 11to 13 years. (Table 3.5)
Although a larger proportion of personsdiagnosed with a spinal deformity or scoliosis in2004 were aged 75 and over (31%) compared toyounger persons (16% under age 18), asignificantly higher proportion under the age of18 with a spinal deformity diagnosis underwentspine surgical procedures for their condition. Onein three (33%) persons hospitalized with a spinaldeformity or scoliosis diagnosis under the age of
18 years underwent surgery, while only 1 in 7(14%) aged 75 and over underwent surgery.(Graph 3.4.4)
Section 3.4.1: Estimated 2004 Cost for Treatmentof Scoliosis and Spinal Deformity
A conservative estimate of the hospitalization costfor adult scoliosis in 2004 was $315.3 million. Thisestimate, which generally does not includeprofessional fees, is based on the average cost per
hospital stay for four age groups of patients aged18 and over with a primary (1st) diagnosis ofidiopathic scoliosis. Child and adolescent primaryidiopathic scoliosis hospitalization fees added anadditional $373.7 million, for a total estimatedhospitalization cost to treat primary idiopathicscoliosis in 2004 of $688.1 million. (Table 3.4)
Additional hospital costs of more than $2.0 billionwere incurred by patients with a diagnosis ofidiopathic scoliosis in addition to their primary(1st) diagnosis. It is unknown what proportion ofthese costs resulted directly from treatment givenas a result of scoliosis; however, it can beassumed some proportion of these additionalcosts would not have occurred in the absence ofthe scoliosis condition.
In addition to health care costs associated withsurgery for spinal deformity and scoliosis,significant nonsurgical resources are utilized byadults with scoliosis, increasing the burden of thiscondition on the health care system. A study ofnonsurgical resource use, including exercise,bracing, medications, steroid injections, andformal pain management, by adults with a spinalcurvature of ≥30° showed 90% of patients utilizednon-surgical resources, with those patients with ahigh level of symptoms using more resourcesthan those with a low level of symptoms.44
Overall, the cost related to spinal deformity issignificant, with more than one million patientvisits each year for treatment of pain due to thiscondition. A majority of spinal deformity caseseach year are the result of degenerative scoliosis.With the aging of the U.S. population, increasedawareness, identification, and treatment of spinaldeformity in its earliest stages is necessary toreduce the current and future burden of thiscondition.
1. National Institute of Arthritis and Musculoskeletal andSkin Diseases (NIAMS): Questions and answers aboutscoliosis in children and adolescents. NationalInstitutes of Health, U.S. Department of Health andHuman Services, 2007. Available at:http://www.niams.nih.gov/Health_Info/Scoliosis/default.asp. Accessed August 30, 2007.
The Burden of Musculoskeletal Diseases in the United States - Copyright © 2008
Chapter 3 Spinal Deformity and Related Conditions
64
Graph 3.4.4: Relationship of Scoliosis Diagnosis andSpine Surgical Procedures by Age, United States 2004
Source: Agency for Healthcare Research and Quality, Healthcare Cost andUtilization Project, Nationwide Inpatient Sample, 2004

2. Herzenberg JE, Waanders NA, Closkey RF, et al: Cobbangle versus spinous process angle in adolescentidiopathic scoliosis: The relationship of the anterior andposterior deformities. Spine 1990;15:874-879.
3. Lonstein J: Scoliosis: surgical versus nonsurgicaltreatment. Clin Ortho Relat Res 2006;443:248-259.
4. Morais T, Bernier M, Turcotte F: Age- and sex-specificprevalence of scoliosis and the value of schoolscreening programs. Am J Public Health Nations Health1985;75:1377-1380.
5. Bunnell W: Spinal deformity. Pediatr Clin North Am1986;33:1475-1487.
6. Weinstein S: Idiopathic scoliosis: Natural history. Spine1986;11:780-783.
7. Karol LA, Johnston CE 2nd, Browne RH, Madison M:Progression of the curve in boys who have idiopathicscoliosis. J Bone Joint Surg Am 1993;75:1804-1810.
8. Porter SB, Blount BW: Pseudotumor of infancy andcongenital mascular torticollis. Am Fam Physician1995;52:1731-1736.
9. Willner S: Continuous screening and treatment ofteenage scoliosis is recommended. Lakartidningen1994;91:22.
10. Lenke LG, Betz RR, Clements D, et al: Curve prevalenceof a new classification of operative adolescentidiopathic scoliosis: Does classification correlate withtreatment? Spine 2002;27:604-611.
11. Goldberg CJ, Gillic I, Connaughton O, et al: Respiratoryfunction and cosmesis at maturity in infantile-onsetscoliosis. Spine 2003;28:2397-2406.
12. Pehrsson K, Larsson S, Oden A, Nachemson A: Long-term follow-up of patients with untreated scoliosis: Astudy of mortality, causes of death, and symptoms.Spine 1992;17:1091-1096.
13. Pehrsson K, Bake B, Larsson S, Nachemson A: Lungfunction in adult idiopathic scoliosis: a 20 year followup. Thorax 1991;46:474-478.
14. Weinstein SL, Dolan LA, Spratt KF, et al: Health andfunction of patients with untreated idiopathic scoliosis:a 50-year natural history study. JAMA 2003;289:559-567.
15. Nachemson A: A long term follow-up study of non-treated scoliosis. Acta Orthop Scand 1968;39:466-476.
16. Nilsonne U, Lundgren KD: Long term prognosis inidiopathic scoliosis. Acta Orthop Scand 1968;39:456-465.
17. Kostuik JP, Bentivoglio J: The incidence of low-backpain in adult scoliosis. Spine 1981;6:268-273.
18. Haefeli M, Elfering A, Kilian R, et al: Nonoperativetreatment for adolescent idiopathic scoliosis: a 10- to60-year follow-up with special reference to healthrelated quality of life. Spine 2006;31:355-366.
19. Andersen MO, Christensen SB, Thomsen K: Outcomeat 10 years treatment for adolescent idiopathic scoliosis.Spine 2006;31:350-354.
20. Danielsson AJ, Romberg K, Nachemson AL: Spinalrange of motion, muscle endurance, and back pain andfunction at least 20 years after fusion or brace treatmentfor adolescent idiopathic scoliosis: A case-control study.Spine 2006;31:275-283.
21. Lenke LG, Dobbs MB: Management of juvenileidiopathic scoliosis. J Bone Joint Surg Am 2007;89:55-63.
22. Warner WC Jr.: Juvenile idiopathic scoliosis, inWeinstein S (ed): The Pediatric Spine: Principles andPractice, ed 2. Philadelphia, PA: Lippincott Williams &Wilkins, 2001, p 330.
23. Akbarnia B: Management themes in early onsetscoliosis. J Bone Joint Surg Am 2007;89:42-54.
24. Fernandes P, Weinstein SL: Natural history of earlyonset scoliosis. J Bone Joint Surg Am 2007;89:21-33.
25. Mehta M: The rib-vertebra angle in the early diagnosisbetween resolving and progressive infantile scoliosis.J Bone Joint Surg Br 1972;54:230-243.
26. Hedequist D, Emans J: Congenital scoliosis: A reviewand update. J Pediatr Orthop 2007;27:106-116.
27. Lonstein J: Scoliosis, in Lovell WW, Winter RB,Morrissy RT, Weinstein SL (ed): Lovell and Winter’sPediatric Orthopaedics, ed 4. Philadelphia, PA: LippincottWilliams Wilkins, 1996, vol II.
28. Murphy NA, Hoff C, Jorgensen T, et al: A nationalperspective of surgery in children with cerebral palsy.Pediatr Rehabil 2006;9:293-300.
29. Kaufmann B: Congenital intraspinal anomalies: spinaldysraphism-embrology, pathology, and treatment, inBridwell KH, DeWald RL (ed): The Textbook of SpinalSurgery, ed 2. Philadelphia, PA: Lippincott-Raven, 1997,vol 1, p 366.
30. Thompson G: Neuromuscular disorders, in Lovell WW,Winter RB, Morrissy RT, Weinstein SL (ed): Lovell andWinter’s Pediatric Orthopaedics, ed 4. Philadelphia, PA:Lippincott Williams & Wilkins, 1996, vol I.
31. Shook JE, Lubicky JP: Paralytic scoliosis, in BridwellKH, DeWald RL (ed): The Textbook of Spinal Surgery, ed2. Philadelphia, PA: Lippincott-Raven Publishers, 1997,vol 1.
32. Cheuk DKL, Wong V, Wraige E, et al: Surgery forscoliosis in Duchenne muscular dystrophy. Available at:http://www.mrw.interscience.wiley.com/cochrane/clsysrev/articles/CD005375/frame.html. Accessed August 28,2007.
33. Sucato D: Spine deformity in spinal muscular atrophy.J Bone Joint Surg Am 2007;89:148-154.
34. Tachdjian MO: Pediatric Orthopaedics, ed 2.Philadelphia, PA: WB Saunders, 1999, vol 3.
35. Hu SS, Bradford DS: Spondylolysis andspondylolisthesis, in Weinstein S (ed): The PediatricSpine: Principles and Practice, ed 2. Philadelphia, PA:Lippincott Williams & Wilkins, 2001, pp 433-434.
36. Ascani E, La Rosa G, Ascani C: Scheuermann kyphosis,in Weinstein S (ed): The Pediatric Spine: Principles andPractice, ed 2. Philadelphia, PA: Lippincott Williams &Wilkins, 2001, p 415.
37. Battie MC, Videman T: Lumbar disc degeneration:Epidemiology and genetics. J Bone Joint Surg Am2006;88:3-9.
38. Gupta M: Degenerative scoliosis: Options for surgicalmanagement. Ortho Clin North Am 2003;34:269-279.
The Burden of Musculoskeletal Diseases in the United States - Copyright © 2008 65
Spinal Deformity and Related Conditions Chapter 3

39. Carter OD, Haynes SG: Prevalence rates for scoliosis inU.S. adults: Results from the first National Health andNutrition Examination Survey. Int J Epidemiol1987;16:537-544.
40. Perennou D, Marcelli C, Herisson C, Simon L: Adultlumbar scoliosis: Epidemiologic aspects in a low-backpain population. Spine 1994;19:123-128.
41. Robin GC, Span Y, Steinberg R, et al: Scoliosis in theelderly: A follow-up study. Spine 1982;7:355-359.
42. Schwab F, Dubey A, Galez L, et al: Adult scoliosis:Prevalence, SF-36, and nutritional parameters in anelderly volunteer population. Spine 2005;30:1082-1085.
43. Manson NE, Goldberg EJ, Andersson GBJ: Sexualdimorphism in degenerative disorders of the spine.Orthop Clin N Am 2006;37:549-553.
44. Glassman SD, Berven S, Kostuik J, et al: Nonsurgicalresource utilization in adult spinal deformity. Spine2006;31:941-947.
The Burden of Musculoskeletal Diseases in the United States - Copyright © 2008
Chapter 3 Spinal Deformity and Related Conditions
66
Section 3.5: Spinal Deformity and Related Conditions Data Tables
Table 3.1: Estimated and Normalized Prevalence of Spinal Deformity and RelatedConditions
Cited Prevalence Rate(midpoint of range cited)
NormalizedPrevalence Rate
(per 100 persons) Prevalence Rate
(per 100,000 persons)
Congenital scoliosis [1] 1 in 1,000 0.100 100 Infantile idiopathic scoliosis [2] 0.04 in 100 0.040 40 Juvenile idiopathic scoliosis [3] 0.06 in 100 0.060 60 Adolescent idiopathic scoliosis [4] 2.5 in 100 2.500 2,500 Spina bifida [5] 4.6 in 10,000 0.046 46 Cerebral palsy [6] 0.001 in 100 0.001 1 Muscular Dystrophy [7] 1 in 3,500 0.029 29 Spondylolysis, age 6 [8] 6 in 100 6.000 6,000 Spinal muscular atrophy [9] 8 in 100,000 0.008 8 Scheuermann kyphosis [9,10] 4 in 100 4.000 4,000 Adult spinal deformity or scoliosis (age >18 yrs) [11,12,13] 11.3 in 100 11.300 11,300 Adult spinal deformity or scoliosis (age >60 yrs) [14] 68 in 100 68.000 68,000
[1] Hedequist D, Emans J: Congenital scoliosis: a review and update. Journal of Pediatric Orthopaedics 2007:27:106-116.[2] Akbarnia B: Management themes in early onset scoliosis. J Bone Joint Surg Am 2007:89:42-54 (Prevalence rate computed based on cited rate foradolescent idiopathic scoliosis and proportion of total idiopathic cases that are infantile in citation.)[3] Lenke LG, Dobbs MB: Management of juvenile idiopathic scoliosis. J Bone Joint Surg Am 2007:89:55-63 (Prevalence rate computed based on cited ratefor adolescent idiopathic scoliosis and proportion of total idiopathic cases that are juvenile in citation.)[4] Morais T, Bernier M, Turco�e F: Age- and sex-specific prevalence of scoliosis and the value of school screening programs. Am J Public Health NationsHealth 1985:75:1377-1380.[5] Kaufmann B: Congenital intraspinal anomalies: spinal dysraphism-embrology, pathology, and treatment, in Bridwell KH, DeWald RL (ed): The textbookof spinal surgery, ed 2. Philadelphia, PA: Lippinco�-Raven Publishers, 1997, vol 1, p 366[6] Murphy NA, Hoff C, Jorgensen T, et. al.: A national perspective of surgery in children with cerebral palsy. Pediatr Rehabil 2006:9:293-300 (Note: rate wascomputed based on census population and cited number of cases)[7] Thompson G: Neuromuscular disorders, in Lovell WW, Winter RB, Morrissy RT, Weinstein SL (ed): Lovell and Winter's pediatric orthopaedics, ed 4.Philadelphia, PA: Lippinco� Williams and Wilkins, 1996, vol I.[8] Hu SS, Bradford DS: Spondylolysis and spondylolisthesis, in Weinstein S (ed): The pediatric spine: principles and practice, ed 2. Philadelphia, PA:Lippinco� Williams & Wilkins, 2001, pp 433-434
[9] Sucato D: Spine deformity in spinal muscular atrophy. Journal of Bone and Joint Surgery American 2007:89:148-154[10] Ascani E, La Rosa G, Ascani C Scheuermann kyphosis, in Weinstein S (ed): The pediatric spine: principles and practice, ed 2. Philadelphia, PA:Lippinco� Williams & Wilkins, 2001, p 415
[11] Ba�ie MC, Videman T: Lumbar disc degeneration: epidemiology and genetics. J Bone Joint Surg Am 2006:88:3-9 [12] Carter OD, Haynes SG: Prevalence rates for scoliosis in U.S. adults: results from the first National Health and Nutrition Examination Survey. Int JEpidemiol 1987:16:537-544
[13] Gupta M: Degenerative scoliosis: options for surgical management. Ortho Clin North Am 2003;34:269-279.[14] Schwab F, Dubey A, Galez L, et al.: Adult scoliosis: prevalence, SF-36, and nutritional parameters in an elderly volunteer population. Spine2005:30:1082-1085

The Burden of Musculoskeletal Diseases in the United States - Copyright © 2008 67
Spinal Deformity and Related Conditions Chapter 3
Table 3.2: Prevalence of Adolescent Idiopathic Scoliosis
Cobb Angle Female-to-Male Ratio Prevalence (%)>10 1.4-2.0 : 1 2.0%-3.0%>20 5.4 : 1 0.3%-0.5%>30 10 : 1 0.1%-0.3%>40 Not applicable <0.1%
Source: Reprinted with permission from Weinstein SL. Adolescent idiopathic scoliosis: Prevalence andnatural history. Instr Course Lect 198838:115–126.
Table 3.3: Health Care Resource Usage with Spinal Deformity and Related ConditionsDiagnosis by Gender and Age, United States 2004
Total Occurrences (in 000s)[1]
Gender Age (in years) Average Age at
Diagnosis Total Male Female <18 18-44 45-64 65-74 75 &over
Spinal Deformity & Related Conditions
Hospital Discharges [2] 134 32 102 16 28 24 17 50 57.1
Hospital Emergency Departments [3]* 13 11 3 * * * * * 24.2
Hospital Outpatient Departments [4] 187 79 107 122 17 21 4 21 26.9
Physician Office Visits [5]* 930 191 739 519 27 129 8 247 36.2
All Spinal Deformity & RelatedConditions Diagnoses 1,264 313 951 657 72 174 29 318
Spinal Deformity & Related Conditions
Hospital Discharges [2] 11% 24% 76% 11.9% 20.9% 17.9% 12.0% 37.3%
Hospital Emergency Departments [3]* 1% 79% 21% * * * * *Hospital Outpatient Departments [4] 15% 42% 57% 66.0% 9.1% 11.2% 2.1% 11.2%
Physician Office Visits [5]* 74% 21% 79% 55.8% 2.9% 13.9% 0.9% 26.6%
All Spinal Deformity & RelatedConditions Diagnoses 100% 25% 75% 52.0% 5.7% 13.8% 3.0% 25.2%
* Estimate does not meet standards for reliability
[1] Multiple occurrences per patient possible
[2] Source: Agency for Healthcare Research and Quality, Healthcare Cost and Utilization Project, Nationwide Inpatient Sample, 2004
[3] Source: National Center for Health Statistics, National Hospital Ambulatory Medical Care Survey, Hospital Emergency, 2004
[4] Source: National Center for Health Statistics, National Hospital Ambulatory Medical Care Survey, Outpatient, 2004
[5] Source: National Center for Health Statistics, National Ambulatory Medical Care Survey, 2004

The Burden of Musculoskeletal Diseases in the United States - Copyright © 2008
Chapter 3 Spinal Deformity and Related Conditions
68
Table 3.4: Hospitalization and Mean Hospital Cost [1] for Idiopathic Scoliosis by Genderand Age, United States 2004
All Diagnoses
Proportionby Age
and GenderGroup
ProportionAll SpinalDeformity
Diagnoses ofTotal Group
Mean Hospital
Charge
Mean Hospital Length of Stay
EstimatedTotal Cost (in millions)
ProportionEstimated
Cost by Age Group
Hospital Discharges with Scoliosis Diagnosis (All Diagnoses, All Cases)
(n=130,765) (n=134,482)
TOTAL 134,538 $ 33,927 5.5 $ 4,564.5
Male 32,345 24%
Female 101,991 76%
<18 15,888 11.8% $ 56,197 6.2 $ 892.9 19.6%
18-44 27,737 20.6% $ 29,202 5.2 $ 810.0 17.7%
45-64 24,165 18.0% $ 42,179 5.2 $ 1,019.3 22.3%
65-74 17,124 12.7% $ 39,280 5.1 $ 672.6 14.7%
75 & over 49,568 36.9% $ 23,862 5.7 $ 1,182.8 25.9%
18 & over 118,594 88.1% $ 3,684.7 80.7%
Hospital Discharges with Idiopathic Scoliosis Diagnosis (Dx=737.30)
(n=80,570) (n=83,038)
TOTAL 83,093 61.8% $ 32,843 5.5 $ 2,729.0
Male 20,327 24.5% 62.8%
Female 62,608 75.3% 61.4%
<18 11,606 14.0% 73.0% $ 51,307 5.8 $ 595.5 21.8%
18-44 18,597 22.4% 67.0% $ 28,433 5.4 $ 528.8 19.4%
45-64 16,495 19.9% 68.3% $ 37,642 5.3 $ 620.9 22.8%
65-74 10,172 12.2% 59.4% $ 33,940 4.8 $ 345.2 12.7%
75 & over 26,167 31.5% 52.8% $ 24,656 5.8 $ 645.2 23.6%
18 & over 71,431 86.0% 60.2% $ 2,140.1 78.4%
[1] Generally, total charges do not include professional fees and non-covered charges. In the rare cases where professional fees cannot be removed, they areincluded in the database. Emergency department charges incurred prior to admission to the hospital may be included in total charges.
Source: Agency for Healthcare Research and Quality, Healthcare Cost and Utilization Project, Nationwide Inpatient Sample, 2004

The Burden of Musculoskeletal Diseases in the United States - Copyright © 2008 69
Spinal Deformity and Related Conditions Chapter 3
Table 3.4: Hospitalization and Mean Hospital Cost [1] for Idiopathic Scoliosis by Genderand Age, United States 2004 (continued)
All Idiopathic
ScoliosisDiagnoses
Proportionby Age
and GenderGroup
ProportionAll SpinalDeformity
Diagnoses ofTotal Group
Mean Charge
Mean Hospital
Lengthof Stay
EstimatedTotal Cost (in millions)
ProportionEstimated
Cost by Age Group
Hospital Discharges with Primary Diagnosis of Idiopathic Scoliosis (Dx1=737.30)
(n=7038) (n=7582)TOTAL 7,583 9.1% $ 90,772 6.1 $688.3
Male 2,087 27.7% 10.3%
Female 5,440 72.3% 8.7%
<18 4,545 59.9% 39.1% $ 82,225 5.4 $373.7 54.3%18-44 1,119 14.8% 6.0% $ 105,895 5.8 $118.5 17.2%
45-64 1,078 14.2% 6.5% $ 144,510 10.3 $155.8 22.6%
65-74 502 6.6% 4.9% $ 64,915 4.6 $32.6 4.7%
75 & over 339 4.5% 1.3% $ 24,790 6.1 $8.4 1.2%
18 & over 3,038 40.1% 2.6% $315.3 45.8%
Hospital Discharges with Pediatric Idiopathic Scoliosis Diagnosis (Age <18 Years)
IdiopathicScoliosis
Diagnosis inUnder 18
Population (All Diagnoses)
ProportionIdiopathic in
All SpinalDeformity
Diagnoses byAge Group
Primary (1st)Diagnosis
ProportionPrimary in All
IdiopathicDiagnoses by
Age Group
TOTAL 11,606 4,545 39.1%
0-3 664 5.7% * 0.0%
4-7 772 6.7% 44 1.0%
8-10 1,152 9.9% 197 4.3%
11-13 3,180 27.4% 2,069 45.5%
14-17 5,839 50.3% 2,180 48.0%
[1] Generally, total charges do not include professional fees and non-covered charges. In the rare cases where professional fees cannot be removed, they areincluded in the database. Emergency department charges incurred prior to admission to the hospital may be included in total charges.
Source: Agency for Healthcare Research and Quality, Healthcare Cost and Utilization Project, Nationwide Inpatient Sample, 2004

The Burden of Musculoskeletal Diseases in the United States - Copyright © 2008
Chapter 3 Spinal Deformity and Related Conditions
70
Table 3.5: Physician Office Visits for Idiopathic Scoliosis* by Gender and Age, United States 2004
Physician Office Visits for Spinal Deformity (All Diagnoses, All Cases)*
Primary Diagnosis Idiopathic Scoliosis (Dx1=737.30)
AllDiagnoses
of SpinalDeformity
ProportionAll SpinalDeformity
by Age andGender
Primary Idiopathic
Scoliosis
ProportionPrimary
IdiopathicDiagnosis
by Age andGender
ProportionPrimary
Idiopathicto All
IdiopathicDiagnosis
TOTAL 929,610 TOTAL 352,569 69.0%
Male 190,685 21% Male 111,346 31.6% 72.5%Female 738,925 80% Female 241,223 68.4% 67.5%
<18 519,015 55.8% <18 326,996 92.7% 79.9%18-44 26,741 2.9% 18-44 * 0.0% 0.0%45-64 128,781 13.9% 45-64 * 0.0% 0.0%65-74 7,599 0.8% 65-74 * 0.0% 0.0%75 & over 247,474 26.6% 75 & over 25,573 7.3% 62.3%18 & over 410,595 44.2% 18 & over 25,573 7.3% 25.0%
Idiopathic Scoliosis (Dx=737.30)* Pediatric Idiopathic Scoliosis Diagnosis (Age <18 Years)*
IdiopathicScoliosis
Diagnosis
ProportionIdiopathicDiagnosis
by Age andGender
ProportionIdiopathic
to All SpinalDeformityDiagnoses
PrevalenceIdiopathic
Scoliosis inUnder 18
Population(All Diagnoses)
ProportionIdiopathic to
All SpinalDeformityDiagnoses
by Age Primary (1st)
Diagnosis
ProportionPrimary
to AllIdiopathicDiagnoses
by Age TOTAL 511,155 55.0% TOTAL 409,056 326,996 79.9%
Male 153,578 30.0% 80.5%Female 357,577 70.0% 48.4%
<18 409,056 80.0% 78.8% 0-3 * 0.0% * 0.0%18-44 26,741 5.2% 100.0% 4-7 9736 2.4% * 0.0%45-64 26,695 5.2% 20.7% 8-10 52,654 12.9% 52,654 16.1%65-74 7,599 1.5% 100.0% 11-13 103,872 25.4% 31,548 9.6%75 & over 41,064 8.0% 16.6% 14-17 242,794 59.4% 242,794 74.2%18 & over 102,099 20.0% 24.9%
* Estimates do not meet standards for reliability. Data is included because it constitutes the majority of patient visits for spinal deformity and scoliosis in2004.
Source: National Center for Health Statistics, National Ambulatory Medical Care Survey, 2004

Chapter 4
Arthritis and Related Conditions
The Burden of Musculoskeletal Diseases in the United States - Copyright © 2008 71
In adults, arthritis is the most common cause ofdisability1 and is among the leading conditionscausing work limitations.2 Over the next 25 yearsthe number of people affected with doctor-diagnosed arthritis and the correspondingarthritis-attributable activity limitations areprojected to increase by 40% in the United States.3
Estimating the prevalence and burden of thevarious conditions that comprise arthritis andother rheumatic conditions (AORC) is importantto understanding the current and potentialimpact of these conditions on health care and thepublic health systems. Equally important isidentifying the gaps in our understanding ofthese measures.
Prevalence estimates presented in this chapter arebased on studies4,5 recently published by theNational Arthritis Data Workgroup (NADW), aconsortium of experts in epidemiology organizedto provide a single source of national data on theprevalence and impact of AORC. The NADWfound that for estimates of specific conditionsthey often had to rely on a few, small-sizedstudies of uncertain generalizability to the U.S.population. Until there are better data, the resultsof NADW reviews are the best prevalenceestimates available and their application to the2005 population provides the best estimate of thenumber of people affected by AORC overall andby selected rheumatic conditions.
Section 4.1: Prevalence of Arthritis andOther Rheumatic Conditions
The NADW focuses on AORC, as distinct fromother highly prevalent musculoskeletalconditions such as back problems and
osteoporosis. Initially, AORC was defined interms of ICD-9-CM codes, a definition still in usefor analyses of health care system data. (Table 4.1)However, due to changes in national surveyspreviously used to estimate prevalence of AORC,prevalence is now estimated using self-reported,doctor-diagnosed arthritis, defined as a “yes”response to the question, “Have you EVER beentold by a doctor or other health professional thatyou have some form of arthritis, rheumatoidarthritis, gout, lupus, or fibromyalgia?”
Section 4.1.1: Prevalence of Arthritis and OtherRheumatic Conditions
Using doctor-diagnosed arthritis as the basis foranalysis, the prevalence of AORC among U.S.adults aged 18 or older was 21.6%, or 46.4 million,in 2003-20056. (Table 4.2 and Graph 4.1.1)Although arthritis prevalence is higher in olderage groups, with half of adults aged 65 and overnow affected, nearly two-thirds of the adultsreporting doctor-diagnosed arthritis are youngerthan 65 years. More than 60% are women.
Adjusting prevalence by age, the prevalence of alltypes of arthritis is higher among women thanmen (24% versus 18%). Among race/ethnicgroups, AORC is similar for non-Hispanic whitesand African Americans (~22%), while loweramong Hispanics (16.5%).
By 2030, the number of persons with doctor-diagnosed arthritis is projected to increase by40% over current levels to nearly 67 million, or25% of the adult population.3

Section 4.1.2: Impact and Health Care Utilizationfor All Arthritis and Other Rheumatic Conditions
In 2003-2005, an estimated 8.8% of all adults inthe United States, or nearly 19 million personsover the age of 18, had self-reported arthritis-attributable activity limitations. (Table 4.2 andGraph 4.1.1). The prevalence of activitylimitations increases as people age. Among adultsaged 65 years and older, 22% reported arthritis-attributable activity limitations. Activitylimitations are also higher among women, butlower among Hispanics. Among all adults withdoctor-diagnosed arthritis, arthritis or jointsymptoms limited activities in over 40%.Arthritis-attributable activity limitations areprojected to affect 9.3% of the adult population,or 25 million persons, by the year 2030.3
The high prevalence of arthritis and ofarthritis-related activity limitations resultsin significant personal and societalburdens; this burden often differs by raceor ethnicity.7 For example, “arthritis andrheumatism” is the most common cause ofdisability in the U.S.,1 and affected personshave a substantially lower health-relatedquality of life.8 In 1997, AORC was theunderlying cause of death for 9,340persons,9 while 19% of nursing homeresidents were diagnosed with AORC.10
The estimated incremental cost of medicalcare expenditures and earnings losses forpersons with an AORC condition was $128billion in 2003.11
AORC, as a primary, or 1st, diagnosis forpersons aged 18 and older accounted for44.2 million noninjury ambulatory carevisits in 2004, or 5.0% of all health carevisits, and affected broad components ofthe health care system. (Table 4.3) Healthcare visits for AORC occurred inphysicians offices (89%), outpatientdepartments (6%), and emergency
departments (5%), a proportion that has changedlittle since 1997. (Table 4.4) By physician specialty,physician office visits in 2004 were to primarycare physicians (45%), orthopaedic surgeons(36%), rheumatologists, neurologists or physicalmedicine and rehabilitation specialists (5%), andother providers (14%). Since 1997, the proportionof AORC patients seeing an orthopaedic surgeonhas increased. Health care providers includedphysicians (98%), nurses (41%), and midlevelpractitioners (3%), with many patients seeingmultiple providers. (Table 4.4 and Graph 4.1.2)
AORC, as the primary diagnosis, accounted for992,100 nonfederal, short stay hospitalizations in2004, or 3.1% of all such disease-related(nondelivery) hospitalizations. In 2004, two-thirds
The Burden of Musculoskeletal Diseases in the United States - Copyright © 2008
Chapter 4 Arthritis and Related Conditions
72
Graph 4.1.1: Prevalence of Self-Reported Doctor-DiagnosedArthritis and Arthritis-A�ributable Activity Limitations AmongAdults Aged 18 & Older by Age, Sex, and Race/Ethnicity, United States, 2003-2005
[1] Responded "Yes" when asked: Have you EVER been told by a doctor or other healthprofessional that you have some form of arthritis, rheumatoid arthritis, gout, lupus, orfibromyalgia?[2] Responded "Yes" when asked: Are you now limited in any way in any of your usualactivities because of arthritis or joint symptoms?Source: National Center for Health Statistics, National Health Interview Survey, 2003-2005

(66%) of the primary diagnosis AORC casesinvolved joint arthroplasty procedures, anincreasingly common treatment to restorefunction in arthritis diseased joints. The majorityof arthroplasty procedures were for primary kneereplacement (65%), with total hip replacementaccounting for 29% of the procedures, and otherjoints 6% of procedures. AORC, as either aprincipal or secondary diagnosis, accounted for4.6 million hospitalizations, or over 14% of alldisease-related hospitalizations, in 2004. Inaddition to the above numbers, personshospitalized with a principal diagnosis of anorthopaedic procedure, rather than an arthritis
condition, or those related to arthritistreatment complications (e.g.,gastrointestinal bleeding related to NSAIDuse) add to the overall burden of arthritis inthis country.
Section 4.2: Osteoarthritis
Osteoarthritis (OA), also known asdegenerative joint disease, is the mostcommon type of arthritis. It is characterizedby progressive damage to the cartilage andother joint tissues, and frequently affects thehand, knees, and hips.
Section 4.2.1: Prevalence and Incidence ofOsteoarthritis
Estimating the prevalence of OA is difficultas radiographic changes related to thepresence of osteoarthritis can be seen inmost persons as they age. However, thesechanges may not be accompanied bysymptoms. Symptomatic OA, experiencedas frequent pain and radiographic changesindicating osteoarthritis in the joint, isconsidered a better measure of important orconsequential OA and is used to identifyprevalence.
Longitudinal studies conducted in severalcommunities, some as long as 40 years or more,have focused on identifying the prevalence ofosteoarthritis, as well as other factors related to itscauses. The longest study has been of adults aged26 years and older living in Framingham, MA.The prevalence of symptomatic hand OA in theFramingham study is 6.8% of adults aged 26 andover; however, in older adults it is found muchmore frequently. Among persons aged 71 andolder, OA is found in 26.2% of females and in13.4% of males. The NADW estimated that 13.1million adults in the United States experiencedsymptomatic hand OA in 2005.
The Burden of Musculoskeletal Diseases in the United States - Copyright © 2008 73
Arthritis and Related Conditions Chapter 4
Graph 4.1.2: Health Care Resource Use for Non-Injury Arthritisand Other Rheumatic Conditions (AORC) for Persons Aged 18and Older, United States, 1997 & 2004
[1] Proportion of primary diagnosis of AORC visits[2] Source: Hootman JM, Helmick CG, Schappert SM. Magnitude and characteristicsof arthritis and other rheumatic conditions on ambulatory medical care visits, UnitedStates, 1997. Arthritis Rheum 2002;47:571–581[3] Source: National Center for Health Statistics, National Ambulatory Medical CareSurvey, 2004[4] Includes family practice, family practice (geriatric medicine), sports medicine(family practice), general practice, general surgery, internal medicine, geriatricmedicine (intermal medicine).[5] Includes rheumatology, neurology, neurological surgery, physical medicine andrehabilitation.

The prevalence of symptomatic knee OA is about5% of adults aged 26 years and older in theFramingham study. In another study conductedin Johnston County, NC, 17% of adults aged 45and over were found to have symptomatic kneeOA, while the 1988-1994 NHANES III surveyfound 12.1% of adults aged 60 years and oldersuffered from symptomatic knee OA. Again,older adults and females were more affected, andan estimated 9.3 million adults had symptomaticknee OA in 2005. (Table 4.5 and Graph 4.2.1)
The prevalence of symptomatic hip OA was 10%among adults aged 45 years and older in theJohnston County study. No prevalence estimatesfor symptomatic OA at multiple joints exists, butthe NADW estimated that clinical OA in at leastone joint, based on a physician’s examination in anational survey, affected 26.9 million adults in2005.
Section 4.2.2: Impact and Health Care Utilizationfor Osteoarthritis
Osteoarthritis as a primary diagnosis accountedfor 11.1 million ambulatory care visits in 2004, or
25.1% of the 44.2 million non-injury visits with aprimary diagnosis of AORC. (Table 4.3)Osteoarthritis as the primary diagnosis accountedfor 67% of the 992,100 nonfederal, short stayhospitalizations in 2004. This estimate does notcapture arthritis hospitalizations withorthopaedic procedures as the principal diagnosisor those related to arthritis treatmentcomplications, such as gastrointestinal bleedingrelated to NSAID use.
Section 4.3: Rheumatoid Arthritis
Rheumatoid arthritis (RA) is a chronicautoimmune disease that causes pain, stiffness,swelling, and limitation in the motion andfunction of multiple joints. Though joints are theprincipal body parts affected by RA,inflammation can develop in other organs as well.
Section 4.3.1: Prevalence of Rheumatoid Arthritis
The only current source of data from which toestimate the prevalence of rheumatoid arthritis isa study from Rochester, MN. This study reporteda prevalence of RA in 1985 of 1.07% among adultsaged 35 years and older, but by 1995 this estimatehad fallen to 0.85%. Twice as many women asmen are affected by rheumatoid arthritis (1.06%vs. 0.61%).4 Trends in prevalence in Rochester,MN, by age and calendar year, show increasingprevalence with older age but reflect thedecreasing overall prevalence in most age groupsin more recent time periods. (Table 4.6 andGraphs 4.3.1) This observation, along with theexpected rapid growth in the population ofAmericans aged 60 years and older, suggests thatRA associated morbidity, mortality, and disabilityare likely to increase among older adults. TheNADW studies found that older adults andfemales are more affected, and estimated that 1.3million adults over the age of 17 years, 0.6% of alladults, had RA in 2005.
The Burden of Musculoskeletal Diseases in the United States - Copyright © 2008
Chapter 4 Arthritis and Related Conditions
74
Graph 4.2.1: Prevalence of Symptomatic Osteoarthritis inthe Hands, Knees, and Hips, United States
*Age-standardized to the projected 2000 census population; exception is theNHANES III estimates are standardized to the 1980 U.S. populationSources:[1] Framingham (Massachuse�s) Osteoarthritis Study[2] Johnston County (North Carolina) Osteoarthritis Study[3] NHANES III, 1988-1994

Section 4.3.2: Impact and Health Care Utilizationfor Rheumatoid Arthritis
Rheumatoid arthritis as a primary diagnosisaccounted for 1.1 million ambulatory care visitsin 2004, representing 2.4% of the 44.2 million non-injury visits with a primary diagnosis of AORC.(Table 4.3) As the primary diagnosis, RAaccounted for about 18,000, or 2%, of the 922,100nonfederal, short stay hospitalizations for AORCin 2004. This estimate does not capture arthritishospitalizations with orthopaedic procedures asthe principal diagnosis or those related to arthritistreatment complications, such as gastrointestinalbleeding related to NSAID use.
Section 4.4: Other Forms of Arthritis
AORC, as a group of conditions, includes morethan 100 kinds of arthritis and rheumaticdiseases, most of which last a lifetime. Althoughprevalence numbers for these individualconditions do not begin to approach those ofosteoarthritis and rheumatoid arthritis, theseconditions are as disabling, and often more so,than medical conditions found in highernumbers. Because these conditions are lesscommon and affect fewer numbers of patients,research to treat or prevent them has fallenbehind that of other conditions. Only a few ofthese conditions are described below, but manymore need to be brought to awareness andsupported with research funding.
The Burden of Musculoskeletal Diseases in the United States - Copyright © 2008 75
Arthritis and Related Conditions Chapter 4
Graph 4.3.1: Trends in Prevalence of Rheumatoid Arthritis by Age [1], Rochester, MN, 1965-1995
[1] Age-adjusted to U.S. white population, 2000Source: Helmick CG, Felson DT, Lawrence RC, et al: National Arthritis Data Workgroup:Estimates of the prevalence of arthritis and other rheumatic conditions in the United States:Part I. Arthritis Rheum; in press, 2007.
Males
Females
Section 4.4.1: Juvenile Arthritis
Juvenile arthritis appears in a variety of types,with the most common form being juvenilerheumatoid arthritis. All types cause jointinflammation, begin before the age of 16, and areoften associated with symptoms andcomplications that are different from those inadults. Although some types of juvenile arthritisresolve over time and with maturity, damage toyoung joints can remain throughout a lifetime.
The prevalence of juvenile arthritis in children isvery difficult to estimate because of the variety ofthe diseases and their subtypes.12 The NADWreported a novel approach using pediatricambulatory care visits4, 13 to estimate that 294,000(95% CIi 188,000-400,000) children aged 0 to 17were affected by the broadly defined “arthritis orother rheumatic conditions” annually for theyears 2001 to 2004. The same study estimatesthese children made 827,000 ambulatory carevisits per year during the same time period.
Section 4.4.2: Gout and Other CrystalArthropathies
Gout is a painful, episodic, recurrent, andsometimes chronic and disabling form of arthritisthat has been recognized since ancient times.Symptoms typically consist of intense episodes ofpainful swelling in single joints, most often in thefeet and especially in the big toe. The underlyingmetabolic cause is an excess of serum uric acidthat results in the deposition of crystal in jointsand elsewhere.
The self-reported prevalence of gout in a 12-month period prior to the interview has increasedover time, reaching 0.94% of all adults aged 18years and older in 1996.5 Prevalence increaseswith age, is higher in men than women at allages, and is higher in African Americans than
whites aged 45 years and older. Lifetime self-reported prevalence was 2.6% of adults aged 20and older between the years 1988-1994, with 8%in adults aged 70 to 79 years reporting they havesuffered from gout at some point in their lives.The NADW estimates 3.0 million adults aged 18years and older had gout in the previous 12months in 2005, while 6.1 million adults hadexperienced gout during their lifetime.Prevalence numbers may be overestimated asthey are based on self-reported data rather thanclinical examination.
Gout and other crystal arthropathies as a primarydiagnosis accounted for 730,500 ambulatory carevisits in 2004, or 1.7% of the 44.2 million non-injury visits with a primary diagnosis of AORC.(Table 4.3) Gout and other crystal arthropathies asthe principal diagnosis accounted for 1.5% of the992,100 nonfederal, short stay hospitalizations in2004.
Section 4.4.3: Connective Tissue Diseases
Section 4.4.3a: Systemic LupusErythematosus
Systemic lupus erythematosus, also called SLE orlupus, is an autoimmune disorder that can affectthe skin, joints, kidneys, lungs, nervous system,and other organs of the body. The most commonsymptoms include skin rashes and arthritis, oftenaccompanied by fatigue and fever. The clinicalcourse of SLE varies from mild to severe, andtypically involves alternating periods ofremission and relapse.
Estimates of the prevalence of SLE varyconsiderably because it is difficult to diagnoseand because few good surveys have been done.The NADW used data from the San Franciscostudy4,14 and estimates that definite and suspectedSLE together affects 322,000 persons, with womenaffected far more than men, and African
The Burden of Musculoskeletal Diseases in the United States - Copyright © 2008
Chapter 4 Arthritis and Related Conditions
76
i Confidence interval

Americans far more than whites. Diffuse diseasesof connective tissue, mainly SLE, as a primarydiagnosis accounted for 621,000 ambulatory carevisits in 2004, or 1.4% of the 44.2 million non-injury visits with a primary diagnosis of AORC.(Table 4.3) Diffuse diseases of connective tissue,mainly SLE, as the principal diagnosis accountedfor 1.3% of the 992,100 nonfederal, short stayhospitalizations in 2004.
Section 4.4.3b: Systemic Sclerosis (SSc,scleroderma)
Diffuse systemic sclerosis (SSc) is an autoimmunedisease that causes thickening and hardening ofthe skin. It can also affect the lungs, the heart,gastrointestinal tract, and other internal organs. Apopulation-based study in southeast Michiganestimates the prevalence of SSc to be 27.6 casesper 100,000 population, translating to 49,000adults nationally, with women affected far morefrequently than men and African Americansslightly more than whites in 2005.4
Section 4.4.3c: Primary Sjögren’sSyndrome
Sjögren’s syndrome is an autoimmune,inflammatory disease that most often affects thetear and saliva glands, leading to dry eyes andmouth. “Primary” Sjögren’s syndrome occurs inpeople with no other rheumatologic disease.“Secondary” Sjögren’s syndrome occurs in peoplealso diagnosed with another rheumatologicdisease, most often SLE and rheumatoid arthritis.The NADW reports the prevalence of primarySjögren’s syndrome to range from 0.19% to 1.39%of the adult population, affecting from 0.4 to 3.1million adults in 2005.4
Section 4.4.4: Other Rheumatic Conditions
Section 4.4.4a: Fibromyalgia
Fibromyalgia is a clinical syndrome defined bychronic widespread muscular pain, fatigue andtenderness of unknown cause. Primaryfibromyalgia occurs in people with no otherrheumatologic disease. Secondary fibromyalgiaoccurs in people who are diagnosed with anotherrheumatologic disease, most often SLE andrheumatoid arthritis.
The NADW used a 1993 Wichita, Kansas, studyand estimates about 5.0 million adults aged 18years and older had primary fibromyalgia in2005. Prevalence is much higher among womenthan among men (3.4% vs. 0.5%).5 A primarydiagnosis of “myalgia and myositis, unspecified”,a very crude surrogate for primary fibromyalgia,accounted for 2.8 million ambulatory care visitsin 2004, or 6.3% of the 44.2 million non-injuryvisits with a primary diagnosis of AORC. (Table4.3) “Myalgia and myositis, unspecified” as theprincipal diagnosis accounted for less than 1% ofthe 922,100 nonfederal, short stay hospitalizationsin 2004.
Section 4.4.4b: Polymyalgia Rheumaticaand Giant Cell (temporal) Arteritis
Polymyalgia rheumatica (PMR) typically causes asymmetrical and rapidly developing aching andstiffness around the upper arms, neck, lower backand thighs among persons aged 50 and older. It isclosely related to giant cell arteritis (GCA), aninflammation of blood vessels. The mostcommonly involved blood vessels are the arteriesof the scalp and head. The NADW used the onlypopulation-based study of PMR and GCA,conducted in Olmsted County, Minnesota, toestimate that among persons 50 years of age orolder in the U.S., PMR affected 711,000 (0.74%)and GCA affected 228,000 (0.28%) in 2005.5 In
The Burden of Musculoskeletal Diseases in the United States - Copyright © 2008 77
Arthritis and Related Conditions Chapter 4

both of these conditions, prevalence is higher inwomen than men, and increases dramaticallywith age.
Section 4.4.4c: Spondylarthropathies
Spondylarthropathies are a family of diseases thatinclude ankylosing spondylitis (AS), reactivearthritis (formerly known as Reiter’s syndrome),psoriatic arthritis, enteropathic arthritis(associated with ulcerative colitis or Crohn’sdisease), juvenile spondylarthropathy, andundifferentiated spondylarthropathy, whichencompasses disorders expressing elements of,but failing to fulfill, criteria for the abovediseases.
The NADW estimates the prevalence ofspondylarthropathies to range roughly from0.35% to 1.31% of the population aged 25 andolder, affecting between 639,000 and 2,417,000adults. Spondylosis/spondylitis and allieddisorders as a primary diagnosis accounted for1.5 million ambulatory care visits in 2004, or 3.5%of the 44.2 million non-injury visits with aprimary diagnosis of AORC. (Tables 4.3a and4.3b) Spondylosis/spondylitis and allied disordersas the primary diagnosis accounted for 10% of the992,100 nonfederal, short stay hospitalizations in2004.
Section 4.4.5: Joint Symptoms and Joint Pain
Longitudinal prevalence numbers for joint painare not available; however, as noted in Chapter 1,Burden of Musculoskeletal Diseases Overview,chronic joint pain, pain experienced for at least 3months, was self-reported by 58.9 million personsaged 18 and older in 2005.15 Chronic joint pain isexperienced by persons of all ages, with nearlyone-third (29%) of adults under the age of 44reporting chronic joint pain, and close to one-half(43%) between the ages of 45 and 64 reporting it.In 2004, an estimated 10.3 million ambulatory
care visits, or 23.3% of the 44.2 million non-injuryvisits with a primary diagnosis of AORC were forjoint pain. (Tables 4.3a and 4.3b) Joint pain as theprincipal diagnosis accounted for 4.5% of the992,100 nonfederal, short stay hospitalizations in2004.
Section 4.5: Treatments and Preventionof Arthritis
In recent years, a greater variety of medicationshave been used to address pain and disabilityassociated with arthritis and other rheumaticconditions. For pain, acetaminophen hasremained a primary treatment. For conditionsthought to involve inflammation, generic non-steroidal anti-inflammatory drugs (NSAIDs)remain in widespread use. More specific NSAIDs,the Cox-2 inhibitors, have also been developed,although concerns about heart disease as a sideeffect have limited their use. For specific types ofinflammatory arthritis, disease modifying anti-rheumatic drugs (DMARDs) are being usedearlier in the course of disease and more widelyto try to prevent joint damage and disability. Amajor improvement in the treatment ofrheumatoid arthritis and other types ofinflammatory arthritis has been the introductionof expensive, but effective, biological agents, suchas tumor necrosis factor-alpha (TNF-α) inhibitors,which often work well where other DMARDshave failed.
Primary prevention, the preventing of anoccurrence of AORC, remains a sought-after butelusive goal. Risk factors are not well understoodfor most of the conditions, and studies are neededto identify these before preventive measures canbe developed. Secondary prevention, which isearly diagnosis and treatment to help preventjoint damage, is a goal for those with rheumatoidarthritis and other inflammatory types ofarthritis. Tertiary prevention, or the prevention of
The Burden of Musculoskeletal Diseases in the United States - Copyright © 2008
Chapter 4 Arthritis and Related Conditions
78

complications for those with AORC, is beingpursued through the use of medications andother recommended interventions, such as self-management of the disease, education, physicalactivity, and weight loss. Cures at specific jointsites may come about through joint replacementsurgery.
Section 4.6: Arthroplasty and TotalJoint Procedures
Total joint arthroplasty remains the definitivetreatment for advanced, symptomatic jointdestruction regardless of the underlying cause.Arthroplasty procedures have been developed fora multitude of joints, including hips, knees,shoulders, ankles, elbows, wrists and smallerjoints of the hand and foot. The most frequentlyreplaced joints are the knee and hip, followed bythe shoulder. The frequency of arthroplastyprocedures involving the hand and foot, such ascarpal metacarpal arthroplasty, is difficult toestimate because these procedures are oftenperformed on an outpatient basis. Outpatientsurgical data are not captured as reliably asinpatient procedures.
Section 4.6.1: Anatomic Distribution of JointArthroplasty
In 2004, hip and knee replacements, includingrevision replacement procedures, accounted for
95% of the 1.07 million arthroplasty proceduresperformed. (Table 4.7 and Graph 4.6.1) Shoulderprocedures accounted for another 4%, with allother joint replacement procedures representingonly 1% of the total arthroplasty proceduresperformed. As previously noted, hand and footarthroplasties are often performed on anoutpatient basis and may be undercounted.
Section 4.6.2: Underlying Diagnoses
Total hip and primary knee replacements aredone almost exclusively due to an underlyingdiagnosis of osteoarthritis (82% and 97%,respectively). (Table 4.8) A small proportion ofpatients having primary knee replacement havean underlying diagnosis of rheumatoid arthritisor other disorders. Among patients havingprimary total hip replacement, 5% are due tofracture and 7% to other disorders, such asavascular necrosis, a disease resulting from thetemporary or permanent loss of the blood supplyto the bone. Two percent (2%) of hip replacementsare due to rheumatoid arthritis. Partial total hipreplacement, generally a hemiarthoplasty, inwhich the prosthesis is placed in the femur butnot in the acetabulum, is performed principallyfor hip fracture (83% of cases).
Section 4.6.3: Age and Gender Distribution ofArthroplasty Procedures
Females undergo 62% of all total jointreplacement procedures. (Table 4.7) The moststriking difference in procedure rates betweenmales and females are in partial hip replacement,71% of which are performed on females. Thisdifference reflects the much greater incidence ofosteoporotic hip fracture in females than occursin males. Females also undergo total kneereplacement almost twice as frequently as males.This difference likely reflects the greaterprevalence of knee osteoarthritis in females thanin males, which in turn likely reflects
The Burden of Musculoskeletal Diseases in the United States - Copyright © 2008 79
Arthritis and Related Conditions Chapter 4
Graph 4.6.1: Arthroplasty Procedures By Type, United States 2004
Source: National Center for Health Statistics,National Hospital Discharge Survey, 2004

disproportionate distributions of riskfactors. In particular, females havehigher prevalence of obesity, whichhas been identified as a risk factor inosteoarthritis of the knee.
Age distributions of joint arthroplastyprocedures are predictable on thebasis of the underlying diagnosis.The mean age of patients at the timevarious arthroplasty procedures areperformed has remained fairlyconstant since 1991 at around 66 to 68years of age. The exception, partialhip replacements, are performed onpatients approximately a decadeolder due to the incidence of hipfracture in the elderly population. (Table 4.9)Three-fourths (75%) of partial hip replacementsare performed in patients older than 74 years and36% are performed on patients older than 85.Primary and revision total hip and kneearthroplasty procedures are distributed across theadult age strata, but about 60% of each of theseprocedures are performed on patients aged 65and older.
Section 4.6.4: Hospitalization for ArthroplastyProcedures
The length of the average hospital stay followingtotal joint procedures has declined by 50% since1991, although the reductions appear to bereaching a plateau over the last several years.(Table 4.10 and Graph 4.6.2) The length of stay forpartial hip replacement remains considerablyhigher than those for elective total hip and kneereplacement, reflecting the older age and morefrail medical status of the hip fracture population.Additionally, surgery is not always done on theday of admission for hip fracture patients, as itgenerally is for the elective total joint arthroplastypopulation. Patients undergoing revision hip andknee replacements remain as inpatients for a full
day more, on average, than patients undergoingthe primary procedure. This observation isconsistent with the greater level of complexity ofrevision than of primary elective procedures.
Length of stay provides only part of the story ofinpatient utilization following total jointarthroplasty. Rates of discharge to home (routine),short-term/skilled nursing/intermediate care, orother discharge sites varies with the nationaldatabase analyzed and the age of the population.Overall, rates of routine discharge to home arelower in the Nationwide Inpatient Survey (NIS)than are shown in the National HospitalDischarge Survey (NHDS). Using the mostoptimum picture (NHDS), nearly one-half of jointarthroplasty recipients (44%) who are aged 65and over are discharged to rehabilitation andnursing facilities for an additional period ofinpatient recovery and rehabilitation. (Table 4.11and Graph 4.6.3) This rate compares to 26% of allhospital inpatient discharges of patients aged 65and older to another care facility. Even morestriking is the 72% of partial hip replacementrecipients discharged to long or short-term carefacilities for further care, reflecting the frailty ofthis population.
The Burden of Musculoskeletal Diseases in the United States - Copyright © 2008
Chapter 4 Arthritis and Related Conditions
80
Graph 4.6.2: Average Inpatient Length of Stay for Selected ArthroplastyProcedures, United States 1991-2004
[1] An unknown error in the partial hip replacement dataoccurred in the NHDS 2004 data file. A correction for totalpartial hip cases was made by excluding cases withdiagnosis of spine.
Source: National Center for Health Statistics, NationalHospital Discharge Survey, 2004

Thus, hospital length of stay by itselfsubstantially underestimates the totality of healthsystem care, especially for the hip fracturepopulation.
Section 4.6.5: Trends in Recent Utilization ofJoint Arthroplasty Procedures
From 1991 to 2004, the annual number of totalknee replacements increased by almost 3-fold,while the annual number of total hipreplacements doubled. (Table 4.12 and Graph4.6.4) Revision joint arthroplasty procedures fortotal knee replacement in 2004 were 220% to 235%of the 1991 level. Partial hip joint replacements
saw the slowest increase, up 133% of 1991levels. These increases in joint arthroplastyutilization are far more dramatic thanwould be expected from overall populationgrowth and from the increase in theproportion of the population that iselderly.16 As joint replacement proceduresbecome safer and more durable, the rangeof symptoms for which joint replacement issuccessful is broadening. Total hip and kneereplacement are now suggested to youngerand more active patients on the one hand,and older and more frail patients on theother. The more modest increase in partialhip replacements, a procedure reflective of
the epidemiology of age-related hip fracturerather than of physiological changes, supportsthis hypothesis of total replacement in younger,active patients.
The slower increase in the rate of revisions thanin primary procedures likely reflects the temporallag between primary and revision procedures,which generally occurs with a wearing out of theoriginal replacement device. One would expectthat the rate of increase in revisions will reflectthe increased rate in primaries after 10 to 15years.
The meanhospitalization cost ofhip and knee jointreplacementprocedures, excludingcharges not routinelybilled by the hospitalsuch as physician andprescription costs,increased from 1998 to2004 by an average70%, with partial hipreplacements (76%)and knee revision
The Burden of Musculoskeletal Diseases in the United States - Copyright © 2008 81
Arthritis and Related Conditions Chapter 4
Graph 4.6.3: Discharge Status for Patients Aged 65 and OverUndergoing Selected Major Joint Procedures, United States 2004
Source: National Center for HealthStatistics, National HospitalDischarge Survey, 2004
Graph 4.6.4: Total Hip and Knee Joint Replacement Procedures, United States 1991 to 2004
[1] An unknown error in the partial hip replacement data occurred in the NHDS 2004 data file. A correction for totalpartial hip cases was made by excluding cases with diagnosis of spine Source: National Center for Health Statistics, National Hospital Discharge Survey, 2004

procedures (78%) showing the highest level ofincrease. (Table 4.13 and Graph 4.6.5) Total kneereplacements, with a mean increase of 56% incost, showed the lowest level of per procedurecost increase. In spite of this, due to the rapid
increase in the number of total kneeprocedures performed, the total estimated costof performing total knee replacementprocedures jumped from $5.36 billion in 1998to $14.26 billion in 2004, an increase of 166%.(Table 4.13 and Graph 4.6.6) The totalhospitalization cost of hip and knee jointreplacements in 2004 was approximately $30billion. Joint replacement procedures areproven to be one of the most successfulprocedures available today. In the vastmajority of cases, the procedure significantlyimproves quality of life and the patient’sability to continue work, activities of dailyliving, and recreational activities. Continuedresearch to improve the longevity of implantswith younger, more active patients will reducethe overall burden of arthritis and damagedjoints on future generations.
Section 4.6.6: Forecasting Future Utilizationof Joint Arthroplasty Procedures
Kurtz and colleagues have performedsophisticated modeling of projected growth inhip and knee replacement procedures.17 These
investigators included in their estimates thegrowth in the overall population and in theproportion of elderly, as well as recent age andsex specific increases in arthroplasty rates. Theresults are striking. The investigators estimatethat by 2030 there will be over 570,000 primarytotal hip replacements performed annually inthe U.S. and nearly 3.5 million primary totalknee replacements. (Table 4.14 and Graph4.6.7) Although the rate of revision proceduresis expected to slowly decline, revisions areprojected to remain at a rate of 17% to 18% ofprimary hip replacements and around 8% ofprimary knee replacements. (Table 4.14 andGraph 4.6.8) Such staggering growth will haveprofound consequences for manpower needs,operating room capacity, and health care costs.In 2007 dollars, this volume of total joint
The Burden of Musculoskeletal Diseases in the United States - Copyright © 2008
Chapter 4 Arthritis and Related Conditions
82
Graph 4.6.5: Mean Hospitalization Charges [1] for Hip andKnee Joint Replacement Procedures, United States 1998 to 2004
[1] Generally, total charges do not includeprofessional fees and non-covered charges. In therare cases where professional fees cannot beremoved, they are included in the database.Emergency department charges incurred prior toadmission to the hospital may be included intotal charges.
Source: Agency for Healthcare Research andQuality, Healthcare Cost and Utilization Project,Nationwide Inpatient Sample, 1998-2004
Graph 4.6.6: Total Hospitalization Charges [1] for Hip and KneeJoint Replacement Procedures, United States 1998 to 2004
[1] Generally, total charges do not includeprofessional fees and non-covered charges. In therare cases where professional fees cannot beremoved, they are included in the database.Emergency department charges incurred prior toadmission to the hospital may be included intotal charges.
Source: Agency for Healthcare Research andQuality, Healthcare Cost and Utilization Project,Nationwide Inpatient Sample, 1998-2004

replacement would generate costs exceeding $100billion, or 1% of the gross domestic product(GDP). It is critical that the orthopaedicprofession anticipate these profound needs fortotal knee and hip replacement services over thenext generation.
Section 4.7: Economic Cost of Arthritisand Related Conditions
The estimated annual cost for medical care ofarthritis and joint pain for patients with anydiagnosis in 2004 was $281.5 billion, an average of$7,500 for each of the 37.6 million persons whoreported having arthritis or joint pain. (Chapter 9:
Health Care Utilization and Economic Cost ofMusculoskeletal Diseases) Of this total, $37.3billion is estimated to be incremental cost that canbe directly attributed to arthritis and joint pain,and not a combination of arthritis and othermedical conditions. A breakdown of the $281.5billion cost due to arthritis and joint pain shows32% for ambulatory care, 32% for emergencyroom or inpatient care, 23% for prescriptiondrugs, and 13% for other expenses. The cost ofarthritis and joint pain, in 2004 dollars, rose from$184.3 billion in 1996 to the $281.5 billion in 2004,an increase of 53%. The increasing cost ofprescription drugs accounts for the largestpercentage of this total cost increase, rising from15% of total cost to 23% over the 9 year period.
The indirect cost of earnings losses for personsaged 18 to 64 years with a work history due tothree major AORC conditions totals $54.3 billionper year. This includes an estimated $15.2 billiondue to gout, $22 billion as a result of osteoarthritisand allied disorders, and $17.1 billion resultingfrom rheumatoid arthritis.
1. Centers for Disease Control (CDC): Prevalence ofdisabilities and associated health conditions amongadults-United States, 1999. MMWR Morb Mortal WklyRep 2001;50:120-125.
2. Stoddard S, Jans L, Ripple J, Kraus L: Chartbook onwork and disability in the United States, 1998, in AnInfoUse Report. Washington DC: U.S. National Instituteon Disability and Rehabilitation Research, 1998.
3. Hootman JM, Helmick CG: Projections of US prevalenceof arthritis and associated activity limitations. ArthritisRheum 2006;54:226-229.
4. Helmick CG, Felson DT, Lawrence, RC, et al: Estimatesof the prevalence of arthritis and other rheumaticconditions in the United States: part I. Arthritis Rheum2007;in press.
5. Helmick CG, Felson DT, Lawrence, RC, et al: Estimatesof the prevalence of arthritis and other rheumaticconditions in the United States: part II. Arthritis Rheum2007;in press.
The Burden of Musculoskeletal Diseases in the United States - Copyright © 2008 83
Arthritis and Related Conditions Chapter 4
Source: Kurtz S, Lau E, Mowat F, et al: Thefuture burden of hip and knee revisions:U.S. projections from 2005 to 2030. Paperpresented at: 73rd Annual Meeting of theAmerican Academy of OrthopaedicSurgeons:Chicago, IL;2006. Used withpermission of the primary author.
Graph 4.6.7: Projected Number of Primary Total Hip andKnee Arthroplasties, United States 2005-2030
Graph 4.6.8: Projected Number of Revision Total Hip andKnee Arthroplasties, United States 2005-2030
Source: Kurtz S, Lau E, Mowat F, et al: Thefuture burden of hip and knee revisions: U.S.projections from 2005 to 2030. Paperpresented at: 73rd Annual Meeting of theAmerican Academy of OrthopaedicSurgeons:Chicago, IL;2006. Used withpermission of the primary author.

The Burden of Musculoskeletal Diseases in the United States - Copyright © 2008
Chapter 4 Arthritis and Related Conditions
84
6. Hootman J, Bolen J, Helmick C, Langmaid G: Prevalenceof doctor-diagnosed arthritis and arthritis-attributableactivity limitation-United States, 2003-2005. MMWRMorb Mortal Wkly Rep 2006;55:1089-1092.
7. Bolen J, Sniezek J, Theis K, et al: Racial and ethnicdifferences in the prevalence and impact of doctor-diagnosed arthritis-United States, 2002. MMWR MorbMortal Wkly Rep 2005;54:119-123.
8. Mili F, Helmick CG, Moriarty DG: Health related qualityof life among adults reporting arthritis: Analysis of datafrom the Behavioral Risk Factor Surveillance System,US,1996-99. J Rheumatol 2003;30:160-166.
9. Sacks JJ, Helmick CG, Langmaid G: Deaths fromarthritis and other rheumatic conditions, United States,1979-1998. J Rheumatol 2004;31:1823-1828.
10. Abell JE, Hootman JM, Helmick CG: Prevalence andimpact of arthritis among nursing home residents. AnnRheum Dis 2004;63:591-594.
11. Yelin E, Murphy L, Cisternas MG, et al: Medical careexpenditures and earnings losses among persons witharthritis and other rheumatic conditions in 2003 andcomparisons with 1997. Arthritis Rheum 2007;56:1397-1407.
12. Manners PJ, Bower C: Worldwide prevalence of juvenilearthritis - Why does it vary so much? J Rheumatol2002;29:1520-1530.
13. Sacks JJ, Helmick CG, Luo Y-H, et al: Prevalence of andannual ambulatory health care visits for pediatricarthritis and other rheumatologic conditions, UnitedStates, 2001-2004. Arthritis Rheum 2007;57(8):1439-1445.
14. Fessel W: Systemic lupus erythematosus in thecommunity: incidence, prevalence, outcome and firstsymptoms: The high prevalence in black women. ArchIntern Med 1974;134:1027-1035.
15. National Center for Health Statistics: National HealthInterview Survey, Adult Sample Level File, 2005.
16. Praemer A, Furner S, Rice DP: Musculoskeletal Conditionsin the United States, ed 2. Rosemont, IL: AmericanAcademy of Orthopaedic Surgeons, 1999, p 182.
17. Source: Kurtz S, Lau E, Mowat F, et al: The futureburden of hip and knee revisions: U.S. projections from2005 to 2030. Paper presented at: 73rd Annual Meetingof the American Academy of OrthopaedicSurgeons:Chicago, IL;2006.

The Burden of Musculoskeletal Diseases in the United States - Copyright © 2008 85
Arthritis and Related Conditions Chapter 4
Section 4.8: Arthritis and Related Conditions Data Tables
Table 4.1: Diagnostic Categories ICD-9-CM Codes for Arthritis and Other RheumaticConditions (AORC)
Osteoarthritis and allied disorders Other specified rheumatic conditions (continued)715-Osteoarthritis and allied disorders Other AORC
Rheumatoid arthritis 711-Arthritis associated with infectionsGout and other crystal arthropathies 713-Arthropathy associated w/disorders
274-Gout classified elsewhere712-Crystal arthropathies 716.0, .2, .8-Specified arthropathies
Joint pain, effusion and other unspecified joint disorders 719.2, .3-Specified joint disorders716.1, .3-.6-.9 - Other unspecified arthropathies 95.6-Syphilis of muscle719.0, .4-.9-Other and unspecified joint disorders 95.7-Syphilis of synovium/tendon/bursa
Spondylarthropathies 98.5-Gonococcal infection of joint720-AS/inflammatory spondylopathies 136.1-Behcet’s syndrome721-Spondylosis and allied disorders 277.2-Other disorders purine/pyrimidine metabolism99.3-Reiter’s Disease 287.0-Allergic purpura696.0-Psoriatic arthopathy 344.6-Cauda equina syndrome
Systemic Lupus Erythematosus (SLE) 353.0-Brachial plexus/thoracic outlet lesions710.0-Systemic lupus erythematosus 355.5-Tarsal tunnel syndrome
Systemic Sclerosis (SSC, scleroderma) 357.1-Polyneuropathy in collagen vascular disease710.1-Systemic sclerosis 390-Rheumatic fever w/o heart disease
Fibromyalgia 391-Rheumatic fever w/heart disease729.1-Myalgia and myositis unspecified 437.4-Cerebral arteritis
Sjögren's syndrome 443.0-Raynaud’s syndrome710.2-Sicca syndrome (also called Sjögren's syndrome) 446-Polyarteritis nodosa and allied conditions
Polymyalgia rheumaticus (PMR) and Giant cell [excl 446.5](termporal) arteritis (GCA) 447.6-Arteritis, unspecified
725-Polymyalgia rheumatica So� tissue disorders (excluding back)446.5-Polyarteritis nodosa and allied conditions 726-Peripheral enthesopathies and allied disorders
Other specified rheumatic conditions 727-Other disorders of synovium/tendon/bursaDifuse connective tissue disease 728.0-.3, .6–.9-Disorders of muscle/ligament/fascia710-Diffuse connective tissue disease [excl 710.0-.2] 729.0-Rheumatism, unspecified and fibrositis
Carpal tunnel syndrome [excl 729.1]354.0-Carpal tunnel syndrome 729.4-Fascitis, unspecified
Source: Centers for Disease Control and Prevention, Arthritis Program, National Arthritis Data Workgroup. Available at:h�p://www.cdc.gov/arthritis/data_statistics/arthritis_codes_2004.pdf. Accessed: August 16, 2007

The Burden of Musculoskeletal Diseases in the United States - Copyright © 2008
Chapter 4 Arthritis and Related Conditions
86
Table 4.2: Prevalence of Self-Reported Doctor-Diagnosed Arthritis and Arthritis-A�ributable Activity Limitations Among Adults Aged 18 & Older by Age, Sex, andRace/Ethnicity, United States, 2003-2005
Arthritis and Arthritis-A�ributable Activity Limitation Prevalence Proportion with
Arthritis-A�ributableActivity LimitationAmong Those withDoctor-Diagnosed
ArthritisDoctor-Diagnosed Arthritis [1]Arthritis-A�ributable Activity
Limitation [2]
UnadjustedPrevalence (in millions)
% AgeUnadjusted
% Age-Adjusted*
UnadjustedPrevalence (in millions)
% AgeUnadjusted
% Age-Adjusted*
% AgeUnadjusted
% Age-Adjusted*
GenderMale
18.2 17.6% 18.1% 7.0 6.8% 7.0% 38.8% 36.6%Female
28.3 25.4% 24.4% 11.9 10.7% 10.3% 42.3% 39.0%
Age18-44 years 8.7 7.9% na 3.0 2.7% na 34.6% na45-64 years 20.5 29.3% na 8.2 11.8% na 40.3% na65 & Over
17.2 50.0% na 7.7 22.4% na 44.9% na
Race/EthnicityWhite, non-Hispanic
37.2 24.3% 22.6% 14.7 9.6% 8.9% 39.5% 36.4%Black, non-Hispanic
4.6 19.2% 21.4% 2.2 9.2% 10.3% 47.8% 44.3%Hispanic
3.1 11.4% 16.5% 1.5 5.4% 8.2% 47.6% 45.2%Other non-Hispanic
1.6 14.7% 17.3% 0.7 6.0% 7.2% 41.1% 40.5%
Total 46.4 21.6% 21.5% 18.9 8.8% 8.8% 40.9% 38.1%
* Age adjusted to the projected 2000 population age 18 years or older by three age groups: 18-44, 45-64 and 65 & over
[1] Responded "Yes" when asked: Have you EVER been told by a doctor or other health professional that you have some form of arthritis, rheumatoidarthritis, gout, lupus, or fibromyalgia?
[2] Responded "Yes" when asked: Are you now limited in any way in any of your usual activities because of arthritis or joint symptoms?
Source: National Center for Health Statistics, National Health Interview Survey, 2003-2005

The Burden of Musculoskeletal Diseases in the United States - Copyright © 2008 87
Arthritis and Related Conditions Chapter 4
Table 4.3a: Impact and Health Care Utilization for Select Arthritis and Other RheumaticConditions for Adults Aged 18 & Older, United States, 2004
All DiagnosesVisits (in 000s)
InpatientHospitalization
[2]
Ambulatory Care Services
AORC Condition [1]Physician
Visits [3] ER Visits [4]Outpatient
Visits [5]
TotalAmbulatory
Care Osteoarthritis 2,225.6 17,425.7 206.0 1,233.7 18,659.4 Rheumatoid Arthritis 343.7 1,823.5 41.3 * 169.5 1,993.0 Gout and Other Crystal Arthropathies 421.0 1,583.3 221.7 102.9 1,686.2 Systemic Lupus Erythematosus (SLE) 141.7 770.3 * 35.3 * 76.2 846.5 Systemic Sclerosis (SSc, scleroderma) 0.0 0.0 0.0 0.0 0.0 Primary Sjögren’s Syndrome 22.7 578.2 * 0.0 13.5 * 591.7 Fibromyalgia 221.8 4,222.7 473.2 392.4 4,615.1 Polymyalgia Rheumatica and Giant Cell Arteritis 90.8 568.7 * 9.4 * 14.6 * 583.3 Spondylarthropathies 377.9 3,103.2 40.2 * 145.6 3,248.8 Joint Pain 713.5 16,013.9 1,590.1 1,453.5 17,467.4 All Other Arthritis and Other Rheumatic Conditions 588.3 21,248.8 913.6 1,512.3 22,761.1 Total AORC Diagnoses 4,572.5 61,847.8 3,320.6 4,589.1 66,436.9 All Visits 31,950.0 739,398.6 83,074.3 62,991.3 885,464.2
Primary (1st ) DiagnosisVisits (in 000s)
InpatientHospitalization
[2]
Ambulatory Care Services
AORC Condition [1]Physician
Visits [3] ER Visits [4]Outpatient
Visits [5]
TotalAmbulatory
Care Osteoarthritis 662.2 10,448.4 101.4 * 611.5 11,059.9 Rheumatoid Arthritis 17.5 957.7 * 25.3 * 123.2 1,080.9 Gout and Other Crystal Arthropathies 15.2 695.3 * 159.0 35.2 * 730.5 Systemic Lupus Erythematosus (SLE) 12.9 570.2 * 18.3 * 50.8 621.0 Systemic Sclerosis (SSc, scleroderma) 0.0 0.0 0.0 0.0 0.0 Primary Sjögren’s Syndrome 0.5 * 317.2 * 0.0 7.2 * 324.4 Fibromyalgia 8.3 2,591.2 338.6 195.2 2,786.4 Polymyalgia Rheumatica and Giant Cell Arteritis 5.2 424.7 * 3.7 * 7.6 * 432.3 Spondylarthropathies 99.7 1,485.1 9.5 * 56.8 1,541.9 Joint Pain 44.9 9,391.2 1,053.6 891.1 10,282.3 All Other Arthritis and Other Rheumatic Conditions 126.5 14,338.5 596.1 977.2 15,315.7 % Total AORC Diagnoses to All Diagnoses 992.1 41,195.1 2,304.8 2,955.9 44,151.0 % of Ambulatory Visits 31,950.0 739,398.6 83,074.3 62,991.3 885,464.2
* Estimate does not meet standards for reliability
[1] ICD-9-CM diagnosis codes for AORC listed in Table 4 and appendix.
[2] Source: Agency for Healthcare Research and Quality, Healthcare Cost and Utilization Project, Nationwide Inpatient Sample, 2004
[3] Source: National Center for Health Statistics, National Ambulatory Medical Care Survey, 2004
[4] Source: National Center for Health Statistics, National Hospital Ambulatory Medical Care Survey, Hospital Emergency, 2004
[5] Source: National Center for Health Statistics, National Hospital Ambulatory Medical Care Survey, Outpatient Centers, 2004
NOTE: This table and all related graphs created by the Burden of Musculoskeletal Disease project analyst.

The Burden of Musculoskeletal Diseases in the United States - Copyright © 2008
Chapter 4 Arthritis and Related Conditions
88
Table 4.3b: Proportion of Total AORC Visits for Select Arthritis and Other RheumaticConditions for Adults Aged 18 & Older, United States 2004
All DiagnosesVisits (in 000s)
InpatientHospitalization
[2]
Ambulatory Care Services
AORC Condition [1]Physician
Visits [3] ER Visits [4]Outpatient
Visits [5]
TotalAmbulatory
Care Osteoarthritis 48.7% 28.2% 6.2% 26.9% 28.1%Rheumatoid Arthritis 7.5% 2.9% 1.2% 3.7% 3.0%Gout and Other Crystal Arthropathies 9.2% 2.6% 6.7% 2.2% 2.5%Systemic Lupus Erythematosus (SLE) 3.1% 1.2% 1.1% 1.7% 1.3%Systemic Sclerosis (SSc, scleroderma) 0.0% 0.0% 0.0% 0.0% 0.0%Primary Sjögren’s Syndrome 0.5% 0.9% 0.0% 0.3% 0.9%Fibromyalgia 4.9% 6.8% 14.3% 8.6% 6.9%Polymyalgia Rheumatica and Giant Cell Arteritis 2.0% 0.9% 0.3% 0.3% 0.9%Spondylarthropathies 8.3% 5.0% 1.2% 3.2% 4.9%Joint Pain 15.6% 25.9% 47.9% 31.7% 26.3%All Other Arthritis and Other Rheumatic Conditions 12.9% 34.4% 27.5% 33.0% 34.3%Total AORC Diagnoses 14.3% 8.4% 4.0% 7.3% 7.5%All Visits 88.7% 4.8% 6.6%
Primary (1st ) DiagnosisVisits (in 000s)
InpatientHospitalization
[2]]
Ambulatory Care Services
AORC Condition [1]Physician
Visits [3] ER Visits [4]Outpatient
Visits [5]
TotalAmbulatory
Care Osteoarthritis 66.7% 25.4% 4.4% 20.7% 25.1%Rheumatoid Arthritis 1.8% 2.3% 1.1% 4.2% 2.4%Gout and Other Crystal Arthropathies 1.5% 1.7% 6.9% 1.2% 1.7%Systemic Lupus Erythematosus (SLE) 1.3% 1.4% 0.8% 1.7% 1.4%Systemic Sclerosis (SSc, scleroderma) 0.0% 0.0% 0.0% 0.0% 0.0%Primary Sjögren’s Syndrome 0.1% 0.8% 0.0% 0.2% 0.7%Fibromyalgia 0.8% 6.3% 14.7% 6.6% 6.3%Polymyalgia Rheumatica and Giant Cell Arteritis 0.5% 1.0% 0.2% 0.3% 1.0%Spondylarthropathies 10.0% 3.6% 0.4% 1.9% 3.5%Joint Pain 4.5% 22.8% 45.7% 30.1% 23.3%All Other Arthritis and Other Rheumatic Conditions 12.8% 34.8% 25.9% 33.1% 34.7%% Total AORC Diagnoses to All Diagnoses 3.1% 5.6% 2.8% 4.7% 5.0%% of Ambulatory Visits 88.7% 5.0% 6.4%
* Estimate does not meet standards for reliability
[1] ICD-9-CM diagnosis codes for AORC listed in Table 4.1.
[2] Source: Agency for Healthcare Research and Quality, Healthcare Cost and Utilization Project, Nationwide Inpatient Sample, 2004
[3] Source: National Center for Health Statistics, National Ambulatory Medical Care Survey, 2004
[4] Source: National Center for Health Statistics, National Hospital Ambulatory Medical Care Survey, Hospital Emergency, 2004
[5] Source: National Center for Health Statistics, National Hospital Ambulatory Medical Care Survey, Outpatient Centers, 2004
NOTE: This table and all related graphs created by the Burden of Musculoskeletal Disease project analyst.

The Burden of Musculoskeletal Diseases in the United States - Copyright © 2008 89
Arthritis and Related Conditions Chapter 4
Table 4.4: Ambulatory Care Resource Use for Non-Injury Arthritis and OtherRheumatic Conditions (AORC) for Persons Aged 18 and Older, United States, 1997 and 2004
Proportion of All Primary (1st) Diagnosis of AORC, United States 1997Physician Office Visits
Ambulatory Care Resource Physician Specialty Health Care ProviderPhysician Office 89% Primary Care Physician 53% Physician 97%Outpatient Department 7% Orthopaedic Surgeon 20% Nurse 51%Emergency Department 4% Rheumatologist 17% Midlevel Provider 24%
Other Provider 10%
Total Visits for AORC 36.5 million AORC as % All Health Care Visits 3.8%
Source: Hootman JM, Helmick CG, Schappert SM. Magnitude and characteristics of arthritis and other rheumatic conditions on ambulatory medical carevisits, United States, 1997. Arthritis Rheum 200247:571–581.
Proportion of All Primary (1st) Diagnosis of AORC, United States 2004Physician Office Visits [1]
Ambulatory Care Resource Physician Specialty Health Care Provider VisitsPhysician Office [1] 89% Primary Care Physician [4] 45% Physician 98%Outpatient Department [2] 6% Orthopaedic Surgeon 36% Nurse [6] 41%Emergency Department [3] 5% Rheumatologist,
Neurologist, PM&R [5]
5% Midlevel Provider [7] 3%Other Provider 8%
Other Provider 14%
Total Visits for AORC 41.2 million AORC as % All Health Care Visits 5.6%
[1] Source: National Center for Health Statistics, National Ambulatory Medical Care Survey, 2004
[2] Source: National Center for Health Statistics, National Hospital Ambulatory Care Survey, Outpatient Centers, 2004
[3] Source: National Center for Health Statistics, National Hospital Ambulatory Care Survey, Hospital Emergency, 2004
[4] Includes family practice, family practice (geriatric medicine), sports medicine (family practice), general practice, general surgery, internal medicine,geriatric medicine (internal medicine).
[5] Includes rheumatology, neurology, neurological surgery, physical medicine and rehabilitation.
[6] Includes registered nurse, licensed practical nurse, and medical/nursing assistant.
[7] Includes physician assistant and nurse practitioner/midwife

The Burden of Musculoskeletal Diseases in the United States - Copyright © 2008
Chapter 4 Arthritis and Related Conditions
90
Table 4.5: Prevalence of Symptomatic Osteoarthritis in theHands, Knees and Hips, United States, Various Studies
Age SourceSymptomatic Osteoarthritis Prevalence per 100 Persons*
Male Female TotalHands 26 & over [1] 3.8 9.2 6.8
Knees 26 & over [1] 4.6 4.9 4.9 45 & over [1] 5.9 7.2 6.7 45 & over [2] 13.5 18.7 16.7 60 & over [3] 10.0 13.6 12.1
Hips 45 & over [2] 8.7 9.3 9.2
*Age-standardized to the projected 2000 census population exception is the NHANES III estimates arestandardized to the 1980 U.S. population
[1] Framingham (Massachuse�s) Osteoarthritis Study
[2] Johnston County (North Carolina) Osteoarthritis Study
[3] NHANES III, 1988-1994
Table 4.6: Trends in Prevalence of RheumatoidArthritis by Sex and Age [1], Rochester, MN, 1965-1995
Females Prevalence (in 100,000s)
Age-group 1965 1975 1985 199535-44 310 451 300 379 45-54 1,020 977 1,110 494 55-64 1,572 1,901 1,888 1,382 65-74 2,081 2,312 2,438 2,421 75+ 1,969 2,568 2,352 1,943 All Females 1,171 1,368 1,345 1,064
Males Prevalence (in 100,000s)
Age-group 1965 1975 1985 199535-44 161 133 97 33 45-54 452 473 286 219 55-64 946 885 848 753 65-74 606 1,540 1,792 1,574 75+ 1,394 1,592 1,589 1,498 All Males 593 733 701 606
[1] Age-adjusted to U.S. White population, 2000
Source: Helmick CG, Felson DT, Lawrence RC, et. al. National Arthritis Data Workgroup:Estimates of the prevalence of arthritis and other rheumatic conditions in the UnitedStates: Part I. Arthritis & Rheumatism; 2007 in press.

The Burden of Musculoskeletal Diseases in the United States - Copyright © 2008 91
Arthritis and Related Conditions Chapter 4
Table 4.7 Arthroplasty Procedures By Type by Gender, United States 2004
Male Female All Persons
Number ofProcedures
% of TotalProcedures
Number ofProcedures
% of TotalProcedures
Number ofProcedures
% of TotalProcedures
All Hip Replacement Procedures [1,7] 203,212 39.7% 308,656 60.3% 511,868 54.1%Total Hip Replacement (81.51) 98,266 42.2% 134,591 57.8% 232,857 24.6%Partial Hip Replacement (81.52) 35,188 29.4% 84,500 70.6% 119,688 12.7%Revision Hip Replacement (91.53 19,418 42.5% 26,271 57.5% 45,689 4.8%
All Knee Replacement Procedures [2] 175,131 34.7% 329,569 65.3% 504,700 53.3%Total Knee Replacement (81.54) 157,310 34.6% 297,342 65.4% 454,652 48.1%Revision Knee Replacement (81.55) 11,564 29.5% 27,636 70.5% 39,200 4.1%
All Shoulder Replacement Procedures [3] 19,667 46.9% 22,309 53.2% 41,934 4.4%
All Other Joint Replacement Procedures [4] 5,003 41.5% 7,052 58.5% 12,055 1.3%
All Joint Replacement Procedures [5] 402,213 37.6% 667,502 62.4% 1,069,715 100.0%
[1] Includes ICD-9-CM procedure codes for total, partial, revision, and hip repair procedures
[2] Includes ICD-9-CM procedure codes for total, revision, and knee repair procedures
[3] Includes ICD-9-CM procedure codes for primary and revision shoulder arthroplasty
[4] Includes ICD-9-CM procedure codes finger, wrist, hand, elbow, toe, foot, ankle, and lower extremity
[5] Includes ICD-9-CM procedure codes for all above procedures.
[6] Total procedures may include cases with multiple procedures.
[7] An unknown error in the partial hip replacement data occurred in the NHDS 2004 data file. A correction for total partial hip cases was made byexcluding cases with diagnosis of spine (720.xx-724.xx, 737.xx, 756.xx, 805.xx, 806.xx)
Source: National Center for Health Statistics, National Hospital Discharge Survey, 2004
Table 4.8: Principal Diagnoses Associated with Hip and Knee Joint Replacement, United States 2004
Proportion of Total Replacement ProceduresTotal Hip
Replacement [1]Partial Hip
Replacement [2,4]Primary Knee
Replacement [3]
Osteoarthritis, Primary and Secondary 82.5% 1.4% 96.8%
Rheumatoid Arthritis 1.6% 0.8%
Other or Unspecified Arthropathy 0.8% 0.3% 0.0%
Fracture of Neck of Femur, Femur or Lower Leg, Including Pathological Fracture 4.9% 82.8%
Other Diseases of Bone and Cartilage 7.4% 0.2% 0.2%
Complication of Internal Orthopedic Device, Implant, and Gra� 1.3% 4.1%
All Other 1.5% 11.2% 2.2%
Total Procedures 232,857 119,688 454,652
[1] ICD-9-CM procedure code 8151. [2] ICD-9-CM procedure code 8152. [3] ICD-9-CM procedure code 8154.
[4] An unknown error in the partial hip replacement data occurred in the NHDS 2004 data file. A correction for total partial hip cases was made byexcluding cases with diagnosis of spine (720.xx-724.xx, 737.xx, 756.xx, 805.xx, 806.xx)
Source: National Center for Health Statistics, National Hospital Discharge Survey, 2004
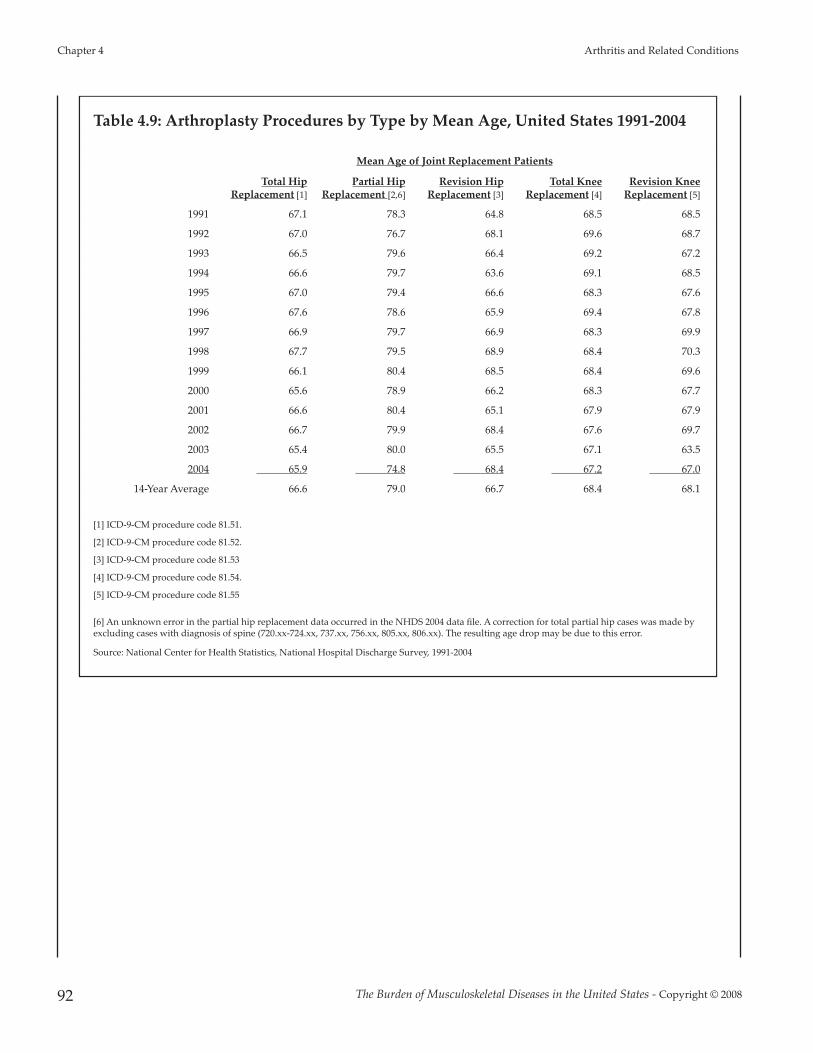
The Burden of Musculoskeletal Diseases in the United States - Copyright © 2008
Chapter 4 Arthritis and Related Conditions
92
Table 4.9: Arthroplasty Procedures by Type by Mean Age, United States 1991-2004
Mean Age of Joint Replacement Patients
Total HipReplacement [1]
Partial HipReplacement [2,6]
Revision HipReplacement [3]
Total KneeReplacement [4]
Revision KneeReplacement [5]
1991 67.1 78.3 64.8 68.5 68.5
1992 67.0 76.7 68.1 69.6 68.7
1993 66.5 79.6 66.4 69.2 67.2
1994 66.6 79.7 63.6 69.1 68.5
1995 67.0 79.4 66.6 68.3 67.6
1996 67.6 78.6 65.9 69.4 67.8
1997 66.9 79.7 66.9 68.3 69.9
1998 67.7 79.5 68.9 68.4 70.3
1999 66.1 80.4 68.5 68.4 69.6
2000 65.6 78.9 66.2 68.3 67.7
2001 66.6 80.4 65.1 67.9 67.9
2002 66.7 79.9 68.4 67.6 69.7
2003 65.4 80.0 65.5 67.1 63.5
2004 65.9 74.8 68.4 67.2 67.0
14-Year Average 66.6 79.0 66.7 68.4 68.1
[1] ICD-9-CM procedure code 81.51.
[2] ICD-9-CM procedure code 81.52.
[3] ICD-9-CM procedure code 81.53
[4] ICD-9-CM procedure code 81.54.
[5] ICD-9-CM procedure code 81.55
[6] An unknown error in the partial hip replacement data occurred in the NHDS 2004 data file. A correction for total partial hip cases was made byexcluding cases with diagnosis of spine (720.xx-724.xx, 737.xx, 756.xx, 805.xx, 806.xx). The resulting age drop may be due to this error.
Source: National Center for Health Statistics, National Hospital Discharge Survey, 1991-2004

The Burden of Musculoskeletal Diseases in the United States - Copyright © 2008 93
Arthritis and Related Conditions Chapter 4
Table 4.10: Average Inpatient Length of Stay for Selected ArthroplastyProcedures, United States 1991-2004
Mean Days of Hospitalization for Procedure
Total HipReplacement
[81.51]
Partial HipReplacement
[81.52]
Revision of Hip
Replacement[81.53]
Total KneeReplacement
[81.54]
Revision of Knee
Replacement[81.55]
1991 9.0 11.9 11.3 9.5 8.81992 8.9 10.6 9.7 8.9 8.41993 7.8 10.3 9.5 7.4 6.61994 7.2 9.4 7.9 6.8 6.21995 6.3 8.5 6.1 5.6 5.01996 5.3 7.0 6.0 5.1 4.41997 4.9 7.0 5.8 4.6 4.51998 4.8 6.7 5.5 4.5 4.71999 4.8 6.9 5.9 4.5 4.62000 4.9 7.5 6.2 4.5 4.72001 4.8 6.7 5.8 4.4 4.62002 4.5 7.1 5.4 4.2 4.42003 4.3 7.1 5.7 4.0 4.42004 [1] 4.3 7.3 5.4 3.9 4.7
[1] An unknown errr in the partial hip replacement data occurred in the NHDS 2004 data file. A correction for total partialhip cases was made by excluding cases with diagnosis of spine (720.xx-724.xx, 737.xx, 756.xx, 805.xx, 806.xx)
Source: National Center for Health Statistics, National Hospital Discharge Survey, 2004

The Burden of Musculoskeletal Diseases in the United States - Copyright © 2008
Chapter 4 Arthritis and Related Conditions
94
Table 4.11: Discharge Status for Patients Aged 18 and Over and 65 and Over UndergoingSelected Major Joint Procedures, Comparison of Two National Health Care HospitalDischarge Surveys, United States 2004
Aged 18 Years and OlderProportion of Total Replacement Patients
All Inpatient
DischargesNHDS Survey [1]Total
Hip [3]Partial
Hip [4,8]Revision
Hip [5]Total
Knee [6]RevisionKnee [7]
All Hip and Knee
Routine Discharge Home 45.5% 13.2% 38.0% 47.5% 49.4% 47.0% 75.0%
Discharged/ Transferred to Short-Term/Skilled Nursing/Intermediate Care
32.6% 65.8% 39.2% 30.8% 34.6% 32.7% 0.1%
Unknown/ Other Discharge Status 21.9% 21.0% 22.8% 21.7% 16.0% 20.3% 10.6%
Total Cases 232,857 114,576 45,068 454,382 39,155 1,007,553 31,711,934
NIS Survey [2]
Routine Discharge Home 20.6% 5.3% 19.3% 23.2% 22.6% 20.8% 69.9%
Discharged/ Transferred to Short-Term/Skilled Nursing/Intermediate Care
50.4% 86.2% 49.3% 46.7% 41.7% 52.0% 16.8%
Unknown/ Other Discharge Status 29.1% 8.4% 31.5% 31.1% 35.8% 27.2% 13.3%
Total Cases 226,484 104,802 37,848 434,222 35,108 845,500 31,950,026
Aged 65 Years and OlderProportion of Total Replacement Patients
All Inpatient
DischargesNHDS Survey [1]Total
Hip [3]Partial
Hip [4,8]Revision
Hip [5]Total
Knee [6]RevisionKnee [7]
All Hip and Knee
Routine Discharge Home 33.1% 7.8% 31.6% 38.2% 48.6% 32.8% 58.5%
Discharged/ Transferred to Short-Term/Skilled Nursing/Intermediate Care
41.9% 71.7% 43.0% 37.8% 36.0% 43.6% 26.1%
Unknown/ Other Discharge Status 24.9% 20.5% 25.4% 24.1% 15.4% 23.6% 15.4%
Total Cases 135,400 99,125 32,182 280,118 24,859 599,541 13,170,557
NIS Survey [2]
Routine Discharge Home 12.6% 3.9% 13.4% 17.5% 16.6% 13.7% 50.2%
Discharged/ Transferred to Short-Term/Skilled Nursing/Intermediate Care
66.8% 89.0% 62.4% 57.7% 52.1% 65.4% 30.1%
Unknown/ Other Discharge Status 20.6% 7.1% 24.2% 24.8% 31.4% 20.9% 19.7%
Total Cases 127,930 95,569 23,289 269,069 20,764 536,040 13,090,185
[1] Source: National Center for Health Statistics, National Hospital Discharge Survey, 2004
[2] Source: National Center for Health Statistics, Nationwide Inpatient Sample, 2004
[3] ICD-9-CM procedure code 81.51 [4] ICD-9-CM procedure code 81.52
[5] ICD-9-CM procedure code 81.53 [6] ICD-9-CM procedure code 81.54
[7] ICD-9-CM procedure code 81.55[8] An unknown error in the partial hip replacement data occurred in the NHDS 2004 data file. A correction for total partial hip cases was made byexcluding cases with diagnosis of spine (720.xx-724.xx, 737.xx, 756.xx, 805.xx, 806.xx)

The Burden of Musculoskeletal Diseases in the United States - Copyright © 2008 95
Arthritis and Related Conditions Chapter 4
Table 4.12: Joint Replacement Procedures in the United States, 1991-2004
National Hospital Discharge Survey
Joint Replacement Procedures (in 000s)
Description
ICD-9CM
Code 1991 1992 1993 1994 1995 1996 1997 1998 1999 2000 2001 2002 2003 2004
Total Hip Replacement 81.51 117.0 127.0 125.0 124.0 134.0 138.0 144.0 160.0 168.0 152.0 165.5 193.0 220.1 234.0
Partial Hip Replacement [1] 81.52 90.0 88.0 84.0 93.0 97.0 103.0 103.0 112.0 106.0 106.0 118.5 108.8 108.0 119.7
Revision of HipReplacement 81.53 25.0 23.0 26.0 28.0 29.0 30.0 37.0 33.0 30.0 31.0 36.1 42.7 35.6 46.0
Total Knee Replacement 81.54 160.0 167.0 179.0 209.0 216.0 245.0 259.0 266.0 267.0 299.0 325.6 381.3 418.3 478.0
Revision of KneeReplacement 81.55 17.0 13.0 15.0 19.0 18.0 20.0 25.0 23.0 25.0 28.0 29.4 35.1 33.1 40.0
TOTAL Hip and KneeReplacement/Revision Procedures 409.0 418.0 429.0 473.0 494.0 536.0 568.0 594.0 596.0 616.0 675.1 760.8 815.1 917.7
[1] An unknown error in the partial hip replacement data occurred in the NHDS 2004 data file. A correction for total partial hip cases was made byexcluding cases with diagnosis of spine (720.xx-724.xx, 737.xx, 756.xx, 805.xx, 806.xx)
Source: National Center for Health Statistics, National Hospital Discharge Survey, 1991-2004
Nationwide Inpatient SampleJoint Replacement Procedures (in 000s)
Description
ICD-9CM
Code 1991 1992 1993 1994 1995 1996 1997 1998 1999 2000 2001 2002 2003 2004
Total Hip Replacement 81.51 135.7 139.9 144.1 148.2 152.6 157.0 161.6 166.7 171.7 176.1 181.5 187.7 194.3 227.5
Partial Hip Replacement 81.52 96.3 97.9 99.5 100.8 102.2 103.5 104.7 105.8 106.8 107.4 108.7 109.9 111.2 105.1
Revision of HipReplacement 81.53 27.5 28.3 29.1 29.9 30.8 31.7 32.5 33.5 34.4 35.2 36.2 37.2 38.3 37.9
Total Knee Replacement 81.54 192.2 203.6 215.5 227.9 241.1 255.1 270.0 286.6 304.0 321.8 342.0 365.3 391.1 435.5
Revision of KneeReplacement 81.55 16.5 17.5 18.5 19.5 20.7 21.9 23.2 24.6 26.1 27.6 29.3 31.2 33.4 36.2
TOTAL Hip and KneeReplacement/Revision Procedures 468.2 487.2 506.7 526.3 547.4 569.2 592.0 617.2 643.0 668.1 697.7 731.3 768.3 842.2
Source: Agency for Healthcare Research and Quality, Healthcare Cost and Utilization Project, Nationwide Inpatient Sample, 1991-2004

The Burden of Musculoskeletal Diseases in the United States - Copyright © 2008
Chapter 4 Arthritis and Related Conditions
96
Table 4.13: Mean and Total Hospitalization Charges [1] for Hip and Knee JointReplacement Procedures, United States, 1998-2004
Average (Mean) Charges Per Hospitalization (rounded to nearest 000)
1998 1999 2000 2001 2002 2003 2004Total Hip Replacement [2] $22,000 $23,000 $26,000 $27,000 $31,000 $35,000 $37,000Partial Hip Replacement [3] $22,000 $23,000 $26,000 $28,000 $32,000 $35,000 $39,000Revision Hip Replacement [4] $27,000 $31,000 $32,000 $34,000 $39,000 $45,000 $46,000Total Knee Replacement [5] $21,000 $22,000 $24,000 $26,000 $29,000 $31,000 $33,000Revision Knee Replacement [6] $24,000 $25,000 $30,000 $30,000 $35,000 $42,000 $42,000
Total Hospitalization Charges for Joint Replacements (in billions)
1998 1999 2000 2001 2002 2003 2004Total Hip Replacement [2] $3.37 $3.64 $4.00 $5.07 $5.91 $6.77 $8.34Partial Hip Replacement [3] $2.27 $2.39 $2.63 $2.98 $3.35 $3.58 $3.97Revision Hip Replacement [4] $0.83 $0.99 $1.04 $1.32 $1.47 $1.66 $1.69Total Knee Replacement [5] $5.36 $5.67 $6.22 $8.06 $9.82 $11.38 $14.26Revision Knee Replacement [6] $0.54 $0.63 $0.70 $0.85 $1.01 $1.47 $1.48
Total Hip and Knee Replacement Cost $12.37 $13.32 $14.59 $18.29 $21.57 $24.86 $29.74
[1] Generally, total charges do not include professional fees and non-covered charges. In the rare cases where professional fees cannot be removed, they areincluded in the database. Emergency department charges incurred prior to admission to the hospital may be included in total charges.
[2] ICD-9-CM procedure code 81.51 [3] ICD-9-CM procedure code 81.52 [4] ICD-9-CM procedure code 81.53 [5] ICD-9-CM procedure code 81.54 [6] ICD-9-CM procedure code 81.55
Source: Agency for Healthcare Research and Quality, Healthcare Cost and Utilization Project, Nationwide Inpatient Sample, 1998-2004
Table 4.14: Projected Number of Hip and Knee Arthroplasties, United States 2005-2030
Annual Number of Procedures (in 000s)
2005 2010 2020 2030
VariableRate [1]
ConstantRate [2]
VariableRate [1]
ConstantRate [2]
VariableRate [1]
ConstantRate [2]
VariableRate [1]
ConstantRate [2]
Primary Total Hip Arthroplasty 209 179 253 194 384 236 572 277 Primary Total Knee Arthroplasty 450 301 663 329 1,520 415 3,481 488
Revision Total Hip Arthroplasty 40.8 36.0 47.8 38.9 67.6 47.2 96.7 56.6 Revision Total Knee Arthroplasty 38.3 25.9 55.3 28.1 121.0 35.1 268.0 41.7
[1] Projection based on arthroplasty rate increase due to aging of population and changes in the rate of joint replacement surgery.
[2] Projection based on the historical rate of procedures found in the Nationwide Inpatient Sample, 1990 to 2003.
Source: Kurtz S, Lau E, Mowat F, et al: The future burden of hip and knee revisions: U.S. projections from 2005 to 2030. Paper presented at: 73rd AnnualMeeting of the American Academy of Orthopaedic Surgeons:Chicago, IL2006. Used with permission of the primary author.

Chapter 5
Osteoporosis and Bone Health
The Burden of Musculoskeletal Diseases in the United States - Copyright © 2008 97
Osteoporosis has been called the “silent disease”because it typically progresses without symptomsuntil a fracture occurs.1 Osteoporosis is age-related and characterized by low bone mass dueto the loss of bone in the aging process. Bones areeasier to break even from falls at low heights,such as standing, or during the course of simpledaily activities. In 2002, an estimated 44 millionpersons over the age of 50 in the United Stateswere at risk for fracture due to osteoporosis orlow bone mass. By 2020, if current trendscontinue and effective treatments are not foundand widely implemented, it is estimated that over61 million persons will be at risk.1
The economic burden of inpatient, outpatient andlong-term care of incident osteoporotic fracturesin the U.S. was estimated at nearly $17 billion in2005; cumulative cost over the next 2 decades areestimated to be $474 billion.2 In addition to dollarcost, osteoporosis-related fractures bring aburden of pain and disability, resulting in timelost from work or the inability to performactivities of daily living.
Section 5.1: Osteoporosis and LowBone Mass
Osteoporosis is a disease characterized by lowbone mass and deterioration of bone structurethat causes bone fragility and increases the risk offracture. Gradual loss of bone with aging isnormal; however, that loss may be accelerated byfactors such as menopause, serious healthconditions or their treatment, and lifestyle factorssuch as inadequate diet, lack of exercise,smoking, or excessive alcohol consumption.
Although often considered a disease primarily offemales, within the past decade it has becomeapparent that osteoporosis is not solely awomen’s disease. It affects an estimated 2 millionmen in the United States, particularly older men.In men, as in women, the low bone mineraldensity characteristic of osteoporosis is associatedwith an increased risk of bone fracture. Fracturemost commonly affects the hip and lumbarvertebrae, but the radius, tibia, and ribs also maybe affected. Rates of fracture-related morbidityand mortality are significant in all older persons,but are substantially higher in men than inwomen.
The presentation and cause of osteoporosis differbetween men and women in several importantways. For example, the condition manifests laterin life in men, probably because men initiallyhave a greater bone mass. Moreover, unlikeamong women, for nearly half of men withosteoporosis an underlying cause can beidentified. Among the causes of osteoporosis inmen are corticosteroid therapy for arthritis orasthma, hypogonadism in patients being treatedfor cancer of the prostate with androgen-withdrawal therapy, consumption of largeamounts of alcohol, hyperthyroidism, andvitamin D deficiency
Currently, the diagnosis of osteoporosis is definedby the World Health Organization (WHO), and isbased on the results of dual energy x-rayabsorptiometry (DXA) testing, which evaluatesthe bone mineral density (BMD) present atseveral sites. WHO defines osteoporosis as aBMD value more than 2.5 standard deviations(SD) below the average value for a young, healthy

woman (a T-score of <-2.5 SD).3 Osteopenia, orlow bone mass, is defined as -1.0 to -2.5 SD, or10% to 30%, below the normal bone mass.4
Section 5.1.1: Osteoporosis Disease ClassificationsDefined
For purposes of this chapter, osteoporosis-relatedconditions will be presented using three broadcategories, based on ICD-9-CM diagnosis codes.(Table 5.1) Primary osteoporosis includes onlypersons who have a diagnosis of osteoporosis. Itis found primarily among elderly persons, withpostmenopausal women affected at the highestrates. The reasons why some persons developosteoporosis while others do not is unclear;however, estrogen deficiency has been identifiedby the U.S. Department of Health and HumanServices, Office of the Surgeon General, as aprimary cause in both men and women.4
Low energy fractures, formerly referred to asfragility fractures, occur from an event such as afall from a standing height or less (versus a highenergy cause such as a vehicular accident). Ingeneral, the lower the BMD, the higher risk of alow energy fracture. However, the reasons whysome women and men with low BMD do notexperience low energy fractures in circumstancessimilar to those who do are not well understood.
Secondary osteoporosis occurs when anothercondition or treatment causes erosion of bonehealth. Causes of secondary osteoporosis includecertain diseases, such as hyperthyroidism orceliac disease, and certain medications, especiallyglucocorticoids. In addition, some lifestyle habits,such as low activity levels, diets with low calciumintake, and smoking are believed to contribute tothe development of osteoporosis. In 2004, 6.1million persons aged 45 and over in the UnitedStates were diagnosed with a condition that cancontribute to the development of osteoporosis.
In recent years, knowledge about osteoporosisrisk factors, diagnostic criteria, and treatmentoptions has advanced rapidly.1,5 Research intotreatments and preventive measures isflourishing. Clinical trials have shown thatsuppression of bone turnover markers, anindication of a slowing of bone loss, can beachieved in as little as 3 months of usingprescription therapies, reducing the risk for lowenergy fractures.6 However, it is also known thatmany patients diagnosed with osteoporosis donot follow the treatment regime, often due tomedication side effects, and that not all patientsrespond to current therapies. Perhaps mostimportant, current data demonstrate that themajority of patients who suffer a low energyfracture and are subsequently among those athighest risk for repeat fracture typically are notevaluated for osteoporosis, much less treated.
Section 5.1.2: Prevalence of Osteoporosis
Estimates of the prevalence of osteoporosis andlow bone mass are based on the best availablescientific information from leading researchers.There are no definitive sources of information onthe numbers of persons with osteoporosis or atrisk for low energy fractures, as this is truly a“silent disorder.” Estimates of prevalence amongwhite females are generally believed to be morereliable because this group has been studied themost due to their high fracture rate. The incidenceor prevalence among males and racial groups iseven more difficult to estimate as there are nodefinitions of what constitutes osteoporosis andlow bone mass in these groups as there are withwhite women. However, the incidence ofosteoporosis and low bone mass among thesegroups is believed to be higher than previouslyestimated. The leading national study thatprovides data upon which to make theseestimates is the National Health and NutritionExamination Study (NHANES), a self-reported
The Burden of Musculoskeletal Diseases in the United States - Copyright © 2008
Chapter 5 Osteoporosis and Bone Health
98
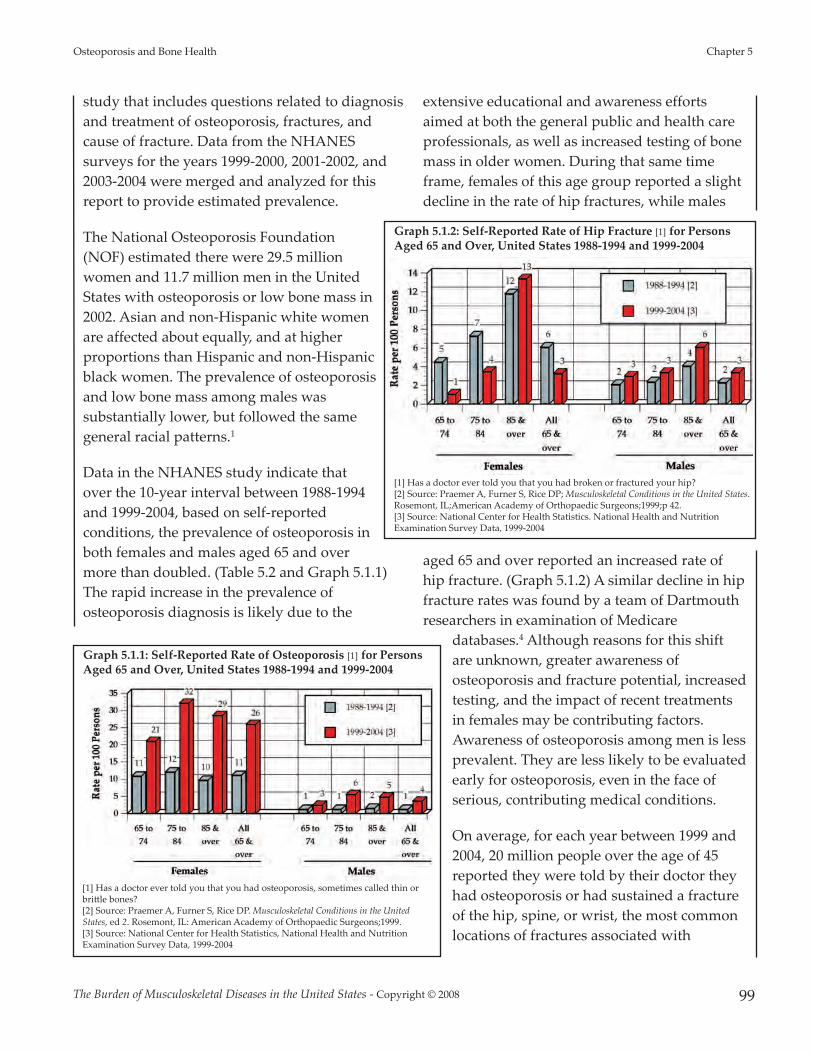
study that includes questions related to diagnosisand treatment of osteoporosis, fractures, andcause of fracture. Data from the NHANESsurveys for the years 1999-2000, 2001-2002, and2003-2004 were merged and analyzed for thisreport to provide estimated prevalence.
The National Osteoporosis Foundation(NOF) estimated there were 29.5 millionwomen and 11.7 million men in the UnitedStates with osteoporosis or low bone mass in2002. Asian and non-Hispanic white womenare affected about equally, and at higherproportions than Hispanic and non-Hispanicblack women. The prevalence of osteoporosisand low bone mass among males wassubstantially lower, but followed the samegeneral racial patterns.1
Data in the NHANES study indicate thatover the 10-year interval between 1988-1994and 1999-2004, based on self-reportedconditions, the prevalence of osteoporosis inboth females and males aged 65 and overmore than doubled. (Table 5.2 and Graph 5.1.1)The rapid increase in the prevalence ofosteoporosis diagnosis is likely due to the
extensive educational and awareness effortsaimed at both the general public and health careprofessionals, as well as increased testing of bonemass in older women. During that same timeframe, females of this age group reported a slightdecline in the rate of hip fractures, while males
aged 65 and over reported an increased rate ofhip fracture. (Graph 5.1.2) A similar decline in hipfracture rates was found by a team of Dartmouthresearchers in examination of Medicare
databases.4 Although reasons for this shiftare unknown, greater awareness ofosteoporosis and fracture potential, increasedtesting, and the impact of recent treatmentsin females may be contributing factors.Awareness of osteoporosis among men is lessprevalent. They are less likely to be evaluatedearly for osteoporosis, even in the face ofserious, contributing medical conditions.
On average, for each year between 1999 and2004, 20 million people over the age of 45reported they were told by their doctor theyhad osteoporosis or had sustained a fractureof the hip, spine, or wrist, the most commonlocations of fractures associated with
The Burden of Musculoskeletal Diseases in the United States - Copyright © 2008 99
Osteoporosis and Bone Health Chapter 5
Graph 5.1.1: Self-Reported Rate of Osteoporosis [1] for PersonsAged 65 and Over, United States 1988-1994 and 1999-2004
[1] Has a doctor ever told you that you had osteoporosis, sometimes called thin orbri�le bones?[2] Source: Praemer A, Furner S, Rice DP. Musculoskeletal Conditions in the UnitedStates, ed 2. Rosemont, IL: American Academy of Orthopaedic Surgeons;1999.[3] Source: National Center for Health Statistics, National Health and NutritionExamination Survey Data, 1999-2004
Graph 5.1.2: Self-Reported Rate of Hip Fracture [1] for PersonsAged 65 and Over, United States 1988-1994 and 1999-2004
[1] Has a doctor ever told you that you had broken or fractured your hip?[2] Source: Praemer A, Furner S, Rice DP; Musculoskeletal Conditions in the United States.Rosemont, IL;American Academy of Orthopaedic Surgeons;1999;p 42.[3] Source: National Center for Health Statistics. National Health and NutritionExamination Survey Data, 1999-2004

osteoporosis. (Table 5.3 and Graph 5.1.3) Theseself-reports were primarily among women in allage groups; the sole exception was persons aged45 to 64, among whom the self-reports werenearly evenly divided between the females andmales (51% to 49%, respectively.) Among those 85years of age or older, 80% self-reporting adiagnosis of osteoporosis or fracture were female,most likely reflecting the longevity of females andtheir preponderance in this age group.
The higher proportions of women in older agegroups reporting a diagnosis of osteoporosisand/or low energy fractures may also be due tothe fact that, as the population ages, the incidenceof both of these conditions rises steadily amongwomen, while that of males remains relativelysteady. Between the ages of 45 and 64,approximately 16% of both females and malesreport they have been told by a doctor they haveosteoporosis or have had a fracture of the hip,spine, or wrist. By the age of 85 or older, 48% offemales report osteoporosis and/or a fracture,while only 20% of males in this age group do so.
Thirty-six percent (36%) of females,compared to 48% of males, reporting anosteoporosis condition were under the ageof 65 years. (Table 5.3) The reason for thisvariation is not known.
Rates of treatment for osteoporosis reportedbetween 1999 and 2004 were slightly higherfor females than for males; however, thedifferences narrowed in individualsbetween the ages of 65 and 84. (Table 5.3and Graph 5.1.4) The data suggest that ifpatients recognize they have osteoporosis,the likelihood they will receive treatmentrises, an indication that education aboutscreening or testing for osteoporosis is animportant factor in ensuring better longterm outcomes.
Section 5.2: Health Care ResourceUtilization for Osteoporosis and LowEnergy Fractures
Section 5.2.1: Patient Visits, 2004
In 2004, 6.2 million persons aged 45 and over witha diagnosis of primary osteoporosis utilized
The Burden of Musculoskeletal Diseases in the United States - Copyright © 2008
Chapter 5 Osteoporosis and Bone Health
100
Graph 5.1.4: Self-Reported Treatment for Osteoporosis [1]by Gender for Persons Aged 45 and Over, United States 1999-2004
[1] Replied "Yes" when asked if ever been told by a doctor that you hadosteoporosis and had been treated for osteoporosis.Source: National Center for Health Statistics. National Health and NutritionExamination Survey Data, 1999-2004
Graph 5.1.3: Self-Reported Prevalance of Osteoporosis orFracture of Hip, Spine or Wrist for Persons Aged 45 and Over,United States 1999-2004
Source: National Center for Health Statistics. National Health and NutritionExamination Survey Data, 1999-2004
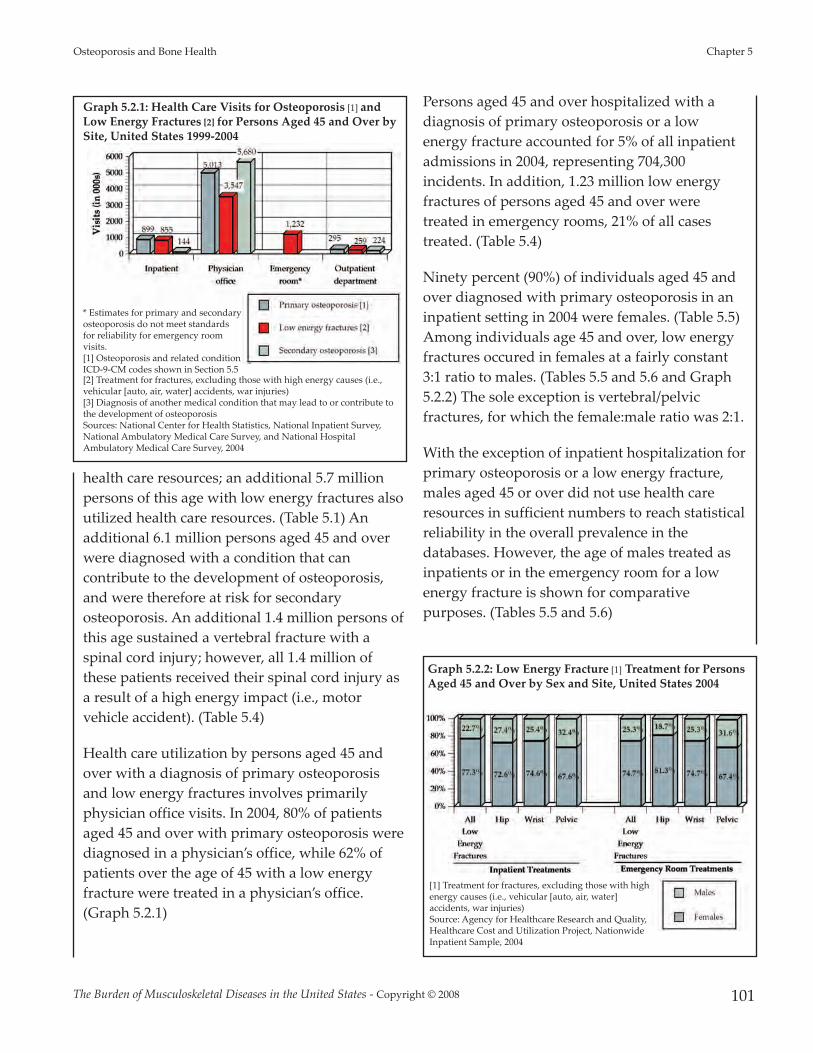
health care resources; an additional 5.7 millionpersons of this age with low energy fractures alsoutilized health care resources. (Table 5.1) Anadditional 6.1 million persons aged 45 and overwere diagnosed with a condition that cancontribute to the development of osteoporosis,and were therefore at risk for secondaryosteoporosis. An additional 1.4 million persons ofthis age sustained a vertebral fracture with aspinal cord injury; however, all 1.4 million ofthese patients received their spinal cord injury asa result of a high energy impact (i.e., motorvehicle accident). (Table 5.4)
Health care utilization by persons aged 45 andover with a diagnosis of primary osteoporosisand low energy fractures involves primarilyphysician office visits. In 2004, 80% of patientsaged 45 and over with primary osteoporosis werediagnosed in a physician’s office, while 62% ofpatients over the age of 45 with a low energyfracture were treated in a physician’s office.(Graph 5.2.1)
Persons aged 45 and over hospitalized with adiagnosis of primary osteoporosis or a lowenergy fracture accounted for 5% of all inpatientadmissions in 2004, representing 704,300incidents. In addition, 1.23 million low energyfractures of persons aged 45 and over weretreated in emergency rooms, 21% of all casestreated. (Table 5.4)
Ninety percent (90%) of individuals aged 45 andover diagnosed with primary osteoporosis in aninpatient setting in 2004 were females. (Table 5.5)Among individuals age 45 and over, low energyfractures occured in females at a fairly constant3:1 ratio to males. (Tables 5.5 and 5.6 and Graph5.2.2) The sole exception is vertebral/pelvicfractures, for which the female:male ratio was 2:1.
With the exception of inpatient hospitalization forprimary osteoporosis or a low energy fracture,males aged 45 or over did not use health careresources in sufficient numbers to reach statisticalreliability in the overall prevalence in thedatabases. However, the age of males treated asinpatients or in the emergency room for a lowenergy fracture is shown for comparativepurposes. (Tables 5.5 and 5.6)
The Burden of Musculoskeletal Diseases in the United States - Copyright © 2008 101
Osteoporosis and Bone Health Chapter 5
Graph 5.2.1: Health Care Visits for Osteoporosis [1] andLow Energy Fractures [2] for Persons Aged 45 and Over bySite, United States 1999-2004
* Estimates for primary and secondaryosteoporosis do not meet standardsfor reliability for emergency roomvisits.[1] Osteoporosis and related conditionICD-9-CM codes shown in Section 5.5[2] Treatment for fractures, excluding those with high energy causes (i.e.,vehicular [auto, air, water] accidents, war injuries)[3] Diagnosis of another medical condition that may lead to or contribute tothe development of osteoporosisSources: National Center for Health Statistics, National Inpatient Survey,National Ambulatory Medical Care Survey, and National HospitalAmbulatory Medical Care Survey, 2004
Graph 5.2.2: Low Energy Fracture [1] Treatment for PersonsAged 45 and Over by Sex and Site, United States 2004
[1] Treatment for fractures, excluding those with highenergy causes (i.e., vehicular [auto, air, water]accidents, war injuries)Source: Agency for Healthcare Research and Quality,Healthcare Cost and Utilization Project, NationwideInpatient Sample, 2004
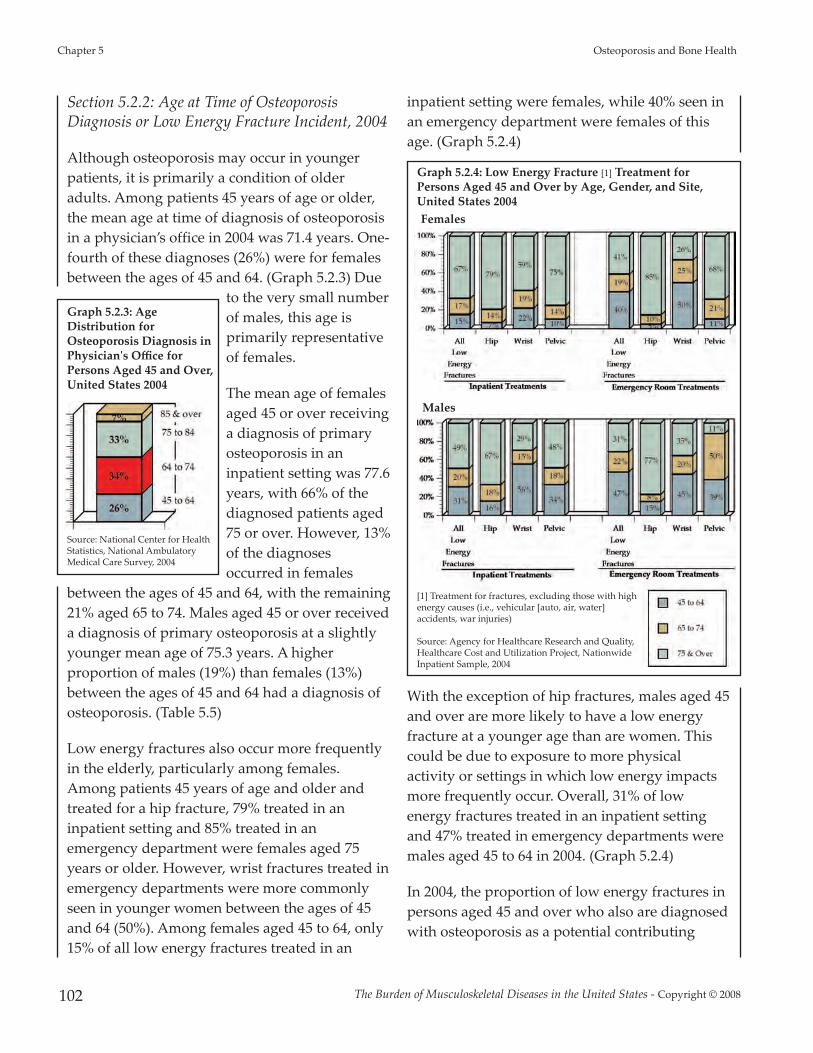
Section 5.2.2: Age at Time of OsteoporosisDiagnosis or Low Energy Fracture Incident, 2004
Although osteoporosis may occur in youngerpatients, it is primarily a condition of olderadults. Among patients 45 years of age or older,the mean age at time of diagnosis of osteoporosisin a physician’s office in 2004 was 71.4 years. One-fourth of these diagnoses (26%) were for femalesbetween the ages of 45 and 64. (Graph 5.2.3) Due
to the very small numberof males, this age isprimarily representativeof females.
The mean age of femalesaged 45 or over receivinga diagnosis of primaryosteoporosis in aninpatient setting was 77.6years, with 66% of thediagnosed patients aged75 or over. However, 13%of the diagnosesoccurred in females
between the ages of 45 and 64, with the remaining21% aged 65 to 74. Males aged 45 or over receiveda diagnosis of primary osteoporosis at a slightlyyounger mean age of 75.3 years. A higherproportion of males (19%) than females (13%)between the ages of 45 and 64 had a diagnosis ofosteoporosis. (Table 5.5)
Low energy fractures also occur more frequentlyin the elderly, particularly among females.Among patients 45 years of age and older andtreated for a hip fracture, 79% treated in aninpatient setting and 85% treated in anemergency department were females aged 75years or older. However, wrist fractures treated inemergency departments were more commonlyseen in younger women between the ages of 45and 64 (50%). Among females aged 45 to 64, only15% of all low energy fractures treated in an
inpatient setting were females, while 40% seen inan emergency department were females of thisage. (Graph 5.2.4)
With the exception of hip fractures, males aged 45and over are more likely to have a low energyfracture at a younger age than are women. Thiscould be due to exposure to more physicalactivity or settings in which low energy impactsmore frequently occur. Overall, 31% of lowenergy fractures treated in an inpatient settingand 47% treated in emergency departments weremales aged 45 to 64 in 2004. (Graph 5.2.4)
In 2004, the proportion of low energy fractures inpersons aged 45 and over who also are diagnosedwith osteoporosis as a potential contributing
The Burden of Musculoskeletal Diseases in the United States - Copyright © 2008
Chapter 5 Osteoporosis and Bone Health
102
Graph 5.2.4: Low Energy Fracture [1] Treatment forPersons Aged 45 and Over by Age, Gender, and Site,United States 2004Females
Males
[1] Treatment for fractures, excluding those with highenergy causes (i.e., vehicular [auto, air, water]accidents, war injuries)
Source: Agency for Healthcare Research and Quality,Healthcare Cost and Utilization Project, NationwideInpatient Sample, 2004
Graph 5.2.3: AgeDistribution forOsteoporosis Diagnosis inPhysician's Office forPersons Aged 45 and Over,United States 2004
Source: National Center for HealthStatistics, National AmbulatoryMedical Care Survey, 2004

cause was verylow. Among allpatients aged45 and olderwith a lowenergy fractureseen in aphysician’soffice, anemergencyroom, or anoutpatientsetting in 2004,fewer than 2%were alsodiagnosedwithosteoporosis.Even in an
inpatient setting, only 16% of low energy fracturepatients also had an osteoporosis diagnosis, anindication that osteoporosis is under-diagnosedeven when patients are admitted to a hospital.Females with a low energy fracture were fourtimes as likely as males with afracture to be diagnosed withosteoporosis. The failure torecognize osteoporosis as apossible contributing cause of thefracture increases the possibility offuture fractures in this already atrisk population. (Tables 5.4 and 5.5and Graph 5.2.5)
Section 5.2.3: Short/Long-TermCare for Low Energy FracturePatients
Regardless of the age at which alow energy fracture occurs, bothfemales and males are more likelyto be transferred to a short,intermediate, or long-term skilled
nursing care setting upon their release frominpatient care than are persons without a fracture.The older the patient, the greater the likelihoodthat such a transfer will be necessary. Amongnon-fracture female patients, approximately 24%are released to additional care settings, whileapproximately 38% of non-fracture patients aged75 and over are released to another care setting.By contrast, among all female hip fracturepatients, the proportions are 83% and 86% for allpatients and those aged 75 and over, respectively.Even female patients with a wrist fracture aremore likely to be released to additional care, with45% of all patients with this type of fracture goingto another care setting, and 60% of those aged 75and over doing so. The rates for males released toan additional care setting are slightly lower, butstill substantially higher than for patients with nofracture. (Table 5.7 and Graph 5.2.6) The cost ofadditional care for patients with low energyfractures has not been quantified due to lack ofavailable data.
The Burden of Musculoskeletal Diseases in the United States - Copyright © 2008 103
Osteoporosis and Bone Health Chapter 5
Graph 5.2.5: Proportion of Low EnergyFracture [1] Patients Aged 45 and Overwith a Diagnosis of Osteoporosis bySite and Gender, United States 2004
[1] Treatment for fractures, excluding those withhigh energy causes (i.e., vehicular [auto, air, water]accidents, war injuries)[2] Source: Agency for Healthcare Research andQuality, Healthcare Cost and Utilization Project,Nationwide Inpatient Sample, 2004[3] Source: National Center for Health Statistics,National Hospital Ambulatory Medical Care Survey,Outpatient Centers, 2004 [4] Source: National Center for Health Statistics,National Hospital Ambulatory Medical Care Survey,Hospital Emergency, 2004 [5] Source: National Center for Health Statistics,National Ambulatory Medical Care Survey, 2004
Graph 5.2.6: Hospital Discharge to Short/Intermediate/Skilled Nursing Carefor Persons Aged 45 and Over by Age and Sex for Persons with Osteoporosis,Low Energy Fractures [1] and without a Fracture, United States 2004
[1] Treatment for fractures, excluding those withhigh energy causes (i.e., vehicular [auto, air, water]accidents, war injuries)Source: Agency for Healthcare Research andQuality, Healthcare Cost and Utilization Project,Nationwide Inpatient Sample, 2004

Section 5.2.4: Nursing Home Population andRisks of the Fragile Elderly
After an elderly person has sustained a fallresulting in fracture, his or her ability to liveindependently is reduced due to pain andlimitations in activity. These patients are also atrisk of additional falls and consequent fractures.These patients require additional care andresources. Among persons in the nursing homepopulation in 2004, 7,640 (< 1% of totaladmissions) were diagnosed with osteoporosis atthe time of their admission; the majority wereaged 75 and older. (Table 5.8) A substantiallylarger number, more than 118,000 (8% ofadmissions), had sustained a low energy fractureat the time of admission, most likely due toosteoporosis and fragile bones. Femalesaccounted for more than 82% of the nursing homeadmittances due to fracture; 92% of the nursinghome admittances were aged 75 years of age orolder at the time of the fracture. Hip fractures arethe most common type of fracture that placesolder persons in a nursing home, accounting for44% of admittances due to fracture. However,pelvic, upper and lower limb, ankle or foot, andstress fractures are also a common cause ofplacement in a nursing home for persons aged 75and older.
At the time of interview in 2004, nearly 40,200nursing home residents aged 65 and older hadsustained a new fracture since being admitted.The majority of these were females (74%); morethan one-half (58%) were 85 years of age or older.Nearly 522,000 nursing home residents aged 65and older, or two in five, reported reported a fallwithin the past 6 months. Of those falling, 2%, or27,600, sustained a hip fracture within the past 6months, and 33,900 (3%) another type of fracture.
As the number of U.S. persons over the age of 75increases in the next few decades, the burdenplaced on nursing home care due to fragile bones
will increase. Reducing the incidence and severityof osteoporosis will be critical to maintaining thehealth of the aging population, as well asreducing health care costs.
Section 5.3: Falls and Low EnergyFractures
Falls are the leading cause of injury, includingmortality and non-fatal injuries, for persons aged65 and older in the United States and a leadingcause of hospitalization among persons of allages. In 2000, falls accounted for 46% of allhospitalizations from injuries; 309 out of every100,000 persons suffering a fall werehospitalized.7 In 2002, 12% of unintentional injurydeaths resulted from falls and 1.6 million nonfatalinjuries from falls were treated at hospitalemergency departments throughout the UnitedStates.8
Fractures are the primary cause of hospitalizationor death following a fall, particularly amongindividuals aged 65 and over. Osteoporosis is aleading underlying cause of low energy fracturesafter a fall, especially among the elderly. One intwo women and one in four men over aged 50will have an osteoporosis-related fracture in heror his remaining lifetime.9
Self-reported fracture rates for hip, wrist, andspine, from 1999 to 2004, indicate an increasingrate of fracture among females as the populationages, particularly among individuals aged 85 andolder. Among males, relatively stable rates ofspine fracture occurred between the ages of 45and older, while wrist fracture rates decreasedwith age and hip fracture rates increased. (Table5.9 and Graph 5.3.1) Overall, 12% of fracturesreported for persons aged 45 and over were hipfractures; 19% were spine fractures; and 69% werewrist fractures.
The Burden of Musculoskeletal Diseases in the United States - Copyright © 2008
Chapter 5 Osteoporosis and Bone Health
104

Hip fractures significantly impact quality of life,and are invariably associated with chronic pain,reduced mobility, disability, and an increasingdegree of dependence.10 The mortality rate in thefirst 12 months after hip fracture is 20%, and ishigher in males than females.9 Some studiessuggest that mortality may be higher, with a 30%rate following hip fracture surgery noted.11
Current estimates are that one in four hipfractures occur in males, and recent researchindicates that men will have a different course ofrecovery than women, with higher rates ofdisability as well as mortality.12,13 Fifty percent ofpersons experiencing a hip fracture will be unableto walk without assistance, and 25% will requirelong term care.14
There is no generally accepted definition of aspine fracture, also referred to as compressionfractures, resulting in a wide variation of overallprevalence estimates.15 Only about one in fourspinal fractures are diagnosed as a result of falls.The most widely accepted definition of suspectedspine fractures in use today is a 20% loss of heightfrom early adulthood, hence compressing thevertebral column. Since many of these fracturesoccur without acute symptoms and patients arerarely admitted to the hospital, it is easier to
obtain prevalence thanincidence. Often they arediagnosed when thepatient complains ofchronic back pain as theresult of compression orstress on the weakenedspine.4 Even without acutesymptoms, vertebralcompression fractures canimpact significantly onquality of life, affecting theability to walk, balance,and sometimes causeupper back, neck orabdominal pain. The
presence of existing vertebral fractures aregenerally considered a predictor for futurefracture risk of the spine, wrist and hip.
Among all females aged 45 and over, falls wereresponsible for nearly all wrist fractures, as wellas for the majority of hip fractures, treatedbetween 1999 and 2004. Males follow a similarpattern, although falls account for a slightly lowerproportion of fractures among men. Roughly halfof spine fractures are caused by falls, with othercauses, including automobile accidents,accounting for the remainder. The older thepatient, the more likely that a fall is the cause of afracture. (Table 5.9 and Graph 5.3.2)
The mean age at time of first fracture of the wristcaused by a fall for all females aged 45 and overreporting a wrist fracture was 62.9 years. Themean age at first fracture of the spine was 70.6years; for first hip fracture it was 74.8 years. Wristand spine fractures are more common amongyounger females, while hip fracture rates increasesignificantly among females aged 85 and older.Among males, the mean age of first wrist fractureis 60.2 years, reflecting the higher rate of fracturein younger males than in older males. The mean
The Burden of Musculoskeletal Diseases in the United States - Copyright © 2008 105
Osteoporosis and Bone Health Chapter 5
Graph 5.3.1: Self-Reported Fracture Rate [1] for Select Fractures by Sex and Age, United States 1999-2004
[1] Replied "yes" when asked if ever been told by a doctor that you had broken or fracturedyour (hip)(spine)(wrist).Source: National Center for Health Statistics, National Health and Nutrition ExaminationSurvey Data, 1999-2004

age of first hip fracture among males, at 69.2years, is nearly 5 years younger than amongfemales. Spine fractures due to a fall also occur ata younger age, 60.2 years, among males. As thepopulation ages, the age at which they report
their first fracture also rises. (Table 5.9 and Graph5.3.3)
The mean number of lifetime fractures of all sitesreported by all persons in the NHANES for theyears 1999 to 2004 was slightly over one; however,some persons reported multiple fractures. Forexample, in the 2003-2004 NHANES, the mostrecent year of data available, some respondentsreported 2 lifetime hip fractures, up to 6 lifetimewrist fractures, and up to 10 lifetime spinefractures.16
Section 5.3.1: Inpatient Treatment for LowEnergy Fractures, 2004
In 2004, slightly more than 704,000 persons overage 45 were discharged from the hospital aftersustaining a low energy fracture. More than one-third of the inpatient fractures were hip fractures(43% for females and 39% for males). Vertebrae/pelvic fractures comprised about one-fifth (19%and 22% for females and males, respectively). Theremaining fracture sites accounted for 10% or lessof all fractures treated in inpatient facilities. In thesame year, more than 1.2 million fractures topersons aged 45 and older were treated inemergency rooms. Fractures of the wrist or handaccounted for the largest proportion of these lowenergy fractures in both females and males,
The Burden of Musculoskeletal Diseases in the United States - Copyright © 2008
Chapter 5 Osteoporosis and Bone Health
106
Graph 5.3.3: Mean Age of 1st Fracture When Cause is aFall [1] for Select Fractures by Gender and Age, United States 1999-2004
Females
Males
[1] Self-reported age at time of first fracture and reported cause of fracturewas a "fall/tripped/slipped/fell out of bed" or "hard fall offladder/stool/downstairs."Source: National Center for Health Statistics.,National Health and NutritionExamination Survey Data, 1999-2004
Graph 5.3.2: Proportion of Fractures Resulting from a Fall [1] for Select Fractures by Sex and Age, United States 1999-2004
[1] Self-reported cause of fracture was a "fall/tripped/slipped/fell out of bed" or "hard fall offladder/stool/downstairs."Source: National Center for Health Statistics, National Health and Nutrition Examination Survey Data,1999-2004

accounting for 27% of total fractures incurred byboth genders. This was followed by fractures ofthe foot and ankle and upper limb (arm/shoulder)fractures. (Table 5.10 and Graph 5.3.4)
Section 5.4: Cost and Burden ofOsteoporosis and Low EnergyFractures, 2004
The mean length of inpatient stay for personsaged 45 and older with a diagnosis ofosteoporosis (but not a fracture) in 2004 was 5.3days, or 2% shorter than the mean stay of 5.4 daysfor patients without an osteoporosis diagnosis.The mean cost per inpatient stay for persons aged45 and older with an osteoporosis diagnosis in2004 was $21,209, which was 19% less than that ofpatients with similar demographics but withoutan osteoporosis diagnosis. The estimated cost in2004 of treating patients aged 45 and older whowere hospitalized and had a diagnosis ofosteoporosis was $19.1 billion. (Table 5.11) It isunlikely the osteoporosis diagnosis was theprimary diagnosis for which the patients werehospitalized.
The mean length of inpatientstay for persons aged 45 andolder with a low energy fracturein 2004 was 6.1 days, or 13%longer than the mean stay of 5.4days for patients without afracture injury. The mean costper inpatient stay for personsaged 45 and older with a lowenergy fracture in 2004 was$28,077, a cost that was 8%greater than that of patients withsimilar demographics butwithout a fracture. Theestimated cost in 2004 of treatinglow energy fractures in patientsaged 45 and older who were
hospitalized as a result of the fracture was $24.2billion. (Table 5.11)
The burden of osteoporosis is already high, and itis growing. The costs associated with this diseaseare also increasing in both men and women andin all ethnic groups. These data provide strongsupport for the initiation of societywideprevention measures, including early and regularscreening for bone health, as well as for greateremphasis on the diagnosis of individuals at riskfor osteoporosis and identification of newstrategies to improve treatment and treatmentadherence in high risk groups.
1. National Osteoporosis Foundation (NOF): America’sBone Health: The State of Osteoporosis and Low Bone Massin Our Nation. Washington DC: National OsteoporosisFoundation, 2002.
2. Burge RT, Dawson-Hughes B, Solomon DH, et al:Incidence and economic burden of osteoporosis-relatedfractures in the United States, 2005-2025. J Bone MinerRes 2007;22:465-475.
3. World Health Organization (WHO): WHO ScientificGroup on the Assessment of Osteoporosis at Primary HealthCare Level. Brussels, Belgium: WHO Press, Geneva,Switzerland, 2004.
The Burden of Musculoskeletal Diseases in the United States - Copyright © 2008 107
Osteoporosis and Bone Health Chapter 5
Graph 5.3.4: Proportion of Fracture Treatment [1] for Persons Aged 45 and Overby Anatomic Site and Treatment Location, United States 2004
[1] Osteoporosis and related condition ICD-9-CM codes shown in Section 5.5.[2] Source: Agency for Healthcare Research and Quality, Healthcare Cost and Utilization Project,Nationwide Inpatient Sample, 2004[3] Source: National Center for Health Statistics, National Hospital Ambulatory Medical Care Survey,Hospital Emergency Room, 2004

4. US Department of Health and Human Services(USDHHS): Bone Health and Osteoporosis: A Report of theSurgeon General. Rockville, MD: U.S. GovernmentPrinting Office, Office of the Surgeon General, 2004, p107.
5. Baim S, Biegel R, Binkley NC: Medicare and privatereimbursement of osteoporosis diagnosis andtreatment, in Osteoporosis Clinical Updates. WashingtonDC: National Osteoporosis Foundation, 2006, vol 7, pp1-8.
6. Bonnick SL, Shulman L: Monitoring osteoporosistherapy: bone mineral density, bone turnover markers,or both? Am J Med 2006;119:25S-31S.
7. Finkelstein EA, Corso PS, Miller TR: The Incidence andEconomic Burden of Injuries in the United States. NewYork, NY: Oxford University Press, Inc., 2006, p 187.
8. National Safety Council (NSC): Injury Facts, 2005-2006Edition. Itasca, IL: National Safety Council, 2006.
9. National Osteoporosis Foundation (NOF): NationalOsteoporosis Foundation Fast Facts. Available at:http://www.nof.org/osteoporosis/diseasefacts.htm. Accessed September 19, 2007.
10. International Osteoporosis Foundation (IOF): Facts andstatistics about osteoporosis and its impact, in, 2007.Available at: http://www.iofbonehealth.org/facts-and-statistics.html. Accessed September 19, 2007.
11. Moran CG, Wenn RT, Sikand M, Taylor AM: Earlymortality after hip fracture: is delay before surgeryimportant? J Bone Joint Surg Am 2005;87:483-489.
12. Orwig DL, Chan J, Magaziner J: Hip fracture and itsconsequences: differences between men and women.Orthop Clin North Am 2006;37:611-622.
13. Hawkes WG, Wehren L, Orwig D, et al: Genderdifferences in functioning after hip fracture. J GerontolA Biol Sci Med Sci 2006;61:495-499.
14. Riggs BL, Melton LJ: The worldwide problem ofosteoporosis: insights afforded by epidemiology. Bone1995;17:505S-511S.
15. Genant HK, Jergas M: Assessment of prevalent andincident vertebral fractures in osteoporosis research.Osteoporos Int 2003;14:S43-S55.
16. National Center for Health Statistics (NCHS): NationalHealth and Nutrition Examination Survey 2003-2004:Documentation, Codebook, and Frequencies. Hyattsville,MD: Centers for Disease Control, 2006, p 34.
The Burden of Musculoskeletal Diseases in the United States - Copyright © 2008
Chapter 5 Osteoporosis and Bone Health
108

The Burden of Musculoskeletal Diseases in the United States - Copyright © 2008 109
Osteoporosis and Bone Health Chapter 5
Section 5.5: Osteoporosis and Bone Health Data TablesFor purposes of this study, osteoporosis has been categorized into the three classifications. Primary osteoporosis is a diagnosisof osteoporosis. Low energy fracture is one caused by an event such as a fall from a standing height. (A high energy fracture, bycontrast, is caused by involvement in a motor vehicle accident.) Secondary osteoporosis is the presence of another condition ortreatment that may cause eroding of bone health and osteoporosis. Codes included in these three osteoporosis categories areas shown in Table 5.1.
Table 5.1: Osteoporosis and Bone Health: Analysis Codes
CODE ICD-9-CM CODE DESCRIPTION CODE ICD-9-CM CODE DESCRIPTIONOSTEOPOROSIS73300 Osteoporosis NOS 73303 Disuse Osteoporosis73301 Senile Osteoporosis 73309 Osteoporosis NEC73302 Idiopathic Osteoporosis
LOW ENERGY FRACTURESVertebral and Pelvic Fractures Wrist and Hand Fracture80500 Vertebral Fracture (Closed) 81300 Wrist Fracture (Closed)-Radius and Ulna Upper End80501 Vertebral Fracture (Closed) 81301 Wrist Fracture (Closed)-Radius and Ulna Upper End80502 Vertebral Fracture (Closed) 81302 Wrist Fracture (Closed)-Radius and Ulna Upper End80503 Vertebral Fracture (Closed) 81303 Wrist Fracture (Closed)-Radius and Ulna Upper End80504 Vertebral Fracture (Closed) 81304 Wrist Fracture (Closed)-Radius and Ulna Upper End80505 Vertebral Fracture (Closed) 81305 Wrist Fracture (Closed)-Radius and Ulna Upper End80506 Vertebral Fracture (Closed) 81306 Wrist Fracture (Closed)-Radius and Ulna Upper End80507 Vertebral Fracture (Closed) 81307 Wrist Fracture (Closed)-Radius and Ulna Upper End80508 Vertebral Fracture (Closed) 81308 Wrist Fracture (Closed)-Radius and Ulna Upper End80520 Vertebral Fracture (Closed)-Thoracic 81320 Wrist/forearm Fracture (Closed)-Radius and Ulna Sha�80540 Vertebral Fracture (Closed)-Lumbar 81321 Wrist/forearm Fracture (Closed)-Radius and Ulna Sha�80560 Pelvic Fracture (Closed)-Sacrum and Coccyx 81322 Wrist/forearm Fracture (Closed)-Radius and Ulna Sha�80580 Vertebral Fracture (Closed)-Unspecified 81323 Wrist/forearm Fracture (Closed)-Radius and Ulna Sha�80800 Pelvic Fracture (Closed)-Acetabulum 81340 Wrist/forearm Fracture (Closed)-Radius and Ulna Lower End80820 Pelvic Fracture (Closed)-Pubis 81341 Wrist/forearm Fracture (Closed)-Radius and Ulna Lower End80841 Pelvic Fracture (Closed)-Ilium 81342 Wrist/forearm Fracture (Closed)-Radius and Ulna Lower End80842 Pelvic Fracture (Closed)-Ischium 81343 Wrist/forearm Fracture (Closed)-Radius and Ulna Lower End80843 Pelvic Fracture (Closed)-Multiple 81344 Wrist/forearm Fracture (Closed)-Radius and Ulna Lower End80849 Pelvic Fracture (Closed)-Other 81345 Wrist/forearm Fracture (Closed)-Radius and Ulna Lower End80880 Pelvic Fracture (Closed)-Uunspecified 81380 Wrist/forearm Fracture (Closed)-Radius and Ulna Unspecified
81381 Wrist/forearm Fracture (Closed)-Radius and Ulna UnspecifiedUpper Limb Fracture (Shoulder and Arm) 81382 Wrist/forearm Fracture (Closed)-Radius and Ulna Unspecified81000 Upper limb Fracture (Closed)-Clavicle (Shoulder) 81383 Wrist/forearm Fracture (Closed)-Radius and Ulna Unspecified81001 Upper limb Fracture (Closed)-Clavicle (Shoulder) 81400 Wrist Fracture (Closed)-Carpal Bones81002 Upper limb Fracture (Closed)-Clavicle (Shoulder) 81401 Wrist Fracture (Closed)-Carpal Bones81003 Upper limb Fracture (Closed)-Clavicle (Shoulder) 81402 Wrist Fracture (Closed)-Carpal Bones81100 Upper limb Fracture (Closed)-Scapula (Shoulder) 81403 Wrist Fracture (Closed)-Carpal Bones81101 Upper limb Fracture (Closed)-Scapula (Shoulder) 81404 Wrist Fracture (Closed)-Carpal Bones81102 Upper limb Fracture (Closed)-Scapula (Shoulder) 81405 Wrist Fracture (Closed)-Carpal Bones81103 Upper limb Fracture (Closed)-Scapula (Shoulder) 81406 Wrist Fracture (Closed)-Carpal Bones81109 Upper limb Fracture (Closed)-Scapula (Shoulder) 81407 Wrist Fracture (Closed)-Carpal Bones81200 Upper limb Fracture (Closed)-Humerus Upper End 81408 Wrist Fracture (Closed)-Carpal Bones81201 Upper limb Fracture (Closed)-Humerus Upper End 81409 Wrist Fracture (Closed)-Carpal Bones81202 Upper limb Fracture (Closed)-Humerus Upper End 81500 Hand Fracture (Closed)-Metacarpal Bones81203 Upper limb Fracture (Closed)-Humerus Upper End 81501 Hand Fracture (Closed)-Metacarpal Bones81209 Upper limb Fracture (Closed)-Humerus Upper End 81502 Hand Fracture (Closed)-Metacarpal Bones81220 Upper limb Fracture (Closed)-Humerus Upper End 81503 Hand Fracture (Closed)-Metacarpal Bones81221 Upper limb Fracture (Closed)-Humerus Upper End 81504 Hand Fracture (Closed)-Metacarpal Bones81240 Upper limb Fracture (Closed)-Humerus Upper End 81509 Hand Fracture (Closed)-Metacarpal Bones81241 Upper limb Fracture (Closed)-Humerus Upper End81242 Upper limb Fracture (Closed)-Humerus Upper End81243 Upper limb Fracture (Closed)-Humerus Upper End81244 Upper limb Fracture (Closed)-Humerus Upper End Table 5.1 continued next page.81249 Upper limb Fracture (Closed)-Humerus Upper End

The Burden of Musculoskeletal Diseases in the United States - Copyright © 2008
Chapter 5 Osteoporosis and Bone Health
110
Table 5.1: Osteoporosis and Bone Health: Analysis Codes (continued)
CODE ICD-9-CM CODE DESCRIPTION CODE ICD-9-CM CODE DESCRIPTION
Ankle and Foot Fracture Hip Fracture
82400 Ankle Fracture (Closed)-Medial Malleolus 82000 Hip Fracture (Closed)-Neck of Femur
82420 Ankle Fracture (Closed)-Lateral Malleolus 82001 Hip Fracture (Closed)-Neck of Femur
82440 Ankle Fracture (Closed)-Bimalleolar 82002 Hip Fracture (Closed)-Neck of Femur
82460 Ankle Fracture (Closed)-Trimalleolar 82003 Hip Fracture (Closed)-Neck of Femur
82480 Ankle Fracture (Closed)-Unspecified 82009 Hip Fracture (Closed)-Neck of Femur
82500 Foot Fracture (Closed)- Calcaneus 82020 Hip Fracture (Closed)-Neck of Femur
82520 Foot Fracture (Closed)-Unspecified (Instep) 82021 Hip Fracture (Closed)-Neck of Femur
82521 Foot Fracture (Closed)-Astragalus 82022 Hip Fracture (Closed)-Neck of Femur
82522 Foot Fracture (Closed)-Navicular (Scaphoid) 82080 Hip Fracture (Closed)-Neck of Femur
82523 Foot Fracture (Closed)-Cuboid
82524 Foot Fracture (Closed)-Cuneiform
82525 Foot Fracture (Closed)-Metatarsal Bone(s)
82529 Foot Fracture (Closed)-Other (Tarsal with Metatarsal)
Stress and Pathological Fractures Lower Limb, Excluding Foot and Ankle
73310 Unspecified Pathological Fracture 82100 Lower Limb Fracture (Closed Only)-Thigh/Upper Leg
73311 Pathological Fracture-Humerus 82101 Lower Limb Fracture (Closed Only)-Thigh/Upper Leg
73312 Pathological Fracture-Wrist 82120 Lower Limb Fracture (Closed)-Lower End Femur Unspecified
73313 Pathological Fracture-Vertebrae 82121 Lower Limb Fracture (Closed)-Lower End Femur Condoyle
73314 Pathological Fracture-Femur Neck 82122 Lower Limb Fracture (Closed)-Lower End Femur Eepiphysis
73315 Pathological Fracture-Other Femur 82123 Lower Limb Fracture (Closed)-Lower End Femur Supracondylar
73316 Pathological Fracture-Tibia/Fibula 82129 Lower Limb Fracture (Closed)-Lower End Femur Multiple Fractures
73319 Other Specified Pathological Fracture 82200 Lower Limb Fracture (Closed Only)-Patella
73393 Stress Fracture of Tibia or Fibula 82300 Lower Limb Fracture (Closed Only)-Tibia and Fibula
73394 Stress Fracture of the Metatarsals 82301 Lower Limb Fracture (Closed Only)-Tibia and Fibula
73395 Stress Fracture of Other Bone 82302 Lower Limb Fracture (Closed Only)-Tibia and Fibula
82320 Lower Limb Fracture (Closed Only)-Tibia and Fibula Sha�
Exclude all cases with E-code of: 82321 Lower Limb Fracture (Closed Only)-Tibia and Fibula Sha�
E800-E807 Railway 82322 Lower Limb Fracture (Closed Only)-Tibia and Fibula Sha�
E810-E819 Motor Vehicle Traffic 82380 Lower Limb Fracture (Closed Only)-Tibia and Fibula Unspecified
E820-E825 Motor Vehicle Nontraffic 82381 Lower Limb Fracture (Closed Only)-Tibia and Fibula Unspecified
E826-E829 Other Road Vehicles 82382 Lower Limb Fracture (Closed Only)-Tibia and Fibula Unspecified
E830-E838 Water
E840-E845 Air and Space
E846-E848 Other Vehicle Accidents Not Elsewhere Clssified Table 5.1 continued next page.
E990-E999 Operations of War

The Burden of Musculoskeletal Diseases in the United States - Copyright © 2008 111
Osteoporosis and Bone Health Chapter 5
Table 5.1: Osteoporosis and Bone Health: Analysis Codes (continued)
CODE ICD-9-CM CODE DESCRIPTION CODE ICD-9-CM CODE DESCRIPTION
SECONDARY OSTEOPOROSIS
Diagnosis That May Lead to Osteoporosis
24290 Thyrotox NOS-No Crisis 25720 Testicular Hypofunction NEC
24291 Thyrotox NOS-with Crisis 25930 Ectopic Hormone Secondary NEC
25200 Hyperparathyroidism NOS 25990 Endocrine Disorder NOS
25201 Primary Hyperparathyroid 26820 Osteomalacia NOS
25202 Secondary Hyperparathyroid-Nonrenal 26890 Vitamin D Deficiency NOS
25208 Hyperparathyroidism NEC 58800 Renal Osteodystrophy
25500 Cushing's Syndrome 58881 Secondary Hyperparathyroid-Renal
25530 Corticoadren Overact NEC 62720 Female Climacteric State
25620 Postablativ Ovarian Failure 62740 Artificial Menopause States
25631 Premature Menopause 62780 Menopausal Disorder NEC
25639 Other Ovarian Failure 62790 Menopausal Disorder NOS
25710 Postblat Testic Hypofun
Vertebral Fractures with Spinal Cord Injury
80600 C1-C4 Fracture-Closed/Cord Injury NOS 80626 T7-T12 Fracture-Closed/Complete Lesion of Cord
80601 C1-C4 Fracture-Closed/Complete Lesion of Cord 80627 T7-T12 Fracture-Closed/Anterior Cord Syndrome
80602 C1-C4 Fracture-Closed/Anterior Cord Syndrome 80628 T7-T12 Fracture-Closed/Central Cord Syndrome
80603 C1-C4 Fracture-Closed/Central Cord Syndrome 80629 T7-T12 Fracture-Closed/Cord Injury NEC
80604 C1-C4 Fracture-Closed/Cord Injury NEC 80630 T1-T6 Fracture-Open/Cord Injury NOS
80605 C5-C7 Fracture-Closed/Cord Injury NOS 80631 T1-T6 Fracture-Open/Complete Lesion of Cord
80606 C5-C7 Fracture-Closed/Complete Lesion of Cord 80632 T1-T6 Fracture-Open/Anterior Cord Syndrome
80607 C5-C7 Fracture-Closed/Anterior Cord Syndrome 80633 T1-T6 Fracture-Open/Central Cord Syndrome
80608 C5-C7 Fracture-Closed/Central Cord Syndrome 80634 T1-T6 Fracture-Open/Cord Injury NEC
80609 C5-C7 Fracture-Closed/Cord Injury NEC 80635 T7-T12 Fracture-Open/Cord Injury NOS
80610 C1-C4 Fracture-Open/Cord Injury NOS 80636 T7-T12 Fracture-Open/Complete Lesion of Cord
80611 C1-C4 Fracture-Open/Complete Lesion of Cord 80637 T7-T12 Fracture-Open/Anterior Cord Syndrome
80612 C1-C4 Fracture-Open/Anterior Cord Syndrome 80638 T7-T12 Fracture-Open/Central Cord Syndrome
80613 C1-C4 Fracture-Open/Central Cord Syndrome 80639 T7-T12 Fracture-Open/Cord Injury NEC
80614 C1-C4 Fracture-Open/Cord Injury NEC 80640 Closed Lumbar Fracture with Cord Injury
80615 C5-C7 Fracture-Open/Cord Injury NOS 80650 Open Lumbar Fracture with Cord Injury
80616 C5-C7 Fracture-Open/Complete Lesion of Cord 80660 Fracture Sacrum-Closed/Cord Injury NOS
80617 C5-C7 Fracture-Open/Anterior Cord Syndrome 80661 Fracture Sacrum-Closed/Cauda Equina Lesion
80618 C5-C7 Fracture-Open/Central Cord Syndrome 80662 Fracture Sacrum-Closed/Cauda Injury NEC
80619 C5-C7 Fracture-Open/Cord Injury NEC 80669 Fracture Sacrum-Closed/Cord Injury NEC
80620 T1-T6 Fracture-Closed/Cord Injury NOS 80670 Fracture Sacrum-Closed/Cord Injury NOS
80621 T1-T6 Fracture-Closed/Complete Lesion of Cord 80671 Fracture Sacrum-Closed/Cauda Equina Lesion
80622 T1-T6 Fracture-Closed/Anterior Cord Syndrome 80672 Fracture Sacrum-Closed/Cauda Injury NEC
80623 T1-T6 Fracture-Closed/Central Cord Syndrome 80679 Fracture Sacrum-Open/Cord Injury NEC
80624 T1-T6 Fracture-Closed/Cord Injury NEC 80680 Vertebrae Fracture NOS-Closed with Cord Injury
80625 T7-T12 Fracture-Closed/Cord Injury NOS 80690 Vertebrae Fracture NOS-Open with Cord Injury

The Burden of Musculoskeletal Diseases in the United States - Copyright © 2008
Chapter 5 Osteoporosis and Bone Health
112
Table 5.2: Self-Reported Rate of Osteoporosis and Hip Fracture for Persons Aged 65 andOver, United States 1988-1994 and 1999-2004
Prevalence (Rate per 100 Persons)
Osteoporosis [1] Hip Fracture [2] Either Condition
1988-1994 [3] 1999-2004 [4] 1988-1994 [3] 1999-2004 [4] 1988-1994 [3] 1999-2004 [4]
Females65 to 74 Years 10.9 21.1 4.5 1.1 14.2 21.8
75 to 84 Years 12.1 32.2 7.3 3.5 17.7 34.0
85 Years & Over 9.7 28.6 11.8 13.4 19.1 32.7
All Females 65 Years & Over 11.1 26.0 6.1 3.3 15.8 27.5
Males65 to 74 Years 1.3 2.5 2.1 3.0 3.3 5.5
75 to 84 Years 1.3 5.6 2.4 3.4 3.0 8.8
85 Years & Over 1.6 4.9 4.1 6.1 5.4 9.4
All Males 65 Years & Over 1.3 3.7 2.3 3.4 3.5 6.9
Total 65 to 74 Years 6.7 12.6 3.4 2.0 10.0 14.3
75 to 84 Years 8.0 21.8 5.4 3.5 13.4 24.1
85 Years & Over 7.0 19.8 9.4 10.7 16.4 24.1
All Persons 65 Years & Over 7.0 16.5 4.5 3.3 10.7 18.7
[1] Has a doctor ever told you that you had osteoporosis, sometimes called thin or bri�le bones?
[2] Has a doctor ever told you that you had broken or fractured your hip?
[3] Source: Praemer A, Furner S, Rice DP. Musculoskeletal Conditions in the United States. Rosemont, IL. 1999, American Academy of OrthopaedicSurgeons.
[4] Source: National Center for Health Statistics. National Health and Nutrition Examination Survey Data, 1999-2004

The Burden of Musculoskeletal Diseases in the United States - Copyright © 2008 113
Osteoporosis and Bone Health Chapter 5
Table 5.3: Self-Reported Prevalence of Osteoporosis, Osteoporosis Treatment or RelatedFracture [1] for Persons Aged 45 and Over, United State 1999-2004
Prevalence (in 000s) Occurrence by SexDistribution
by AgePrevalence Rate
(% of population in age group)
Age Group Females MalesTotal
Population Females Males Females Males Females MalesTotal
Population
Ever been told had osteoporosis?45-64 2,822 487 3,309 85.3% 14.7% 35.7% 47.7% 8.4% 1.6% 5.1%65-74 2,145 214 2,359 90.9% 9.1% 27.2% 20.9% 21.2% 2.5% 12.6%75-84 2,353 262 2,615 90.0% 10.0% 29.8% 25.6% 32.2% 5.6% 21.8%85 & Over 578 59 637 90.7% 9.3% 7.3% 5.8% 28.6% 4.9% 19.8%Total Aged 45 & Over 7,898 1,022 8,919 88.6% 11.5% 100.0% 100.0% 14.8% 2.2% 9.0%
eEver been treated for osteoporosis? (if responded "Yes” to osteoporosis)45-64 1,847 254 2,101 87.9% 12.1% 32.1% 39.5% 65.5% 52.2% 63.5%65-74 1,603 155 1,759 91.1% 8.8% 27.8% 24.1% 74.8% 772.6% 74.6%75-84 1,839 203 2,042 90.1% 9.9% 31.9% 31.6% 78.2% 77.5% 78.1%85 & Over 467 31 497 94.0% 6.2% 8.1% 4.8% 80.7% 52.4% 78.1%Total Aged 45 & Over 5,756 643 6,399 90.0% 10.0% 100.0% 100.0% 72.9% 63.0% 71.7%
Ever been told had broken or fractured your hip?45-64 197 321 519 38.0% 61.8% 23.3% 39.4% 0.6% 1.0% 0.8%65-74 116 267 372 31.2% 71.8% 13.7% 32.8% 1.1% 3.0% 2.0%75-84 259 162 421 61.5% 38.5% 30.7% 19.9% 3.5% 3.4% 3.5%85 & Over 272 73 346 78.6% 21.1% 32.2% 9.0% 13.4% 6.1% 10.7%Total Aged 45 & Over 844 814 1,658 50.9% 49.1% 100.0% 101.1% 1.6% 1.8% 1.7%
Ever been told had broken or fractured your spine?45-64 531 1,083 1,614 32.9% 67.1% 46.9% 70.3% 1.6% 3.5% 2.5%65-74 174 245 418 41.6% 58.6% 15.4% 15.9% 1.7% 2.8% 2.2%75-84 229 172 401 57.1% 42.9% 20.2% 11.2% 3.1% 3.6% 3.3%85 & Over 198 42 240 82.5% 17.5% 17.5% 2.7% 9.8% 3.5% 7.4%Total Aged 45 & Over 1,132 1,541 2,673 42.3% 57.7% 100.0% 100.1% 2.1% 3.4% 2.7%
Ever been told had broken or fractured your wrist?45-64 2,333 3,707 6,340 36.8% 58.5% 51.3% 71.4% 6.9% 11.9% 9.3%65-74 1,080 983 2,063 52.4% 47.6% 23.7% 18.9% 10.6% 11.4% 11.0%75-84 792 407 1,198 66.1% 34.0% 17.4% 7.8% 10.8% 8.6% 10.0%85 & Over 345 93 438 78.8% 21.2% 7.6% 1.8% 17.0% 7.8% 13.6%Total Aged 45 & Over 4,549 5,190 9,739 46.7% 53.3% 100.0% 100.0% 8.5% 11.4% 9.9%
Ever been told had osteoporosis, been treated for osteoporosis, or had broken or fractured hip, spine or wrist?45-64 5,388 5,108 10,496 51.3% 48.7% 43.2% 66.0% 16.0% 16.5% 16.2%65-74 3,060 1,531 4,591 66.7% 33.3% 24.5% 19.8% 30.1% 17.8% 24.5%75-84 3,074 870 3,944 77.9% 22.1% 24.6% 11.2% 42.1% 18.4% 32.8%85 & Over 962 234 1,197 80.4% 19.5% 7.7% 3.0% 47.5% 19.6% 37.1%Total Aged 45 & Over 12,484 7,743 20,228 61.7% 38.3% 100.0% 100.0% 23.4% 17.0% 20.5%
[1] Replied "Yes" when asked if ever been told by a doctor that you had osteoporosis, been treated for osteoporosis, or had broken or fractured your(hip)(spine)(wrist).Source: National Center for Health Statistics. National Health and Nutrition Examination Survey Data, 1999-2004

The Burden of Musculoskeletal Diseases in the United States - Copyright © 2008
Chapter 5 Osteoporosis and Bone Health
114
Table 5.4: Health Care Visits for Osteoporosis and Related Conditions [1] for PersonsAged 45 and Older by Site, United States 2004
Visits (in 000s)
InpatientHospitalization
[4]Physician
Visits [5]
EmergencyRoom
Encounters [6]Outpatient
Visits [7]
Total All Health Care
Resources
Primary Osteoporosis or Low Bone Density 899.2 5,013.2 * 294.9 6,248.5
% of Total Visits 14.4% 80.2% 0.7% 4.7%
Low Energy Fracture [2]
Hip 313.5 * 211.9 * 929.5
Wrist/Hand 54.4 * 342.5 82.9 1,318.7
Vertebrae/Pelvic 150.2 * 139.3 * 652.2
Upper Limb (Arm/Shoulder) 78.2 * 206.8 * 683.2
Lower Limb (Leg) 77.1 * 125.8 * 931.0
Foot/Ankle 78.7 926.5 230.2 69.3 1,304.7
All Low Energy Fractures 704.3 3,546.5 1,231.5 258.6 5,740.9
% of Total Visits 12.3% 61.8% 21.5% 4.5%
% of Low Energy Fracture Patients withOsteoporosis Diagonsis 16.4% 1.6% 1.1% 2.1%
Secondary Osteoporosis Diagnosis [3]
Contributing Condition 143.7 5,679.7 * 224.1 6,053.8
Vertebral Fracture w/Spinal Cord Injury 0.0 * * 0.0 1,430.6
* Estimate does not meet standards for reliability.
[1] Osteoporosis and related condition ICD-9-CM codes shown in the Table 5.1.
[2] Treatment for fractures, excluding those with high energy causes (i.e., vehicular [auto, air, water] accidents, war injuries)
[3] Diagnosis of another medical condition that may lead to or contribute to the development of osteoporosis
[4] Source: Agency for Healthcare Research and Quality, Healthcare Cost and Utilization Project, Nationwide Inpatient Sample, 2004
[5] Source: National Center for Health Statistics, National Ambulatory Medical Care Survey, 2004
[6] Source: National Center for Health Statistics, National Hospital Ambulatory Medical Care Survey, Hospital Emergency, 2004
[7] Source: National Center for Health Statistics, National Hospital Ambulatory Medical Care Survey, Outpatient Centers, 2004

The Burden of Musculoskeletal Diseases in the United States - Copyright © 2008 115
Osteoporosis and Bone Health Chapter 5
Table 5.5: Inpatient Resource Utilization for Osteoporosis and Related Conditions [1] forPersons Age 45 and Older by Age and Sex, United States 2004
Distribution byGenderFEMALES % by Age Group Total
Aged 45 &
Older(in 000s)
Mean Age
(in years)
TotalInpatient
Hospitali-zations(in 000s) 45-64 65-74
75 &Older Females Males
Primary Osteoporosis 12.6% 21.1% 66.3% 809.7 77.6 90.1% 9.9% 899.2
Low Energy Fracture [2]
Hip 6.7% 14.1% 79.2% 227.6 81.2 72.6% 27.4% 313.5
Wrist/Hand 22.1% 19.1% 58.8% 40.6 74.8 74.6% 25.4% 54.4
Vertebrae/Pelvic 10.4% 14.5% 75.1% 101.6 79.4 67.6% 32.4% 150.2
Upper Limb (Arm/Shoulder) 16.6% 20.9% 62.5% 56.8 76.6 72.7% 27.3% 78.2
Lower Limb (Leg) 29.5% 21.9% 48.6% 54.7 72.5 70.9% 29.1% 77.1
Foot/Ankle 44.4% 20.2% 35.4% 52.8 67.6 67.0% 33.0% 78.7
All Low Energy Fractures 15.6% 16.7% 67.7% 499.2 77.7 77.3% 22.7% 704.3Low Energy Fracture with Osteoporosis Diagnosis 105.0 105.0 10.5 115.5
% Low Energy Fracture Patients withOsteoporosis Diagnosis 8.8% 19.4% 24.0% 21.0% 21.0% 5.1% 16.4%
Secondary Osteoporosis Diagnosis [3]
Contributing Condition 43.2% 21.4% 35.5% 104.7 67.8 72.9% 27.1% 143.7
Vertebral Fracture w/Spinal Cord Injury 0.0% 0.0% 0.0% 0.0 na 0.0% 0.0% 0.0
MALESPrimary Osteoporosis 18.8% 22.1% 59.1% 89.5 75.3
Low Energy Fracture [2]
Hip 15.7% 17.8% 66.5% 85.9 77.2 Wrist/Hand 55.7% 15.0% 29.2% 13.8 64.5 Vertebrae/Pelvic 33.6% 18.1% 48.2% 48.7 70.9 Upper Limb (Arm/Shoulder) 41.4% 20.0% 38.6% 21.4 68.5 Lower Limb (Leg) 54.2% 20.5% 25.3% 22.4 64.4 Foot/Ankle 59.4% 22.1% 18.5% 25.9 61.8 All Low Energy Fractures 32.8% 18.7% 48.5% 204.3 71.4
Low Energy Fracture with Osteoporosis Diagnosis 10.5
% Low Energy Fracture Patients withOsteoporosis Diagnosis 2.7% 3.2% 7.6% 5.1%
Secondary Osteoporosis Diagnosis [3]
Contributing Condition 45.8% 26.1% 28.0% 39.0 66.2 Vertebral Fracture w/Spinal Cord Injury 0.0% 0.0% 0.0% 0.0 na
[1] Osteoporosis and related condition ICD-9-CM codes shown in the Table 5.1.
[2] Treatment for fractures, excluding those with high energy causes (i.e., vehicular [auto, air, water] accidents, war injuries).
[3] Diagnosis of another medical condition that may lead to or contribute to the development of osteoporosis.
Source: Agency for Healthcare Research and Quality, Healthcare Cost and Utilization Project, Nationwide Inpatient Sample, 2004

The Burden of Musculoskeletal Diseases in the United States - Copyright © 2008
Chapter 5 Osteoporosis and Bone Health
116
Table 5.6: Hospital Emergency Room Resource Utilization for Low Energy Fractures [1]
for Persons Aged 45 and Older by Age and Sex, United States 2004
% by Age Group Total 45 &
Older (in 000s)
Mean Age(in years)
Distribution byGender
Total Emergency
Room Treatments
(in 000s) FEMALES 45-64 65- 7475 &
Older Females MalesLow Energy Fracture [2]
Hip 4.9% 10.0% 85.1% 172.3 83.0 81.3% 18.7% 211.9
Wrist/Hand 49.5% 24.8% 25.7% 255.7 65.6 74.7% 25.3% 342.5
Vertebrae/Pelvic 10.5% 21.4% 68.1% 95.3 78.0 68.4% 31.6% 139.3
Upper Limb (Arm/ Shoulder) 31.0% 29.6% 39.3% 154.0 71.0 74.5% 25.5% 206.8
Lower Limb (Leg) 49.4% 14.1% 36.5% 94.1 67.1 74.8% 25.2% 125.8
Foot/Ankle 79.3% 11.1% 9.6% 161.9 57.4 70.3% 29.7% 230.2
All Low Energy Fractures 40.0% 19.2% 40.9% 920.4 69.5 74.7% 25.3% 1,231.5
MALESLow Energy Fracture [2]
Hip 15.2% 7.8% 77.0% 39.6 77.0 Wrist/Hand 44.8% 20.0% 35.2% 86.7 68.4 Vertebrae/Pelvic 39.0% 49.7% 11.4% 44.0 64.0 Upper Limb (Arm/ Shoulder) 16.9% 33.9% 49.2% 52.8 73.3 Lower Limb (Leg) 80.1% 5.0% 14.9% 31.7 57.9 Foot/Ankle 81.8% 11.5% 6.6% 68.3 54.9
All Low Energy Fractures 48.1% 22.4% 29.5% 311.1 65.3
* Estimate does not meet standards for reliability.
[1] Osteoporosis and related condition ICD-9-CM codes shown in the Table 5.1.
[2] Treatment for fractures, excluding those with high energy causes (i.e., vehicular [auto, air, water] accidents, war injuries).
Source: National Center for Health Statistics, National Hospital Ambulatory Medical Care Survey, Hospital Emergency Room, 2004

The Burden of Musculoskeletal Diseases in the United States - Copyright © 2008 117
Osteoporosis and Bone Health Chapter 5
Table 5.7: Hospital Discharge to Short/Intermediate/Skilled Nursing Care for Personswith Osteoporosis and Related Conditions [1] Aged 45 and Older by Age and Sex, United States 2004
% of Total WITH Condition % of Total WITHOUT Condition
FEMALES 45-64 65-7475 &
OlderAll 45 &
Over 45-64 65-7475 &
OlderAll 45 &
Over
Primary Osteoporosis 18.6% 26.6% 46.3% 38.7% 10.8% 21.8% 37.9% 24.0%
Low Energy Fracture [2]
Hip 51.4% 77.8% 86.1% 82.6% 10.8% 21.4% 37.0% 23.9%
Wrist/Hand 16.4% 31.8% 60.1% 45.0% 10.9% 22.1% 38.7% 24.9%
Vertebrae/Pelvic 29.3% 57.6% 68.0% 62.4% 10.9% 21.9% 38.4% 24.6%
Upper Limb (Arm/Shoulder) 20.6% 42.9% 67.2% 54.4% 10.9% 22.0% 38.6% 24.8%
Lower Limb (Leg) 35.2% 66.0% 79.6% 63.5% 10.8% 21.9% 38.6% 24.8%
Foot/Ankle 20.3% 48.3% 68.0% 42.8% 10.9% 22.0% 38.7% 24.9%
All Low Energy Fractures 28.0% 60.0% 77.0% 66.5% 10.6% 20.8% 36.0% 23.1%
MALESPrimary Osteoporosis 24.5% 28.7% 43.6% 36.7% 12.5% 19.0% 30.8% 20.0%
Low Energy Fracture [2]
Hip 51.2% 68.5% 84.0% 76.1% 12.4% 18.7% 30.0% 19.7%
Wrist/Hand 14.0% 37.4% 52.5% 28.8% 12.6% 19.0% 31.0% 20.2%
Vertebrae/Pelvic 24.1% 37.5% 62.3% 45.0% 12.5% 19.0% 30.8% 20.0%
Upper Limb (Arm/Shoulder) 19.8% 39.5% 60.0% 39.3% 12.6% 19.0% 30.9% 20.1%
Lower Limb (Leg) 25.1% 63.9% 72.3% 45.1% 12.5% 19.0% 30.9% 20.1%
Foot/Ankle 15.3% 32.1% 58.2% 26.9% 12.6% 19.0% 31.0% 20.2%
All Low Energy Fractures 24.8% 50.8% 74.1% 53.6% 12.3% 18.5% 29.6% 19.4%
[1] Osteoporosis and related condition ICD-9-CM codes shown in the Table 5.1.
[2] Treatment for fractures, excluding those with high energy causes (i.e., vehicular [auto, air, water] accidents, war injuries).
Source: Agency for Healthcare Research and Quality, Healthcare Cost and Utilization Project, Nationwide Inpatient Sample, 2004

The Burden of Musculoskeletal Diseases in the United States - Copyright © 2008
Chapter 5 Osteoporosis and Bone Health
118
Table 5.8: Osteoporosis and Related Conditions [1] in Nursing Home Population Aged 65and Over, United States 2004
Prevalence (in 00s)
65-74 75-84 85 & Over Male Female
TotalPopulation
Diagnosis at Time of Admi�ance (based on age at time of admission)Primary Osteoporosis * 21.6 49.9 * 71.0 76.4 Low Energy Fracture (All) 90.8 387.8 650.5 207.5 973.1 1,180.6
Hip 35.0 171.6 302.6 103.4 411.7 515.1 Vertebrae/Pelvic * 49.3 106.3 * 148.5 173.1 Upper Limb (Arm, Shoulder) * 35.1 32.9 * 66.3 77.8 Lower Limb (Leg) 25.2 98.9 135.1 47.0 235.9 282.9 Ankle/Foot * * * * 42.9 51.7
Secondary Osteoporosis Condition Present * * * Current Primary Diagnosis (based on age at time of interview)
Primary Osteoporosis * 33.8 104.4 * 149.8 152.5 Low Energy Fracture (All) 22.3 113.2 234.6 104.6 297.0 401.6
Hip * 47.4 102.5 36.8 122.8 159.5 Vertebrae/Pelvic * * 46.7 * 52.9 73.6 Upper Limb (Arm, Shoulder) * * * * * * Lower Limb (Leg) * 29.6 47.3 * 73.0 98.8 Ankle/Foot * * * * * *
Secondary Osteoporosis Condition Present * * * * * 29.0 Current Secondary Diagnosis (based on age at time of interview)
Primary Osteoporosis 155.9 666.7 1,272.0 170.6 2,018.3 2,188.8 Secondary Osteoporosis Condition Present 42.5 164.4 297.8 68.3 479.8 548.1
Falls and Fractures (based on age at time of interview)Reported Fall Within Past 6 Months * 1,849.0 2,560.0 1,498.0 3,719.0 5,217.0 Sustained Hip Fracture Within Past 180 Days * 95.0 141.0 69.0 206.0 276.0 Sustained Other Fracture Within Past 180 Days * 107.0 159.0 78.0 260.0 339.0
Total Nursing Home Population Aged 65 & Older, 2004 1,741.2 4,688.7 6,742.1 3,368.2 9,803.9 13,172.1
* Estimate does not meet standards for reliability.
[1] Osteoporosis and related condition ICD-9-CM codes shown in the Table 5.1.
Source: National Center for Health Statistics, National Nursing Home Survey, 2004

The Burden of Musculoskeletal Diseases in the United States - Copyright © 2008 119
Osteoporosis and Bone Health Chapter 5
Table 5.9: Self-Reported Fracture (Ever) for Persons Aged 45 andOver by Age and Sex, United States 1999-2004
FEMALESRate per 100 Persons
45-64 65-74 75-84 85 & Older 45 & OverBroken or Fractured Hip 0.6 1.1 3.5 13.4 1.6Broken or Fractured Wrist 6.9 10.6 10.8 17.0 8.5Broken or Fractured Spine 1.6 1.7 3.1 9.8 2.1
% of First Fractures Caused by a Fall [1]
Broken or Fractured Hip 74% 66% 96% 93% 90%Broken or Fractured Wrist 91% 93% 93% 100% 94%Broken or Fractured Spine 44% 72% 57% 75% 69%
Mean Age of First Fracture Caused by a Fall (in years)
Broken or Fractured Hip 56.0 68.5 73.1 80.2 74.8 Broken or Fractured Wrist 53.2 60.0 69.2 73.3 62.9 Broken or Fractured Spine 60.9 61.2 68.9 78.8 70.6
MALESRate per 100 Persons
45-64 65-74 75-84 85 & Older 45 & OverBroken or Fractured Hip 1.0 3.0 3.4 6.1 1.8Broken or Fractured Wrist 11.9 11.4 8.6 7.8 11.4Broken or Fractured Spine 3.5 2.8 3.6 3.5 3.4
% of First Fractures Caused by a Fall [1]
Broken or Fractured Hip 50% 53% 70% 80% 69%Broken or Fractured Wrist 82% 82% 93% 91% 86%Broken or Fractured Spine 47% 58% 50% 57% 64%
Mean Age of First Fracture Caused by a Fall (in years)
Broken or Fractured Hip 55.0 62.8 70.4 80.0 69.2 Broken or Fractured Wrist 54.7 60.4 62.8 75.0 60.2 Broken or Fractured Spine 56.5 57.4 68.0 75.1 60.9
[1] Self-reported cause as a "fall/tripped/slipped/fell out of bed" or "hard fall off ladder/stool /downstairs."
Source: National Center for Health Statistics. National Health and Nutrition Examination Survey Data, 1999-2004.

The Burden of Musculoskeletal Diseases in the United States - Copyright © 2008
Chapter 5 Osteoporosis and Bone Health
120
Table 5.10: Low Energy Fractures [1] Treated as Inpatient or EmergencyRoom Visits for Persons Aged 45 and Over by Anatomic Site by Sex,United States 2004
Inpatient Treatment [2]
Females Males
Prevalence(in 000s) [4]
% of TotalFracture
SitesPrevalence
(in 000s) [4]
% of TotalFracture
SitesHip 227.6 42.6% 85.9 39.4%Vertebrae/Pelvic 101.6 19.0% 48.7 22.3%Upper Limb (Arm/Shoulder) 56.8 10.6% 21.4 9.8%Lower Limb (Leg) 54.7 10.2% 22.4 10.3%Foot/Ankle 52.8 9.9% 25.9 11.9%Wrist/Hand 40.6 7.6% 13.8 6.3%All Low Energy Fractures 499.2 100.0% 204.3 100.0%
Emergency Room Treatment [3]
Females Males
Prevalence(in 000s) [4]
% of TotalFracture
SitesPrevalence
(in 000s) [4]
% of TotalFracture
SitesHip 172.3 18.5% 39.6 12.3%Vertebrae/Pelvic 95.3 10.2% 44.0 13.6%Upper Limb (Arm/Shoulder) 154.0 16.5% 52.8 16.3%Lower Limb (Leg) 94.1 10.1% 31.7 9.8%Foot/Ankle 161.9 17.3% 68.3 21.1%Wrist/Hand 255.7 27.4% 86.7 26.8%All Low Energy Fractures 920.4 100.0% 311.1 100.0%
[1] Treatment for fractures, excluding those with high energy causes (i.e., vehicular [auto, air, water] accidents, war injuries)
[2] Source: Agency for Healthcare Research and Quality, Healthcare Cost and Utilization Project, Nationwide Inpatient Sample,2004
[3] Source: National Center for Health Statistics, National Hospital Ambulatory Medical Care Survey, Hospital Emergency Room,2004
[4] Multiple fractures sites per patient possible.
Source: National Center for Health Statistics. National Hospital Discharge Survey, 2004.

The Burden of Musculoskeletal Diseases in the United States - Copyright © 2008 121
Osteoporosis and Bone Health Chapter 5
Table 5.11: Inpatient Cost Associated with Osteoporosis [1] and Low EnergyFractures [2] for Persons Aged 45 and Older, United States 2004
Prevalence (in 000s)
Mean Length of Stay(in days)
Mean Cost per
Patient Stay
Estimated Total Cost (in billions)
Osteoporosis Diagnosis PatientsOsteoporosis Without Fracture 783.7 5.3 $ 20,704 $ 16.23 Osteoporosis With Fracture 115.5 5.7 $ 24,634 $ 2.85 All Osteoporosis Diagnosis 899.2 5.3 $ 21,209 $ 19.07
Non-Osteoporosis Patients 20,758.9 5.4 $ 26,264 $ 545.21
Low Energy Fracture PatientsHip 313.5 6.7 $ 32,310 $ 10.13 Vertebrae/Pelvic 150.2 6.6 $ 27,610 $ 4.15 Upper Limb (Arm/Shoulder) 78.2 5.2 $ 24,347 $ 1.90 Lower Limb (Leg) 77.1 6.2 $ 29,190 $ 2.25 Foot/Ankle 78.7 4.5 $ 21,618 $ 1.70 Wrist/Hand 54.4 4.9 $ 23,893 $ 1.30 All Low Energy Fractures 704.3 6.1 $ 27,919 $ 19.66
Non-Fracture Patients 20,723.3 5.4 $ 25,883 $ 536.38
[1] Osteoporosis and related condition ICD-9-CM codes shown in the Table 5.1.
[2] Treatment for fractures, excluding those with high energy causes (i.e., vehicular [auto, air, water] accidents, war injuries).
Source: Agency for Healthcare Research and Quality, Healthcare Cost and Utilization Project, Nationwide Inpatient Sample, 2004
Source: National Center for Health Statistics. National Hospital Discharge Survey, 2004.

Chapter 6
Musculoskeletal Injuries
The Burden of Musculoskeletal Diseases in the United States - Copyright © 2008 123
More than three of every five unintentionalinjuries that occur annually in the United Statesare to the musculoskeletal system. Although theincidence of total unintentional injuries is difficultto estimate, numerous databases and reports haveshown that a consistent 60% to 67% of injuriesthat occur annually involve the musculoskeletalsystem. (Table 6.1 and Graph 6.0.1)
Musculoskeletal injuries are injuries occurring tothe neck, spine, pelvis and extremities; theyinclude fractures, derangements, dislocations,sprains and strains, contusions, crushing injuries,open wounds, and traumatic amputations. Themost common cause of musculoskeletal injuries isfalls. Additional major causes of musculoskeletalinjuries are sports injuries, playground accidents,motor vehicle crashes, civilian interpersonalviolence, war injuries, stress injuries, over-exertion, and repetitive workplace injuries.
In 2004, more than 57.2 million episodes oftreatment for musculoskeletal injuries wererecorded in physician offices, emergency rooms,outpatient clinics, and hospitalizations. Thiscompares to 95.3 million episodes of treatment forall kinds of injuries, including burns, poisoning,and drowning.
Section 6.1: Prevalence ofMusculoskeletal Injuries
While the number of self-reported injury episodeshas been declining since 1997 and is believed tobe under-reported,1 the distribution of types ofmusculoskeletal injuries is similar for both self-reported and injury treatment episodes. In 2005,persons in the civilian non-institutionalizedpopulation self-reported 20.2 millionmusculoskeletal injury episodes in the annualNational Health Interview Survey. This comparesto an annual average of 36.9 million musculo-skeletal injury episodes reported in the samesurvey 1992-1994,2 and to 57.2 millionmusculoskeletal injury treatment episodes inphysician offices, emergency rooms, outpatientclinics, and hospitalizations reported in 2004.(Table 6.2) Injury treatment episodes in 2004reflect actual injury burden more reliably thanself-reported injury episodes and will define themusculoskeletal injury burden in this chapter.
Section 6.1.1: Musculoskeletal Injuries by Type
Among self-reported musculoskeletal injuries,sprains and strains were the most frequent,accounting for 38%. Fractures, representing 22%of self-reported musculoskeletal injuries, were thesecond most frequent. Among musculoskeletal
Graph 6.0.1: Musculoskeletal Injuries as Proportion ofTotal Injuries, United States 1992-1994, 2000, 2004, and 2005
[1] Praemer A, Furner S, Rice DP: Musculoskeletal Conditions in the UnitedStates, ed 2. Rosemont, IL:American Academy of Orthopaedic Surgeons, 1999,p 83.[2] Finkelstein EA, Corso PS, Miller TR: The Incidence and Economic Burden ofInjuries in the United States. New York, NY: Oxford University Press, 2006, p 13.[3] National Center for Health Statistics, National Ambulatory Medical CareSurvey, 2004; National Hospital Ambulatory Medical Care Survey, EmergencyRoom Visits, 2004; National Hospital Ambulatory Medical Visits, OutpatientDepartment Visits, 2004.[4] National Center for Health Statistics, National Health Interview Survey,2005.

injury treatment episodes, these two types ofinjuries were nearly equal, accounting for 26%and 25% of the total injury treatment episodes,respectively. Open wounds and contusionsaccounted for 17% and 14%, respectively, both inself-reported and injury treatment episodes,while dislocations accounted for 8% of injurytreatment episodes and only 2% of self-reportedinjury episodes. (Table 6.3 and Graph 6.1.1)
Nearly 15.3 million fractures were treated inphysician offices, emergency and outpatientclinics, and hospitals in 2004. (Table 6.4) Morethan 2.9 million of these occurred in young malesunder the age of 18, while another 2.7 millionoccurred in females aged 65 and over.
Sprains and strains accounted for nearly 16.3million musculoskeletal injury treatment episodesin 2004, with 6.8 million treated in persons aged18 to 44, the most common age in which a sprainor strain is reported and treated.
Open wounds are the third most frequentlytreated musculoskeletal injury, accounting formore than 10.3 million injury treatment episodesin 2004. Open wounds were treated with similarfrequency in all age groups, but were morecommonly treated in males (6.0 million treatmentepisodes) than females (4.3 million treatmentepisodes).
Approximately 8.4 million contusions weretreated in 2004, with 2.8 million occurring inpersons between the ages of 18 and 44; personsaged 65 and over experienced contusions morefrequently than other age groups.
Section 6.1.2: Rate of Musculoskeletal Injuries byAge and Sex
The 2004 annual rate of all injury and ofmusculoskeletal injury treatment episodes wassimilar for males and females. (Table 6.4 andGraph 6.1.2) Overall, in 2004, persons aged 65 and
The Burden of Musculoskeletal Diseases in the United States - Copyright © 2008
Chapter 6 Musculoskeletal Injuries
124
Graph 6.1.1: Distribution of Injury Treatment Episodes and Self-Reported Injuries by Type of Musculoskeletal Injury bySex and Age, United States 2004
[1] Source: National Center for Health Statistics, National Ambulatory Medical Care Survey, 2004
[2] Source: National Center for Health Statistics, National Hospital Ambulatory Medical CareSurvey, Emergency Room Visits, 2004
[3] Source: National Center for Health Statistics, National Hospital Ambulatory Medical Visits,Outpatient Department Visits, 2004
[4] Source: Agency for Healthcare Research and Quality, Healthcare Cost and Utilization Project,Nationwide Inpatient Sample, 2004
[5] National Center for Health Statistics. National Health Interview Survey, 2005

over were more likely to sustain any type ofinjury (46.3 per 100 persons) or a musculoskeletalinjury (26.5 per 100 persons) than were persons ofany other age group.
Musculoskeletal injury rates vary between malesand females by age, with the injury rate highestamong males under the age of 18 (21.2 per 100males), while females aged 65 and over have thehighest musculoskeletal injury rate (40.7 per 100females). Fractures are the most commonmusculoskeletal injury in both young males andolder females, while sprains and strains are morecommon among males and females between theages of 18 and 64.
In 2004, fractures accounted for 25% of the 57.2million musculoskeletal injuries treated inphysician offices, emergency and outpatientclinics, and hospitalizations. The overall fractureinjury treatment rate in 2004 was 5.2 per 100persons. Among males under the age of 18, thefracture injury treatment rate was 8.0 per 100persons, while females of this age were treatedfor fractures at a rate of 3.8 per 100 persons.Among females aged 65 and older, fracture injurytreatment rates were 17.5 per 100, while men inthis age group were treated for fractures at amuch lower (5.4 per 100 persons) rate. (Table 6.4)
In all injury categories, females aged 65 and olderwere treated at higher rates than males of thesame age. Treatment for contusions was 7.8episodes per 100 among older females, and 3.4among older males; 6.1 for sprains and strainsamong females, and 3.1 among males. The onlytype of musculoskeletal injury to show similarrates of treatment between females and malesaged 65 and over in 2004 was open wounds, withrates of 4.0 and 3.9, respectively, per 100 persons.(Table 6.4)
Among the young, aged 18 and under, males hadhigher rates of injury treatment for all types ofinjury than did females, with overallmusculoskeletal treatment rates of 21.2 and 15.8per 100 persons, respectively, among this agegroup. (Table 6.4)
Males between the ages of 18 and 44 were treatedfor musculoskeletal injuries at slightly higherrates than females in this age group, 18.6 versus16.2 per 100 persons, respectively. Fractures andopen wounds accounted for the higher treatmentrates among males in this age group. Between theages of 45 and 64, females begin to show a higherrate of musculoskeletal injury treatment thanmales, with 22.7 per 100 females treated,compared to 18.2 per 100 males. Fractures,dislocations, strains and strains, and contusionsall showed higher treatment rates, while openwounds were still treated at a higher rate amongmales than females in this age group. (Table 6.4)
Section 6.1.3: Fracture Trends
The total number of fractures of the upper andlower extremities treated in physician offices,emergency departments, and hospitals, whilefluctuating year to year, has remained fairlyconstant since 1998. (Table 6.5 and Graph 6.1.3) In1998, 13.65 million treatment episodes forfractures of the upper and lower limbs werereported; in 2004, 12.36 million were treated.
The Burden of Musculoskeletal Diseases in the United States - Copyright © 2008 125
Musculoskeletal Injuries Chapter 6
Graph 6.1.2: Rate of Musculoskeletal Injury TreatmentEpisodes by Sex and Age, United States 2004
Sources: National Center for Health Statistics: National Ambulatory MedicalCare Survey, 2004; National Hospital Ambulatory Medical Care Survey,Emergency Room Visits, 2004; National Hospital Ambulatory Medical Visits,Outpatient Department Visits, 2004. Agency for Healthcare Research and Quality: Healthcare Cost andUtilization Project, Nationwide Inpatient Sample, 2004.

Upper limb fractures account for 53% to 59% ofthe total fractures treated, while lower limbfractures accounted for 42% to 48% across theyears. (Table 6.5a)
Wrist, hand, and finger fractures accounted forabout one-half of upper limb fractures, withforearm fractures accounting for 28% to 41% ofthe remaining upper limb fractures. Fractures tothe upper arm, or humerus, accounted for 8% orless of all reported treatment episodes for upperlimb fractures. Fractures of the ankle, foot or toesaccounted for more than one-half of treated lowerlimb fractures. The majority of fractures, 62% to71%, were treated in a physician’s office. Fewerthan one in ten fractures (8% or less) were treatedwith inpatient hospitalization in any given year.(Table 6.5a)
Section 6.2: Location and Causes ofMusculoskeletal Injuries
The most common location wheremusculoskeletal injury episodes occur is at home.In 2004, nearly one in two of the 21.6 million self-reported injury episodes occurred in or aroundthe home. Musculoskeletal injury episodes that
occurred in automobile or pedestrianrelated incidents—injuries thatoccurred on the streets or highways—accounted for only 9% of the reportedinjury episodes. An additional 9% ofmusculoskeletal injury episodesoccurred while participating in sportactivities, while 8% occurred in schools.The remaining 29% occurred in otherlocations, including shopping centersand restaurants. (Table 6.6 and Graph6.2.1)
Falls were the leading cause of nonfatalunintentional injuries treated inhospital emergency departments in2003 for all age groups. (Table 6.7 and
Graph 6.2.2) Falls occurred at a rate of 27.1 per1,000 personsand accountedfor nearly 8million of thenonfatalunintentionalinjuries treatedin hospitalemergencydepartments inthe UnitedStates in 2003,nearly one inthree (29%) ofall uninten-tional injuriestreated. Falls accounted for 63% of the nonfatalinjuries treated for persons aged 65 and older.3
(Table 6.8)
Falls were also the leading cause of death inuninten-tional injuries for persons aged 75 andover in 2003,3 accounting for nearly 12,000 of the25,600 deaths due to unintentional injury in thisage group. The rate of death from falls for
The Burden of Musculoskeletal Diseases in the United States - Copyright © 2008
Chapter 6 Musculoskeletal Injuries
126
Graph 6.1.3: Total Fracture Treatment Episodes by Selected AnatomicSite, United States 1998-2004
Sources: National Center for Health Statistics, National Hospital Discharge Survey, 1998-2004;National Center for Health Statistics, National Hospital Ambulatory Medical Care Survey,Emergency Room Visits, 1998-2004; National Center for Health Statistics, National HospitalAmbulatory Medical Visits, Physician Visits, 1998-2004
Graph 6.2.1: Location ofMusculoskeletal InjuryEpisode Occurrence, United States 2004
All listed diagnoses for personsreporting a musculoskeletalinjury in the 3-month periodprior to the interview.
Source: National Center forHealth Statistics, NationalHealth Interview Survey, InjuryDatabase, 2004.

persons aged75 to 84 yearswas 46.2 per100,000persons; thatrate jumped to131.8 per100,000 amongpersons aged85 years andolder. (Table6.9) In 1984,54% of fallsresulting indeath
occurred in the home; by 2004, the proportionhad risen to 63%. (Table 6.10)
The most frequently self-reported type of injury isa sprain, strain or twist, accounting for one-third(32%) of all self-reported injury episodes in 2005.(Table 6.11) Motor vehicle incidents were thecause of more sprain, strain or twist injuries thanany other reported mechanism, with one-half(49%) of persons involved in a motor vehicleincident reporting a sprain/strain injury.
Fractures occurred in more than one-third (35%)of the 273,000 accidents involving sportsequipment (e.g., bikes, scooters, skateboards, skis,skates) and in 29% of the 2.5 million falls.Fractures occurred in more than one-half (53%) ofthe reported 39,000 incidents inwhich a pedestrian was struck. (Table6.11)
Contusion or bruising injuries werereported in 16% of all accidents, witha high level occurring in incidentsthat involved motor vehicles, eitheras a passenger or as a pedestrianstruck by a motor vehicle.
Section 6.3: Musculoskeletal InjurySites
The Centers for Disease Control estimates thatmore than 50 million injuries occurred in 2000.4
Traumatic brain injuries, injuries to the torso,systemwide injuries, and unspecified injuriesrepresented nearly all the fatal injuries; however,injuries to the upper and lower extremitiesaccounted for the greatest number of hospitalizedand non-hospitalized injury episodes. (Table 6.12)
Fractures occur most frequently in the upperlimb, including the hand, fingers, and arm. Of the9.1 million fractures of the upper limb treatedoverall in 2004, 60% were treated in physicianoffices, accounting for 31% of all fractures treatedin physician offices. (Table 6.13 and Graph 6.3.1)The ankle was the third most common site (13%)for fractures treated in physician offices, with theribs/sternum, tibia and fibula (leg), and footincluding toes accounting for 9% each of treatedfractures.
Two-thirds (67%) of the 16.3 million sprain andstrain injuries were treated in physician offices in2004. Of these sprain and strain injuries, the back,including the sacroiliac joint, was the mostcommon site, representing 34% of the treatedinjuries. Shoulder (22%) and ankle and footinjuries (20%) represented the other two mostcommon anatomic sites for sprains and strains
The Burden of Musculoskeletal Diseases in the United States - Copyright © 2008 127
Musculoskeletal Injuries Chapter 6
Graph 6.2.2: Nonfatal UnintentionalInjuries Treated in Hospital EmergencyDepartments, United States 2003
Source: National Safety Council: Injury Facts, 2005-2006. Itasca, IL: National Safety Council, 2006, p 13.
Graph 6.3.1: Visits to Physicians in Office-Based Practice for Fractures atSelected Anatomic Sites, United States 2004
All listed diagnoses. Source: National Center for Health Statistics, National Ambulatory Medical Care Survey, 2004.

treated in physician offices. (Table 6.13 and Graph6.3.2)
A substantial majority of the 5.1 milliondislocation injuries (85%) treated in 2004 weretreated in physician offices. Dislocation of theknee joint represented 63% of these injuries, withthe shoulder (6%) the only other anatomic site toaccount for more than a very small fraction ofdislocations. (Table 6.13) This finding is likely anartifact of an ICD-9 coding anomaly. Isolatedacute ligamentous injuries of the knee, (i.e.,anterior cruciate ligament (ACL), medialcollateral ligament (MCL), posterior cruciateligament (PCL), and lateral collateral ligament(LCL) disruptions) are coded as dislocationsusing ICD-9 methodology, whereas equivalentinjuries in other joints are coded as sprains orstrains rather than dislocations. True completedislocations of the knee joint are actually quiterare, and associated with marked morbidity.
The annual National Health Interview Survey(NHIS) provides data on self-reported injuries. Inthe 2004 NHIS, injuries to the ankle (11.6%) andknee (11.4%) were reported more frequently thanother anatomical sites. (Table 6.14) Amongpersons under the age of 18, injuries to the ankle,foot, and toes were the most common. Personsaged 18 to 44 years reported injury to their ankle,
knee, and finger/thumb about equally, accountingfor more than one-third of all reportedmusculoskeletal injuries. Persons aged 45 to 64years reported knee injuries the most frequently.Knee, shoulder, and hip injuries were mostcommon among persons aged 65 and over.
Section 6.4: Musculoskeletal InjuryLimitations
Musculoskeletal injuries are often a cause ofphysical limitations in the ability to performactivities of daily living (e.g., eating, personalcare, and dressing). In 2004, four out of every 100persons reported they were currentlyexperiencing limitations in their ability toperform daily activities as a result of a fracture orbone/joint injury. (Table 6.15 and Graph 6.4.1)Among persons aged 65 and over, the rate withlimitations was nearly 11 out of 100 due tofracture or bone/joint injury. With the exception ofpersons aged 65 and over, males are more likelyto report a limitation in ability to perform
activities of daily living due to fracture or otherbone/joint injury than are women.
Many common chores around the house arereported as difficult to perform by persons with amusculoskeletal injury. As many as 84% of
The Burden of Musculoskeletal Diseases in the United States - Copyright © 2008
Chapter 6 Musculoskeletal Injuries
128
Graph 6.3.2: Visits to Physicians in Office-Based Practicefor Sprains and Strains at Selected Anatomic Sites,United States 2004
All listed diagnoses. Source: National Center for Health Statistics, National Ambulatory MedicalCare Survey, 2004.
Graph 6.4.1 : Rate of Activity Limitations due to Fractureor Bone/Joint Injury [1] by Gender and Age for PersonsAged 18 and Over, United States 2003-2004
[1] "What condition or health problem causes you tohave difficulty with or need help with the followingactivities?”
Source: National Center for Health Statistics,National Health and Nutrition Examination Survey,2003-2004.

persons reporting a musculoskeletal injuryreported “some” to “unable to do” difficulty inperforming twenty common tasks of daily living.(Table 6.16 and Graph 6.4.2) The most frequentlymentioned limitation due to a fracture orbone/joint injury was “stooping, crouching orkneeling,” with 84% reporting some degree ofdifficulty doing this. However, “standing on theirfeet for two hours or more” was reported by thehighest percentage (19%) as “unable to perform.”
In 2005, 4.4 million persons over the age of 18reported spending a mean of 28.6 days in beddue to a fracture or bone/joint injury, resultingin a total of 127.1 million bed days. Bed days aredefined as illness or injury that kept a person inbed more than one-half of a day, excludinghospitalization. An additional 10.6 millionreported a mean of 29.4 bed days due to back orneck problems, for a total of 312.8 million beddays. Overall, musculoskeletal conditions,including arthritis and rheumatism, wereresponsible for 72% of all bed days reported forseven chronic or traumatic health conditions inthe United States in 2005, with musculoskeletalinjuries accounting for 13% of 2005 bed days.(Tables 6.17 and 6.19 and Graph 6.4.3)
Eleven percent (11%) of persons reporting theyhad been in the paid workforce over the
previous 12 months also reported missing a meanof 24.8 days from work due to fractures, bone, orjoint injury, for a total of 72.1 million lost workdays. A missed work day is defined as absencefrom work due to illness or injury in the past 12months, excluding maternity or family leave.Although other types of injuries were reported by
The Burden of Musculoskeletal Diseases in the United States - Copyright © 2008 129
Musculoskeletal Injuries Chapter 6
Graph 6.4.2: Activities "Unable to Perform" Due to Fractureof Bone/Joint Injury for Persons Aged 18 and Over, United States 2003-2004
[1] "What condition or health problem causes you to have difficulty with orneed help with the following activities?"[2] "By yourself and without using any special equipment, how muchdifficulty do you have ..."Source: National Center for Health Statistics, National Health and NutritionExamination Survey, 2003-2004.
Graph 6.4.3: Proportion of Bed Days Resulting fromSelected Health Conditions for Persons Aged 18 andOver, United States 2005
Respondents reported “Yes” when asked "Areyou limited in any way in any activities becauseof physical, mental or emotional problems?"
Respondents reported the number of days illnessor injury kept them in bed more than half of theday, including overnight hospitalization.
Source: National Center for Health Statistics, National Health InterviewSurvey, Adult Sample 2005.
Graph 6.4.4: Proportion of Lost Work Days Resultingfrom Selected Health Conditions for Persons Aged 18and Over, United States 2005
Respondents reported 'Yes' when asked "Areyou limited in any way in any activitiesbecause of physical, mental or emotionalproblems?"
Respondents reported being in the paid workforce in the previous 12 months and providedthe number of days of missed work at a jobor business due to illness or injury, excluding maternity or parental leavedays.
Source: National Center for Health Statistics. National Health InterviewSurvey, 2005

only 4% of the workforce, mean lost work dayswere much higher at 48.7 days, for a total of 40.4million lost work days. (Tables 6.18 and 6.19 andGraph 6.4.4)
Section 6.5: Workplace Injuries
Cumulative and repetitive motion injuries, alsodescribed as musculoskeletal disorders (MSDs),occur when the body reacts to strenuous motion(i.e., bending, climbing, crawling, reaching,twisting), overexertion, or repetitive motion. MSDinjuries include sprains, strains, tears, back pain,soreness, carpal tunnel syndrome, hernia, andmusculoskeletal system and connective diseases.MSD cases are more severe than the averagenonfatal workplace injury or illness, typicallyinvolving an average of 2 additional days awayfrom work.5 In 2005, the median number of daysaway from work for all workplace injuries was 7days; for MSD injuries, the median was 9 days.
In addition to MSD injuries as defined above,musculoskeletal workplace injuries includefractures, bruises/contusions, and amputations.
Section 6.5.1: Trends in WorkplaceMusculoskeletal Disorders
Although the rate of nonfatal occupationalinjuries and illnesses has decreased over the past15 years, the relative percentage of MSD cases hasfluctuated within a narrow range of 30% to 34%.(Table 6.20 and Graph 6.5.1) During this sametime frame, total cases of work-related injuriesand illnesses dropped from 2.33 million in 1998 to1.23 million in 2005, a change of 47%. At the sametime, MSDs declined from 784,100 to 375,500, achange of 52%.
The distribution of MSD injuries by type of injuryhas remained essentially constant over the pastsix years, as has the distribution between males(62%-64%) and females (36%-38%). (Tables 6.21and 6.22) Slightly more than one-half (57%) of allsprain, strain, and tear injuries resulting in daysaway from work in 2005 were classified as anMSD injury. Although sprains, strains and tearsrepresent about 40% of total workplace injuriesand illnesses involving days away from work,they represent nearly three-fourths (72.5%) of allMSD injuries. (Graph 6.5.2) Back pain, carpal
The Burden of Musculoskeletal Diseases in the United States - Copyright © 2008
Chapter 6 Musculoskeletal Injuries
130
Graph 6.5.1: Trend in Number and Proportion of Nonfatal Musculoskeletal Disorder (MSD) Occupational Injuries andIllnesses Involving Days Away from Work, United States 1992-2005
Source 1998 to 2005: U.S. Department of Labor, Bureau of Labor Statistics: Case and Demographic Characteristics for Work-related Injuries and IllnessesInvolving Days Away from Work. Supplemental Table 11: Number of nonfatal occupational injuries and illnesses involving days away from work by selectedworker and case characteristics and musculoskeletal disorders, all United States, private industry, 2000-2005. Available at:h�p://www.bls.gov/iif/oshcdnew.htm#Resource%20Table%20categories%20-%202005. Accessed July 27, 2007. Source 1992 to 1997: U.S. Department of Labor, Bureau of Labor Statistics: Worker Health Chartbook 2004. Available at: h�p://www2a.cdc.gov/niosh-Chartbook/imagedetail.asp?imgid=77. Accessed August 24, 2007.

tunnel syndrome, tendonitis, soreness and pain(other than back pain), and a range of otherconditions comprise the remaining MSD injuries.About 62% of back pain injuries and 42% of allsoreness/pain injuries are classified as MSDinjuries.
Section 6.5.2: Demographic Characteristics ofMSD Workplace Injuries
Workplace injuries resulting in days away fromwork, both overall and for MSD injuries, are farmore likely to be sustained by males than byfemales (2:1 ratio). This is most likely due to thedifferences in work environments, with malesmore likely employed in workplace settings withdifferent risks and exposures. However, the ratioof full-time workers sustaining a carpal tunnelsyndrome injury severe enough to result in daysaway from work is 2:1 for females versus males;55% of the 2005 tendonitis injuries were incurredby females. (Table 6.23 and Graph 6.5.3)
Two-thirds or more of all workplace injuries andMSD injuries resulting in days away from workin 2005 were sustained by white workers. Carpal
The Burden of Musculoskeletal Diseases in the United States - Copyright © 2008 131
Musculoskeletal Injuries Chapter 6
Graph 6.5.2: Proportion of Musculoskeletal Disorders(MSDs) by Type for Nonfatal Occupational Injuries [1]and Illnesses Involving Days Away from Work, UnitedStates 2005
[1] Multiple injuries per case possible;percentages based on total injuries,which may be > total cases.
Source: U.S. Department of Labor,Bureau of Labor Statistics: Bureau of Case and Demographic Characteristics for Work-related Injuries andIllnesses Involving Days Away from Work. Supplemental Tables, Table 11:Number of nonfatal occupational injuries and illnesses involving days awayfrom work by selected worker and case characteristics and musculoskeletaldisorders, all United States, private industry, 2005. Available at:h�p://www.bls.gov/iif/oshcdnew.htm#Resource%20Table%20categories%20-%202005. Accessed July 27, 2007.
Graph 6.5.3: Proportion of Musculoskeletal Disorders(MSDs) by Type for Nonfatal Occupational Injuries andIllnesses Involving Days Away from Work by Sex, United States 2005
Graph 6.5.4: Proportion [1] of Musculoskeletal Disorders(MSDs) by Type for Nonfatal Occupational Injuries andIllnesses Involving Days Away from Work by Race, United States 2005
[1] Percentages based on number of cases forwhich race is reported.[2] Nonfatal injuries and illnesses include thetotal of all nonfatal injuries and illnessesinvolving days away from work
Source: U.S. Department of Labor, Bureau ofLabor Statistics: Case and DemographicCharacteristics for Work-related Injuries and Illnesses Involving Days Away from Work. Supplemental Tables2005, Table 9: Number of nonfatal occupatonal injuries and illnessesinvolving days away from work by selected worker case characteristicsandnature of injury or illness, all United States, private industry, 2005, andTable 11: Number of nonfatal occupational injuries and illnesses involvingdays away from work by selected worker and case characteristics andmusculoskeletal disorders, all United States, private industry, 2005. Availableat: h�p://www.bls.gov/iif/oshcdnew.htm#Resource%20Table%20categories%20-%202005. Accessed July 27, 2007.
Source: U.S. Department of Labor, Bureau of Labor Statistics: Case andDemographic Characteristics for Work-related Injuries and IllnessesInvolving Days Away from Work. Supplemental Tables 2005, Table 9:Number of nonfatal occupatonal injuries and illnesses involving days awayfrom work by selected worker case characteristics and nature of injury orillness, all United States, private industry, 2005, and Table 11: Number ofnonfatal occupational injuries and illnesses involving days away from workby selected worker and case characteristics and musculoskeletal disorders,all United States, private industry, 2005. Available at:h�p://www.bls.gov/iif/oshcdnew.htm#Resource%20Table%20categories%20-%202005. Accessed July 27, 2007.

tunnel syndrome injuries occur almostexclusively to whites (79%). Although Hispanicsor Latinos represent only 12% of all MSD injuries,they are the second most likely race to sustainsprains/strains/tears (16%) or tendonitis (19%)injuries. (Table 6.24 and Graph 6.5.4)
Workers between the ages of 25 and 54 representabout 75% of all workplace injuries that resultedin days away from work in 2005. Injuries toworkers younger than 20 years of age and olderthan 65 years are fairly rare, accounting for lessthan 1% to 6% of all injury cases, most likely dueto lower representation in the workforce. Carpaltunnel syndrome is more likely to occur toworkers aged 45 to 54; workers aged 35 to 44 areslightly more likely to report tendonitis. (Table6.25 and Graph 6.5.5)
Section 6.5.3: Incidence Rates for WorkplaceInjuries by Type of Injury and Body Part Affected
While workplace injuries affect all parts of theanatomy, MSD workplace injuries primarilytarget the back (49%), upper extremities (15%),
shoulder (12%), trunk (10%), andknee (5%), together representing91% of days away from work in2005. (Table 6.26 and Graph 6.5.6)Carpal tunnel syndrome, an injuryexclusively of the wrist, andtendonitis, which focuses primarilyin the arm, wrist, hand, fingers,and shoulder, accounted for 74%and 16%, respectively, of MSDinjuries resulting in days awayfrom work in 2005. Sprains andstrains occur primarily in the backand lower extremities (42% and24%, respectively). (Table 6.26 andGraph 6.5.6)
The incidence of sprain, strain andtear injuries is much higher thanany other type of injury, with a rate
The Burden of Musculoskeletal Diseases in the United States - Copyright © 2008
Chapter 6 Musculoskeletal Injuries
132
Graph 6.5.5: Proportion of Musculoskeletal Disorders (MSDs) by Type forNonfatal Occupational Injuries and Illnesses Involving Days Away fromWork by Age, United States 2005
Source: U.S. Department of Labor, Bureau of Labor Statistics: Case and Demographic Characteristicsfor Work-related Injuries and Illnesses Involving Days Away from Work. Supplemental Tables 2005,Table 9: Number of nonfatal occupational injuries and illnesses involving days away from work byselected worker case characteristics and nature of injury or illness,all United States, private industry,2005, and Table 11: Number of nonfatal occupational injuries and illnesses involving days away fromwork by selected worker and case characteristics and musculoskeletal disorders, All United States,private industry, 2005. Available at: h�p://www.bls.gov/iif/oshcdnew.htm#Resource%20Table%20categories%20-%202005. Accessed July 27,2007.
Graph 6.5.6: Proportion of Musculoskeletal Disorders(MSDs) by Type for Nonfatal Occupational Injuries andIllnesses Involving Days Away from Work by Body PartAffected, United States 2005
Source: U.S. Department of Labor,Bureau of Labor Statistics: Case andDemographic Characteristics for Work-related Injuries and Illnesses InvolvingDays Away from Work. SupplementalTables 2005, Table 9: Number of nonfataloccupational injuries and illnessesinvolving days away from work byselected worker case characteristics andnature of injuryor illness, all UnitedStates, private industry, 2005, and Table11: Number of nonfatal occupationalinjuries and illnesses involving daysaway from work by selected worker andcase characteristics and musculoskeletaldisorders, All United States, privateindustry, 2005. Available at: h�p://www.bls.gov/iif/oshcdnew.htm#Resource%20Table%20categories%20-%20200. Accessed July 27, 2007.
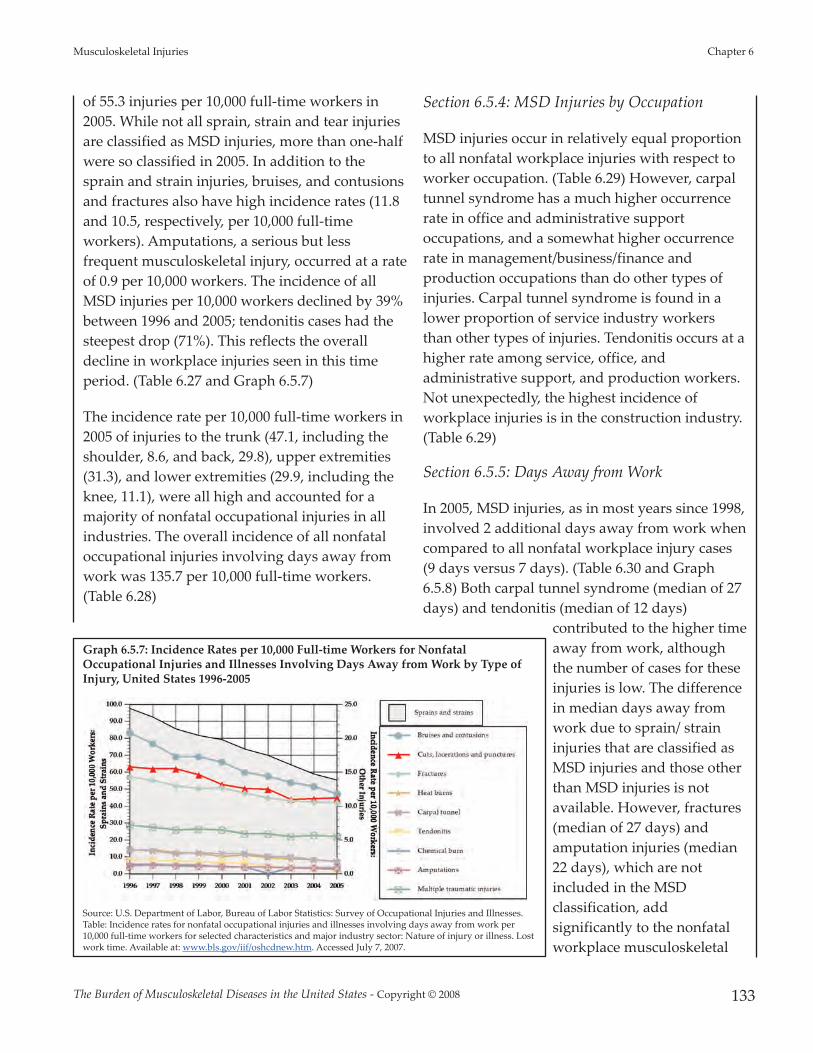
of 55.3 injuries per 10,000 full-time workers in2005. While not all sprain, strain and tear injuriesare classified as MSD injuries, more than one-halfwere so classified in 2005. In addition to thesprain and strain injuries, bruises, and contusionsand fractures also have high incidence rates (11.8and 10.5, respectively, per 10,000 full-timeworkers). Amputations, a serious but lessfrequent musculoskeletal injury, occurred at a rateof 0.9 per 10,000 workers. The incidence of allMSD injuries per 10,000 workers declined by 39%between 1996 and 2005; tendonitis cases had thesteepest drop (71%). This reflects the overalldecline in workplace injuries seen in this timeperiod. (Table 6.27 and Graph 6.5.7)
The incidence rate per 10,000 full-time workers in2005 of injuries to the trunk (47.1, including theshoulder, 8.6, and back, 29.8), upper extremities(31.3), and lower extremities (29.9, including theknee, 11.1), were all high and accounted for amajority of nonfatal occupational injuries in allindustries. The overall incidence of all nonfataloccupational injuries involving days away fromwork was 135.7 per 10,000 full-time workers.(Table 6.28)
Section 6.5.4: MSD Injuries by Occupation
MSD injuries occur in relatively equal proportionto all nonfatal workplace injuries with respect toworker occupation. (Table 6.29) However, carpaltunnel syndrome has a much higher occurrencerate in office and administrative supportoccupations, and a somewhat higher occurrencerate in management/business/finance andproduction occupations than do other types ofinjuries. Carpal tunnel syndrome is found in alower proportion of service industry workersthan other types of injuries. Tendonitis occurs at ahigher rate among service, office, andadministrative support, and production workers.Not unexpectedly, the highest incidence ofworkplace injuries is in the construction industry.(Table 6.29)
Section 6.5.5: Days Away from Work
In 2005, MSD injuries, as in most years since 1998,involved 2 additional days away from work whencompared to all nonfatal workplace injury cases(9 days versus 7 days). (Table 6.30 and Graph6.5.8) Both carpal tunnel syndrome (median of 27days) and tendonitis (median of 12 days)
contributed to the higher timeaway from work, althoughthe number of cases for theseinjuries is low. The differencein median days away fromwork due to sprain/ straininjuries that are classified asMSD injuries and those otherthan MSD injuries is notavailable. However, fractures(median of 27 days) andamputation injuries (median22 days), which are notincluded in the MSDclassification, addsignificantly to the nonfatalworkplace musculoskeletal
The Burden of Musculoskeletal Diseases in the United States - Copyright © 2008 133
Musculoskeletal Injuries Chapter 6
Graph 6.5.7: Incidence Rates per 10,000 Full-time Workers for NonfatalOccupational Injuries and Illnesses Involving Days Away from Work by Type ofInjury, United States 1996-2005
Source: U.S. Department of Labor, Bureau of Labor Statistics: Survey of Occupational Injuries and Illnesses.Table: Incidence rates for nonfatal occupational injuries and illnesses involving days away from work per10,000 full-time workers for selected characteristics and major industry sector: Nature of injury or illness. Lostwork time. Available at: www.bls.gov/iif/oshcdnew.htm. Accessed July 7, 2007.

injury burden. Shoulder, wrist, and knee injuriesinvolved the highest median number of daysaway from work (15, 14, and 12, respectively).(Table 6.31)
Overall, musculoskeletal workplace injuries are amajor concern, accounting for a large proportionof all nonfatal injuries that result in days away
from work. Even through long term trends showsignificant reductions in the total number ofworker injuries each year, the proportion that aremusculoskeletal related (MSD, fractures, bruises/contusions, and amputations) continues toaccount for more than one-half of all workernonfatal injury cases involving days away fromwork. In addition to the cost of medical care forthese injuries, the cost of lost wages and thepotential for long term impacts on workerproductivity are enormous.
Section 6.6: Health Care ResourceUtilization for MusculoskeletalInjuries
Injury treatment episodes in 2004, for purposes ofthis study, have been defined as the accumulativetotal of cases for all diagnoses treated inphysician offices, emergency rooms, outpatientclinics, and hospitals, as identified in four majornational health care databases. Of the 57.2 millionmusculoskeletal injury treatment episodes thatoccurred in 2004, 60% were treated in aphysician’s office. (Table 6.32 and Graph 6.6.1)Another one-third (31%) were treated inemergency rooms. Only 6% were treated inoutpatient clinics, with 3% of persons with
The Burden of Musculoskeletal Diseases in the United States - Copyright © 2008
Chapter 6 Musculoskeletal Injuries
134
Graph 6.5.8: Median Days Away from Work for NonfatalOccupational Injuries and Illnesses Involving Days Awayfrom Work by Type of Injury, United States 2005
Source: U.S. Department of Labor, Bureau of Labor Statistics: Survey ofOccupational Injuries and Illnesses. Table 11: Percent distribution ofnonfatal occupational injuries and illnesses involving days away from workby selected injury or illness characteristics and and number of days awayfrom work: Nature of injury or illness. Lost work time:1995-2005. Availableat: www.bls.gov/iif/ oshcdnew.htm. Accessed July 7, 2007.
Graph 6.6.1: Resource Utilization for Traumatic Musculoskeletal Injuries by Treatment Location for All Diagnoses,United States 2004
[1] Source: National Center for Health Statistics, National Ambulatory Medical Care Survey, 2004.[2] Source: National Center for Health Statistics, National Hospital Ambulatory Medical Care Survey, EmergencyRoom Visits, 2004.[3] Source: National Center for Health Statistics, National Hospital Ambulatory Medical Visits, OutpatientDepartment Visits, 2004.[4] Source: Agency for Healthcare Research and Quality, Healthcare Cost and Utilization Project, NationwideInpatient Sample, 2004.

musculoskeletal injuries admitted to a hospital.Persons hospitalized for a musculoskeletal injuryrepresented 31% of all hospitalizations for aninjury; musculoskeletal injuries accounted for60% of all injury treatment episodes.
Males and females show only slight differences inwhere they are treated for a musculoskeletalinjury. However, females were slightly morelikely to be hospitalized (52% of all hospitalizedinjuries) or to be treated in a physician’s office(54%) than are males. Males were slightly morelikely to visit a hospital emergency room (52%) orhospital outpatient clinic (51%) for treatment.
The age of a person seeking treatment for amusculoskeletal injury is a factor in wheretreatment is given. (Table 6.33) Persons aged 65and over are the most likely to be hospitalized fora musculoskeletal injury of any type, accountingfor 47% of hospitalized musculoskeletal injurytreatment episodes in 2004 but representing only17% of all musculoskeletal injuries. Persons underthe age of 18 are the least likely to be hospitalized,representing only 8% of hospitalized episodes,while accounting for 24% of all musculoskeletalinjury treatment episodes. Persons aged 18 to 44years are more likely to seek treatment in an
emergency room, while those aged 45 to 64 aremore likely to seek treatment in a physician’soffice.
In 85% of the 2004 musculoskeletal injurytreatment episodes, or 48.8 million injuryepisodes, the primary (1st) diagnosis was amusculoskeletal injury. (Table 6.34 and Graph6.6.2) Among the 1.6 million persons hospitalizedfor a musculoskeletal injury, 65% werehospitalized with a primary (1st) diagnosis of amusculoskeletal injury. Hospitalization for afracture is usually the primary (1st) diagnosis(77%).
Fractures and open wounds are commonly theprimary (1st) diagnosis (88% and 87%,respectively) regardless of the treatment site,while sprains and strains are less frequently aprimary (1st) diagnosis (49%). Persons seekingtreatment in outpatient clinics or emergencyrooms for injuries are the most likely to have amusculoskeletal injury as the primary (1st)diagnosis (90% and 89%, respectively).
The 1.04 million persons hospitalized for aprimary (1st) diagnosis of a musculoskeletal injuryin 2004 spent an average of 4.7 days in the
The Burden of Musculoskeletal Diseases in the United States - Copyright © 2008 135
Musculoskeletal Injuries Chapter 6
Graph 6.6.2: Percent of All Traumatic Musculoskeletal Injuries by Treatment Location That Are First Diagnoses, United States 2004
[1] Source: National Center for Health Statistics, National Ambulatory Medical Care Survey, 2004.[2] Source: National Center for Health Statistics, National Hospital Ambulatory Medical Care Survey,Emergency Room Visits, 2004.[3] Source: National Center for Health Statistics, National Hospital Ambulatory Medical Visits, OutpatientDepartment Visits, 2004.[4] Source: Agency for Healthcare Research and Quality, Healthcare Cost and Utilization Project, NationwideInpatient Sample, 2004.

hospital, representing 4.9 millionhospitalized days and total estimated hospitalcosts of $26.65 billion. (Table 6.35 and Graph6.6.3) The mean hospital cost per patient fortreatment of a musculoskeletal injury was$25,600. (Graph 6.6.4) Eighty-one percent (81%) ofpersons hospitalized with a primary (1st)diagnosis of a musculoskeletal injury weretreated for a fracture, yet fractures represented88% of the estimated total cost of treatment. Theaverage hospital length of stay for a fracture was5.1 days, for a total of 4.3 million hospital days;the average hospital charge per patient was$27,740, for a total cost of $23.44 billion.
Section 6.7: Economic Cost ofMusculoskeletal Injuries
Chapter 9 (Health Care Utilization and EconomicCosts of Musculsokeletal Diseases) summarizesthe cost of musculoskeletal conditions based onanalysis of the Medical Expenditures PanelSurvey (MEPS) from 1996 to 2004. The MEPS,which began in 1996, is a set of large-scalesurveys of families and individuals, their medicalproviders (doctors, hospitals, pharmacies, etc.),and employers across the United States. MEPScollects data on the specific health services thatAmericans use, how frequently they use them,the cost of these services, and how they are paid
for, as well as data on thecost, scope, and breadth ofhealth insurance held by andavailable to U.S. workers.Currently MEPS collects datafrom two major components:households and insurancecompanies. The HouseholdComponent (HC) providesdata from individualhouseholds and theirmembers, which issupplemented by data fromtheir medical providers. The
Insurance Component is a separate survey ofemployers that provides data on employer-basedhealth insurance. MEPS also includes a MedicalProvider Component (MPC), which covershospitals, physicians, home health care providers,and pharmacies identified by MEPS-HCrespondents. Its purpose is to supplement and/orreplace information received from the MEPS-HCrespondents.6
As with the National Health Interview Survey(NHIS), data in the household component is self-reported. As noted earlier, the NHIS is believed tounderreport the incidence of injuries.Comparison of incidence between the twodatabases indicates injuries in the MEPS may alsobe underreported. In 2004, the NHIS reported20.2 million persons sustained a musculoskeletalinjury. An annual average of 24.7 million personsreported a musculoskeletal injury between 2002and 2004 in the MEPS, a relatively stable numbersince the 1996 to 1998 MEPS data. (Table 6.36)This compares to the 52.7 million injury treatmentepisodes reported in the four major health caredatabases for physician offices, emergency rooms,hospital outpatient clinics, and inpatient care.
The estimated annual cost for medical care ofmusculoskeletal injuries in 2004 utilizing theMEPS data was $127.4 billion or an average of
The Burden of Musculoskeletal Diseases in the United States - Copyright © 2008
Chapter 6 Musculoskeletal Injuries
136
Graph 6.6.3: Mean Hospital Patient Stayfor Musculoskeletal Injury Patients,United States 2004
Source: Agency for Healthcare Research andQuality, Healthcare Cost and Utilization Project,Nationwide Inpatient Sample, 2004.
Graph 6.6.4: Mean Hospital Charge forMusculoskeletal Injury Patients, United States 2004
Source: Agency for Healthcare Research and Quality,Healthcare Cost and Utilization Project, NationwideInpatient Sample, 2004

$5,160 for each of the 24.7 million persons whosustained a musculoskeletal injury. A breakdownof the $127.4 billion cost due to musculoskeletalinjuries shows 33% for ambulatory care, 31% foremergency room or inpatient care, 17% forprescription drugs, and 18% for other expenses.The cost of musculoskeletal injuries, in 2004dollars, rose from $93 billion in 1996 to $127.4billion in 2004, an increase of 37%. The increasingcost of prescription drugs accounts for the largestpercentage of this total cost increase, rising from11% of total cost to 17% over the 9-year period.(Graph 6.7.1)
1. Centers for Disease Control and Prevention (CDC): 2003National Health Interview Survey (NHIS) Public Use DataRelease. Available at:http://www.cdc.gov/nchs/about/major/nhis/quest_data_related_1997_forward.htm. AccessedMay 10, 2007.
2. Praemer A, Furner S, Rice DP: Musculoskeletal Conditionsin the United States, ed 2. Rosemont, IL: AmericanAcademy of Orthopaedic Surgeons, 1999, p 182.
3. National Safety Council: Injury Facts, 2005-2006. Itasca,IL: National Safety Council, 2006.
4. Finkelstein EA, Corso PS, Miller TR: The Incidence andEconomic Burden of Injuries in the United States. NewYork, NY: Oxford University Press, Inc., 2006, p 187.
5. National Institute for Occupational Safety and Health(NIOSH): Workers Health Chartbook. Cincinnati, OH:Department of Health and Human Services, Centers forDisease Control and Prevention, 2004, p 58.
6. Agency for Health Care Quality and Research: MedicalExpenditure Panel Survey Background, 2007. Available at:http://www.meps.ahrq.gov/mepsweb/about_meps/survey_back.jsp. Accessed May 7, 2007.
The Burden of Musculoskeletal Diseases in the United States - Copyright © 2008 137
Musculoskeletal Injuries Chapter 6
Graph 6.7.1: Total Cost for Musculoskeletal Injuries by Expenditure Type,United States 1996-2004

The Burden of Musculoskeletal Diseases in the United States - Copyright © 2008
Chapter 6 Musculoskeletal Injuries
138
Section 6.8: Musculoskeletal Injuries Data Tables
Table 6.1: Comparison of Incidence of Unintentional Injuries, United States 1985, 1992-1994, 2000, and 2004
Incidence of Injuries (in 000s)
Rice, 1985 [1] MSCUS,
1992-1994 [2] Finkelstein, 2000 [3] BMUS 2008
Incidence % ofTotal Incidence
% of Total Incidence
% of Total Incidence
% ofTotal
Total Injuries 56,443 57,885 50,127 95,298
Fatal Unintentional Injuries 143 0.3% NA 149 0.3% 111 [4] 0.1%
Hospitalized Injuries 2,300 4.1% NA 1,870 3.7% 5,167 [5] 5.4%
Non-hospitalized, Medically TreatedInjuries 54,000 95.7% NA 48,108 96.0% 90,131 [6] 94.6%
Musculoskeletal Injuries NA 36,901 33,460 57,270
Fatal Unintentional Injuries NA NA 33 [7] 0.1% 20 [8] 0.0%
Hospitalized Injuries NA NA 1,273 [7] 3.8% 1,610 [9] 2.8%
Non-hospitalized, Medically TreatedInjuries NA NA 32,154 [7] 96.1% 55,640 [9] 97.2%
Musculoskeletal as % of AllUnintentional Injuries NA 63.7% 66.8% 60.1%
[1] Rice DP, MacKenzie EJ: Cost of Injury in the United States: A Report to Congress, 1989. San Francisco, CA: Institute for Health & Aging, University ofCalifornia and Injury Prevention Center, The Johns Hopkins University, 1989..
[[2] Praemer A, Furner S, Rice DP. Musculoskeletal Conditions in the United States. Rosemont, IL: American Academy of Orthopaedic Surgeons, 1999, p 83.
[3] Finkelstein EA, Corso PS, Miller TR. The Incidence and Economic Burden of Injuries in the United States. New York, NY: Oxford University Press, 2006, p 8.
[4] National Safety Council. Injury Facts, 2005-2006. Itasca, IL: National Safety Council, 2006, p 8.
[5] Agency for Healthcare Research and Quality, Healthcare Cost and Utilization Project, Nationwide Inpatient Sample, 200.
[6] National Center for Health Statistics. National Ambulatory Medical Care Survey, 2004; National Hospital Ambulatory Medical Care Survey, EmergencyRoom Visits, 2004; National Hospital Ambulatory Medical Visits, Outpatient Department Visits, 2004
[7] Defined as spinal cord, vertebral column, torso, upper extremity, lower extremity injuries. Finkelstein EA, Corso PS, Miller TR. The Incidence andEconomic Burden of Injuries in the United States. New York, NY: Oxford University Press,2006, p 13.
[8] Defined as falls. National Safety Council. Injury Facts, 2005-2006. Itasca, IL: National Safety Council, 2006, p 8.
[9] Defined as fracture, derangement, dislocation, sprain/strain, contusion, crushing injury, open wound, traumatic amputation, and late effects of injury.National Center for Health Statistics. National Ambulatory Medical Care Survey, 2004; National Hospital Ambulatory Medical Care Survey, EmergencyRoom Visits, 2004; National Hospital Ambulatory Medical Visits, Outpatient Department Visits, 2004

The Burden of Musculoskeletal Diseases in the United States - Copyright © 2008 139
Musculoskeletal Injuries Chapter 6
Table 6.2 : Resource Utilization for Traumatic Injuries by Treatment Location and Sex,United States 2004
Total Visits (in 000s) [1]
Physician Office
Visits [2]
EmergencyRoom
Visits [3]
Hospital Outpatient
Visits [4]Inpatient
Stays [5]
Total All
Treatment Sites
% AllDiagnoses
for AllTreatmentLocations
Fractures 9,129 4,065 991 1,103 15,288 25%
Dislocations 4,362 536 196 50 5,144 8%
Sprains and Strains 10,981 4,256 948 98 16,283 26%
Contusions 3,319 4,540 330 182 8,371 14%
Open Wounds 4,887 4,643 579 225 10,334 17%
All Other Musculoskeletal Injuries 4,225 1,403 502 153 6,283 10%
Total All Musculoskeletal Traumatic Injuries 34,372 17,888 3,380 1,610 57,250
All Injury Treatment Episodes 54,168 30,770 5,192 5,161 95,291
Proportion of Total Diagnoses That AreMusculoskeletal 63% 58% 65% 31% 60%
[1] All listed diagnoses for inpatients discharged from short-stay hospitals.
[2] Source: National Center for Health Statistics, National Ambulatory Medical Care Survey, 2004
[3] Source: National Center for Health Statistics, National Hospital Ambulatory Medical Care Survey, Emergency Room Visits, 2004
[4] Source: National Center for Health Statistics, National Hospital Ambulatory Medical Visits, Outpatient Department Visits, 2004
[5]Source: Agency for Healthcare Research and Quality, Healthcare Cost and Utilization Project, Nationwide Inpatient Sample, 2004

The Burden of Musculoskeletal Diseases in the United States - Copyright © 2008
Chapter 6 Musculoskeletal Injuries
140
Table 6.3 : Distribution of Injury Treatment Episodes and Self-Reported Injuriesby Type of Musculoskeletal Injury, United States 2004
Total Injury Treatment Episodes [1-4]
Total Females Males <18 Years18-44Years
45-64Years
65 & Over
Fractures 25% 24% 25% 30% 18% 22% 37%
Dislocations 8% 9% 8% 5% 7% 11% 8%
Sprains and Strains 26% 28% 25% 24% 32% 28% 16%
Contusions 14% 14% 13% 14% 13% 11% 19%
Open Wounds 17% 14% 20% 18% 19% 15% 14%
All Other Musculoskeletal Injuries 10% 11% 9% 9% 11% 13% 6%
Total Injury Treatment Episodes (in 000s)
Total All Musculoskeletal Traumatic Injuries 57,250 29,193 28,045 13,502 19,633 14,422 9,615
Self-Reported Injury Episodes [5]
Fractures 22% 24% 20% 32% 15% 18% 29%
Dislocations 2% 2% 2% 3% 3% 1% 0%
Sprains and Strains 38% 40% 36% 33% 45% 37% 28%
Contusions 14% 16% 12% 11% 9% 17% 26%
Open Wounds 17% 12% 22% 15% 23% 16% 10%
All Other Musculoskeletal Injuries 7% 6% 8% 6% 5% 11% 7%
Self-Reported Injury Episodes (in 000s)
Total All Musculoskeletal Traumatic Injuries 20,227 9,529 10,700 5,139 7,219 5,197 2,672
[1] Source: National Center for Health Statistics, National Ambulatory Medical Care Survey, 2004
[2] Source: National Center for Health Statistics, National Hospital Ambulatory Medical Care Survey, Emergency Room Visits, 2004
[3] Source: National Center for Health Statistics, National Hospital Ambulatory Medical Visits, Outpatient Department Visits, 2004
[4] Source: Agency for Healthcare Research and Quality, Healthcare Cost and Utilization Project, Nationwide Inpatient Sample, 2004
[5] National Center for Health Statistics. National Health Interview Survey, 2005

The Burden of Musculoskeletal Diseases in the United States - Copyright © 2008 141
Musculoskeletal Injuries Chapter 6
Table 6.4: Injury Treatment Episodes and Rate by Type of Musculoskeletal Injury by Sexand Age, United States 2004
TOTAL POPULATION Injury Treatment Episodes (in 000s) and Treatment Rate (per 100 population)
Total Under 18 Years 18-44 Years 45-64 years 65 Years & Over
Episodes Rate Episodes Rate Episodes Rate Episodes Rate Episodes Rate
Fractures 15,288 5.2 4,306 5.9 3,825 3.4 3,356 4.8 3,800 10.5
Dislocations 5,144 1.8 652 0.9 1,596 1.4 1,747 2.5 848 2.3
Sprains and Strains 16,283 5.5 3,477 4.7 6,810 6.0 4,393 6.2 1,593 4.4
Contusions 8,371 2.9 1,987 2.7 2,801 2.5 1,685 2.4 1,898 5.2
Open Wounds 10,334 3.5 2,498 3.4 4,026 3.6 2,382 3.4 1,429 3.9
All Other MusculoskeletalInjuries 6,283 2.1 1,340 1.8 2,268 2.0 2,067 2.9 607 1.7
Total All MusculoskeletalTraumatic Injuries 57,250 19.5 13,502 18.4 19,633 17.3 14,422 20.4 9,615 26.5
All Injuries 95,298 32.5 22,609 30.9 32,940 29.1 22,936 32.5 16,806 46.3
Total Population (in 000s) 293,657 73,258 113,373 70,623 36,333
MALESFractures 7,675 5.3 2,859 8.0 2,271 4.1 1,402 3.9 1,143 5.4 Dislocations 2,540 1.8 416 1.2 1,006 1.8 865 2.4 255 1.2 Sprains and Strains 7,532 5.2 1,578 4.4 3,390 6.1 1,898 5.2 666 3.1 Contusions 3,832 2.7 1,062 3.0 1,372 2.5 678 1.9 720 3.4 Open Wounds 5,979 4.1 1,315 3.7 2,432 4.3 1,418 3.9 816 3.9
All Other MusculoskeletalInjuries 2,654 1.8 735 2.1 1,030 1.8 770 2.1 120 0.6
Total All MusculoskeletalTraumatic Injuries 28,045 19.4 7,568 21.2 10,423 18.6 6,614 18.2 3,440 16.3 All Injuries 47,205 32.7 13,490 37.7 16,874 30.2 10,819 29.9 6,890 32.6 Total Population (in 000s) 144,535 35,763 55,952 36,243 21,164
FEMALESFractures 7,604 5.1 1,443 3.8 1,552 2.7 1,954 5.7 2,656 17.5 Dislocations 2,804 1.9 236 0.6 590 1.0 1,183 3.4 595 3.9 Sprains and Strains 8,739 5.9 1,899 5.1 3,418 6.0 2,496 7.2 925 6.1 Contusions 4,540 3.0 924 2.5 1,430 2.5 1,008 2.9 1,178 7.8 Open Wounds 4,354 2.9 1,183 3.2 1,596 2.8 963 2.8 613 4.0
All Other MusculoskeletalInjuries 3,628 2.4 604 1.6 1,238 2.2 1,298 3.8 488 3.2
Total All MusculoskeletalTraumatic Injuries 29,193 19.6 5,930 15.8 9,282 16.2 7,807 22.7 6,174 40.7 All Injuries 48,074 32.2 9,112 24.3 16,061 28.0 14,654 42.5 9,917 65.4 TTotal Population (in 000s) 149,121 37,496 57,421 34,450 15,169
Sources : National Center for Health Statistics, National Ambulatory Medical Care Survey, 2004 National Hospital Ambulatory Medical Care Survey,Emergency Room Visits, 2004 National Hospital Ambulatory Medical Visits, Outpatient Department Visits, 2004 Agency for Healthcare Research andQuality, Healthcare Cost and Utilization Project, Nationwide Inpatient Sample, 2004

The Burden of Musculoskeletal Diseases in the United States - Copyright © 2008
Chapter 6 Musculoskeletal Injuries
142
Table 6.5: Trends in Fracture Treatment Episodes for Selected Anatomic Sites byTreatment Location, United States 1998-2004Emergency Room Visits
Total Visits (rounded to nearest 000) [1]ICD-9-CM Description 1998 1999 2000 2001 2002 2003 2004Upper Limb
812 Fracture of Upper Arm (Humerus) 261 346 417 297 329 398 342813 Fracture of Lower Arm (Radius/Ulna) 647 628 588 745 583 563 763
814 - 817 Wrist/Hand/Fingers 832 1,007 1,033 1,079 970 895 1,093Lower Limb
820 - 821 Fracture of Hip/Upper Leg (Femur) 324 313 297 298 282 302 307823 Fracture of Lower Leg (Tibia/Fibula) 244 234 209 292 2120 197 264
824 - 826 Fracture of Ankle/Foot/Toes 787 697 836 968 740 816 783All Anatomic Sites [2]
812 - 817 Fracture of Upper Limb 1,726 1,965 2,009 2,097 1,853 1,841 2,163820 - 821, 823 - 826 Fracture of Lower Limb 1,339 1,233 1,331 1,551 1,217 1,311 1,348812 - 817, 820 - 821,
823 - 826 All Fracture of Upper/Lower Limb 3,041 3,190 3,308 3,624 3,058 3,148 3,495
Source: National Center for Health Statistics, National Hospital Ambulatory Medical Care Survey, Emergency Room Visits, 1998-2004
Physician Office Visits Total Visits (rounded to nearest 000) [1]
ICD-9-CM Description 1998 1999 2000 2001 2002 2003 2004Upper Limb
812 Fracture of Upper Arm (Humerus) * * * * * * *813 Fracture of Lower Arm (Radius/Ulna) 2,429 1,437 1,852 1,685 2,710 1,116 1,485
814 - 817 Wrist/Hand/Fingers 2,691 1,846 2,450 2,675 2,740 2,464 1,988Lower Limb
820 - 821 Fracture of Hip/Upper Leg (Femur) * * * * * * *823 Fracture of Lower Leg (Tibia/Fibula) * * * * * * *
824 - 826 Fracture of Ankle/Foot/Toes 2,170 1,804 1,883 2,210 2,555 2,228 2,100All Anatomic Sites [2]
812 - 817 Total Upper Limb Fractures 5,718 3,963 5,203 5,005 5,915 4,234 4,203820 - 821, 823 - 826 Total Lower Limb Fractures 4,027 2,750 3,244 3,344 4,008 3,692 3,862812 - 817, 820 - 821,
823 - 826 All Fracture of Upper/Lower Limb 9,746 6,644 8,349 8,184 9,816 7,731 7,976
Source: National Center for Health Statistics, National Hospital Ambulatory Medical Visits, Physician Visits, 1998-2004
Inpatient HospitalizationTotal Visits (rounded to nearest 000) [1]
ICD-9-CM Description 1998 1999 2000 2001 2002 2003 2004Upper Limb
812 Fracture of Upper Arm (Humerus) 90 98 91 105 89 102 102813 Fracture of Forearm (Radius/Ulna) 96 98 98 106 92 108 94
814 - 817 Wrist/Hand/Fingers 42 43 41 38 37 35 39Lower Limb
820 - 821 Fracture of Hip/Upper Leg (Femur) 445 443 423 434 431 4220 449823 Fracture of Lower Leg (Tibia/Fibula) 91 99 94 95 86 91 88
824 - 826 Fracture of Ankle/Foot/Toes 164 172 169 176 166 1700 173All Anatomic Sites [2]
812 - 817 Total Upper Limb Fractures 216 225 221 237 209 231 224820 - 821, 823 - 826 Total Lower Limb Fractures 682 694 663 686 665 664 689812 - 817, 820 - 821,
823 - 826 All Fracture of Upper/Lower Limb 863 887 850 889 843 8670 885
* Estimate does not meet standards for reliability.[1] All diagnoses [2] Totals may not add due to rounding and inclusion of additional anatomic sites.Source: National Center for Health Statistics, National Hospital Discharge Survey,1998-2004

The Burden of Musculoskeletal Diseases in the United States - Copyright © 2008 143
Musculoskeletal Injuries Chapter 6
Table 6.5a: Fracture Treatment Episode Trends for Total Physician Office Visits,Emergency Room Visits, and Inpatient Hospitalization for Selected Anatomic Sites,United States 1998-2004
Total Visits (rounded to nearest 0000) [1]
ICD-9-CM Description 1998 1999 2000 2001 2002 2003 2004Upper Limb
812 Fracture of Upper Arm (Humerus) 351 444 509 401 418 500 444813 Fracture of Forearm (Radius/Ulna) 3,172 2,164 2,539 2,536 3,385 1,786 2,342
814 - 817 Wrist/Hand/Fingers 3,564 2,896 3,524 3,793 3,746 3,394 3,120
Lower Limb820 - 821 Fracture of Hip/Upper Leg (Femur) 769 756 720 732 713 724 756
823 Fracture of Lower Leg (Tibia/Fibula) 334 333 303 387 298 288 352824 - 826 Fracture of Ankle/Foot/Toes 3,121 2,673 2,888 3,354 3,461 3,213 3,057
All Anatomic Sites [2]812 - 817 Total Upper Limb Fractures 7,661 6,153 7,433 7,339 7,977 6,307 6,591
820-821, 823-826 Total Lower Limb Fractures 6,049 4,678 5,237 5,582 5,890 5,666 5,898
812-817, 820-821,823-826 All Fracture of Upper/Lower Limb 13,650 10,722 12,507 12,696 13,718 11,746 12,356
Proportion of Total VisitsICD-9-CM Description 1998 1999 2000 2001 2002 2003 2004Upper Limb 56.1% 57.4% 59.4% 57.8% 58.2% 53.7% 53.3%
812 Fracture of Upper Arm (Humerus) 4.6% 7.2% 6.8% 5.5% 5.2% 7.9% 6.7%813 Fracture of Forearm (Radius/Ulna) 41.4% 35.2% 34.2% 34.6% 42.4% 28.3% 35.5%
814 - 817 Wrist/Hand/Fingers 46.5% 47.1% 47.4% 51.7% 47.0% 53.8% 47.3%
Lower Limb 44.3% 46.6% 41.9% 44.0% 42.9% 48.2% 47.7%820 - 821 Fracture of Hip/Upper Leg (Femur) 12.7% 16.2% 13.8% 13.1% 12.1% 12.8% 12.8%
823 Fracture of Lower Leg (Tibia/Fibula) 5.5% 7.1% 5.8% 6.9% 5.1% 5.1% 6.0%824 - 826 Fracture of Ankle/Foot/Toes 51.6% 57.1% 55.1% 60.1% 58.8% 56.7% 51.8%
Location Emergency Room Visits 22.3% 29.8% 26.5% 28.5% 22.3% 26.8% 28.3%Physician Office Visits 71.4% 62.0% 66.8% 64.5% 71.6% 65.8% 64.6%Inpatient Hospitalization 6.3% 8.3% 6.8% 7.0% 6.1% 7.4% 7.2%
[1] All diagnoses [2] Totals may not add due to rounding and inclusion of additional anatomic sites.
Sources: National Center for Health Statistics, National Hospital Discharge Survey, 1998-2004 National Center for Health Statistics, National HospitalAmbulatory Medical Care Survey, Emergency Room Visits, 1998-2004 National Center for Health Statistics, National Hospital Ambulatory Medical Visits,Physician Visits, 1998-2004

The Burden of Musculoskeletal Diseases in the United States - Copyright © 2008
Chapter 6 Musculoskeletal Injuries
144
Table 6.6: Location of Musculoskeletal Injury EpisodeOccurrence, United States 2004
Total Occurrences
(in 000s) [1]% of Total
Occurrences
Inside Home 5,300 24.6%
Outside Home 4,469 20.7%
School 1,624 7.5%
Street or Highway 1,965 9.1%
Sport or Recreation Facility 1,975 9.2%
Shopping Center/Restaurant 638 3.0%
Other 5,288 24.5%
Unknown 295 1.4%
All Musculoskeletal Injuries 21,554 100.0%
* Totals may not add due to rounding
[1]All listed diagnoses for persons reporting a musculoskeletal injury in the 3-month period priorto the interview.
Source: National Center for Health Statistics. National Health Interview Survey, Injury Database,2004
Table 6.7: Nonfatal Unintentional Injuries Treated inHospital Emergency Departments, United States 2003
Cause of Injury
Total NonfatalUnintentional
Injuries (in 000s)
% of Total Nonfatal
Unintentional
Rate of NonfatalUnintentional
Injuries per 1,000
Falls 7,895 29% 27.1
Struck By/Against 4,422 16% 15.2
Overexertion 3,325 12% 11.4
Motor Vehicle Occupant 3,027 11% 10.4
Cut/Pierce 2,236 8% 7.7
Other Causes 3,641 14% 12.5
Unknown 2,581 10%
Total All Causes 27,127 100% 93.3
Source: National Safety Council. Injury Facts, 2005-2006. Itasca, IL: National Safety Council, 2006, p 13.

The Burden of Musculoskeletal Diseases in the United States - Copyright © 2008 145
Musculoskeletal Injuries Chapter 6
Table 6.8: Nonfatal Unintentional Injuries Treated in EmergencyDepartments by Age, United States 2003
Age
Total NonfatalUnintentional
Injuries Total
Nonfatal Falls
% of Total Nonfatal Injuries
that are Falls
Rank as LeadingCause of Nonfatal
Injury 0-4 Years 2,230,531 987,485 44.3% 1 5-9 Years 1,824,466 670,107 36.7% 1 10-14 Years 2,373,485 678,897 28.6% 1 15-24 Years 5,181,929 973,073 18.8% 3 25-34 Years 4,143,055 754,691 18.2% 1 35-44 Years 3,953,767 812,270 20.5% 1 45-54 Years 2,909,772 739,365 25.4% 1 55-64 Years 1,631,619 563,973 34.6% 1 65 Years & Over 2,878,852 1,822,157 63.3% 1 Total All Ages 27,127,477 7,895,385 29.1% 1
Source: National Safety Council. Injury Facts, 2005-2006. Itasca, IL: National Safety Council, 2006, p 13.
Table 6.9: Deaths Due to Falls from Unintentional Injury Episodes by Age,United States 2003
Age
Total Population
(in 000s)
TotalUnintentionalInjury Deaths
Total DeathsDue to Falls
Rate ofUnintentionalInjury Deaths
Due to Falls (per 100,000 persons)
% of TotalUnintentionalInjury Deaths
Due to Falls
0-4 years 19,547 2,587 53 0.3 2.0%
5-9 years 19,962 1,176 18 0.1 1.5%
10-14 years 21,116 1,542 24 0.1 1.6%
15-19 years 20,351 7,137 83 0.4 1.2%
20-34 years 60,046 20,844 471 0.8 2.3%
35-54 years 84,750 31,385 809 1.0 2.6%
55-64 years 26,582 8,345 1,089 4.1 13.0%
65-74 years 18,280 8,086 3,219 17.6 39.8%
75-84 years 12,759 12,904 5,901 46.2 45.7%
85 years & older 4,546 12,651 5,990 131.8 47.3%
Total All Ages 287,939 106,657 17,657 6.1 16.6%
Source: National Safety Council. Injury Facts, 2005-2006. Itasca, IL: National Safety Council, 2006, pp 32-33.

The Burden of Musculoskeletal Diseases in the United States - Copyright © 2008
Chapter 6 Musculoskeletal Injuries
146
Table 6.10: Trends in Deaths Due to Falls, United States 1984-2004
Total Unintentional Injury Deaths Occurring All Locations [1]
Total Unintentional Injury Deaths Occurring in the Home [2] % All Deaths
Due to Fallsthat Occurred
in the HomeYear
TotalUnintentionalInjury Deaths
Death Due toFalls
% of DeathsDue to Falls
Total HomeInjury Deaths
Death Due toFalls
% of Deathsdue to Falls
1984 92,911 11,937 12.8% 21,200 6,400 30.2% 53.6%1985 93,457 12,001 12.8% 21,600 6,500 30.1% 54.2%1986 95,277 11,444 12.0% 21,700 6,100 28.1% 53.3%1987 95,020 11,733 12.3% 21,400 6,300 29.4% 53.7%1988 97,100 12,096 12.5% 22,700 6,600 29.1% 54.6%1989 95,028 12,151 12.8% 22,500 6,600 29.3% 54.3%1990 91,983 12,313 13.4% 21,500 6,700 31.2% 54.4%1991 89,347 12,662 14.2% 22,100 6,900 31.2% 54.5%1992 86,777 12,646 14.6% 24,000 7,700 32.1% 60.9%1993 90,523 13,141 14.5% 26,100 7,900 30.3% 60.1%1994 91,437 13,450 14.7% 26,300 8,100 30.8% 60.2%1995 93,320 13,986 15.0% 27,200 8,400 30.9% 60.1%1996 94,948 14,986 15.8% 27,500 9,000 32.7% 60.1%1997 95,644 15,447 16.2% 27,700 9,100 32.9% 58.9%1998 97,835 16,274 16.6% 29,000 9,500 32.8% 58.4%1999 97,860 13,162 13.4% 30,500 7,600 24.9% 57.7%2000 97,900 13,322 13.6% 29,200 7,100 24.3% 53.3%2001 101,537 15,019 14.8% 33,200 8,600 25.9% 57.3%2002 106,742 16,257 15.2% 36,200 9,700 26.8% 59.7%2003 108,900 19,800 18.2% 37,600 11,900 31.6% 60.1%2004 111,000 20,200 18.2% 37,400 12,800 34.2% 63.4%
[1] Source: National Safety Council. Injury Facts, 2005-2006. Itasca, IL: National Safety Council, 2006, p 42.
[2] Source: National Safety Council. Injury Facts, 2005-2006. Itasca, IL: National Safety Council, 2006, p 127.
Table 6.11: Proportion of Unintentional Injury Episodes by Type and Cause of Injury, United States 2005
Proportion of Unintentional Injury Episodes by Injury Type [1]
Total InjuryEpisodes [2]
MotorVehicle
Bike,Scooter,
Skateboard,Skis, etc.
Pedestrian(Struck)
Boat, Train,Plane Fall Burn
Spain, Strain or Twist 32.2% 49.3% 34.0% 34.2% 39.8% 31.7% 0.0%Cut or Scrape 22.0% 16.1% 22.0% 8.1% 33.2% 23.1% 4.0%Fracture 20.4% 13.8% 35.4% 52.7% 9.9% 29.4% 4.1%Bruise or Contusion 15.8% 27.1% 15.4% 44.0% 0.0% 21.0% 0.0%Other 13.8% 20.2% 7.3% 12.0% 0.0% 10.1% 0.0%Bite (Insect or Animal) 3.1% 0.0% 0.0% 0.0% 9.4% 0.0% 0.0%Burn 1.4% 0.4% 2.4% 0.0% 7.7% 0.3% 92.0%Total Injury Episodes (in 000s) 7,409 725 273 39 36 2,533 90
[1] Self-reported injury type in the 3-month period prior to the interview.
[2] Multiple injury types per injury episode possible. Totals may not equal 100%.
Source: National Center for Health Statistics. National Health Interview Survey, Injury Database, 2005
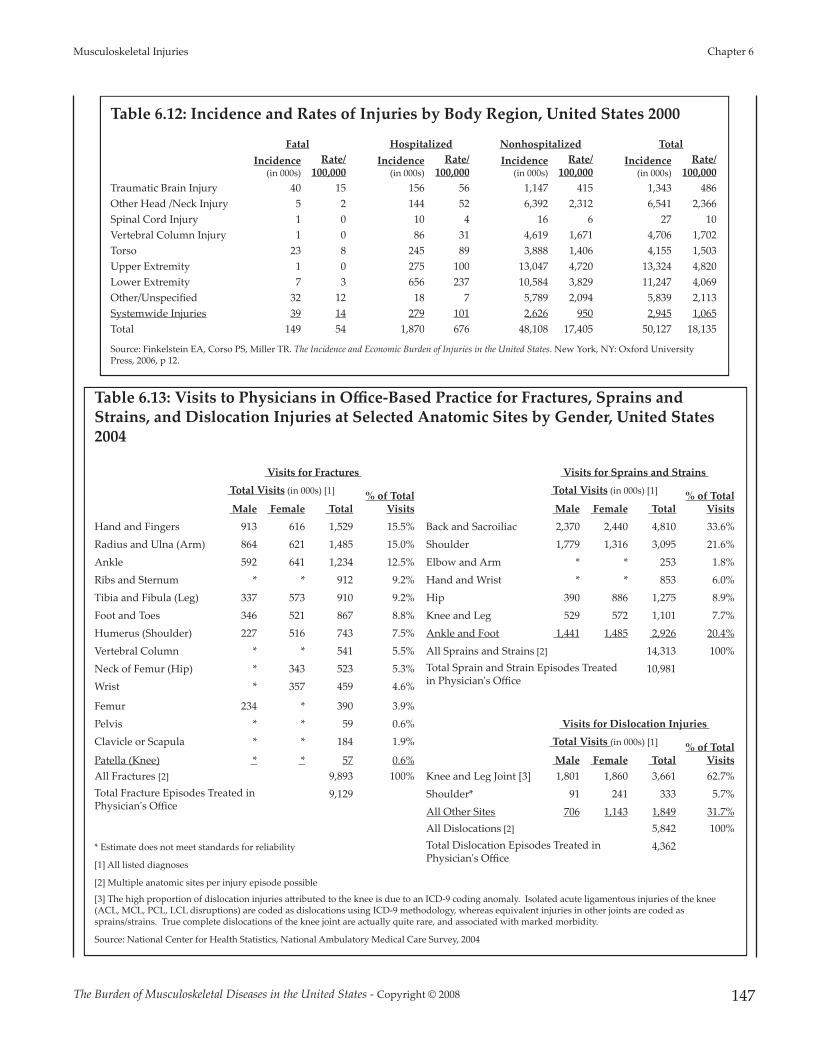
The Burden of Musculoskeletal Diseases in the United States - Copyright © 2008 147
Musculoskeletal Injuries Chapter 6
Table 6.12: Incidence and Rates of Injuries by Body Region, United States 2000
Fatal Hospitalized Nonhospitalized TotalIncidence
(in 000s)Rate/
100,000Incidence
(in 000s)Rate/
100,000Incidence
(in 000s)Rate/
100,000Incidence
(in 000s)Rate/
100,000Traumatic Brain Injury 40 15 156 56 1,147 415 1,343 486Other Head /Neck Injury 5 2 144 52 6,392 2,312 6,541 2,366Spinal Cord Injury 1 0 10 4 16 6 27 10Vertebral Column Injury 1 0 86 31 4,619 1,671 4,706 1,702Torso 23 8 245 89 3,888 1,406 4,155 1,503Upper Extremity 1 0 275 100 13,047 4,720 13,324 4,820Lower Extremity 7 3 656 237 10,584 3,829 11,247 4,069Other/Unspecified 32 12 18 7 5,789 2,094 5,839 2,113Systemwide Injuries 39 14 279 101 2,626 950 2,945 1,065Total 149 54 1,870 676 48,108 17,405 50,127 18,135
Source: Finkelstein EA, Corso PS, Miller TR. The Incidence and Economic Burden of Injuries in the United States. New York, NY: Oxford UniversityPress, 2006, p 12.
Table 6.13: Visits to Physicians in Office-Based Practice for Fractures, Sprains andStrains, and Dislocation Injuries at Selected Anatomic Sites by Gender, United States2004
Visits for Fractures Visits for Sprains and Strains Total Visits (in 000s) [1] % of Total
Visits
Total Visits (in 000s) [1] % of TotalVisits Male Female Total Male Female Total
Hand and Fingers 913 616 1,529 15.5% Back and Sacroiliac 2,370 2,440 4,810 33.6%Radius and Ulna (Arm) 864 621 1,485 15.0% Shoulder 1,779 1,316 3,095 21.6%Ankle 592 641 1,234 12.5% Elbow and Arm * * 253 1.8%Ribs and Sternum * * 912 9.2% Hand and Wrist * * 853 6.0%Tibia and Fibula (Leg) 337 573 910 9.2% Hip 390 886 1,275 8.9%Foot and Toes 346 521 867 8.8% Knee and Leg 529 572 1,101 7.7%Humerus (Shoulder) 227 516 743 7.5% Ankle and Foot 1,441 1,485 2,926 20.4%Vertebral Column * * 541 5.5% All Sprains and Strains [2] 14,313 100%Neck of Femur (Hip) * 343 523 5.3% Total Sprain and Strain Episodes Treated
in Physician's Office10,981
Wrist * 357 459 4.6%
Femur 234 * 390 3.9%Pelvis * * 59 0.6% Visits for Dislocation Injuries Clavicle or Scapula * * 184 1.9% Total Visits (in 000s) [1] % of Total
VisitsPatella (Knee) * * 57 0.6% Male Female Total All Fractures [2] 9,893 100% Knee and Leg Joint [3] 1,801 1,860 3,661 62.7%Total Fracture Episodes Treated inPhysician's Office
9,129 Shoulder* 91 241 333 5.7%All Other Sites 706 1,143 1,849 31.7%All Dislocations [2] 5,842 100%
* Estimate does not meet standards for reliability Total Dislocation Episodes Treated inPhysician's Office
4,362
[1] All listed diagnoses
[2] Multiple anatomic sites per injury episode possible
[3] The high proportion of dislocation injuries a�ributed to the knee is due to an ICD-9 coding anomaly. Isolated acute ligamentous injuries of the knee(ACL, MCL, PCL, LCL disruptions) are coded as dislocations using ICD-9 methodology, whereas equivalent injuries in other joints are coded assprains/strains. True complete dislocations of the knee joint are actually quite rare, and associated with marked morbidity.
Source: National Center for Health Statistics, National Ambulatory Medical Care Survey, 2004

The Burden of Musculoskeletal Diseases in the United States - Copyright © 2008
Chapter 6 Musculoskeletal Injuries
148
Table 6.14: Prevalence of Self-Reported Musculoskeletal Injury Episodes by AnatomicSite by Age, United States 2004
TotalIdentified
Anatomic SiteInjuries
(in 000s) [1]
% of TotalInjuries by
AnatomicSite
Prevalence of Self-Reported Injury Sitesfor All Musculoskeletal Injury Episodes
(in 000s) [2] Proportion of All Injury Sites for AllMusculoskeletal Injury Episodes [2]
< 18 18 to 44 45 to 64 65 &older < 18 18 to 44 45 to 64
65 & older
Ankle 3,103 11.6% 774 1,333 682 315 12.9% 13.5% 9.4% 8.4%
Knee 3,050 11.4% 559 1,169 977 345 9.3% 11.9% 13.4% 9.3%
Finger/Thumb 2,399 9.0% 519 1,128 580 172 8.6% 11.4% 8.0% 4.6%
Shoulder 2,230 8.3% 428 887 575 340 7.1% 9.0% 7.9% 9.1%
Foot or toe 2,370 8.8% 691 880 616 242 11.5% 8.9% 8.5% 6.5%
Lower leg 1,568 5.9% 423 389 457 300 7.0% 3.9% 6.3% 8.0%
Hand 1,623 6.1% 259 795 393 175 4.3% 8.1% 5.4% 4.7%
Back 1,485 5.5% 190 675 376 244 3.2% 6.9% 5.2% 6.5%
Wrist 1,319 4.9% 504 310 325 180 8.4% 3.1% 4.5% 4.8%
Forearm 1,167 4.4% 482 236 329 120 8.0% 2.4% 4.5% 3.2%
Elbow 894 3.3% 287 309 197 102 4.8% 3.1% 2.7% 2.7%
Hip 839 3.1% 94 187 244 314 1.6% 1.9% 3.4% 8.4%
Thigh 597 2.2% 127 149 215 106 2.1% 1.5% 3.0% 2.8%
Upper Arm 636 2.4% 190 100 190 156 3.2% 1.0% 2.6% 4.2%
Other 3,521 13.1% 490 1,305 1,108 618 8.1% 13.2% 15.3% 16.6%AllMusculoskeletalInjury EpisodeAnatomic Sites* 26,801 100.0% 6,017 9,852 7,264 3,729 100.0% 100.0% 100.0% 100.0%
* Totals may not add due to rounding
[1] All listed diagnoses for persons reporting a musculoskeletal injury in the 3 month period prior to the interview.
[2] Multiple anatomic sites per injury episode possible.
Source: National Center for Health Statistics. National Health Interview Survey, Injury Database, 2004
Table 6.15: Activity Limitations due to Fracture orBone/Joint Injury by Gender and Aged for PersonsAge 18 and Over, United States 2003-2004
Rate of Reported Limitations due to Fracture orBone/Joint Injury [1] (per 100 persons)
Male Female Total
18-44 Years 3.5 2.2 2.8
45-64 Years 7.5 6.2 6.9
65 & Over 10.4 11 10.8
All Ages 4.2 3.8 4.0
[1] "What condition or health problem causes you to have difficulty with or need helpwith the following activities?"Source: National Center for Health Statistics. National Health and Nutrition ExaminationSurvey,2003-2004

The Burden of Musculoskeletal Diseases in the United States - Copyright © 2008 149
Musculoskeletal Injuries Chapter 6
Table 6.16: Activity Limitations Due to Fracture of Bone/Joint Injury for Persons Aged18 and Over, United States 2003-2004
Degree of Limitation for Persons Reporting a Limitation [2]Total % With
DifficultyActivity Limitation Reported [1] Some Difficulty Much Difficulty Unable to Do
Stooping, crouching, or kneeling 46.5% 20.6% 16.7% 83.8%
Standing on feet for 2 hours 27.5% 16.3% 18.8% 62.6%
Push or pull large objects like a chair 32.3% 11.3% 15.9% 59.5%
Si�ing for 2 hours 34.7% 9.8% 4.9% 49.4%
Doing chores around the houe 27.1% 8.1% 5.0% 40.2%
Standing up from armless straight chair 26.7% 7.1% 5.8% 39.6%
Li�ing/carrying 10 pound item 23.4% 5.8% 8.1% 37.3%
Ge�ing in and out of bed 29.3% 6.0% 0.7% 36.0%
Reaching over head 23.7% 5.9% 4.3% 33.9%
Walking quarter mile (2-3 blocks) 24.6% 4.8% 3.0% 32.4%
Going shopping, to movies or events 20.6% 7.6% 4.0% 32.2%
Dressing self (tying shoes, zippers, bu�ons) 23.3% 2.7% 0.1% 26.1%
Waking up 10 steps without resting 19.0% 5.1% 0.8% 24.9%
Participating in social activities 17.1% 2.1% 4.2% 23.4%
Using fingers to grasp small objects 19.3% 3.2% 0.3% 22.8%
Moving around rooms on same level 12.1% 1.7% 2.2% 16.0%
Managing money or paying bills 12.2% 1.5% 2.1% 15.8%
Relaxing at home, watching TV, sewing 12.8% 0.7% 0.2% 13.7%
Preparing own meals 10.0% 2.2% 1.3% 13.5%
Eating with utensils or drinking from a glass 7.0% 1.0% 0.0% 8.0%
[1] "What condition or health problem causes you to have difficulty with or need help with the following activities . . . ?"
[2] "By yourself and without using any special equipment, how much difficulty do you have . . .?"
Source: National Center for Health Statistics. National Health and Nutrition Examination Survey, 2003-2004
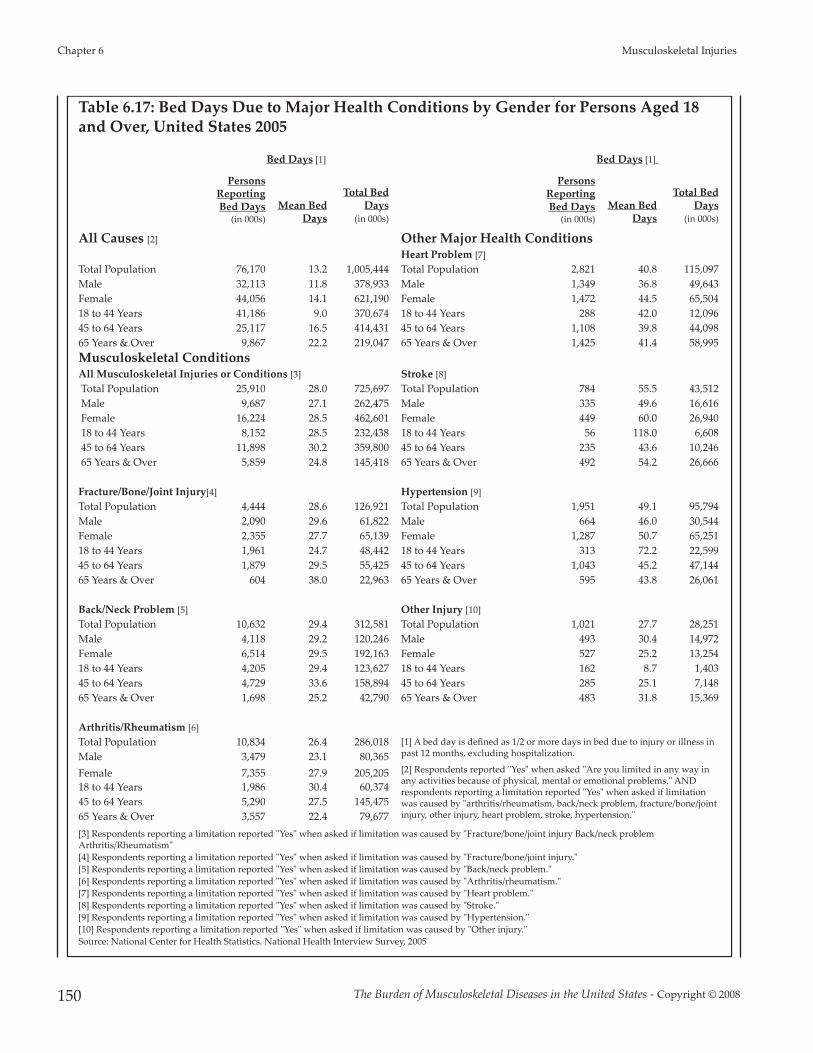
The Burden of Musculoskeletal Diseases in the United States - Copyright © 2008
Chapter 6 Musculoskeletal Injuries
150
Table 6.17: Bed Days Due to Major Health Conditions by Gender for Persons Aged 18and Over, United States 2005
Bed Days [1] Bed Days [1]
PersonsReportingBed Days
(in 000s)Mean Bed
Days
Total BedDays
(in 000s)
PersonsReportingBed Days
(in 000s)Mean Bed
Days
Total BedDays
(in 000s)
All Causes [2] Other Major Health ConditionsHeart Problem [7]
Total Population 76,170 13.2 1,005,444 Total Population 2,821 40.8 115,097 Male 32,113 11.8 378,933 Male 1,349 36.8 49,643 Female 44,056 14.1 621,190 Female 1,472 44.5 65,504 18 to 44 Years 41,186 9.0 370,674 18 to 44 Years 288 42.0 12,096 45 to 64 Years 25,117 16.5 414,431 45 to 64 Years 1,108 39.8 44,098 65 Years & Over 9,867 22.2 219,047 65 Years & Over 1,425 41.4 58,995 Musculoskeletal ConditionsAll Musculoskeletal Injuries or Conditions [3] Stroke [8]Total Population 25,910 28.0 725,697 Total Population 784 55.5 43,512 Male 9,687 27.1 262,475 Male 335 49.6 16,616 Female 16,224 28.5 462,601 Female 449 60.0 26,940 18 to 44 Years 8,152 28.5 232,438 18 to 44 Years 56 118.0 6,608 45 to 64 Years 11,898 30.2 359,800 45 to 64 Years 235 43.6 10,246 65 Years & Over 5,859 24.8 145,418 65 Years & Over 492 54.2 26,666
Fracture/Bone/Joint Injury[4] Hypertension [9]Total Population 4,444 28.6 126,921 Total Population 1,951 49.1 95,794 Male 2,090 29.6 61,822 Male 664 46.0 30,544 Female 2,355 27.7 65,139 Female 1,287 50.7 65,251 18 to 44 Years 1,961 24.7 48,442 18 to 44 Years 313 72.2 22,599 45 to 64 Years 1,879 29.5 55,425 45 to 64 Years 1,043 45.2 47,144 65 Years & Over 604 38.0 22,963 65 Years & Over 595 43.8 26,061
Back/Neck Problem [5] Other Injury [10]Total Population 10,632 29.4 312,581 Total Population 1,021 27.7 28,251 Male 4,118 29.2 120,246 Male 493 30.4 14,972 Female 6,514 29.5 192,163 Female 527 25.2 13,254 18 to 44 Years 4,205 29.4 123,627 18 to 44 Years 162 8.7 1,403 45 to 64 Years 4,729 33.6 158,894 45 to 64 Years 285 25.1 7,148 65 Years & Over 1,698 25.2 42,790 65 Years & Over 483 31.8 15,369
Arthritis/Rheumatism [6]Total Population 10,834 26.4 286,018 [1] A bed day is defined as 1/2 or more days in bed due to injury or illness in
past 12 months, excluding hospitalization.Male 3,479 23.1 80,365 Female 7,355 27.9 205,205 [2] Respondents reported "Yes" when asked "Are you limited in any way in
any activities because of physical, mental or emotional problems." ANDrespondents reporting a limitation reported "Yes" when asked if limitationwas caused by "arthritis/rheumatism, back/neck problem, fracture/bone/jointinjury, other injury, heart problem, stroke, hypertension."
18 to 44 Years 1,986 30.4 60,374 45 to 64 Years 5,290 27.5 145,475 65 Years & Over 3,557 22.4 79,677 [3] Respondents reporting a limitation reported "Yes" when asked if limitation was caused by "Fracture/bone/joint injury Back/neck problemArthritis/Rheumatism"[4] Respondents reporting a limitation reported "Yes" when asked if limitation was caused by "Fracture/bone/joint injury."[5] Respondents reporting a limitation reported "Yes" when asked if limitation was caused by "Back/neck problem."[6] Respondents reporting a limitation reported "Yes" when asked if limitation was caused by "Arthritis/rheumatism."[7] Respondents reporting a limitation reported "Yes" when asked if limitation was caused by "Heart problem."[8] Respondents reporting a limitation reported "Yes" when asked if limitation was caused by "Stroke."[9] Respondents reporting a limitation reported "Yes" when asked if limitation was caused by "Hypertension."[10] Respondents reporting a limitation reported "Yes" when asked if limitation was caused by "Other injury."Source: National Center for Health Statistics. National Health Interview Survey, 2005

The Burden of Musculoskeletal Diseases in the United States - Copyright © 2008 151
Musculoskeletal Injuries Chapter 6
Table 6.18: Lost Work Days Due to Major Health Conditions by Gender for PersonsAged 18 and Over, United States 2005
Work Days Lost [1] Work Days Lost [1]Persons
ReportingLost Work
Days(in 000s)
Mean WorkDays Lost
Total WorkDays Lost
(in 000s)
PersonsReportingLost Work
Days(in 000s)
Mean WorkDays Lost
Total WorkDays Lost
(in 000s)
All Causes [2] Other Major Health ConditionsHeart Problem [7]
Total Population 68,222 9.6 654,931 Total Population 501 46.4 23,246 Male 32,599 9.7 316,210 Male 240 52.6 12,624 Female 35,622 9.4 334,847 Female 260 40.6 10,556 18 to 44 Years 42,703 7.4 316,002 18 to 44 Years 109 33.0 3,597 45 to 64 Years 23,910 13.0 310,830 45 to 64 Years 302 61.4 18,543 65 Years & Over 1,609 15.4 24,779 65 Years & Over 90 12.3 1,107 Musculoskeletal ConditionsAll Musculoskeletal Injuries or Conditions [3] Stroke [8]Total Population 14,346 21.1 302,294 Total Population 91 42.1 3,831 Male 6,156 21.7 133,415 Male 42 63.4 2,663 Female 8,190 20.6 168,810 Female 48 23.3 1,118 18 to 44 Years 6,103 18.0 109,946 18 to 44 Years 17 6.0 102 45 to 64 Years 7,625 24.0 183,118 45 to 64 Years 63 46.1 2,904 65 Years & Over 616 15.1 9,330 65 Years & Over 10 80.8 808
Fracture/Bone/Joint Injury [4] Hypertension [9]Total Population 2,908 24.8 72,118 Total Population 510 37.1 18,921 Male 1,458 24.8 36,158 Male 254 47.7 12,116 Female 1,450 24.9 36,105 Female 256 26.5 6,784 18 to 44 Years 1,512 19.8 29,938 18 to 44 Years 111 21.9 2,431 45 to 64 Years 1,315 30.6 40,239 45 to 64 Years 380 42.5 16,150 65 Years & Over 81 25.7 2,082 65 Years & Over 19 17.1 325
Back/Neck Problem [5] Other Injury [10]Total Population 6,360 21.5 136,740 Total Population 830 48.7 40,421 Male 2,823 21.5 60,695 Male 452 56.1 25,357 Female 3,537 21.4 75,692 Female 378 39.8 15,044 18 to 44 Years 3,172 18.2 57,730 18 to 44 Years 409 39.8 16,278 45 to 64 Years 2,949 25.2 74,315 45 to 64 Years 417 57.8 24,103 65 Years & Over 238 18.1 4,308 65 Years & Over 4 4.0 16
Arthritis/Rheumatism [6]Total Population 5,078 18.4 93,435 [1] A missed work day is defined as absence from work due to illness or
injury in the past 12 months, excluding maternity or family leave. Male 1,875 19.5 36,563 Female 3,203 17.8 57,013 [2] Respondents reported "Yes" when asked "Are you limited in any way in
any activities because of physical, mental or emotional problems." ANDrespondents reporting a limitation reported "Yes" when asked if limitationwas caused by "arthritis/rheumatism, back/neck problem, fracture/bone/jointinjury, other injury, heart problem, stroke, hypertension."
18 to 44 Years 1,419 15.7 22,278 45 to 64 Years 3,361 20.4 68,564 65 Years & Over 297 9.9 2,940 [3] Respondents reporting a limitation reported 'Yes' when asked if limitation was caused by "Fracture/bone/joint injury Back/neck problemArthritis/Rheumatism"[4] Respondents reporting a limitation reported 'Yes' when asked if limitation was caused by "Fracture/bone/joint injury."[5] Respondents reporting a limitation reported 'Yes' when asked if limitation was caused by "Back/neck problem."[6] Respondents reporting a limitation reported 'Yes' when asked if limitation was caused by "Arthritis/rheumatism."[7] Respondents reporting a limitation reported 'Yes' when asked if limitation was caused by "Heart problem."[8] Respondents reporting a limitation reported 'Yes' when asked if limitation was caused by "Stroke."[9] Respondents reporting a limitation reported 'Yes' when asked if limitation was caused by "Hypertension."[10] Respondents reporting a limitation reported 'Yes' when asked if limitation was caused by "Other injury."Source: National Center for Health Statistics. National Health Interview Survey, 2005

The Burden of Musculoskeletal Diseases in the United States - Copyright © 2008
Chapter 6 Musculoskeletal Injuries
152
Table 6.19: Summary of Bed and LostWork Days Due to Health Problems forPersons Age 18 and Over, United States 2005
Cause of Bed/Lost Work Days [1]
Bed Days [2] Lost Work Days [3]
Total(in 000s)
% of Total
Total (in 000s)
% of Total
Musculoskeletal Injuryor Condition
725,697 72% 302,294 46%
Heart Problem 115,097 11% 23,246 4%Hypertension 95,794 10% 18,921 3%Stroke 43,512 4% 3,831 1%Other Injury 28,282 3% 40,421 6%Other Health Conditions 0% 266,218 41%
Musculoskeletal Injury or ConditionBack/Neck Pain 312,581 31% 136,740 21%Arthritis/Rheumatism 286,018 28% 93,435 14%Fracture/Bone/Joint Pain 126,921 13% 72,118 11%
All Causes 1,005,444 654,931
[1] Respondents reported "Yes" when asked "Are you limited in any wayin any activities because of physical, mental or emotional problems."[2] A bed day is defined as 1/2 or more days in bed due to injury or illnessin past 12 months, excluding hospitalization.[3] A missed work day is defined as absence from work due to illness orinjury in the past 12 months, excluding maternity or family leave. Source: National Center for Health Statistics. National Health InterviewSurvey, 2005
Table 6.20: Musculoskeletal Disorders(MSDs) for Work-Related Injuries andIllnesses Involving Days Away fromWork, United States 2000-2005
All Cases of Work-related Injuries and
Illnesses MSDs
% of Full-timeWorkers Away
From Work1992 2,331,098 784,145 33.6%1993 2,252,591 762,727 33.9%1994 2,236,639 755,594 33.8%1995 2,040,929 695,789 34.1%1996 1,880,525 647,355 34.4%1997 1,833,380 626,352 34.2%1998 1,730,534 592,544 34.2%1999 1,702,420 582,340 34.2%2000 1,664,018 577,814 34.7%2001 1,537,567 522,528 34.0%2002 1,436,194 487,915 34.0%2003 1,315,920 435,180 33.1%2004 1,259,320 402,700 32.0%2005 1,234,860 375,540 30.4%
Source 1998 to 2005: U.S. Department of Labor, Bureau of Labor Statistics:Case and Demographic Characteristics for Work-related Injuries andIllnesses Involving Days Away from Work. Supplemental Table 11:Number of nonfatal occupational injuries and illnesses involving daysaway from work by selected worker and case characteristics andmusculoskeletal disorders, All United States, private industry, 2000-2005.Available at:h�p://www.bls.gov/iif/oshcdnew.htm#Resource%20Table%20categories%20-%202005. Accessed July 27, 2007. Source 1992 to 1997: U.S. Department of Labor, Bureau of Labor Statistics:Worker Health Chartbook 2004. Available at:h�p://www2a.cdc.gov/niosh-Chartbook/imagedetail.asp?imgid=77.Accessed August 24, 2007.
Table 6.21: Musculoskeletal Disorders for Work-Related Injuries and IllnessesInvolving Days Away from Work by Nature of Injury, United States 2000-2005
2000 2001 2002 2003 2004 2005Nature of Injury [1] Number Percent Number Percent Number Percent Number Percent Number Percent Number PercentSprains, Strains 442,839 71.2% 399,722 76.5% 369,785 70.2% 331,020 72.1% 306,210 76.0% 287,970 72.4%Carpal Tunnel Syndrome 27,571 4.4% 26,522 5.1% 22,583 4.3% 22,110 4.8% 18,760 4.7% 16,440 4.1%Tendonitis 12,577 2.0% 12,131 2.3% 8,105 1.5% 6,740 1.5% 5,940 1.5% 5,040 1.3%Soreness, Pain 57,139 9.2% 22,346 4.3% 56,887 10.8% 45,580 9.9% 46,230 11.5% 41,930 10.5%Back Pain 31,685 5.1% 27,894 5.3% 30,953 5.9% 23,650 5.2% 23,770 5.9% 22,050 5.5%All Other (including MS systemand connective diseases anddisorders and hernia)
50,265 8.1% 33,913 6.5% 38,660 7.3% 29,740 6.5% 1,790 0.4% 24,170 6.1%
Total Cases 577,814 100.0% 522,528 100.0% 487,915 100.0% 435,180 100.0% 402,700 100.0% 375,540 100.0%
[1] Multiple injuries per case possible percentages based on total injuries, which may be > total cases.Source: U.S. Department of Labor, Bureau of Labor Statistics: Case and Demographic Characteristics for Work-related Injuries and Illnesses Involving DaysAway from Work. Supplemental Tables, Table 11: Number of nonfatal occupational injuries and illnesses involving days away from work by selected workerand case characteristics and musculoskeletal disorders, All United States, private industry, 2000-2005. Available at:h�p://www.bls.gov/iif/oshcdnew.htm#Resource%20Table%20categories%20-%202005. Accessed July 27, 2007.

The Burden of Musculoskeletal Diseases in the United States - Copyright © 2008 153
Musculoskeletal Injuries Chapter 6
Table 6.22: Trends in MSD InjuriesInvolving Days Away from Work inPrivate Industry by Sex, United States2000 to 2005
All MSD InjuriesMale Female Total
2000 Number 358,949 216,014 574,963
Percent 62.4% 37.6%
2001 Number 324,935 194,910 519,845
Percent 62.5% 37.5%
2002 Number 300,128 186,966 487,915
Percent 61.6% 38.4%
2003 Number 267,530 166,780 435,180
Percent 61.6%38.4%
2004 Number 254,220 147,750 402,700
Percent 63.2% 36.8%
2005 Number 238,630 136,340 375,540
Percent 63.5% 36.3%
Source: U.S. Department of Labor, Bureau of Labor Statistics: Case andDemographic Characteristics for Work-related Injuries and IllnessesInvolving Days Away from Work. Supplemental Tables 2005, Table 11:Number of nonfatal occupational injuries and illnesses involving daysaway from work by selected worker and case characteristics andmusculoskeletal disorders, all United States, private industry, 2000-2005.Available at:h�p://www.bls.gov/iif/oshcdnew.htm#Resource%20Table%20categories%20-%202005. Accessed July 27, 2007.
Table 6.23: Distribution of Nonfatal Injuryand Illness Cases Involving Days Awayfrom Work in Private Industry forMusculoskeletal Disorders by Sex, UnitedStates 2005
Nonfatal Injuries by Injury Type, 2005Male Female Total
All NonfatalInjuries andIllnesses
Number 814,250 415,880 1,234,680
Percent 65.9% 33.7%
All MSD Injuries Number 238,630 136,340 375,540
Percent 63.5% 36.3%
All Sprains, Strains& Tears [1]
Number 320,350 181,100 503,350
Percent 63.6% 36.0%
Carpal TunnelSyndrome
Number 5,890 10,560 16,460
Percent 35.8% 64.2%
Tendonitis Number 2,570 3,160 5,720
Percent 44.9% 55.2%
[1] Totals are greater than shown in Table 11 for MDS sprains & strains dueto inclusion of all sprains and strains.Source: U.S. Department of Labor, Bureau of Labor Statistics: Case andDemographic Characteristics for Work-related Injuries and IllnessesInvolving Days Away from Work. Supplemental Tables 2005, Table 9:Number of nonfatal occupational injuries and illnesses involving days awayfrom work by selected worker case characteristics and nature of injury orillness, All United States, private industry, 2000-2005. Available at:h�p://www.bls.gov/iif/oshcdnew.htm#Resource%20Table%20categories%20-%202005. Accessed July 27, 2007.
Table 6.24: Musculoskeletal Disorders (MSDs) for Work-Related Injuries and IllnessesInvolving Days Away from Work by Race, United States 2005
Race or Ethnicity [2] Nonfatal Injuries and Illnesses [1] MSDs
Sprains, Strains &Tears
Carpal TunnelSyndrome Tendonitis
Number Percent Number Percent Number Percent Number Percent Number PercentWhite 567,790 66.2% 175,600 70.0% 229,560 68.5% 9650 79.0% 2660 66.0%Black/African American 163,440 19.0% 37,630 15.0% 41,810 12.5% 1000 8.2% 370 9.2%Hispanic or Latino 101,170 11.8% 29,950 11.9% 53,870 16.1% 1190 9.7% 750 18.6%Other 25,870 3.0% 7,680 3.1% 9,840 2.9% 370 3.0% 250 6.2%Total 858,270 100% 250,860 100% 335,080 100% 12,210 100% 4,030 100%Not Reported 376,550 124,660 168,450 4260 1670
[1] Nonfatal injuries and illnesses include the total of all nonfatal injuries and illnesses involving days away from work
[2] Percentages based on number of cases for which race is reported.
Source: U.S. Department of Labor, Bureau of Labor Statistics: Case and Demographic Characteristics for Work-related Injuries and Illnesses Involving DaysAway from Work. Supplemental Tables 2005, Table 9: Number of nonfatal occupational injuries and illnesses involving days away from work by selectedworker case characteristics and nature of injury or illness, All United States, private industry, 2005 and Table 11: Number of nonfatal occupational injuriesand illnesses involving days away from work by selected worker and case characteristics and musculoskeletal disorders, All United States, private industry,2005. Available at: h�p://www.bls.gov/iif/oshcdnew.htm#Resource%20Table%20categories%20-%202005. July 27, 2007.

The Burden of Musculoskeletal Diseases in the United States - Copyright © 2008
Chapter 6 Musculoskeletal Injuries
154
Table 6.25: Musculoskeletal Disorders (MSDs) for Work-Related Injuries and IllnessesInvolving Days Away from Work by Age, United States 2005
Nonfatal Injuries and Illnesses MSDs
Sprains, Strains &Tears
Carpal TunnelSyndrome Tendonitis
Number Percent Number Percent Number Percent Number Percent Number PercentUnder 14 Years * * * * * * * * * *14 to 15 90 0.0% * * * * * * * *16 to 19 41,530 3.4% 7,940 2.1% 12,510 2.5% 40 0.2% 40 0.7%20 to 24 133,760 10.9% 33,560 9.0% 47,900 9.6% 340 2.1% 500 8.8%25 to 34 290,500 23.8% 89,070 23.9% 121,430 24.3% 2,710 16.5% 1,350 23.8%35 to 44 311,880 25.5% 106,480 28.6% 138,500 27.7% 4,580 27.9% 1,860 32.7%45 to 54 282,310 23.1% 92,830 24.9% 118,470 23.7% 6,200 37.8% 1,410 24.8%55 to 64 135,290 11.1% 37,330 10.0% 52,070 10.4% 2,410 14.7% 490 8.6%65 Years & Older 27,050 2.2% 5,380 1.4% 8,350 1.7% 120 0.7% 30 0.5%
Total 1,234,680 375,540 503,530 16,460 5,720
* Data does not meet publication guidelines
Source: U.S. Department of Labor, Bureau of Labor Statistics: Case and Demographic Characteristics for Work-related Injuries and Illnesses Involving DaysAway from Work. Supplemental Tables 2005, Table 9: Number of nonfatal occupational injuries and illnesses involving days away from work by selectedworker case characteristics and nature of injury or illness, all United States, private industry, 2005 and Table 11: Number of nonfatal occupational injuries andillnesses involving days away from work by selected worker and case characteristics and musculoskeletal disorders, all United States, private industry, 2005.Available at: h�p://www.bls.gov/iif/oshcdnew.htm#Resource%20Table%20categories%20-%202005. Accessed July 27, 2007.

The Burden of Musculoskeletal Diseases in the United States - Copyright © 2008 155
Musculoskeletal Injuries Chapter 6
Table 6.26: Musculoskeletal Disorders (MSDs) for Work-Related Injuries and IllnessesInvolving Days Away from Work by Body Part Affected, United States 2005
Body Part Affected All NaturesMusculoskeletal
DisordersSprains, Strains
& TearsCarpal Tunnel
Syndrome Tendonitis
Number Percent Number Percent Number Percent Number Percent Number Percent
Head (total) 81,090 6.6% 50 0.0% 160 0.0% 0.0% 0.0%
Head (except eye) [1] 46,350 3.8% 30 0.0% 70 0.0% - 0.0% - 0.0%
Eye 34,740 2.8% 20 0.0% 90 0.0% 0.0% 0.0%
Neck 18,470 1.5% 6,440 1.7% 13,730 2.7% 0.0% 0.0%
Trunk (total) 428,500 34.7% 269,020 71.6% 290,330 57.7% 0.0% 980 17.2%
Trunk (except shoulder and back) [1] 79,810 6.5% 38,670 10.3% 23,530 4.7% - 0.0% 30 0.5%
Shoulder 77,800 6.3% 45,910 12.2% 54,260 10.8% 0.0% 950 16.6%
Back 270,890 21.9% 184,440 49.1% 212,540 42.2% 0.0% 0.0%
Upper Extremities (total) 284,750 23.1% 55,450 14.8% 43,410 8.6% 16,460 100.0% 4,250 74.4%Upper Extremities (except wrist, hand & finger) [1] 70,390 5.7% 19,650 5.2% 18,480 3.7% - 0.0% 1,860 32.6%
Wrist 56,250 4.6% 29,350 7.8% 15,880 3.2% 16,460 100.0% 1,820 31.9%
Hand (except finger) 47,020 3.8% 3,020 0.8% 3,470 0.7% 0.0% 280 4.9%
Finger 111,090 9.0% 3,430 0.9% 5,580 1.1% 0.0% 290 5.1%
Lower Extremities (total) 271,740 22.0% 29,390 7.8% 119,810 23.8% 0.0% 310 5.4%Lower Extremities (except knee, foot & toe) [1] 127,340 10.3% 8,870 2.4% 55,020 10.9% - 0.0% 90 1.6%
Knee 100,560 8.1% 19,170 5.1% 58,310 11.6% 0.0% 130 2.3%
Foot, Toe 43,840 3.6% 1,350 0.4% 6,480 1.3% 0.0% 90 1.6%
Body Systems 17,950 1.5% - 0.0% - 0.0% 0.0% 0.0%
Multiple Parts 120,960 9.8% 14,710 3.9% 35,090 7.0% 0.0% 150 2.6%
All Other [1] 11,220 0.9% 480 0.1% 1,000 0.2% 0.0% 20 0.4%
Total Cases 1,234,680 375,540 503,530 16,460 5,720
[1] Computed value
Source: U.S. Department of Labor, Bureau of Labor Statistics: Case and Demographic Characteristics for Work-related Injuries and Illnesses Involving DaysAway from Work. Supplemental Tables 2005, Table 9: Number of nonfatal occupational injuries and illnesses involving days away from work by selectedworker case characteristics and nature of injury or illness, all United States, private industry, 2005 and Table 11: Number of nonfatal occupational injuries andillnesses involving days away from work by selected worker and case characteristics and musculoskeletal disorders, all United States, private industry, 2005.Available at: h�p://www.bls.gov/iif/oshcdnew.htm#Resource%20Table%20categories%20-%20200. Accessed July 27, 2007.

The Burden of Musculoskeletal Diseases in the United States - Copyright © 2008
Chapter 6 Musculoskeletal Injuries
156
Table 6.27: Incidence Rates per 10,000 Full-time Workers for Injuries and Illnesses byNature of Injury or Illness for Nonfatal Occupational Injuries Involving Days Awayfrom Work, United States 1996-2005
Rate per 10,000 Full-Time WorkersIncidence
RateChange
1996-20051996 1997 1998 1999 2000 2001 2002 2003 2004 2005Sprains, Strains 97.6 92.5 85.6 81.8 79.2 73.7 69.9 64.3 59.0 55.3 -43.3%Bruises, Contusions 20.8 19.2 17.3 17.3 16.5 15.0 14.4 13.5 12.9 11.8 -43.3%Cuts, Lacerations, Punctures 15.8 15.5 15.5 14.6 13.2 12.6 12.5 11.0 11.1 11.2 -29.1%Fractures 14.3 13.8 13.0 12.6 12.7 11.9 11.2 10.8 10.6 10.5 -26.6%Heat Burns 3.5 3.5 3.2 3.0 2.6 2.8 2.4 2.2 2.1 1.9 -45.7%Carpal Tunnel Syndrome 3.6 3.4 3.0 3.1 3.0 3.0 2.6 2.5 2.1 1.8 -50.0%Tendonitis 2.1 2.1 1.9 1.8 1.6 1.6 1.1 0.9 0.8 0.6 -71.4%Chemical Burns 1.4 1.4 1.3 1.3 1.0 1.0 <1.0 0.9 0.8 0.7 -50.0%Amputations 1.2 1.3 1.2 1.1 1.1 1.0 1.0 0.9 0.9 0.9 -25.0%Multiple Traumatic Injuries 7.2 6.9 6.5 6.6 6.5 5.9 5.9 5.5 5.7 5.5 -23.6%MSD Injuries All Cases 223.8 212.3 195.0 188.3 181.1 169.1 162.6 150.0 141.3 135.7 -39.4%Source: U.S. Department of Labor, Bureau of Labor Statistics: Survey of Occupational Injuries and Illnesses. Table 6 (1996-2002) or 7 (2003-2005): Incidencerates for nonfatal occupational injuries and illnesses involving days away from work per 10,000 full-time workers for selected characteristics and majorindustry sector: Nature of injury or illness. Lost work time.pdf:1995-2005. Available at: www.bls.gov/iif/oshcdnew.htm. Accessed July 7, 2007.
Table 6.28: Incidence Rates for Injuries and Illnesses by Industry for NonfatalOccupational Injuries Involving Days Away from Work by Body Part Affected, United States 2005
Goods Producing Service Providing
TotalPrivate
IndustryTotal
Goods
NaturalResources
andMining
Con-struction
Manu-facturing
TotalService
Trade,Transport
andUtilities
Infor-mation
FinancialActivities
Educationand
HealthServices
Leisureand
Hospi-tality
OtherServices
Head (total) 8.9 14.0 16.1 19.6 11.3 7.2 11 3.6 4.1 6.8 5.6 8.1
Eye 3.8 7.7 7.7 9.7 6.8 2.6 3.9 1.2 1.6 2.0 1.0 4.4
Neck 2.0 2.2 2.0 3.6 1.6 2.0 2.8 1.4 1.0 2.8 0.8 1.1
Trunk (total) 47.1 56.3 57.4 73.8 48.1 44.1 64.5 23.5 15.2 61.2 32.2 28.3
Shoulder 8.6 11.1 10.8 12.2 10.7 7.7 12.3 4.1 2.1 9.4 5.8 4.3
Back 29.8 33.0 30.9 46.0 27.2 28.7 39.9 15.4 10.1 43.7 20.6 18.2
Upper Extremities (total) 31.3 50.3 42.0 57.3 47.9 25.1 33.7 15.4 10.5 22.7 35.3 27.0
Wrist 6.2 8.4 5.4 7.8 8.9 5.5 7.1 4.6 3.6 6.2 4.7 6.1
Hand (except finger) 5.2 8.5 5.6 10.9 7.7 4.1 5.2 1.9 1.3 3.2 7.3 5.2
Finger 12.2 22.3 21.3 24.0 21.6 8.9 12.2 3.7 3.1 6.1 15.6 10.3
Lower Extremities (total) 29.9 37.6 45.4 59.8 26.6 27.4 41.2 18.1 11.9 27.9 23.1 21.4
Knee 11.1 12.7 15.7 19.3 9.4 10.5 15.5 6.5 4.7 12.0 9.1 7.7
Foot (except toe) 4.8 7.0 6.2 10.7 5.3 4.1 6.9 3.4 1.7 3.4 3.0 3.2
Toe 1.4 1.8 1.7 2.4 1.5 1.3 2.2 0.8 0.4 1.0 0.8 1.5
Body Systems 2.0 2.1 3.5 2.5 1.8 1.9 1.7 2.1 2.4 2.5 1.8 1.6
Multiple Parts 13.3 13.0 16.4 20.9 9.1 13.4 16.4 10.1 7.2 20.6 9.7 9.1
Rate All Cases 135.7 176.9 184.5 239.5 147.1 121.1 171.3 74.2 52.3 144.5 108.5 96.6
Source: U.S. Department of Labor, Bureau of Labor Statistics: Survey of Occupational Injuries and Illnesses. Table 7: Incidence rates for nonfatal occupationalinjuries and illnesses involving days away from work per 10,000 full-time workers for selected characteristics and major industry sector: Part of body affectedby the injury or illness. Lost work time:1995-2005. Available at: www.bls.gov/iif/oshcdnew.htm. Accessed July 7, 2007.

The Burden of Musculoskeletal Diseases in the United States - Copyright © 2008 157
Musculoskeletal Injuries Chapter 6
Table 6.29: Musculoskeletal Disorders (MSDs) for Work-Related Injuries and IllnessesInvolving Days Away from Work by Occupation, United States 2005
Industry All Natures MSDsSprains, Strains
and TearsCarpal Tunnel
Syndrome TendonitisNumber Percent Number Percent Number Percent Number Percent Number Percent
Management, Business, Financial 28,110 2.3% 6,360 1.7% 8,780 1.7% 1,250 7.6% 70 1.2%Professional and Related 83,060 6.7% 28,210 7.5% 40,310 8.0% 1,150 7.0% 540 9.4%Service 247,270 20.0% 77,390 20.6% 107,470 21.4% 1,440 8.7% 680 11.9%Sales and Related 80,020 6.5% 24,770 6.6% 36,030 7.2% 940 5.7% 420 7.3%Office and Administrative Support 91,400 7.4% 31,010 8.3% 37,800 7.5% 3,430 20.8% 750 13.1%Farming, Fishing, and Forestry 15,540 1.3% 2,380 0.6% 4,790 1.0% 50 0.3% 40 0.7%Construction and Extractive 152,490 12.4% 36,330 9.7% 53,170 10.6% 840 5.1% 630 11.0%Installation, Maintenance andRepair 107,770 8.7% 31,120 8.3% 40,840 8.1% 1,120 6.8% 410 7.2%Production 173,440 14.1% 57,390 15.3% 60,100 11.9% 4,790 29.1% 1,580 27.6%Transportation and MaterialMoving 253,570 20.6% 80,480 21.4% 113,910 22.6% 1,450 8.8% 600 10.5%
Total 1,234,680 100.0% 1,234,680 100.0% 503,530 100.0% 16,460 100.0% 5,720 100.0%
Source: U.S. Department of Labor, Bureau of Labor Statistics: Case and Demographic Characteristics for Work-Related Injuries and Illnesses Involving DaysAway from Work. Supplemental Tables 2005, Table 9: Number of nonfatal occupational injuries and illnesses involving days away from work by selectedworker case characteristics and nature of injury or illness, all United States, private industry, 2005 and Table 11: Number of nonfatal occupational injuriesand illnesses involving days away from work by selected worker and case characteristics and musculoskeletal disorders, all United States, private industry,2005. Available at: h�p://www.bls.gov/iif/oshcdnew.htm#Resource%20Table%20categories%20-%202005. Accessed July 27, 2007.
Table 6.30: Median Days Away from Work for Nonfatal Injuries and Illnesses by Natureof Injury or Illnesses, United States 1996-2005
Median Days Away from Work1996 1997 1998 1999 2000 2001 2002 2003 2004 2005
Sprains, Strains (MSD & Other) 6 6 6 6 6 6 7 8 8 8 Bruises, Contusions 3 3 3 3 3 3 4 4 4 4 Cuts, Lacerations, Punctures 3 3 3 3 3 3 3 4 4 4 Fractures 17 21 19 20 20 21 29 30 28 27 Heat Burns 25 4 4 4 4 5 4 5 5 5 Carpal Tunnel Syndrome (MSD & Other) 4 25 24 27 27 25 30 32 28 27 Tendonitis (MSD & Other) 9 11 10 9 10 10 15 11 13 12 Chemical Burns 2 2 2 3 2 2 2 2 3 3 Amputations 20 18 18 18 18 18 26 30 25 22 Multiple Traumatic Injuries 8 7 7 7 8 8 9 9 9 8
Musculoskeletal Disorders * * 7 7 7 8 9 10 10 9
Total All Cases 8 5 5 6 6 6 7 8 7 7
Total Cases (in 000s)
Musculoskeletal Disorder Cases * * 592.5 582.3 577.8 522.5 487.9 435.2 402.7 375.5 All Cases 1,880.5 1,833.3 1,730.5 1,702.5 1,664.0 1,537.6 1,436.2 1,315.9 1,259.3 1,234.7
* Data not availableSource: U.S. Department of Labor, Bureau of Labor Statistics, Survey of Occupational Injuries and Illnesses. Table 9 (1996-2002) or 11 (2003-2005): Percentdistribution of nonfatal occupational injuries and illnesses involving days away from work by selected injury or illness characteristics and number of daysaway from work: Nature of injury or illness. Lost work time:1996-2005. Available at: www.bls.gov/iif/oshcdnew.htm. Accessed July 7, 2007.

The Burden of Musculoskeletal Diseases in the United States - Copyright © 2008
Chapter 6 Musculoskeletal Injuries
158
Table 6.31: Median Days Away from Work for Nonfatal Injuries and Illnesses by Part ofBody Affected, United States 1996-2005
1996 1997 1998 1999 2000 2001 2002 2003 2004 2005Head (total) 2 2 2 2 2 2 2 2 2 2
Eye 2 2 2 2 2 2 2 2 2 2Neck 5 5 4 6 5 5 7 8 6 7Trunk (total) 6 7 6 7 7 7 8 9 9 8
Shoulder 8 9 9 10 10 12 15 18 17 15Back 6 6 6 6 6 6 7 7 7 7
Upper Extremities (total) 6 6 5 6 5 6 7 7 7 7Wrist 12 12 11 12 12 13 15 17 14 14Hand (except finger) 4 5 4 5 4 4 5 5 5 5Finger 4 5 4 4 4 5 5 5 5 5
Lower Extremities (total) 6 6 6 7 7 7 9 9 9 9Knee 9 9 10 10 10 11 14 14 15 12Foot (except toe) 5 5 5 5 5 6 7 7 6 7Toe 4 5 4 5 5 5 6 6 6 5
Body Systems 3 4 3 3 3 4 4 4 5 7Multiple Parts 7 8 8 8 8 8 10 10 10 8Total All Cases 5 5 5 6 6 6 7 8 7 7
Total Cases (in 000s) 1,880.5 1,833.4 1,730.5 1,702.5 1,664.0 1,537.6 1,436.2 1,315.9 1,259.3 1,234.7
Source: U.S. Department of Labor, Bureau of Labor Statistics, Survey of Occupational Injuries and Illnesses. Table 11: Percent distribution of nonfataloccupational injuries and illnesses involving days away from work by selected injury or illness characteristics and number of days away from work: Part ofbody affected by the injury or illness. Lost work time:1996-2005. Web: www.bls.gov/iif/oshcdnew.htm. Accessed July 7, 2007

The Burden of Musculoskeletal Diseases in the United States - Copyright © 2008 159
Musculoskeletal Injuries Chapter 6
Table 6.32: Resource Utilization for Traumatic Musculoskeletal (MS) Injuries byTreatment Location and Sex, United States 2004
Total Visits (in 000s) [1] % Total Diagnoses by Treatment Location
Physician Office
Visits [2]
EmergencyRoom
Visits [3]
Hospital Outpatient
Visits [4]Inpatient Stays [5]
Total All
Treatment Sites
% AllDiagnoses
for AllTreatmentLocations
Physician Office
Visits [2]
EmergencyRoom
Visits [3]
Hospital Outpatient
Visits [4]Inpatient Stays [5]
Fractures
All Fractures 9,129 4,065 991 1,103 15,288 24.8% 60% 27% 6% 7%
Males 4,554 2,079 565 477 7,675 25.4% 59% 27% 7% 6%
Females 4,575 1,986 426 617 7,604 24.0% 60% 26% 6% 8%
Dislocations
All Dislocations 4,362 536 196 50 5,144 8.3% 85% 10% 4% 1%
Males 2,112 299 100 29 2,540 8.4% 83% 12% 4% 1%
Females 2,450 237 96 21 2,804 8.9% 87% 8% 3% 1%
Sprains and StrainsAll Sprains and Strains 10,981 4,256 948 98 16,283 26.4% 67% 26% 6% 1%
Males 5,072 2,024 387 49 7,532 24.9% 67% 27% 5% 1%
Females 5,909 2,222 560 48 8,739 27.6% 68% 25% 6% 1%
Contusions
All Contusions 3,319 4,540 330 182 8,371 13.6% 40% 54% 4% 2%
Males 1,498 2,122 135 77 3,832 12.7% 39% 55% 4% 2%
Females 1,821 2,418 196 105 4,540 14.3% 40% 53% 4% 2%
Open Wounds
All Open Wounds 4,887 4,643 579 225 10,334 16.7% 47% 45% 6% 2%
Males 2,502 2,956 377 144 5,979 19.8% 42% 49% 6% 2%
Females 2,385 1,687 202 80 4,354 13.7% 55% 39% 5% 2%
Other Musculoskeletal Injuries
All Other MS Injuries 4,225 1,403 502 153 6,283 10.2% 67% 22% 8% 2%
Males 1,620 698 252 84 2,654 8.8% 61% 26% 9% 3%
Females 2,605 705 250 68 3,628 11.5% 72% 19% 7% 2%
Total Musculoskeletal Traumatic Injuries
All MS Traumatic Injuries 34,372 17,888 3,380 1,610 57,250 60% 31% 6% 3%
Males 16,177 9,382 1,747 739 28,045 49.0% 58% 33% 6% 3%
Females 18,195 8,506 1,632 860 29,193 51.0% 62% 29% 6% 3%
All Injury TreatmentEpisodes 54,168 30,770 5,192 5,161 95,291 57% 32% 5% 5%
[1] All listed diagnoses for inpatients discharged from short-stay hospitals. Multiple diagnoses per case possible percentages based on total diagnoses.
[2] Source: National Center for Health Statistics, National Ambulatory Medical Care Survey, 2004
[3] Source: National Center for Health Statistics, National Hospital Ambulatory Medical Care Survey, Emergency Room Visits, 2004
[4] Source: National Center for Health Statistics, National Hospital Ambulatory Medical Visits, Outpatient Department Visits, 2004
[5]Source: Agency for Healthcare Research and Quality, Healthcare Cost and Utilization Project, Nationwide Inpatient Sample, 2004

The Burden of Musculoskeletal Diseases in the United States - Copyright © 2008
Chapter 6 Musculoskeletal Injuries
160
Table 6.33: Resource Utilization for Traumatic Musculoskeletal (MS) Injuries byTreatment Location and Age, United States 2004
Total Visits (in 000s) [1] % Total Visits at Treatment Location
Physician Office
Visits [2]
EmergencyRoom
Visits [3]
Hospital Outpatient
Visits [4]Inpatient Stays [5]
Total All
Treatment Sites
% AllDiagnoses
for AllTreatment
Physician Office
Visits [2]
EmergencyRoom
Visits [3]
Hospital Outpatient
Visits [4]Inpatient Stays [5]
FracturesAll Fractures 9,129 4,065 991 1,103 15,288 #REF!Under 18 Years 2,507 1,286 429 84 4,306 28% 27% 32% 43% 8%18 to 44 Years 2,048 1,269 279 229 3,825 25% 22% 31% 28% 21%45 to 64 Years 2,233 716 188 219 3,356 22% 24% 18% 19% 20%65 Years & Over 2,342 794 96 568 3,800 25% 26% 20% 10% 51%
DislocationsAll Dislocations 4,362 536 196 50 5,144 #REF!Under 18 Years 382 177 89 4 652 13% 9% 33% 45% 8%18 to 44 Years 1,285 223 69 19 1,596 31% 29% 42% 35% 38%45 to 64 Years 1,626 85 23 13 1,747 34% 37% 16% 12% 26%65 Years & Over 769 51 15 13 848 16% 18% 10% 8% 26%
Sprains and StrainsAll Sprains and Strains 10,981 4,256 948 98 16,283 #REF!Under 18 Years 2,186 1,013 274 4 3,477 21% 20% 24% 29% 4%18 to 44 Years 4,204 2,174 403 29 6,810 42% 38% 51% 43% 30%45 to 64 Years 3,335 807 223 28 4,393 27% 30% 19% 24% 29%65 Years & Over 1,256 252 48 37 1,593 10% 11% 6% 5% 38%
ContusionsAll Contusions 3,319 4,540 330 182 8,371 #REF!Under 18 Years 666 1,151 159 11 1,987 24% 20% 25% 48% 6%18 to 44 Years 568 2,096 97 40 2,801 33% 17% 46% 29% 22%45 to 64 Years 826 773 49 37 1,685 20% 25% 17% 15% 20%65 Years & Over 1,259 520 25 94 1,898 23% 38% 11% 8% 52%
Open WoundsAll Open Wounds 4,887 4,643 579 225 10,334 #REF!Under 18 Years 1,022 1,314 138 24 2,498 24% 21% 28% 24% 11%18 to 44 Years 1,593 2,056 266 111 4,026 39% 33% 44% 46% 49%45 to 64 Years 1,356 848 132 46 2,382 23% 28% 18% 23% 20%65 Years & Over 916 425 44 44 1,429 14% 19% 9% 8% 20%
Other Musculoskeletal InjuriesAll Other MS Injuries 4,225 1,403 502 153 6,283 Under 18 Years 817 404 106 13 1,340 21% 19% 29% 21% 8%18 to 44 Years 1,365 661 189 53 2,268 36% 32% 47% 38% 35%45 to 64 Years 1,667 239 122 39 2,067 33% 39% 17% 24% 25%65 Years & Over 376 98 85 48 607 10% 9% 7% 17% 31%
Total Musculoskeletal Traumatic InjuriesAll MS traumatic injuries 34,372 17,888 3,380 1,610 57,250 6170300%Under 18 Years 7,241 4,994 1,143 124 13,502 24% 21% 28% 34% 8%18 to 44 Years 10,327 7,769 1,143 394 19,633 34% 30% 43% 34% 24%45 to 64 Years 10,246 3,133 706 337 14,422 25% 30% 18% 21% 21%65 Years & Over 6,558 1,993 312 752 9,615 17% 19% 11% 9% 47%
All Injury TreatmentEpisodes 54,168 30,770 5,192 5,161 95,291
Under 18 Years 11,415 9,131 1,702 361 22,609 24% 21% 30% 33% 7%18 to 44 Years 16,855 13,013 1,892 1,180 32,940 35% 31% 42% 36% 23%45 to 64 Years 15,184 5,307 1,061 1,384 22,936 24% 28% 17% 20% 27%65 Years & Over 10,714 3,319 537 2,236 16,806 18% 20% 11% 10% 43%
[2] Source: National Center for Health Statistics, National Ambulatory Medical Care Survey, 2004[3] Source: National Center for Health Statistics, National Hospital Ambulatory Medical Care Survey, Emergency Room Visits, 2004[4] Source: National Center for Health Statistics, National Hospital Ambulatory Medical Visits, Outpatient Department Visits, 2004[5]Source: Agency for Healthcare Research and Quality, Healthcare Cost and Utilization Project, Nationwide Inpatient Sample, 2004

The Burden of Musculoskeletal Diseases in the United States - Copyright © 2008 161
Musculoskeletal Injuries Chapter 6
Table 6.34: Percent Resource Utilization for Traumatic Musculoskeletal (MS)Injuries by Treatment Location for All Injury Diagnoses versus Primary (1st)Diagnosis, United States 2004
Percent of All Injury Diagnoses that are Primary (1st) Diagnosis
Physician Office
Visits [1]
EmergencyRoom
Visits [2]
Hospital Outpatient
Visits [3]Inpatient
Stays [4]
TotalAll Treatment
Sites
Fractures 90% 86% 91% 77% 88%
Dislocations 72% 84% 67% 28% 73%
Sprains and Strains 34% 81% 86% 38% 49%
Contusions 57% 71% 77% 18% 65%
Open Wounds 87% 89% 90% 28% 87%
All Other MS Injuries 62% 81% 82% 32% 67%
Total All MS Traumatic Injuries 84% 89% 90% 65% 85%
[1] Source: National Center for Health Statistics, National Ambulatory Medical Care Survey, 2004
[2] Source: National Center for Health Statistics, National Hospital Ambulatory Medical Care Survey, Emergency Room Visits, 2004
[3] Source: National Center for Health Statistics, National Hospital Ambulatory Medical Visits, Outpatient Department Visits, 2004
[4] Source: Agency for Healthcare Research and Quality, Healthcare Cost and Utilization Project, Nationwide Inpatient Sample, 2004

The Burden of Musculoskeletal Diseases in the United States - Copyright © 2008
Chapter 6 Musculoskeletal Injuries
162
Table 6.35 : Patient Days and Estimated Total Cost for Hospital Care for TraumaticMusculoskeletal (MS) Injury Patients, United States 2004
Hospital Stay Hospital Cost
TotalPatients
(in 000s) [1]
Mean Length of Stay(in days)
Total Patient
Days (in 000s)
% of Total
Patient Days [2]
MeanCharge per
Patient [3]
EstimatedTotal Cost
(in billions) [3]% of Total
Cost [2]Fractures
Fracture of Upper Limb 160 3.1 496 10.1% $20,080 $3.213 12.1%Fracture of Lower Limb 584 5.6 3,270 66.4% $30,260 $17.672 66.3%Fracture of Trunk and Multiple Sites 101 5.6 566 11.5% $25,330 $2.558 9.6%All Fractures 845 5.1 4,310 87.5% $27,740 $23.440 88.0%
Derangement InjuriesDerangement of Knee 8 1.8 14 0.3% $16,110 $0.129 0.5%Other Joint Derangement 16 2.6 42 0.8% $17,470 $0.280 1.0%All Derangement Injuries 24 2.4 58 1.2% $17,010 $0.408 1.5%
Dislocation InjuriesDislocations of Upper Limb 4 2.2 9 0.2% $14,420 $0.058 0.2%Dislocations of Lower Limb 9 3.2 29 0.6% $18,880 $0.170 0.6%All Dislocation Injuries 14 2.9 41 0.8% $17,310 $ 0.242 0.9%
Sprain and Strain InjuriesSprains of Upper Limb 16 1.9 30 0.6% $16,140 $0.258 1.0%Sprains of Lower Limb 19 3.0 57 1.2% $14,010 $0.266 1.0%All Sprains and Strain Injuries 37 2.5 93 1.9% $14,560 $0.539 2.0%
Other Musculoskeletal InjuriesContusions 32 3.3 106 2.1% $11,870 $0.380 1.4%Crushing Injuries 6 6.9 41 0.8% $44,230 $0.265 1.0%Open Wounds 64 3.2 205 4.2% $14,930 $0.956 3.6%Traumatic Amputation 10 4.7 47 1.0% $28,600 $0.286 1.1%Late Effects/Consequences of Traumatic
Injuries 9 2.9 26 0.5% $15,060 $0.136 0.5%All Other MS Injuries 121 3.5 424 8.6% $16,690 $2.019 7.6%
Total All MS traumatic Injuries 1,041 4.7 4,893 100.0% $25,600 $26.650 100.0%
[1] First listed diagnoses for inpatients discharged from short-stay hospitals[2] Due to rounding, totals may not equal sum of the individual components[3] Rounded to nearest tenSource: Agency for Healthcare Research and Quality, Healthcare Cost and Utilization Project, Nationwide Inpatient Sample, 2004
Table 6.36: Number and Percent of Population with Musculoskeletal Injuries andDistribution of Persons with Such Conditions by Age, United States 1996-2004
Total Population (in millions)
Persons with MS Injury Age Distribution of Persons with MS Injuries
Year# Individuals(in millions)
% TotalPopulation < 18 18-44 45-64 65 & Over
1996-1998 271.2 23.4 8.6% 24.2% 43.4% 19.4% 13.0%1997-1999 273.7 22.5 8.2% 24.8% 41.8% 20.0% 13.3%1998-2000 276.1 21.6 7.8% 24.5% 41.8% 21.0% 12.7%1999-2001 279.7 21.4 7.7% 23.0% 41.8% 22.4% 12.8%2000-2002 283.6 22.3 7.9% 21.4% 41.8% 23.4% 13.4%2001-2003 287.7 23.6 8.2% 21.0% 41.1% 24.1% 13.8%2002-2004 290.8 24.7 8.5% 21.2% 40.2% 24.6% 14.0%
Source: Agency for Healthcare Research and Quality: Medical Expenditures Panel Survey (MEPS) 1996-2004.

Chapter 7
Congenital and Infantile DevelopmentalConditions of the Musculoskeletal System
The Burden of Musculoskeletal Diseases in the United States - Copyright © 2008 163
Congenital and infantile developmentalconditions of the musculoskeletal system includea variety of defects and range from clinicallyminor anomalies, such as extra fingers or toes, tomore serious and disabling conditions, such asspina bifida. This chapter focuses onmusculoskeletal conditions among infants forwhich population-based surveillance data areavailable. Although the overall birth prevalenceof these conditions is relatively low incomparison to other types of musculoskeletalconditions, due to the seriousness of some ofthese conditions (e.g., spina bifida, limbdeficiencies, skeletal dysplasias, and cerebralpalsy), they place a lifetime burden on patients,their families, and the medical community.Further surveillance and research efforts areneeded: (1) to gain a better understanding of themagnitude of the public health impact of theseconditions, including morbidity, mortality, andhealth services needs, and of possible disparitiesin prevalence and outcomes by race/ethnicity,socioeconomic status, and geography; (2) toidentify possible causes and factors that mayinfluence health status, development, and level offunctioning; and (3) to develop and evaluatepotential interventions for prevention.
The primary data sources available on congenitaland developmental conditions are the NationalBirth Defects Prevention Network (NBDPN),from which estimates of prevalence for selecteddefects are drawn based on state birth defectssurveillance programs; the Centers for DiseaseControl and Prevention (CDC) MetropolitanAtlanta Congenital Defects Program (MACDP),
which collects data on birth defects; and the CDCMetropolitan Atlanta Developmental DisabilitiesSurveillance Program (MADDSP), whichmonitors the occurrence of selected develop-mental disabilities in school-age children. Datawere analyzed and prepared by the Division ofBirth Defects and Developmental Disabilities,Centers for Disease Control and Prevention,Atlanta, Georgia.
Section 7.1: Prevalence of Congenitaland Infantile DevelopmentalConditions of the MusculoskeletalSystem
Estimated prevalence of selected musculoskeletalconditions at birth using a 95% confidenceinterval ranges from a low of 1.2 cases per 10,000births for skeletal dysplasias to 15.5 cases per10,000 births for polydactyly. (Table 7.1 andGraph 7.1.1) For the few conditions reported byboth the national NBDPN and Atlanta basedMACDP studies, prevalence is slightly higher inthe NBDPN study than found in the MACDP.
Utilizing data from the NBDPN or MACDP andthe average number of births in the United Statesof 4.05 million for the years 1999 to 2003, theestimated number of infants born each year witha congenital musculoskeletal or developmentalcondition is greater than 17,000 identified for theconditions presented. (Table 7.2) During this timeperiod, there were between 1,030 and 1,500 birthswith spina bifida without anencephalus, 2,300and 2,500 with development dysplasia of the hip(DDH), 4,100 with clubfoot without neural tube

defect (NTD), 1,900 with limb deficiencies, 600with skeletal dysplasias, and 5,600 withpolydactyly each year. (Graph 7.1.2)
Congenital musculoskeletal defects show somevariation by race and ethnicity. (Table 7.3) Based
on NBDPN data, the prevalence of spinabifida without anencephalus was highestamong Hispanics/Latinos (4.3 per 10,000total births) and lowest among births of“Other” race or ethnicity (3.2 per 10,000).The prevalence of developmentaldysplasia of the hip, or developmentalhip dislocation, was highest amongwhites (7.5 per 10,000) and lowest amongblacks/ African Americans (3.0 per10,000).
Based on MACDP data, the prevalenceof spina bifida without anencephaluswas also highest amongHispanics/Latinos (5.2 per 10,000 totalbirths) and lowest among Others (0.7 per10,000). (Table 7.4 and Graph 7.1.3). For
developmental dysplasia of the hip, theprevalence was again highest among whites (8.8per 10,000) and lowest among blacks/AfricanAmericans (1.5 per 10,000).
Among those conditions presented only inthe MACDP data, the prevalence ofclubfoot without NTD and skeletaldysplasia was highest among Whites (12.2per 10,000 and 2.1 per 10,000, respectively),while both were lowest among Others (8.5per 10,000 total births and 1.3 per 10,000,respectively.) Polydactyly shows thehighest prevalence among Blacks/ AfricanAmericans (18.7 per 10,000) and lowestamong Whites (10.4 per 10,000). Theprevalence of all limb deficiencies variedlittle by race and ethnicity.
Cerebral palsy (CP), which is reported onlyin the MADDSP, had a prevalence of 3.1 per1000 among children aged 8 years in 2000.(Table 7.4) The prevalence of cerebral palsyis slightly higher among blacks/AfricanAmericans than among whites (3.6/1000
The Burden of Musculoskeletal Diseases in the United States - Copyright © 2008
Chapter 7 Congenital and Infantile Developmental Conditions of the Musculoskeletal System
164
Graph 7.1.1: 95% Confidence Intervals around the Estimated Prevalenceof Selected Musculoskeletal Congenital and Development Conditionsat Birth, United States 1999-2003
[1] Talipes equinovarus and clubfoot of unspecified type without a neural tube defect[2] 95% confidence interval (CI) based on Metropolitan Atlanta Congenital Defects Programdata, 1999-2003Correa A, Cragan JD, Kucik JE, et al: Reporting birth defects surveillance data 1968-2003.Birth Defects Research A Clin Mol Teratol 2007;79(2):65–186.
Graph 7.1.2: Estimated Number of Infants Born per Year in theUnited States with Selected Congenital Musculoskeletal Defects,1999-2003
[1] National Birth Defects Prevention Network[2] Metropolitan Atlanta Congenital Defects Program [3] Talipes equinovarus and clubfoot of unspecified type without a neural tube defectSources: (1) National Birth Defects Prevention Network: Birth defects surveillance data fromselected states, 1999-2003. Birth Defects Research A ClinMol Teratol 2006;76(12):894-960. (2) Correa A, Cragan JD, Kucik JE, et al: Reporting birth defects surveillance data 1968-2003. Birth Defects Research A Clin Mol Teratol 2007;79(2):65–186.

versus 2.9/1000), and among males than females(3.6 per 1000 versus 2.6 per 1000). The majority ofchildren in the study had spastic cerebral palsy(61%) compared with nonspastic CP (5%) and CPnot otherwise specified (33%).1
Section 7.2: Selected Congenital andInfantile Development Conditions ofthe Musculoskeletal System
Section 7.2.1: Spina Bifida
Spina bifida consists of a bony defect in the spinethrough which the cerebrospinal fluid, meninges,nerves, spinal cord, or a combination thereof canherniate. It results from failure of the neural tubeto close during the first 28 days after conception
and is classified embryologically as acongenital anomaly of the centralnervous system. The most commontypes of spina bifida are meningoceleand myelomeningocele. In meningocele,only the meninges and cerebrospinalfluid herniate through the spinal defect.In myelomeningocele, the nerves, thespinal cord, or both also herniate. Thespinal defect in spina bifida can beeither covered by normal skin (closed)or in communication with theenvironment (open). Additional defectsof other organs are present in about 20%of infants with spina bifida.2
Spina bifida can be diagnosed prenatallythrough screening for elevated alpha-fetoprotein in maternal serum andprenatal ultrasonography. While manyspina bifida defects can be repairedsurgically, affected children havelifelong complications such ashydrocephalus, neurologic deficit,bowel and bladder incontinence, anddecreased long-term survival.2,3 Adecline in the prevalence of spina bifida
since the mid-1970s has been reported in theUnited States, Europe, Australia, and NewZealand.4,5 Spina bifida is seen more frequently atbirth among females than males, and mostfrequently among infants of Hispanic or Latinoethnicity, particularly those born in Mexico.6-10
In the early 1990s, randomized clinical trials inGreat Britain and Hungary demonstrated thatconsumption of the vitamin folic acid during thepericonceptional period (before and during theearly weeks of pregnancy) could prevent therecurrence11 and occurrence12 of anencephaly andspina bifida. As a result, in 1992, the U.S. PublicHealth Service recommended that all women ofchildbearing age who are capable of becoming
The Burden of Musculoskeletal Diseases in the United States - Copyright © 2008 165
Congenital and Infantile Developmental Conditions of the Musculoskeletal System Chapter 7
Graph 7.1.3: Prevalence of Selected Congenital MusculoskeletalDefects per 10,000 Total Births, by Race and Ethnicity, MetropolitanAtlanta Congenital Defects Program, Atlanta, Georgia, 1999-2003
[1] Data for races other than white, black/African American, Hispanic or Latino, or other(race not specified) were combined because the data, when analyzed separately, were toosmall for meaningful analysis.[2] Talipes equinovarus and clubfoot of unspecified type without a neural tube defect.Source: Correa A, Cragan JD, Kucik JE et al: Reporting birth defects surveillance data 1968–2003. Birth Defects Research A Clin Mol Teratol 2007;79(2):65–186.

pregnant consume 4.0 mg of folic acid daily toreduce their risk of having a baby withanencephaly or spina bifida.13 Subsequently, in1996, the U.S. Food and Drug Administrationestablished regulations requiring that flour andother enriched grain products be fortified with140 micrograms of folic acid per 100 grams ofgrain by January 1, 1998.14 Since these regulationswere implemented, serum and red blood cellfolate levels have increased among women ofreproductive age in the United States, anddeclines in the prevalence of anencephaly andspina bifida have been observed.9,15-18
Section 7.2.2: Developmental Dysplasia of the Hip
Developmental dysplasia of the hip (DDH) refersto a spectrum of abnormalities that includes anunstable, subluxed, or dislocated hip, ormalformed acetabulum. DDH can originate earlyin gestation as the lower limbs develop, duringthe second trimester as the hip muscles develop,or late in the third trimester as a result ofmechanical forces associated witholigohydramnios or breech presentation. It alsocan develop in the weeks following delivery orduring infancy and childhood. The clinicalsymptoms of DDH can change and evolve overtime. If untreated, persistent subluxation ordislocation can lead to permanent changes in thehip, including a shallow acetabulum, musclecontractures, and constriction of the hip capsule.Newborns and young infants can be treatedeffectively with a Pavlik harness, while olderinfants and children can require closed or opensurgical reduction.
Diagnosing DDH can be difficult, particularlyamong newborns. It is usually detected byphysical examination, radiography, orultrasound, although false positives and falsenegatives occur with all of these methods. Amongolder infants, limited abduction of the hip isusually the most consistent finding. The
Committee on Quality Improvement,Subcommittee on Developmental Dysplasia of theHip, American Academy of Pediatrics hasdeveloped clinical practice guidelines forpediatric health care providers on the earlydetection of DDH.19
DDH can occur unilaterally or bilaterally. Whenunilateral, the left side is involved approximatelythree times more often than the right. DDH ismore common among girls, first-born children,and those with a positive family history in aparent or sibling. It can occur as part of a moregeneral neuromuscular disorder or clinicalsyndrome. However, “typical” hip dislocationoccurs among otherwise healthy infants.19 Theprevalence of DDH can differ depending on theage of the child at diagnosis, the type ofexamination used for screening, the experience ofthe examiner, and the diagnostic criteria andterminology used.
Section 7.2.3: Clubfoot
Congenital talipes equinovarus (TEV), morecommonly referred to as clubfoot, is a commoncongenital disorder of the lower limb. A clubfootis fixed in adduction, supination, and varus, thatis, the forefoot turned in, the ankle turnedinward, and the foot pointed down.20 True TEVrequires active treatment, including casting,manipulation, and sometimes surgery to placethe foot in the correct anatomical position.21
Clubfoot can occur as an isolated finding, as aresult of another abnormality such as spinabifida, or as part of a clinical syndrome. Thetreatment of clubfoot can be particularlychallenging if an infant has associatedabnormalities.22
Isolated TEV occurs almost twice as often amongmales as in females, regardless of ethnicity.23 It isbilateral in 50% or more of cases. When unilateral,the right side is involved more frequently than
The Burden of Musculoskeletal Diseases in the United States - Copyright © 2008
Chapter 7 Congenital and Infantile Developmental Conditions of the Musculoskeletal System
166
the left.24 In metropolitan Atlanta, the prevalenceof clubfoot not associated with an NTD declinedremarkably from 1968 through 2003.25 Studieshave suggested that maternal smoking might be arisk factor for clubfoot, particularly among thosewith a family history of clubfoot.26 However, thecorresponding decline in smoking over thisperiod probably was not sufficient to fullyexplain the decline in clubfoot.
Section 7.2.4: Limb Deficiencies
Limb deficiencies, also known as limb reductiondefects, are defined by the absence (or severehypoplasia) of part or all of bony structures of theextremities. The most common type of this defectis a transverse terminal limb deficiency,characterized by the absence of the distalsegments of any limb while the proximalsegments remain intact. People with transversedigital deficiencies are missing part or all of anyphalanx with intact metacarpal or metatarsalbones and proximal segments. The functionalconsequences of these defects can be considerablewhen the thumb and multiple fingers areinvolved. Other categories include preaxial andpostaxial deficiencies, often grouped together aslongitudinal limb deficiencies, as well as splithand or split foot malformations. The leastcommon category of deficiency is the intercalarytype (classic phocomelia), defined by the absenceof proximal parts of limbs with distal structurestotally or partially present.
Although specific genetic loci for several limbdefect syndromes have been identified in recentyears, the causes of limb deficiencies currentlycannot be easily identified for many affectedinfants.27 Certain phenotypes, particularly thoseinvolving split hand or split foot, intercalary,radial ray, or postaxial deficiencies, have beenassociated with single-gene mutations (e.g., theHolt-Oram “heart/hand” syndrome or familialsplit hand or split foot malformation). Other rare
causes include chromosome abnormalities suchas aneuploidies or exposure to known teratogenssuch as thalidomide and valproic acid. Becausechromosomal abnormalities account for a smallproportion of limb deficiencies overall, advancingmaternal age has not been shown to be a riskfactor for these defects.28 The hypothesis of avascular pathogenesis for transverse terminallimb deficiencies is supported by animal,epidemiologic, autopsy, and family studies, butoften specific vasoactive exposures cannot beidentified for individual infants. However, evenfor the distinctive amniotic band phenotype,there is controversy regarding the intrinsic versusextrinsic nature of limb disruption.29
Prenatal ultrasonography has resulted in earlyidentification of a significant proportion of limbdeficiencies among countries where thisprocedure has become routine, but primaryprevention of most of these defects has remainedelusive.30 There is some suggestion from limbdeficiency case-control studies thatpericonceptional multivitamin use might beprotective for longitudinal or transverse terminaldeficiencies,31,32 and this hypothesis is beingfurther investigated along with studies of gene-environment interactions that might shed light onmechanisms of nutritional protective factors orvasoactive risk factors.
Section 7.2.5: Skeletal Dysplasias
Skeletal dysplasias belong to a heterogeneousgroup of birth defects. They include over 200disorders (e.g., chondrodystrophies,osteodystrophies, dwarfisms, and generalizedskeletal dysplasias) characterized byabnormalities of cartilage and bone growthresulting in an abnormal shape and size of theskeleton and a disproportion of the long bones,spine, and head.33 Most of them are geneticconditions. Most fetuses with skeletal dysplasianow can be diagnosed prenatally.34 However,
The Burden of Musculoskeletal Diseases in the United States - Copyright © 2008 167
Congenital and Infantile Developmental Conditions of the Musculoskeletal System Chapter 7
some skeletal dysplasias do not manifest untilshort stature and other complications arise duringchildhood. Skeletal dysplasias differ ininheritance patterns, severity, natural histories,and prognoses. Modes of inheritance include bothautosomal and X-linked dominant and recessiveforms. Several genetic mutations have beendescribed and associated with skeletaldysplasias.35,36 Males are primarily affected in X-linked recessive disorders; X-linked dominantdisorders can be lethal in males. Severity ofskeletal dysplasias ranges from mild forms(nonlethal) to severe (lethal) forms.37 The mostcommon lethal skeletal dysplasias includethanatophoric dysplasia, achondrogenesis, andosteogenesis imperfecta.38 Achondroplasia is themost common nonlethal skeletal dysplasia.Prognosis and life expectancy of children withnonlethal skeletal dysplasias depend on thedegree of skeletal abnormalities and otherassociated anomalies.
Treatment is usually supportive. With earlyintervention from specialists, patients withnonlethal skeletal dysplasias can avoid orminimize the many complications associated withthese disorders.39 Orthopaedic surgery is one ofthe pillars of treatment to prevent neurologic andorthopaedic complications due to spinal cordcompression, joint instability, and long bonedeformity. The International Skeletal DysplasiaRegistry is a referral center for the diagnosis,management, and the etiology of skeletaldysplasia.40
Section 7.2.6: Polydactyly
Polydactyly is a heterogeneous group ofanomalies described by excessive partition of thedigital rays of the hands and feet that can appearin isolation or in association with other birthdefects. Clinically, it generally manifests as anextra digit. It is the most common congenitaldigital anomaly of the hand and foot. Isolated
polydactyly is often autosomal dominant oroccasionally sporadic, while polydactylyassociated with other major defects can beautosomal recessive.41 Polydactyly is classifiedinto postaxial and preaxial types. Postaxialpolydactyly, the most common type in the UnitedStates, typically involves an extra digit on theulnar or fibular side of the limb. Preaxialpolydactyly refers to duplication on the radial ortibial side. Central polydactyly is a term usedprimarily in clinical settings, usually in the raresituation when syndactyly is associated withduplication of the second, third, or fourth digit.
In general, there is a significant racial predilectionfor polydactyly. Postaxial polydactyly is morefrequent among blacks/African Americans thanamong whites, and is more frequent among malechildren.42 This higher prevalence among AfricanAmericans is largely due to a higher prevalenceof postaxial skin tags, which generally are notconsidered to be a major abnormality. Postaxialskin tags in African Americans are not includedin the data from MACDP on polydactylypresented in the tables and graphs. Other factorsassociated with postaxial hand polydactyly in onestudy included twinning, low maternaleducation, parental consanguinity, and recurrencein first-degree relatives.43
All types of polydactylies are rarely associatedwith other congenital anomalies. In a recentstudy, trisomy 13, Meckel syndrome, and Downsyndrome accounted for most cases of syndromicpolydactyly.44 Treatment of polydactyly dependsgreatly on the complexity of the malformationand varies from tying the base of the finger with asuture to complex surgical correction.
Section 7.2.7: Cerebral Palsy
Cerebral palsy (CP) describes a group ofpermanent disorders of movement and posturethat are attributed to nonprogressive disturbances
The Burden of Musculoskeletal Diseases in the United States - Copyright © 2008
Chapter 7 Congenital and Infantile Developmental Conditions of the Musculoskeletal System
168

in the developing brain of the fetus or infant. Themotor disorders of CP are often accompanied by:(1) disturbances of sensation, perception,cognition, communication, and behavior; (2)epilepsy; and (3) secondary musculoskeletalproblems.45 This definition of CP covers a widearray of clinical presentations and degrees ofactivity limitation. Traditional classificationschemes have focused principally on thedistributional patterns of affected limbs (e.g.,hemiplegia or diplegia), with an added modifierdescribing the predominant type of tone ormovement abnormality (e.g., spastic ordyskinetic.)45 The etiology of CP is not fullyunderstood. Factors associated with an increasedrisk for CP include low birth weight, intrauterineinfections, and multiple gestation.46,47 However,anywhere from 17% to 60% of cases of CP haveno known perinatal or neonatal complications.46
The prevalence of CP, estimated to occur inslightly over 3 persons in 1,000, has beengenerally stable for several decades except for amodest increase in recent years. This recentincrease in prevalence has been attributed to anincrease among very low birth weight infants,which, in turn, has been attributed to their
increased survival resulting from newbornintensive care.48 CP occurs more frequently inmales than in females, and is higher amongblacks/African Americans than found in otherrace or ethnic groups. (Table 7.5 and Graph 7.2.1)
Section 7.3: Birth Defects SurveillancePrograms
The National Birth Defects Prevention Network(NBDPN) is composed of state-based birth defectssurveillance programs and individuals workingin birth defects surveillance, research, andprevention at the local, state, and national levels.NBDPN publishes an annual report ofsurveillance data from participating programs. In2006, prevalence data for selected birth defectsfrom 11 states with active case-finding for birthsin 1999-2003 were published, from which datawere pooled to calculate prevalence estimates forspina bifida without anencephaly and develop-mental dysplasia of the hip (developmental hipdislocation) used in this chapter.49
The CDC’s Metropolitan Atlanta CongenitalDefects Program (MACDP) is a population-basedsurveillance system for birth defects that wasestablished in 1967. Since that time, the programhas conducted ongoing surveillance for birthdefects among infants, fetuses, and children bornto residents of the five central counties ofmetropolitan Atlanta through the use of activecase-finding methods and multi-sourceascertainment.36 Prevalence data from MACDPare presented for the period 1999-2003 forcomparison with prevalence estimates from theNBDPN for the same period. In 2003, there were51,676 live births to residents of the five counties.
The CDC’s Metropolitan Atlanta DevelopmentalDisabilities Program (MADDSP) is a population-based surveillance system that has beenmonitoring the occurrence of selecteddevelopmental disabilities, including cerebral
The Burden of Musculoskeletal Diseases in the United States - Copyright © 2008 169
Congenital and Infantile Developmental Conditions of the Musculoskeletal System Chapter 7
Graph 7.2.1: Prevalence of Cerebral Palsy AmongChildren Aged 8 Years per 1,000 Population, by Sex andRace, Metropolitan Atlanta Developmental DisabilitiesSurveillance Program, Atlanta, Georgia, 2000
[1] Data for races other than black/AfricanAmerican and white were combined due to smallsample size.
Source: Centers for Disease Control andPrevention. Prevalence of four developmentaldisabilities among children aged 8 years,Metropolitan Atlanta Developmental DisabilitiesSurveillance Program, 1996 and 2000. MMWRSurveill Sumn 2006:55:1-9.

palsy, among school-aged children since 1991 inthe same population as MACDP. Prevalence dataon CP are presented for children aged 8 yearsduring 2000.1 In 2000, the population inMetropolitan Atlanta included 43,593 childrenaged 8 years.
1. Centers for Disease Control and Prevention (CDC):Prevalence of four developmental disabilities amongchildren aged 8 years Metropolitan AtlantaDevelopmental Disabilities Surveillance Program, 1996and 2000. MMWR Surveill Summ;2006;55:1-9.
2. Botto LD, Moore CA, Khoury MJ, et al: Neural-tubedefects. N Engl J Med 1999;341:1509-1519.
3. Wong LC, Paulozzi LJ: Survival of infants with spinabifida: A population study, 1979-1994. Paediatr PerinatEpidemiol 2001;15:374-378.
4. Elwood JM, Little J, Elwood JH: Epidemiology and Controlof Neural Tube Defects. New York, NY: Oxford UniversityPress, 1992.
5. Yen IH, Khoury MJ, Erickson JD, et al: The changingepidemiology of neural tube defects, United States,1968-1989. Am J Dis Child 1992;146:857-861.
6. Canfield MA, Annegers JF, Brender JD, et al: Hispanicorigin and neural tube defects in Houston/HarrisCounty, Texas: II. Risk factors. Am J Epidemiol1996;143:12-24.
7. Khoury M, Erickson JD, James LM: Etiologicheterogeneity of neural tube defects: Clues fromepidemiology. Am J Epidemiol 1982;115:538-548.
8. Shaw GM, Velie EM, Wasserman CR: Risk for neuraltube defect-affected pregnancies among women ofMexican descent and white women in California. Am JPublic Health 1997;87:1467-1471.
9. Williams LJ, Rasmussen SA, Flores A, et al: Decline inthe prevalence of spina bifida and anencephaly byrace/ethnicity: 1995-2002. Pediatrics 2005;116:580-586.
10. Canfield MA, Honein MA, Yuskiv N, et al: Nationalestimates and race/ethnic-specific variations of selectedbirth defects in the United States, 1991-2001. Birth DefectsResearch A Clin Mol Teratol 2006;76:747-756.
11. MRC Vitamin Study Research Group: Prevention ofneural tube defects: results of the Medical ResearchCouncil Vitamin Study. Lancet 1991;338:131-137.
12. Czeizel AE, Dudas I: Prevention of the first occurrenceof neural-tube defects by periconceptional vitaminsupplementation. N Engl J Med 1992;327:1832-1835.
13. Centers for Disease Control and Prevention (CDC):Recommendations for the use of folic acid to reduce thenumber of cases of spina bifida and other neural tubedefects. MMWR Recomm Rep 1992;41:1-7.
14. U.S. Food and Drug Administration: Food standards:amendment of standards of identity for enriched grainproducts to require addition of folic acid. Fed Regist1996;61:8781-8797.
15. Centers for Disease Control and Prevention (CDC):Foliate status in women of childbearing age, byrace/ethnicity, United States, 1999-2000. MMWR MorbMortal Wkly Rep 2002;51:808-810.
16. Honein MA, Paulozzi LJ, Mathews TJ, et al: Impact offolic acid fortification of the US food supply on theoccurrence of neural tube defects. JAMA 2001;285:2981-2986.
17. Honein MA, Paulozzi LJ, Mathews TJ, et al: Erratum on:impact of folic acid fortification of the US food supplyon the occurrence of neural tube defects. JAMA2001;286:2236.
18. Williams LJ, Mai CT, Edmonds LD, et al: Prevalence ofspina bifida and anencephaly during the transition tomandatory folic acid fortification in the United States.Teratology 2002;66:33-39.
19. Committee on Quality Improvement, Subcommittee onDevelopmental Dysplasia of the Hip, AmericanAcademy of Pediatrics: Clinical practice guidelines:early detection of developmental dysplasia of the hip.Pediatrics 2000;105:896-905.
20. Miedzybrodzka Z: Congenital talipes equinovarus(clubfoot): a disorder of the foot but not hand. J Anat2003;202:37-42.
21. Dietz F: The genetics of idiopathic clubfoot. Clin OrthopRelat Res 2002;401:39-48.
22. Cummings RJ, Davidson RS, Armstrong PF, et al:Congenital clubfoot. J Bone Joint Surg Am 2002;84:290-308.
23. Lochmiller C, Johnston D, Scott A, et al: Geneticepidemiology of idiopathic talipes equinovarus. Am JMed Genet 1998;79:90-96.
24. Paulozzi LJ, Lary JM: Laterality patterns in infants withexternal birth defects. Teratology 1999;60:265-271.
25. Correa A, Cragan JD, Kucik JE, et al: Reporting birthdefects surveillance data 1968-2003. Birth DefectsResearch A Clin Mol Teratol 2007;79:65-186.
26. Honein MA, Paulozzi LJ, Moore CA: Family history,maternal smoking, and clubfoot: An indication of agene-environment interaction. Am J Epidemiol2000;152:658-665.
The Burden of Musculoskeletal Diseases in the United States - Copyright © 2008
Chapter 7 Congenital and Infantile Developmental Conditions of the Musculoskeletal System
170

27. McGuirk CK, Westgate MN, Holmes LB: Limbdeficiencies in newborn infants. Pediatrics 2001;108:E64.
28. Reefhuis J, Honein MA: Maternal age and non-chromosomal birth defects, Atlanta, 1968-2000. BirthDefects Research A Clin Mol Teratol 2004;70:572-579.
29. Orioli IM, Ribeiro MG, Castilla EE: Clinical andepidemiological studies of amniotic deformity,adhesion, and mutilation (ADAM) sequence in a SouthAmerican (ECLAMC) population. Am J Med Genet2003;118:135-145.
30. Stoll C, Wiesel A, Queisser-Luft A, et al: Evaluation ofthe prenatal diagnosis of limb reduction deficiencies:EUROSCAN Study Group. Prenat Diagn 2000;20:811-818.
31. Shaw GM, O’Malley CD, Wasserman CR, et al: Maternalpericonceptional use of multivitamins and reduced riskfor conotruncal heart defects and limb deficienciesamong offspring. Am J Med Genet 1995;59:536-545.
32. Yang Q, Khoury MJ, Olney RS, et al: Doespericonceptional multivitamin use reduce the risk forlimb deficiency in offspring? Epidemiology 1997;8:157-161.
33. Romero R, Athanassiadis AP, Jeanty P: Fetal skeletalanomalies. Radiol Clin North Am 1990;28:75-99.
34. Mortier G: The diagnosis of skeletal dysplasias: Amultidisciplinary approach. Eur J Radiol 2001;40:161-167.
35. Baitner AC, Maurer SG, Gruen MB, et al: The geneticbasis of the osteochondrodysplasias. Journal of PediatricOrthopaedics 2000;20:594-605.
36. Superti-Furga A, Bonafe L, Rimoin DL: Molecular-pathogenetic classification of genetic disorders of theskeleton. Am J Med Genet 2001;106:282-293.
37. Azouz EM, Teebi AS, Eydoux P, et al: Bone dysplasias:an introduction. Can Assoc Radiol J 1998;49:105-109.
38. Lemyre E, Azouz EM, Teebi AS, et al: Bone dysplasiaseries. Achondroplasia, hypochondroplasia andthanatophoric dysplasia: review and update. Can AssocRadiol J 1999;50:185-197.
39. Hurst JA, Firth HV, Smithson S: Skeletal dysplasias.Semin Fetal Neonatal Med 2005;10:233-241.
40. International Skeletal Dysplasia Registry, Cedars-SinaiMedical Center. Available at:http://www.csmc.edu/9934.html. Accessed October 12,2007.
41. Hosalkar HS, Shah H, Gujar P, et al: Crossedpolydactyly. J Postgrad Med 1999;45:90-92.
42. Finley WH, Gustavson KH, Hall TM, et al: Birth defectssurveillance: Jefferson County, Alabama, and UppsalaCounty, Sweden. South Med J 1994;87:440-445.
43. Castilla EE, da Graca Dutra M, Lugarinho da Fonseca R,et al: Hand and foot postaxial polydactyly: Twodifferent traits. Am J Med Genet 1997;73:48-54.
44. Castilla EE, Lugarinho R, da Graca Dutra M, et al:Associated anomalies in individuals with polydactyly.Am J Med Genet 1998;80:459-465.
45. Rosenbaum P, Panet N, Leviton A, et al: A report: thedefinition and classification of cerebral palsy. Dev MedChild Neurol Suppl 2007;49:8-14.
46. Davis D: Review of cerebral palsy, part I: description,incidence, and etiology. Neonatal Netw 1997;16:7-12.
47. Odding E, Roebroeck ME, Stam HJ: The epidemiologyof cerebral palsy: incidence, impairments, and riskfactors. Disabil Rehabil 2006;28:183-191.
48. Paneth N, Hong T, Korzeniewski S: The descriptiveepidemiology of cerebral palsy. Clinical Perinatology2006;33:251-267.
49. National Birth Defects Prevention Network: Birthdefects surveillance data from selected states, 1999-2003.Birth Defects Research A Clin Mol Teratol 2006;76:894-960.
The Burden of Musculoskeletal Diseases in the United States - Copyright © 2008 171
Congenital and Infantile Developmental Conditions of the Musculoskeletal System Chapter 7

The Burden of Musculoskeletal Diseases in the United States - Copyright © 2008
Chapter 7 Congenital and Infantile Developmental Conditions of the Musculoskeletal System
172
Section 7.4: Congenital and Infantile Developmental Conditions of theMusculoskeletal System Data Tables
Table 7.1: Estimated Prevalence of Selected CongenitalMusculoskeletal Defects, National Birth Defects Prevention Networkand Metropolitan Atlanta Congenital Defects Program, 1999-2003
NBDPN [1], 1999-2003 MACDP [3], 1999-2003
Musculoskeletal Defect
Prevalenceper 10,000
Total Births 95% CI [2]
Prevalenceper 10,000
Total Births 95% CI [2]
Spina Bifida without Anencephalus 3.7 3.5 – 3.9 2.6 2.0 - 3.3
Developmental Dysplasia of the Hip 6.2 5.9 – 6.4 5.8 4.9 - 6.9
Clubfoot [4] 10.2 8.9 - 11.5
All Limb Deficiencies 4.7 3.9 - 5.7
Longitudinal Limb Deficiency 1.5 1.1 -2.1
Transverse Limb Deficiency 2.5 1.9 -3.2
Skeletal Dysplasias 1.6 1.2 -2.2
Polydactyly 13.9 12.5 -15.5
[1] National Birth Defects Prevention Network
[2] Confidence interval
[3] Metropolitan Atlanta Congenital Defects Program
[4] Talipes equinovarus and clubfoot of unspecified type without a neural tube defect
Source 1: National Birth Defects Prevention Network. Birth defects surveillance data from selected states, 1999-2003. BirthDefects Research A Clin Mol Teratol 2006;76(12):894-960.
Source 2: Correa A, Cragan JD, Kucik JE, et al: Reporting birth defects surveillance data 1968–2003. Birth Defects Research AClin Mol Teratol 2007;79(2):65–186.

The Burden of Musculoskeletal Diseases in the United States - Copyright © 2008 173
Congenital and Infantile Developmental Conditions of the Musculoskeletal System Chapter 7
Table 7.2: Estimated Number of Infants Born per Year in the United Stateswith Selected Congenital Musculoskeletal Defects, 1999 -2003
Musculoskeletal Defect
EstimateBased on
NBDPN [1]Prevalence 95% CI [2]
EstimateBased on
MACDP [3]Prevalence 95% CI [2]
Spina Bifida without Anencephalus 1,486 1,411 – 1,564 1,032 970 – 1,097
Developmental Dysplasia of the Hip 2,503 2,406 – 2,603 2,354 2,260 – 2,451
Clubfoot [4] 4,096 3,971 – 4,223
All Limb Deficiencies 1,903 1,818 – 1,990
Longitudinal Limb Deficiency 613 565 – 663
Transverse Limb Deficiency 1,016 954 – 1,080
Skeletal Dysplasias 661 612 – 713
Polydactyly 5,611 5,466 – 5,760
[1] National Birth Defects Prevention Network
[2] Confidence interval
[3] Metropolitan Atlanta Congenital Defects Program
[4] Talipes equinovarus and clubfoot of unspecified type without a neural tube defectSource 1: National Birth Defects Prevention Network. Birth defects surveillance data from selected states, 1999-2003. Birth DefectsResearch A Clin Mol Teratol 2006;76(12):894-960. Source 2: Correa A, Cragan JD, Kucik JE, et al: Reporting birth defects surveillance data 1968–2003. Birth Defects Research A ClinMol Teratol 2007;79(2):65–186.
Table 7.3: Prevalence of Selected Congenital and Infantile DevelopmentalMusculoskeletal Defects per 10,000 Total Births by Race and Ethnicity, National BirthDefects Prevention Network, 11 States With Active Surveillance Systems, 1999-2003
Musculoskeletal Defect WhiteBlack/African
American Hispanic or Latino Other [1]
Prevalence 95% CI [2] Prevalence 95% CI [2] Prevalence 95% CI [2] Prevalence 95% CI [2]
Spina Bifida without Anencephalus [3] 3.4 3.2 - 3.7 3.4 2.9 - 3.9 4.3 4.0 - 4.7 3.2 2.6 -4.0
Developmental Dysplasia of the Hip(developmental hip dislocation) [4] 7.5 7.1 - 7.9 3.0 2.6 - 3.5 5.9 5.4 - 6.4 5.5 4.5 -6.6
[1] Data for races other than white, black or African American, Hispanic or Latino were combined due to small sample size.
[2] Confidence interval
[3] Prevalence estimates based on pooled data from 11 states with active case finding during this time period: Alabama, Arkansas, California, Georgia,Hawaii, Iowa, Massachuse�s, North Carolina, Oklahoma, Texas, and Utah.
[4] Prevalence estimates based on pooled data from 8 states with active case finding during this time period: Alabama, Arkansas, Georgia, Hawaii, Iowa,North Carolina, Oklahoma, and Texas.
Source: National Birth Defects Prevention Network: Birth defects surveillance data from selected states, 1999-2003. Birth Defects Research A Clin Mol Teratol2006;76(12):894-960.

The Burden of Musculoskeletal Diseases in the United States - Copyright © 2008
Chapter 7 Congenital and Infantile Developmental Conditions of the Musculoskeletal System
174
Table 7.4: Prevalence of Selected Congenital and Infantile DevelopmentalMusculoskeletal Defects per 10,000 Total Births by Race and Ethnicity, MetropolitanAtlanta Congenital Defects Program, Atlanta, Georgia, 1999 - 2003
Musculoskeletal Defect WhiteBlack/African
American Hispanic or Latino Other [1]Prevalence 95% CI [2] Prevalence 95% CI [2] Prevalence 95% CI [2] Prevalence 95% CI [2]
Spina Bifida without Anencephalus 2.0 1.2 – 3.1 2.3 1.4 – 3.5 5.2 3.2 – 7.8 0.7 0.0 – 3.6
Developmental Dysplasia of the Hip 8.8 7.0 – 10.9 1.5 0.8 – 2.4 8.7 6.1 – 12.0 7.2 3.6 – 12.9
Clubfoot [3] 12.2 10.1 – 14.7 8.6 6.9 – 10.7 9.6 6.9 – 13.1 8.5 4.5 – 14.6
All Limb Defiencies 4.7 3.4 – 6.3 4.7 3.4 – 6.3 4.9 3.1 – 7.6 4.6 1.8 – 9.4
Longitudinal Limb Deficiency 1.6 0.9 – 2.6 1.6 0.9 – 2.6 1.9 0.8 – 3.7 - -
Transverse Limb Deficiency 2.3 1.4 – 3.5 2.6 1.7 – 3.8 2.8 1.5 – 4.9 2.6 0.7 – 6.7
Skeletal Dysplasias 2.1 1.3 – 3.2 1.4 0.7 – 2.3 1.4 0.5 – 3.1 1.3 0.2 – 4.7
Polydactyly 10.4 8.4 – 12.6 18.7 16.1 – 21.6 12.2 9.1 – 16.0 11.1 6.5 – 17.8
[1] Data for races other than white, black or African American, Hispanic or Latino were combined due to small sample size.[2] Confidence interval[3] Talipes equinovarus and clubfoot of unspecified type without a neural tube defect.
Source: Correa A, Cragan JD, Kucik JE et al: Reporting birth defects surveillance data 1968–2003. Birth Defects Research A Clin Mol Teratol 2007;79(2):65–186.
Table 7.5: Prevalence of Cerebral Palsy Among ChildrenAged 8 Years per 1,000 Population by Sex and Race,Metropolitan Atlanta Developmental DisabilitiesSurveillance Program, Atlanta, Georgia, 2000
Number Prevalence 95% CI [1]Male
White 33 3.6 2.6 – 5.1Black/African American 40 4.1 3.0 – 5.6Other [2] 4 1.2 0.5 – 3.3Total 79 3.6 2.9 – 4.5
FemaleWhite 20 2.2 1.4 – 3.5Black/African American 30 3.1 2.2 – 4.5Other [2] 6 2.0 0.9 – 4.4Total 56 2.6 2.0 – 3.4
TotalWhite 53 2.9 2.2 – 3.8Black/African American 70 3.6 2.9 – 4.6Other [2] 10 1.6 0.9 – 3.0Total [3] 135 3.1 2.6 – 3.7
[1] Confidence interval.[2] Data for races other than white or black/African American were combined due to small sample size.[3] Total includes two children whose race was not indicated.Source: Centers for Disease Control and Prevention. Prevalence of four developmental disabilities amongchildren aged 8 years, Metropolitan Atlanta Developmental Disabilities Surveillance Program, 1996 and2000. MMWR Surveill Summ2006;55:1-9.

Chapter 8
Neoplasms of Bone and Connective Tissue
The Burden of Musculoskeletal Diseases in the United States - Copyright © 2008 175
Bone and connective tissue neoplasms are rarewhen compared with other cancers and withother musculoskeletal conditions, accounting forabout 1.5% of annual cancer cases between 2000and 2004. However, it is estimated that in 2007,2,370 persons will be diagnosed with cancer ofthe bones and joints, with more than one in fourdiagnoses for children and youth under the age of20. Myeloma, a malignant tumor of the bonemarrow, will be diagnosed in 19,900 persons.1 Inaddition, 1,330 persons will die of cancer of thebone and joints, while 10,790 will die of myelomain 2007.
Data from the Surveillance Epidemiology andEnd Results (SEER) program of the NationalCancer Institute, used to present the burden ofbone and connective tissue neoplasms, is the mostcomprehensive source of information on cancerincidence, prevalence, mortality, survival, andlifetime risks. Data is currently available from1974 to 2004. The SEER program is one of themost comprehensive sources of neoplasm data; itis based on data representing approximately 10%of the U.S. population. In addition, data from theAmerican College of Surgeons’ Commission onCancer National Cancer Data Base (NCDB) wasutilized in the analysis of the three main bonesarcomas: osteosarcoma, chondrosarcoma andEwing’s sarcoma. This database is maintained bythe American College of Surgeons and containsthe same standardized data as that collected bythe SEER database. Data are collected from allinstitutions wishing to be accredited by theAmerican College of Surgeons Commission onCancer. Each accredited institution is required toreport all patients with cancer treated at theirinstitution, including annual follow-up data. Site
visits and interaction between American Collegeof Surgeons cancer database personnel and thelocal reporting institutions verifies a minimum of90% case capture and reporting for eachinstitution. Multiple internal checks verify thedata accuracy. It is estimated the approximately1,700 reporting institutions each year treatapproximately 75% of all patients withmalignancies in the United States.
Section 8.1: Incidence of Neoplasms ofBone and Connective Tissue
Musculoskeletal cancers are classified into boneand joint cancers and myeloma. The three mostcommon classifications of cancers of bones andjoints are osteosarcoma, Ewing’s sarcoma, andchondrosarcoma. The ages at which these cancersare most prevalent vary. Osteosarcoma, amalignant bone tissue tumor, is the mostcommon, occurring most frequently in teens andyoung adults. Ewing’s sarcoma, a tumor oftenlocated in the shaft of long bones and in thepelvic bones, occurs most frequently in childrenand youth. Chondrosarcoma, a sarcoma ofmalignant cartilage cells, most likely occurs as asecondary cancer by malignant degeneration ofpre-existing cartilage cells within bone, includingchondromas (a benign tumor), and is primarilyfound among older adults. However, the vastmajority of chondromas never undergo malignantchange and, therefore, the routine resection ofbenign chondromas is unwarranted. Of thesethree, Ewing’s sarcoma is generally considered tohave the worst prognosis. By definition, all casesof Ewing’s sarcoma are high grade, the mostaggressive category of cancer, with full potentialto metastasize and bring about death.

Approximately 6% to 20% of osteosarcomas are oflower grade; chondrosarcoma has a higherproportion of low grade cases than the other twobone and joint cancers.
Bone cancers are found more frequently in malesthan females, and more frequently among whitesthan those of any other race. (Table 8.1 and Graph8.1.1) The average annual incidence of bonecancers between 2000 and 2004 was 9 in onemillion persons; the rate among all males was10 in one million, while among all females itwas 8 in one million. Among white males, theoverall incidence jumped to 11 in one millionpersons. The incidence of cancer of the bonesand joints in the United States is comparableto several site-specific oral cancers (i.e., lip,salivary gland, floor of the mouth), cancers ofthe bile duct, cancers of the eye, and Kaposi’ssarcoma, which affects the skin and mucousmembranes and is often associated withimmunodeficient individuals with AIDS.
Myeloma, a malignant primary tumor of thebone marrow that can form in any of the
bone-marrow cells and usually involves multiplebones at the same time, occurs five to six times asfrequently as bone cancers. It occurs mostfrequently in adults between the ages of 50 and
70. The average annual incidence of myelomabetween 2000 and 2004 was 56 cases in onemillion persons. (Table 8.2 and Graph 8.1.2)Again, males have a higher incidence ofmyeloma than do females, with an average of70 cases in one million males to 45 cases in onemillion females. The incidence of myeloma inthe United States is comparable to esophageal,liver, cervical, ovarian, brain, and lymphocyticleukemia cancers.
The isolated single bone version of myeloma iscalled plasmacytoma, but virtually all cases ofisolated plasmacytoma develop into full-fledged multiple myeloma over the subsequent5 to 10 years after diagnosis.
Although annual rates of cancers of the bonesand joints and myeloma vary somewhat, the
overall incidence has remained relatively constantsince the mid-1970s.2
With a median age of 39 years at time ofdiagnosis, cancers of the bones and joints attack
The Burden of Musculoskeletal Diseases in the United States - Copyright © 2008
Chapter 8 Neoplasms of Bone and Connective Tissue
176
Graph 8.1.1: Incidence of Cancers of Bones and Joints, by Sexand Race, United States 1995-2004
Source: Ries LAG, Harkins D, Krapcho M, et al (eds): SEER Cancer StatisticsReview, 1975-2003, Overview. Bethesda, MD: National Cancer Institute, 2006.Available at h�p://seer.cancer.gov/csr/1975_2003/. Accessed June 19, 2007.
Graph 8.1.2: Incidence of Myeloma, by Sex and Race, United States 1995-2004
Source: Ries LAG, Harkins D, Krapcho M, et al (eds): SEER Cancer Statistics Review,1975-2003, Overview. Bethesda, MD: National Cancer Institute, 2006. Available ath�p://seer.cancer.gov/csr/1975_2003/. Accessed June 19, 2007.

younger patients than most other broadcategories of cancer. (Table 8.3) Males aretypically diagnosed with bone cancers 5 yearsearlier than females. Myeloma, on the otherhand, is primarily a cancer found among elderlypersons, with a median age of 70 at the time ofdiagnosis. Again, males are typically diagnosedwith myeloma at ages several years youngerthan females.
Section 8.2: Mortality and SurvivalRates for Neoplasms of Bones andConnective Tissue
Annual population-based mortality rates due tocancers of bones and joints are low, averagingfour deaths per one million persons per yearbetween 2000 and 2004. Over the past 35 years,the mortality rate from bone and joint cancerdropped by approximately 50% from that of thelate 1970s.1 However, there has been nosignificant improvement over the past 20 years.3
Males have a higher mortality rate than femalesfor all races. The overall 5-year survival rate is54% for osteosarcoma, 75% for chondrosarcoma,and 51% for Ewing’s sarcoma. The osteosarcomasurvival rate varies with age: 5-year survival was60% for persons under 30 years of age, 50% forthose aged 30 to 49, and 30% for those 50 yearsold and older.3
The overall 5-year relative survival rate for boneand joint cancers is 68%, and is comparable to anumber of more common cancers such aslymphoma, urinary, cervical/ovarian, and softtissue cancers. (Table 8.4 and Graph 8.2.1) Theannual population-based mortality rate ofmyeloma was an average of 37 persons per onemillion population between 2000 and 2004.1 Themortality rate from myeloma has remainedrelatively constant since the mid-1970s.1 The5-year survival rate for myeloma, 34%, is one ofthe lowest for all cancers.
Section 8.3: Bone and Joint CancerAmong Children and Young Adults
While myeloma is primarily a cancer of middleaged to older adults, cancers of bones and jointsare found among persons under the age of 30 inhigher proportion than expected for the overallincidence. In 2000-2003, 45% of bone and jointcancers were diagnosed in persons under the ageof 35, with 28% occurring among children andadolescents under the age of 20. This compares toless than 4% of all cancer sites in persons aged 35and younger, and only 1% in those younger than20 years. (Table 8.5 and Graph 8.3.1)
Deaths from bone and joint cancer follow asimilar pattern. (Table 8.6 and Graph 8.3.2)Between 2000 and 2003, 15% of deaths from boneand joint cancer occurred in children and youthunder the age of 20, and an additional 14%among young adults aged 20 to 34. The mortalityrate among younger persons from bone and jointcancer comprises 1.3% of deaths from all types ofcancer. The relative proportion of deaths from
The Burden of Musculoskeletal Diseases in the United States - Copyright © 2008 177
Neoplasms of Bone and Connective Tissue Chapter 8
Graph 8.2.1: Age-Adjusted 5-Year Relative Cancer SurvivalRates by Sex, United States 2000-2004
Source: Ries LAG, Harkins D, Krapcho M, et al (eds): SEER Cancer StatisticsReview, 1975-2003, Overview. Bethesda, MD: National Cancer Institute, 2006.Available at h�p://seer.cancer.gov/csr/1975_2003/. Accessed June 19, 2007.

bone and joint cancer was higher in children,youth, and young adults than all other cancertypes that disproportionately affect youngerpeople, including brain and nervous system,leukemia and soft tissue cancers.
During the same time period, 2000-2003,osteosarcoma accounted for 59% of the malignantbone tumors diagnosed in persons under the ageof 20, with 46% of osteosarcoma diagnosesoccurring in persons younger than 20 years ofage. The majority of the remaining tumors in theage 20 and under group were Ewing’s sarcoma(31%), accounting for 66% of Ewing’s sarcomadiagnoses. In the young adult population (age 20
to 34 years) diagnosed with malignant bonetumors, chondrosarcoma accounted for 37% andosteosarcoma for 36%, Ewing’s sarcoma wasdiagnosed 17% of the time; this represented 16%,17%, and 21% of all diagnoses for these tumors,respectively. (Table 8.7 and Graph 8.3.3)
The overall incidence of malignant bone tumorsfrom 1975 to 2000 in persons under the age of 30peaked between the ages of 15-19 years and 10-14years at 14.8 and 13.1 per million persons,respectively. The incidence of osteosarcoma peaksin these ages at 8.2 and 7.6 per million,respectively, while Ewing’s sarcoma peaks at 4.6and 4.3, respectively. (Graph 8.3.4)
The high incidence and mortality rate of bonecancers among children, youth and young adultscreates a significant burden on the productivityand life of future generations. Apart from thefinancial costs, emotional toil, and lost lives fromthe initial treatments, survivors carry significantfunctional burdens and continuing care costs. Atleast 75% of surviving bone and joint cancerpatients are treated with limb salvaging surgery.These surgeries most often require implantationof massive bone-replacing endoprostheses thathave limited life span and compromised function,requiring periodic surveillance and revision
The Burden of Musculoskeletal Diseases in the United States - Copyright © 2008
Chapter 8 Neoplasms of Bone and Connective Tissue
178
Graph 8.3.1: Age Distribution for MusculoskeletalNeoplasms at Time of Diagnosis, United States 2000-2003
Graph 8.3.2: Age Distribution for MusculoskeletalNeoplasms at Time of Death, United States 2000-2003
Source: Ries LAG, Harkins D, Krapcho M, et al (eds):SEER Cancer Statistics Review, 1975-2003, Overview.Bethesda, MD: National Cancer Institute, 2006.Available at: h�p://seer.cancer.gov/csr/1975_2003/..Accessed March 19, 2007
Graph 8.3.3: Distribution of Malignant Bone Tumors byType and Age, United States, 2000-2003
Source: Surveillance, Epidemiology, andEnd Results (SEER) Program(www.seer.cancer.gov). Public-Use Data(1973-2003), National Cancer Institute,DCCPS, Surveillance Research Program,Cancer Statistics Branch, released April2006, based on the November 2005submission. Accessed March 19, 2007.
Source: Ries LAG, Harkins D, Krapcho M, et al (eds):SEER Cancer Statistics Review, 1975-2003, Overview.Bethesda, MD: National Cancer Institute, 2006.Available at: h�p://seer.cancer.gov/csr/1975_2003/.Accessed March 19, 2007.

surgery to repair or replace worn parts. Theamputated survivors will require prostheticlimbs, the function of which is clearly limiting incomparison to normal activity. Both proceduresare expensive, with cost estimates of $25,000 peryear for replacement of an amputated limb in anactive 20- to 30-year-old man in 1997 dollars, andestimates of $23,500 for implant, rehabilitation,monitoring, and replacement with limb salvagingendoprothesis.4 Due to chronic pain and overalldysfunction, a large number of such survivorswill end up on disability, requiring publicsupport for the majority of their adult lifetime.
Section 8.4: Economic Cost ofMalignant Bone Tumors
Information on insurance coverage at time oftreatment was only available for roughly one-third of patients (8,342) and the patterns ofcoverage were similar between osteosarcoma andEwing’s sarcoma. For chondrosarcoma, due to theolder mean age of the patients, relatively morepatients were covered by Medicare (8.6%) orMedicare with supplement (16.7%). At the time ofdiagnosis, insurance coverage was most
commonly through managed care (38.5%) for allgroups. Private insurance was the next mostcommon recorded insurance coverage (27.4%),followed by Medicare with supplement (10%),although the majority of those patients hadchondrosarcoma. Only 0.3% of patients overallwere covered by Medicaid.
Section 8.5: Soft Tissue Sarcomas
Soft tissue sarcomas are malignant (cancerous)tumors that develop in any part of the body,including fat, muscle, nerve, fibrous tissuessurrounding joints, blood vessel, or deep skintissues. Approximately 55% to 60% of sarcomasdevelop in the arms or legs; the rest begin in thetrunk (15% to 20%), head and neck area (8% to10%), internal organs, or the retroperitoneum orback of the abdominal cavity (15%).5
In terms of case numbers, the musculoskeletalhealth burden in the United States from softtissue sarcomas is two to three times greater thanthat of bone and joint sarcomas. Soft tissuesarcomas come in a wide variety of forms whichaffect different age groups, but the mostfrequently encountered soft tissue sarcomas affectolder adults.
As previously noted, the National Cancer DataBase (NCDB), a joint program of the Commissionon Cancer and the American College of Surgeons,maintains the most thorough database on theprevalence of soft tissue sarcomas. Although theNCDB was not created to serve as an incidence-based registry currently gathers data onapproximately 75% of the cancers treated in theUnited States. It should be noted this percentagevaries from year to year based on theparticipation and reporting by hospitals to thisvoluntary database.
Over the past 20 years, 86,355 soft tissue sarcomasof the extremities, shoulders and pelvic girdles
The Burden of Musculoskeletal Diseases in the United States - Copyright © 2008 179
Neoplasms of Bone and Connective Tissue Chapter 8
Graph 8.3.4: Malignant Bone Tumors in Persons Youngerthan 30 Years of Age, United States 1975-2000
Source: Mascarenhas L, Siegel S, Spector L,et al: Malignant bone tumors, in Bleyer A,O'Leary M, Barr R, Ries LAG (eds): CancerEpidemiology in Older Adolescents and YoungAdults 15 to 29 Years of Age, Including SEERIncidence and Survival: 1975-2000. Bethesda,MD: National Cancer Institute, NIH Pub.No. 06-5767, p 101.

and trunk have been treated. This numberexcludes approximately 32,250 soft tissuesarcomas of the head and neck, thoracic, andabdominal areas; these patients are generallycared for by non-musculoskeletal specialists.Using a 20-year average and assuming 75% ofannual cases are included in NCDB, over 5,700cases of soft tissue sarcoma have been reportedannually.
In the 5 years between 2000-2004, soft tissuesarcomas, including those of the head, neck,thoracic, and abdominal areas, averaged 8,700cases per year, and represented approximately0.7% of all cancer cases.6 This compares to anaverage of 2,700 cases of bone and joint sarcomas,(0.2% of all cancer cases.) (Table 8.8)
In 2007, it is expected about 9,220 new soft tissuesarcomas will have been diagnosed in the UnitedStates. Of these, 5,050 cases will be diagnosed inmales, and 4,710 cases will be diagnosed infemales. During 2007, it is expected 3,560Americans (1,840 males and 1,720 females) willdie of soft tissue sarcomas. These statisticsinclude both adults and children.7
Section 8.5.1: Soft Tissue Sarcoma Survival Rates
For high-grade soft tissue sarcomas, the mostimportant prognostic factor is the stage at whichthe tumor is identified. Staging criteria for softtissue sarcomas are primarily determined bywhether the tumor has metastasized or spreadelsewhere in the body. Size is highly correlatedwith risk of metastasis and survival. In general,the prognosis for a soft tissue sarcoma is poorer ifthe sarcoma is large. As a general rule, high-gradesoft tissue sarcomas over 10 centimeters indiameter have an approximate 50% mortality rateand those over 15 centimeters in diameter havean approximate 75% mortality rate.
The National Cancer Institute (NCI) has reportedthe overall 5-year relative survival of people withsarcomas is approximately 66%. The NCIstatistics staging classification of sarcomas is (1)confined to the primary site (localized—54% ofsarcomas are diagnosed at this stage), (2) spreadto regional lymph nodes or directly beyond theprimary site (regional—22%), or (3) metastasized(distant—15%). For the remaining cases, thestaging information was unknown. Thecorresponding 5-year relative survival ratesreported are 84% for localized sarcomas; 62% forregional stage sarcomas; 16% for sarcomas withdistant spread; and 54% for unstaged sarcomas.The 10-year relative survival rate is only slightlyworse for these stages, meaning that most peoplewho survive 5 years are cured.8
Using the staging criteria of soft tissue sarcomasof the American Joint Committee on Cancer(AJCC) produces similar results for sarcomasfound in the limbs (arms or legs): 90% 5-yearsurvival rate for stage 1 sarcomas; 81% for stage 2;and 56% for stage 3. Sarcomas identified as stage4 have a very low 5-year survival rate. Sarcomaslocated in other than a limb also have lowersurvival rates.8
Comparing soft tissue sarcomas by stage to themost common types of cancer shows a relativelyhigh proportion of cases that are not identifieduntil stage 3 or stage 4. (Table 8.8 and Graph8.5.1)
Section 8.5.2: Types of Soft Tissue Sarcoma
There are multiple soft tissue sarcomas withvarying degrees of aggressive behavior (Table8.9), but virtually all have the capacity tometastasize and cause death. Treatment for high-grade soft tissue sarcomas is typically resection(removal) and radiation. Chemotherapy isplaying an ever-increasing role, especially inhigh-grade and metastatic cases.
The Burden of Musculoskeletal Diseases in the United States - Copyright © 2008
Chapter 8 Neoplasms of Bone and Connective Tissue
180

The most commonly encountered soft tissuesarcoma is malignant fibrous histiocytoma, atumor of the fibrous tissue most often occurringin the arms or legs. The least differentiated of thesarcomas, in many cases it represents a poorlydefined, high-grade soft tissue sarcoma thatcannot be further defined pathologically(histologically). A recent trend is to classify thesepoorly differentiated sarcomas as pleomorphic orspindle cell sarcomas “not otherwise specified,(NOS).“ Poorly differentiated sarcomas typicallyaffect older individuals.
The next most commonly reported soft tissuesarcoma is liposarcoma, malignant tumors of thefat tissues. This sarcoma also is more common inolder persons. There are several subtypes rangingfrom the low-grade lipoma, such as liposarcomathat rarely metastasizes, to the high-gradepleomorphic liposarcoma and round cellliposarcoma, which have a prognosis similar tomalignant fibrous histiocytoma.
The third most commonly encountered soft tissuesarcoma is synovial sarcoma, which is more likelyto affect younger adults than previouslymentioned sarcomas. Many of these cases
respond very favorably tochemotherapy with significantshrinkage of the tumor, althoughresection and radiation remainthe cornerstones of currenttherapy. The prognosis is similarto malignant fibrous histiocytomaand the other high-grade softtissue sarcomas mentioned above.
Rhabdomyosarcomas areprimarily tumors of children.Clinically and behaviorally theyare in a class by themselves. Theseare treated with aggressivechemotherapy, as well as surgeryand/or radiation in many cases.
The aggressive treatments often cause permanentlife-altering disability, even in survivors.
Section 8.6: Benign Bone Tumors
In addition to the burden of malignant bone andsoft tissue tumors, a plethora of benign tumorsand tumor-like conditions disable thousands ofAmericans annually. (Table 8.10) No nationaldatabases on which to base estimates of theprevalence or incidence of such tumors exist. Therelative frequency of more common benign bonetumors can be discerned from prior publicationsand extrapolation from the primary contributor’songoing case registry of consecutive surgicalcases treated between 1991 through 2004. Table8.11 reflects the collected experience reported inthe Mayo Clinic publication of 1986, theUniversity of Florida publication from 1983, the J.Mirra experience reported in 1989, and the mostrecent updated case series reflecting the practiceof William G. Ward, a full-time orthopaediconcologist in practice from 1991 to 2004 at WakeForest University Health Sciences in Winston-Salem, NC.
The Burden of Musculoskeletal Diseases in the United States - Copyright © 2008 181
Neoplasms of Bone and Connective Tissue Chapter 8
Graph 8.5.1: Site by Stage Distribution of Cases Reported to the NationalCancer Data Base, Diagnosis Years 2000-2004
Source: National Cancer Data Base (NCDB). Site by StageDistribution of Cases Reported to the NCDB: Diagnosis Years 2000to 2004. American College of Surgeons Commission on Cancer.Available at: h�p://www.facs.org/cancer/ncdb/publicaccess.html. Accessed October 10, 2007.

It is believed that the experience of Dr. Ward, oneof few orthopaedic oncologists in the state ofNorth Carolina, is reflective of the current generalprevalence of bone and soft tissue tumors as hetreats a wide variety of benign and malignantbone tumors in a broad referral practice. All casesin his case registry reflect recently treatedpatients, i.e., none were “consult cases” in whichonly radiographs or pathology slides werereviewed for outside consulting physicians, suchas the Mayo and Mirra series included. Theearlier data sets were accumulated during timeperiods prior to the full development of thesubspecialty of orthopaedic oncology; thus, onlythe more unusual cases of bone tumors werereferred to major medical centers, makingestimates of their incidence less reliable. It isbelieved that, except for bone cysts, few bonetumors have been treated by general orthopaedicsurgeons or other musculoskeletal specialists inNorth Carolina over the past 15 years, as most arereferred to orthopaedic oncologists. Practicalexperience has confirmed that osteosarcoma isthe least likely sarcoma to be treated by anyoneother than an orthopaedic oncologist. Dr. Wardand a few other orthopaedic oncologists havetreated nearly all patients with an osteosarcomain North Carolina for the past 15 years. Very fewbenign bone tumors have been treated by generalorthopaedic surgeons. Thus, comparing the casesof benign bone tumors relative to the cases ofosteosarcoma treated by Dr. Ward provides arelative index useful in generating a broadestimate of the prevalence of these tumors. Bycomparing this estimate with the nationalestimate for the annual occurrence ofosteosarcoma, the most commonly encounteredprimary sarcoma of bone, a rough estimate of theprevalence of these benign bone tumor diseasescan be calculated.
The most commonly encountered benign tumorof bone is osteochondroma, estimated to have an
annual prevalence of >1,500 cases.Osteochondroma typically arises near the longends of bones. Osteochondromas are oftenpainful due to formation of bursa overlying thelesion, interference with neurovascular functiondue to tenting of such structures over theosteochondroma surface, and the potential fordeformity in the involved and/or adjacent bones.Long-term complications are uncommon exceptfor rare cases of dedifferentiation into achondrosarcoma. There is no estimate of thenumber of patients seen with non-operativelymanaged osteochondroma, as records are keptonly for surgically treated cases managed by Dr.Ward. The prevalence of osteochondroma, thus, isan estimate of only those cases requiring surgery.The estimate is further underestimated due to thefact that some general orthopaedic surgeonsprovide surgical treatment of osteochondromas.
The second most commonly encountered benignbone lesions are unicameral bone cysts, with anestimated annual prevalence of >1,250 cases. Theetiology of these fluid-filled bone cysts, usuallyfound in the growing ends of children’s longbones such as the proximal humerus or femur, isunclear. Because they never metastasize and areusually quite characteristic on radiographs, manyof these are treated by other orthopaedicsurgeons. The true incidence, therefore, isprobably significantly higher than that estimatedby extrapolation from Dr. Ward’s practiceexperience. These cystic lesions cause weakeningof the bone and often require multiple surgeriesto rebuild the bone with bone grafts, injections,and other techniques. They occur in children andtypically recur multiple times until skeletalmaturity is achieved.
Giant cell tumor of bone, with an estimatedannual prevalence of >750 cases, is the third mostcommonly encountered benign bone neoplasm,and accounts for significant disability and
The Burden of Musculoskeletal Diseases in the United States - Copyright © 2008
Chapter 8 Neoplasms of Bone and Connective Tissue
182

dysfunction. This bone-destroying tumortypically occurs near the end of the long bones,most commonly the lower femur or upper tibia,and causes destruction of the bone. The tumormay extend through the cortex of the bone intothe soft tissues and, if large enough, prior totreatment can be associated with pathologicfracture of the involved bone. Smaller tumors canbe treated with resection and reconstruction ofthe bone with bone graft or cement filler. Morecomplicated cases require sophisticatedreconstruction with massive joint replacementsand/or massive allografts and can cause severelong-term disability. On rare occasions, giant celltumors can metastasize to the lungs. In suchcases, they typically respond poorly tochemotherapy and may cause death. Thesetumors are infrequently treated by generalorthopaedic surgeons.
A fourth commonly encountered tumor thatrequires surgery is enchondroma, estimated atmore than 725 annual cases. Bones typically formas cartilage models in embryos that ultimatelyconvert into bone structure. The cartilage-basedgrowth plates add length to the bones from bonegrowth. Enchondromas are basically tumorsderived from these cartilaginous tissues thatabnormally remain in the skeleton as remnantsfrom the normal pattern of maturation anddevelopment. If these achieve sufficient size, theycan cause pain or bony erosion and may presentdiagnostic challenges requiring biopsy. Theyoften require treatment by curettage and bonegrafting. These lesions can dedifferentiate intomalignant cartilage tumors, calledchondrosarcomas. Many small enchondromas areseen incidentally, cause no symptoms, and aretreated with simple observation. Only thesurgically treated cases were recorded in Dr.Ward’s series, so the total incidence ofenchondromas is much higher than that shown.The burden of enchondromas requiring surgical
treatment is fairly accurately and conservativelyestimated.
There are multiple other benign tumors that areeven less commonly encountered. Aneurysmalbone cysts (ABCs) are more aggressive forms ofcystic lesions similar to unicameral bone cysts.However, ABCs are more destructive, expandingthe weakened bone and causing greater bonedestruction. They tend to be filled with blood andtissue, not simple fluid. They usually respondfavorably to curettage and bone grafting, butrecur in at least 20% of cases. Metaphyseal fibrousdefects are deficiencies in normal bone formationwithin the various bones that occur in 2% to 3% ofof children. Most resolve without ever causingsymptoms and may never even be detected, butmany require surgery, such as bone grafting, toprevent fracture and/or surgery to treatcompleted fractures that have occurred. Osteoidosteoma is a small tumor typically occurring inchildren that is associated with severeunrelenting night pain. It usually requiresresection and may require bone grafting. Whenlocated in the spine it can cause a painfulscoliosis. More recently, successful treatment withradio-frequency ablation procedures underradiographic guidance has become the treatmentof choice for accessible lesions. Chondroblastomais an unusual neoplasm that occurs in the ends ofgrowing bones in teenagers and young adults.This requires resection of the lesion and bonegrafting. If untreated, it can cause collapse anddegenerative arthritis in the associated joint andon rare occasion can metastasize to the lung.These usually are referred to orthopaediconcologists. Numerous other less common benignbone tumors often are treated similar to giant celltumors, ABCs, or chondroblastomas withcurettage, resection and bone grafting. Mostcause some degree of disability and dysfunctionof the involved extremity.
The Burden of Musculoskeletal Diseases in the United States - Copyright © 2008 183
Neoplasms of Bone and Connective Tissue Chapter 8

Section 8.7: Benign Soft Tissue Tumors
As with the benign bone tumors, there is nonational registry of benign soft tissue tumors. Bycomparing Dr. Ward’s 13 years of practice historyfrom 1991 to 2004, and computing an incidenceindex relative to that of osteosarcoma, someestimate of the prevalence of surgically treatedlesions may be obtained. (Table 8.12) From thisindex estimate, a baseline estimate of the nationalincidence can be calculated. However, benign softtissue tumors are the most likely category oftumors to be treated by other surgeons, such asgeneral orthopaedic surgeons and generalsurgeons; therefore, this national estimate isextremely conservative. The prevalence andburden in the United States from benign softtissue tumors is significantly higher thanestimated herein.
The majority of benign soft tissue tumors causelocal growth and may require resection. Benignlesions rarely cause death, and it is quiteinfrequent that an amputation is required.However, depending on the site of involvementand size of the lesion, significant disability of theinvolved extremity and/or joint can occur. Thetrue cost of these otherwise benign neoplasms canbe quite high in terms of healthcare costs, lostwork time, morbidity, emotional cost, anddisability expenses.
A summary of “Neoplasms of the Bones & Jointsand So� Tissues, 20-Year Cumulative CaseCounts, 1985-2004, National Cancer Data Base ofthe American College of Surgeons Commissionon Cancer” is shown in Table 8.13.
1. Ries LAG, Melbert D, Krapcho M, et al, (eds): SEERCancer Statistics Review, 1975-2004. Bethesda, MD:National Cancer Institute: 2006. Available at:h�p://seer.cancer.gov/csr/1975_2003/. Accessed June 19,2007.
2. Praemer A Furner S, Rice DP: Musculoskeletal Conditionsin the United States. ed 2. Rosemont, IL: AmericanAcademy of Orthopaedic Surgeons, 1999, p 182.
3. Damron TA, Ward WG, Stewart A: Osteosarcoma,chondrosarcoma and Ewing’s sarcoma: National CancerCenter Data Base Report. Clin Orthop Relat Res2007;459:40-47.
4. Grimer RJ, Carter SR, Pynsent PB: The cost-effectivenessof limb salvage bone tumours. J Bone Joint Surg Br1997;79:558-561.
5. National Cancer Society (NCS): What Is a Soft TissueSarcoma? Available at: http://www.cancer.org/docroot/cri/content/cri_2_4_1x_what_is_sarcoma_38.asp?sitearea=cri. Accessed October 10, 2007.
6. National Cancer Data Base (NCDB): Site by StageDistribution of Cases Reported to the NCDB: Diagnosis Year2000 to 2004. Chicago, IL: American College of SurgeonsCommission on Cancer. Available at:http://www.facs.org/cancer/ncdb/publicaccess.html.Accessed October 10, 2007.
7. National Cancer Society (NCS): What Are the KeyStatistics About Soft Tissue Sarcoma? Available at:http://www.cancer.org/docroot/CRI/content/CRI_2_4_1X_What_are_the_key_statistics_for_sarcoma_38.asp?rnav=cri. Accessed October 10, 2007.
8. National Cancer Society (NCS): How Are Soft TissueSarcomas Staged? Available at: http://www.cancer.org/docroot/CRI/content/CRI_2_4_3X_How_is_sarcoma_staged_38.asp?rnav=cri. Accessed October 10, 2007.
The Burden of Musculoskeletal Diseases in the United States - Copyright © 2008
Chapter 8 Neoplasms of Bone and Connective Tissue
184
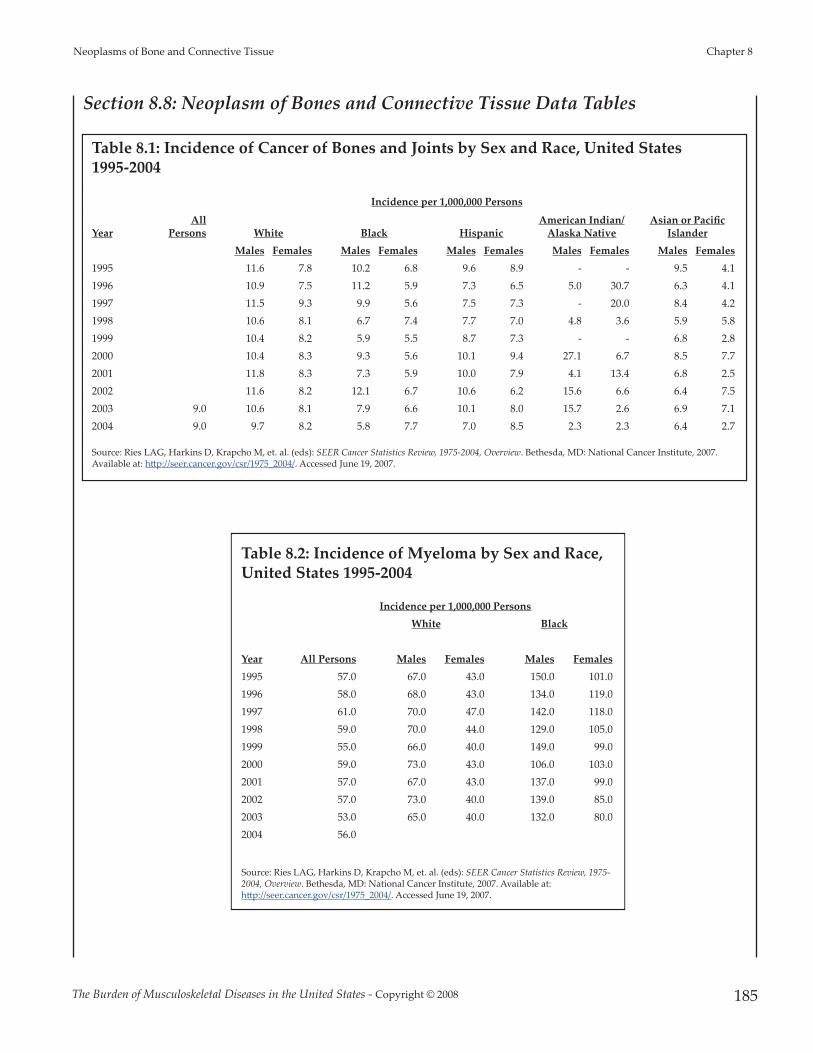
The Burden of Musculoskeletal Diseases in the United States - Copyright © 2008 185
Neoplasms of Bone and Connective Tissue Chapter 8
Section 8.8: Neoplasm of Bones and Connective Tissue Data Tables
Table 8.1: Incidence of Cancer of Bones and Joints by Sex and Race, United States 1995-2004
Incidence per 1,000,000 Persons
YearAll
Persons White Black HispanicAmerican Indian/
Alaska NativeAsian or Pacific
IslanderMales Females Males Females Males Females Males Females Males Females
1995 11.6 7.8 10.2 6.8 9.6 8.9 - - 9.5 4.1 1996 10.9 7.5 11.2 5.9 7.3 6.5 5.0 30.7 6.3 4.1 1997 11.5 9.3 9.9 5.6 7.5 7.3 - 20.0 8.4 4.2 1998 10.6 8.1 6.7 7.4 7.7 7.0 4.8 3.6 5.9 5.8 1999 10.4 8.2 5.9 5.5 8.7 7.3 - - 6.8 2.8 2000 10.4 8.3 9.3 5.6 10.1 9.4 27.1 6.7 8.5 7.7 2001 11.8 8.3 7.3 5.9 10.0 7.9 4.1 13.4 6.8 2.5 2002 11.6 8.2 12.1 6.7 10.6 6.2 15.6 6.6 6.4 7.5 2003 9.0 10.6 8.1 7.9 6.6 10.1 8.0 15.7 2.6 6.9 7.1 2004 9.0 9.7 8.2 5.8 7.7 7.0 8.5 2.3 2.3 6.4 2.7
Source: Ries LAG, Harkins D, Krapcho M, et. al. (eds): SEER Cancer Statistics Review, 1975-2004, Overview. Bethesda, MD: National Cancer Institute, 2007.Available at: h�p://seer.cancer.gov/csr/1975_2004/. Accessed June 19, 2007.
Table 8.2: Incidence of Myeloma by Sex and Race,United States 1995-2004
Incidence per 1,000,000 PersonsWhite Black
Year All Persons Males Females Males Females1995 57.0 67.0 43.0 150.0 101.0 1996 58.0 68.0 43.0 134.0 119.0 1997 61.0 70.0 47.0 142.0 118.0 1998 59.0 70.0 44.0 129.0 105.0 1999 55.0 66.0 40.0 149.0 99.0 2000 59.0 73.0 43.0 106.0 103.0 2001 57.0 67.0 43.0 137.0 99.0 2002 57.0 73.0 40.0 139.0 85.0 2003 53.0 65.0 40.0 132.0 80.0 2004 56.0
Source: Ries LAG, Harkins D, Krapcho M, et. al. (eds): SEER Cancer Statistics Review, 1975-2004, Overview. Bethesda, MD: National Cancer Institute, 2007. Available at:h�p://seer.cancer.gov/csr/1975_2004/. Accessed June 19, 2007.

The Burden of Musculoskeletal Diseases in the United States - Copyright © 2008
Chapter 8 Neoplasms of Bone and Connective Tissue
186
Table 8.3: Median Age [1] of Patients at Diagnosis by Primary Cancer Site by Sex andRace, United States 2000-2003
Median Age at Diagnosis, All Races
Median Age at Diagnosis,Whites
Median Age at Diagnosis,Blacks
Site Total Males Females Total Males Females Total Males FemalesBones & Joints 39.0 37.0 42.0 39.0 37.0 43.0 34.0 34.0 34.5Kaposi's Sarcoma 42.0 41.0 79.0 44.0 42.0 80.0 38.0 37.0 41.0Endocrine System 47.0 52.0 46.0 47.0 52.0 46.0 49.0 51.0 48.0Brain & Nervous System 55.0 54.0 56.0 56.0 55.0 57.0 48.0 48.0 50.0So� Tissue (incl heart) 56.0 56.0 56.0 57.0 58.0 57.0 48.0 45.0 50.0Skin 59.0 62.0 55.0 60.0 63.0 55.0 53.0 53.0 53.5Breast (incl breast in situ) 61.0 67.0 61.0 62.0 67.0 62.0 57.0 62.0 57.0Female Genital System 61.0 NA 61.0 62.0 NA 62.0 60.0 NA 60.0Oral Cavity & Pharynx 62.0 61.0 66.0 63.0 62.0 68.0 57.5 58.0 57.0Lymphoma (Hodgkin and Non-Hodgkin) 64.0 62.0 67.0 65.0 63.0 68.0 52.0 51.0 54.0Leukemia 67.0 66.0 68.0 68.0 67.0 69.0 61.0 59.0 63.0Male Genital System 68.0 68.0 NA 68.0 68.0 NA 65.0 65.0 NAMyeloma 70.0 69.0 72.0 71.0 70.0 73.0 67.0 66.0 68.0Respiratory System 70.0 70.0 70.0 70.0 70.0 71.0 66.0 65.0 66.0Urinary System 70.0 70.0 71.0 71.0 70.0 71.0 65.0 64.0 67.0Digestive system 71.0 69.0 73.0 72.0 70.0 74.0 66.0 65.0 69.0
All Sites 67.0 68.0 66.0 68.0 68.0 67.0 63.0 64.0 62.0
[1] Age-adjusted to the U.S. Standard Population (19 age groups - Census P25-1130)Source: Ries LAG, Harkins D, Krapcho M, et. al. (eds): SEER Cancer Statistics Review, 1975-2003, Overview. Bethesda, MD: National Cancer Institute, 2006.Available at: h�p://seer.cancer.gov/Publications/CSR1975_2003/. Accessed March 19, 2007.
Table 8.4: Age-Adjusted [1] 5-Year Relative Cancer Survival Rates by Sex,United States 2000-2004
5-Year Relative Survival Rate (%, 1996-2003)
Site Total Males Females Male Genital System 98.1 98.1 Endocrine System 93.9 88.3 95.8 Skin 90.8 88.8 93.3 Breast (incl breast in situ) 88.6 85.0 88.6 Urinary System 73.5 75.0 70.2 Female Genital System 69.7 69.7 Bones & Joints 67.9 64.4 72.4 Lymphoma (Hodgkin and Non-Hodgkin) 66.8 64.4 69.7 So� Tissue (incl heart) 66.3 66.6 66.0 Oral Cavity & Pharynx 59.1 57.6 62.6 Kaposi Sarcoma 56.3 55.8 63.7 Leukemia 49.6 49.7 49.4 Digestive system 44.6 42.6 46.8 Brain & Nervous System 33.9 32.2 36.0 Myeloma 33.7 35.5 31.7 Respiratory System 18.5 18.0 19.1
All Sites 64.9 64.6 65.2
[1] Age-adjusted to the U.S. Standard Population (19 age groups - Census P25-1130)Source: Ries LAG, Harkins D, Krapcho M, et al (eds): SEER Cancer Statistics Review, 1975-2004, Overview. Bethesda, MD: NationalCancer Institute, 2007. Available at: h�p://seer.cancer.gov/csr/1975_2004/. Accessed June 19, 2007.
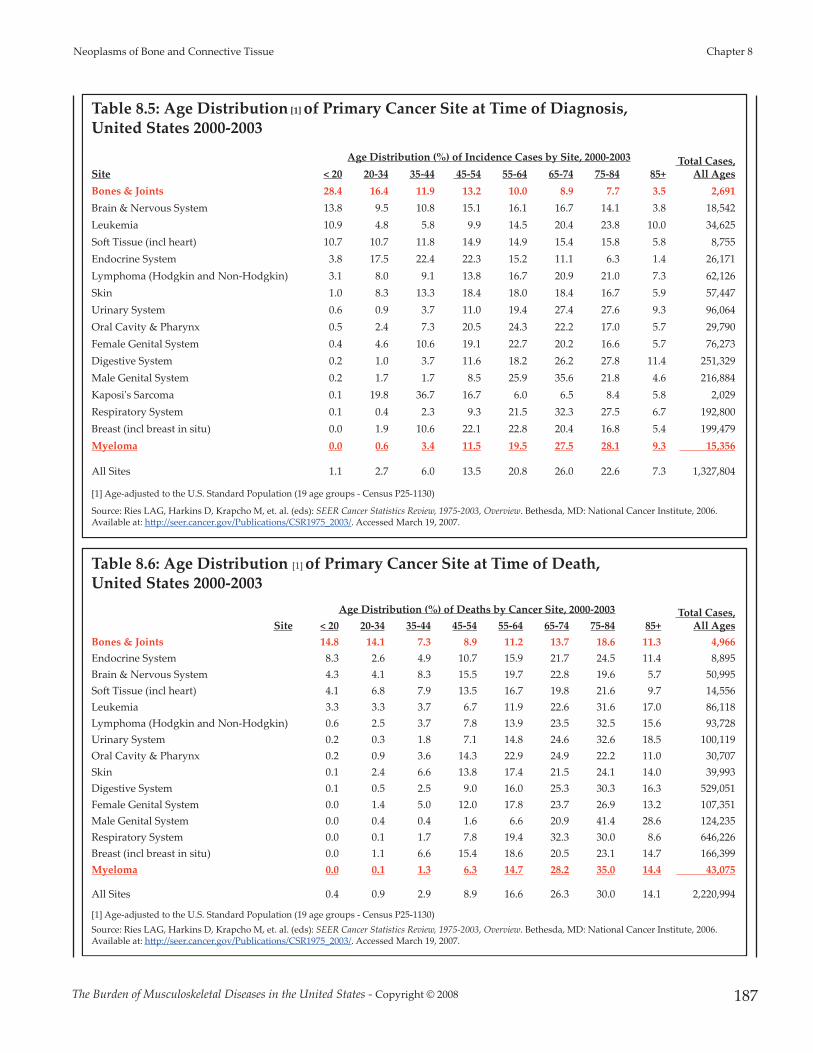
The Burden of Musculoskeletal Diseases in the United States - Copyright © 2008 187
Neoplasms of Bone and Connective Tissue Chapter 8
Table 8.5: Age Distribution [1] of Primary Cancer Site at Time of Diagnosis, United States 2000-2003
Age Distribution (%) of Incidence Cases by Site, 2000-2003 Total Cases, All Ages Site < 20 20-34 35-44 45-54 55-64 65-74 75-84 85+
Bones & Joints 28.4 16.4 11.9 13.2 10.0 8.9 7.7 3.5 2,691 Brain & Nervous System 13.8 9.5 10.8 15.1 16.1 16.7 14.1 3.8 18,542 Leukemia 10.9 4.8 5.8 9.9 14.5 20.4 23.8 10.0 34,625 So� Tissue (incl heart) 10.7 10.7 11.8 14.9 14.9 15.4 15.8 5.8 8,755 Endocrine System 3.8 17.5 22.4 22.3 15.2 11.1 6.3 1.4 26,171 Lymphoma (Hodgkin and Non-Hodgkin) 3.1 8.0 9.1 13.8 16.7 20.9 21.0 7.3 62,126 Skin 1.0 8.3 13.3 18.4 18.0 18.4 16.7 5.9 57,447 Urinary System 0.6 0.9 3.7 11.0 19.4 27.4 27.6 9.3 96,064 Oral Cavity & Pharynx 0.5 2.4 7.3 20.5 24.3 22.2 17.0 5.7 29,790 Female Genital System 0.4 4.6 10.6 19.1 22.7 20.2 16.6 5.7 76,273 Digestive System 0.2 1.0 3.7 11.6 18.2 26.2 27.8 11.4 251,329 Male Genital System 0.2 1.7 1.7 8.5 25.9 35.6 21.8 4.6 216,884 Kaposi's Sarcoma 0.1 19.8 36.7 16.7 6.0 6.5 8.4 5.8 2,029 Respiratory System 0.1 0.4 2.3 9.3 21.5 32.3 27.5 6.7 192,800 Breast (incl breast in situ) 0.0 1.9 10.6 22.1 22.8 20.4 16.8 5.4 199,479 Myeloma 0.0 0.6 3.4 11.5 19.5 27.5 28.1 9.3 15,356
All Sites 1.1 2.7 6.0 13.5 20.8 26.0 22.6 7.3 1,327,804
[1] Age-adjusted to the U.S. Standard Population (19 age groups - Census P25-1130)
Source: Ries LAG, Harkins D, Krapcho M, et. al. (eds): SEER Cancer Statistics Review, 1975-2003, Overview. Bethesda, MD: National Cancer Institute, 2006.Available at: h�p://seer.cancer.gov/Publications/CSR1975_2003/. Accessed March 19, 2007.
Table 8.6: Age Distribution [1] of Primary Cancer Site at Time of Death, United States 2000-2003
Age Distribution (%) of Deaths by Cancer Site, 2000-2003 Total Cases, All Ages Site < 20 20-34 35-44 45-54 55-64 65-74 75-84 85+
Bones & Joints 14.8 14.1 7.3 8.9 11.2 13.7 18.6 11.3 4,966 Endocrine System 8.3 2.6 4.9 10.7 15.9 21.7 24.5 11.4 8,895 Brain & Nervous System 4.3 4.1 8.3 15.5 19.7 22.8 19.6 5.7 50,995 So� Tissue (incl heart) 4.1 6.8 7.9 13.5 16.7 19.8 21.6 9.7 14,556 Leukemia 3.3 3.3 3.7 6.7 11.9 22.6 31.6 17.0 86,118 Lymphoma (Hodgkin and Non-Hodgkin) 0.6 2.5 3.7 7.8 13.9 23.5 32.5 15.6 93,728 Urinary System 0.2 0.3 1.8 7.1 14.8 24.6 32.6 18.5 100,119 Oral Cavity & Pharynx 0.2 0.9 3.6 14.3 22.9 24.9 22.2 11.0 30,707 Skin 0.1 2.4 6.6 13.8 17.4 21.5 24.1 14.0 39,993 Digestive System 0.1 0.5 2.5 9.0 16.0 25.3 30.3 16.3 529,051 Female Genital System 0.0 1.4 5.0 12.0 17.8 23.7 26.9 13.2 107,351 Male Genital System 0.0 0.4 0.4 1.6 6.6 20.9 41.4 28.6 124,235 Respiratory System 0.0 0.1 1.7 7.8 19.4 32.3 30.0 8.6 646,226 Breast (incl breast in situ) 0.0 1.1 6.6 15.4 18.6 20.5 23.1 14.7 166,399 Myeloma 0.0 0.1 1.3 6.3 14.7 28.2 35.0 14.4 43,075
All Sites 0.4 0.9 2.9 8.9 16.6 26.3 30.0 14.1 2,220,994
[1] Age-adjusted to the U.S. Standard Population (19 age groups - Census P25-1130)Source: Ries LAG, Harkins D, Krapcho M, et. al. (eds): SEER Cancer Statistics Review, 1975-2003, Overview. Bethesda, MD: National Cancer Institute, 2006.Available at: h�p://seer.cancer.gov/Publications/CSR1975_2003/. Accessed March 19, 2007.

The Burden of Musculoskeletal Diseases in the United States - Copyright © 2008
Chapter 8 Neoplasms of Bone and Connective Tissue
188
Table 8.7: Annual Distribution of Malignant Bone Tumors and Myelomaby Type and Age, United States, 2000-2003
Annual Prevalence Bone Tumor Cases, 2000-2003 Total MalignantCases,
All Ages < 20 20-34 35-44 55-64 75+
Malignant Bone Tumors
Osteosarcoma 421 154 145 131 65 916
Chrondosarcoma 31 156 390 319 91 987
Ewing's Sarcoma 222 71 34 11 0 339
Other and Unspecified Bone Tumors 34 46 137 117 117 449
Total Malignant Bone Tumors 708 427 705 577 273 2691
Myeloma 0 92 2288 7217 5743 15,341
Proportion (%) of Total Bone Tumor Cases by Type, 2000-2003
Total MalignantCases,
All Ages < 20 20-34 35-44 55-64 75+
Malignant Bone Tumors
Osteosarcoma 46.0% 16.8% 15.8% 14.3% 7.1% 100%
Chrondosarcoma 3.2% 15.9% 39.5% 32.3% 9.2% 100%
Ewing's Sarcoma 65.5% 21.0% 10.1% 3.4% 0.0% 100%
Other and Unspecified Bone Tumors 7.6% 10.1% 30.4% 25.9% 25.9% 100%
Total Malignant Bone Tumors 26.3% 15.9% 26.2% 21.5% 10.1% 100%
Myeloma 0.0% 0.6% 14.9% 47.0% 37.4% 100%
Distribution (%) of Total Bone Tumor Cases by Age, 2000-2003
Total MalignantCases,
All Ages < 20 20-34 35-44 55-64 75+
Malignant Bone Tumors
Osteosarcoma 59.4% 36.0% 20.6% 22.7% 24% 916
Chrondosarcoma 4.4% 36.7% 55.2% 55.2% 33% 987
Ewing's Sarcoma 31.3% 16.7% 4.8% 2.0% 0% 339
Other and Unspecified Bone Tumors 4.8% 10.7% 19.4% 20.2% 43% 449
Total Malignant Bone Tumors 100.0% 100.0% 100.0% 100.0% 100.0% 2691
Source: Surveillance, Epidemiology, and End Results (SEER) Program (www.seer.cancer.gov): Public-Use Data (1973-2003).National Cancer Institute, DCCPS, Surveillance Research Program, Cancer Statistics Branch, released April 2006, based on theNovember 2005 submission. Accessed: March 19, 2007.

The Burden of Musculoskeletal Diseases in the United States - Copyright © 2008 189
Neoplasms of Bone and Connective Tissue Chapter 8
Table 8.8: Site by Stage Distribution of Cases Reported to the National Cancer DataBase, Diagnosis Years 2000 to 2004
Proportion of Total Cases with Known Stage, 2000-2004 Stage
Unknown Total
Cases % of Total
Cases Primary Site Stage 0 Stage I Stage II Stage III Stage IV Breast 18.0% 40.7% 29.9% 7.9% 3.5% 35,762 839,265 17.8%Prostate 0.0% 2.1% 84.1% 8.5% 5.3% 38,727 612,414 13.0%Lung, Bronchus - NSCC 0.3% 25.2% 8.1% 27.7% 38.7% 38,309 490,609 10.4%Colon 7.9% 22.1% 27.5% 24.2% 18.3% 25,862 353,444 7.5%Bladder 50.6% 23.7% 12.7% 6.0% 7.0% 15,466 190,144 4.0%Non-Hodgkins Lymphoma 0.0% 32.0% 17.5% 15.9% 34.6% 35,954 172,269 3.7%Melanoma - Skin 25.8% 43.2% 15.9% 11.0% 4.1% 20,605 158,558 3.4%Uterus 1.4% 70.3% 8.9% 12.5% 6.9% 17,235 139,009 3.0%Kidney and Renal Pelvis 0.0% 52.9% 11.3% 15.0% 20.8% 15,380 132,380 2.8%Rectum 9.1% 31.0% 22.3% 23.3% 14.3% 17,304 109,971 2.3%Pancreas 0.5% 9.0% 15.1% 14.3% 61.1% 17,105 102,399 2.2%Lung, Bronchus - SCC 0.3% 6.7% 4.0% 30.3% 58.7% 9,779 96,167 2.0%
So� Tissue 0.0% 28.3% 30.4% 24.8% 16.6% 12,310 32,622 0.7%
Bones and Joints 0.0% 43.7% 34.6% 2.9% 18.8% 4,339 10,002 0.2%All Cancer Cases 8.8% 27.9% 28.9% 16.0% 18.4% 858,270 4,708,118
Source: National Cancer Data Base (NCDB): Site by Stage Distribution of Cases Reported to the NCDB: Diagnosis Years 2000 to 2004. American College ofSurgeons Commission on Cancer. Available at: h�p://www.facs.org/cancer/ncdb/publicaccess.html. Accessed October 10, 2007.
Table 8.9: Malignant So� Tissue Tumors (Sarcomas)
Tumors of Fat Tissue
Liposarcomase Malignant tumors of fat tissue. They can develop anywhere in the body, but they most o�en develop in the thigh, behind theknee, and inside the back of the abdomen. They occur mostly in adults between 50 and 65 years old. Some liposarcomas growvery slowly, whereas others can grow quickly. Your doctor can tell you which kind you have.
Tumors of Muscle Tissue
Smooth muscle sarcomas (Found in internal organs such as stomach, intestines, blood vessels, or uterus (womb) and causes them tocontract. These muscles are involuntary.)
Leiomyosarcomas Malignant tumors of involuntary muscle tissue. They can grow almost anywhere in the body but are most o�en found in theretroperitoneum and the internal organs and blood vessels where leiomyomas also arise. Less o�en, they develop in the deepso� tissues of the legs or arms. They tend to occur in adults, particularly the elderly.
Skeletal muscle sarcomas (Muscle that allows movement of arms and legs and other body parts voluntary movement.)
Rhabdomyosarcomas Malignant tumors of skeletal muscle. These tumors commonly grow in the arms or legs, but they can also begin in the headand neck area and in reproductive and urinary organs such as the vagina or bladder. Children are affected much more o�enthan adults. For more information, see the American Cancer Society document, "Rhabdomyosarcoma."
Tumors of Peripheral Nerve Tissue Malignant schwannomas,neurofibrosarcomas, orneurogenic sarcomas
Malignant tumors of the cells that surround a nerve. A new name for these is malignant peripheral nerve sheath tumors
Tumors of Joint Tissue Joints are surrounded by tough tissue called synovium, which produces the fluid that lubricates the joint surfaces so that they move smoothly. Tumors of jointsstart in the synovium.
Synovial sarcoma Malignant tumor of the tissue around joints. The most common location is the thigh. Despite the name Synovial Sarcoma, mostdo not occur in joints. It tends to occur mostly in young adults, but can also occur in children and in older people.
Table 8.9 continued next page.

The Burden of Musculoskeletal Diseases in the United States - Copyright © 2008
Chapter 8 Neoplasms of Bone and Connective Tissue
190
Table 8.9: Malignant So� Tissue Tumors (Sarcomas) (continued)
Tumors of Blood Vessels and Lymph Vessels
Hemangiopericytoma A tumor of perivascular tissue. It most o�en develops in the legs, pelvis, and retroperitoneum (the back of the abdominal cavity).It is most common in adults. These can be either benign or malignant. They don’t o�en spread to distant sites, but tend to comeback where they started, even a�er surgery, unless widely excised.
Hemangioendothelioma A blood vessel tumor that is less aggressive than hemangiosarcoma but still considered a low-grade cancer. It usually invadesnearby tissues and sometimes can spread to distant parts of the body (metastasize). It may develop in so� tissues or in internalorgans, such as the liver or lungs.
Angiosarcomas
Malignant tumors that can develop either from blood vessels (hemangiosarcomas) or from lymph vessels (lymphangiosarcomas).These tumors can sometimes develop in a part of the body that has been exposed to radiation. Angiosarcomas are sometimes seenin the breast a�er radiation therapy for breast cancer or in the arm on the same side as a breast that has been irradiated orremoved by mastectomy. They are difficult to cure.
Kaposi’s sarcoma
A cancer formed by cells similar to those lining blood or lymph vessels. In the past, Kaposi’s sarcoma was an uncommon cancermostly seen in older people with no apparent immune system problems. It is most common in people with humanimmunodeficiency virus (HIV) infection and the acquired immunodeficiency syndrome (AIDS), but it can also develop in organtransplant patients who are taking medication to suppress their immune system. It is probably related to infection with a viruscalled human herpesvirus-8 (HHV-8).
Tumors of Fibrous Tissue
Fibrous tissue forms tendons and ligaments and covers bones as well as other organs in the body.
Fibrosarcoma Cancer of fibrous tissue. It usually affects the legs, arms, or trunk. It is most common between the ages of 20 and 60, but can occurat any age, even in infancy.
Fibromatosis
The name given to fibrous tissue tumor with features in between fibrosarcoma and benign tumors such as fibromas andsuperficial fibromatosis. They tend to grow slowly but, o�en, steadily. At one time they were called desmoid tumors, when theywere closely a�ached to skeletal muscles. Now they are called musculoaponeurotic fibromatosis. They do not metastasize, butthey can invade nearby tissues and are sometimes fatal. Some doctors consider these to be a type of low-grade fibrosarcomaothers believe they are a unique type of fibrous tissue tumors. Certain hormones, particularly estrogen, increase the growth ofsome desmoid tumors. Antiestrogen drugs are sometimes useful in treating desmoids that cannot be completely removed bysurgery.
Dermatofibrosarcomaprotuberans (DFSP)
A slow-growing cancer of the fibrous tissue beneath the skin, usually in the trunk or limbs. It invades nearby tissues but rarelymetastasizes.
Malignant fibroushistiocytoma (MFH)
Most o�en found in the arms or legs. Less o�en, it can develop inside the back of the abdomen. This sarcoma is most common inolder adults. Although it mostly tends to grow locally, it can spread to distant sites. It is the most commonly diagnosed so� tissuesarcoma.
Tumors of Uncertain Tissue Type
Through microscopic examination and other laboratory tests, doctors can usually find similarities between most sarcomas and certain types of normal so�tissues. However, some sarcomas have not been linked to a specific type of normal so� tissue.
Malignant mesenchymoma A rare type of sarcoma that contains some areas showing features of fibrosarcoma and other areas with features of at least twoother types of sarcoma.
Alveolar so�-part sarcoma A rare cancer that mostly affects young adults. The legs are the most common location of these tumors.
Epithelioid sarcoma Most o�en develops in tissues under the skin of the hands, forearms, feet, or lower legs. Adolescents and young adults are o�enaffected.
Clear cell sarcoma A rare cancer that o�en develops in tendons of the arms or legs. Under the microscope, it shares some features with malignantmelanoma, a type of cancer that develops from pigment-producing skin cells. How cancers with these features develop in parts ofthe body other than the skin is not known.
Desmoplastic small celltumor
A rare sarcoma of adolescents and young adults, found most o�en in the abdomen. Its name means that it is formed by small,round cancer cells surrounded by scar-like tissue.
Other Types of Sarcoma
There are other types of so� tissue sarcomas, however, they are less commonly encountered.
Source: American Cancer Society. What is a so� tissue sarcoma? 2006 Available at:h�p://www.cancer.org/docroot/cri/content/cri_2_4_1x_what_is_sarcoma_38.asp?sitearea=cri. Accessed October 10, 2007. Editorial revisions provided by William G. Ward, MD

The Burden of Musculoskeletal Diseases in the United States - Copyright © 2008 191
Neoplasms of Bone and Connective Tissue Chapter 8
Table 8.10: Benign So� Tissue Tumors
Tumors of Fat Tissue
Lipomas Benign tumors of fat tissue. They are the most common benign so� tissue tumor. Most are found under the skin, but they candevelop anywhere in the body.
Lipoblastomas Benign fat tumors that occur in infants and young children.
Hibernomas Like lipomas, are also benign fat tissue tumors. They are much less common than lipomas.
Tumors of Muscle Tissue
Smooth muscle sarcomas (Found in internal organs such as stomach, intestines, blood vessels, or uterus (womb) and causes them to contract. These muscles areinvoluntary.)
Leiomyomas Benign tumors of smooth muscle (or involuntary muscle). Leiomyomas can arise almost anywhere in the body in either men orwomen because they can start in tissues as widespread, for example, as blood vessels or intestine. The most common of these isthe fibroid tumor that develops in many women. It is really a leiomyoma of the uterus.
Skeletal muscle sarcomas (Muscle that allows movement of arms and legs and other body parts voluntary movement.)
Rhabdomyomas Benign tumors of skeletal muscle (the muscle that is a�ached to bone and helps us to move). They are rare.
Tumors of Peripheral Nerve Tissue Neurofibromas,schwannomas(neurilemmoma), andneuromas
Benign tumors of nerves. These tumors can occur almost anywhere in the body. An inherited condition called neurofibromatosisor von Recklinghausen disease causes people to develop many neurofibromas throughout their body. Some of these, if theyformed from very large nerves such as those in the upper arms, neck, pelvis or thigh can become malignant.
Tumors of Joint Tissue Joints are surrounded by tough tissue called synovium, which produces the fluid that lubricates the joint surfaces so that they move smoothly. Tumors of jointsstart in the synovium.
Nodular tenosynovitis Benign tumor of joint tissue. It is most common in the hands and is more common in women than in men.
Tumors of Blood Vessels and Lymph Vessels
Hemangiomas Benign tumors of blood vessels. They are rather common, are o�en present at birth, and can affect the skin or internal organs.They sometimes disappear without treatment, but when located in muscles and other deep tissues, can be quite problematic andrequire surgical treatment.
Glomus tumors Benign perivascular (around blood vessels) tumors. They usually are found under the skin and o�en under fingernails.
Hemangiopericytoma A tumor of perivascular tissue. It most o�en develops in the legs, pelvis, and retroperitoneum (the back of the abdominal cavity).It is most common in adults. These can be either benign or malignant. They don’t o�en spread to distant sites, but tend to comeback where they started, even a�er surgery, unless very widely excised.
Lymphangiomas. Benign lymph vessel tumors that are usually present at birth. Lymph is a type of fluid that circulates in every tissue of the body,ending up in the venous system. It contains waste products from tissues and immune system cells. Lymphangiosarcomas are themalignant lymph vessel form of angiosarcomas
Tumors of Fibrous Tissue Fibrous tissue forms tendons and ligaments and covers bones as well as other organs in the body.
Fibromas, elastofibromas,superficial fibromatosis, andfibrous histiocytomas
All are benign tumors.
Tumors of Uncertain Tissue Type Through microscopic examination and other laboratory tests, doctors can usually find similarities between most sarcomas and certain types of normal so�tissues. However, some sarcomas have not been linked to a specific type of normal so� tissue.
Myxoma A benign tumor that usually is located in muscles but does not develop from muscle cells. The cells of a myxoma produce mucus-like material, a feature that distinguishes this tumor. It almost always occurs in adults.
Granular cell Tumors are usually benign tumors of adults that occur o�en in the tongue but can be found almost anywhere in the body.
Tumor-like Conditions of So� Tissue Some conditions of so� tissues are caused by inflammation or injury and can form a mass that looks like a so� tissue tumor. Unlike a true tumor, they do notcome from a single abnormal cell, they have limited capacity to grow or spread to nearby tissues, and never spread through the bloodstream or lymph system.Examples include nodular fasciitis and myositis ossificans, which involve tissues under the skin and muscle tissues, respectively.
Source: American Cancer Society. What is a so� tissue sarcoma? 2006 Available at:h�p://www.cancer.org/docroot/cri/content/cri_2_4_1x_what_is_sarcoma_38.asp?sitearea=cri. Accessed October 10, 2007.

The Burden of Musculoskeletal Diseases in the United States - Copyright © 2008
Chapter 8 Neoplasms of Bone and Connective Tissue
192
Table 8.11: Relative Incidence of Benign Bone Tumors
Column 1 Column 2 Column 3 Column 4 Column 5 Column 6
Benign Bone Tumor Mayo [1] UFLA [2] Mirra [3] Ward [4]
Prevalence Relative to
Osteosarcoma [5]
National Annual
Prevalence[6, 7]
Osteochrondroma 727 98 1937 124 1.65 1,511Unicameral Bone Cyst NA 56 583 102 1.36 1,246 [7]
Giant Cell Tumor 425 107 1182 63 0.84 769 Enchondroma 245 37 829 60 0.80 733 Aneurysmal Bone Cysts 208 80 492 52 0.69 632 Metaphyseal Fibrous Defect 99 30 537 47 0.63 577 [8]
Osteoid Osteoma 245 56 635 25 0.33 302 [7]
Chondroblastoma 79 43 229 14 0.19 174 Chondromyxoid Fibromas 39 27 101 6 0.08 73 Osteoblastoma 63 37 142 2 0.03 27 [7]
Malignant Bone Tumors
Osteosarcoma [9] 1330 324 2525 75 1.00 916Chondrosarcoma 732 173 746 47 0.63 987Ewing's Sarcoma 402 141 871 33 0.44 339
[1] Source: Dahlin DC, Unni KK: Introduction and Scope of Study in Bone Tumors: General Aspects and Data on 8,542 Cases. Springfield, IL: Charles C. Thomas Co,1986, pg 8, Table 1-1.
[2] Source: Enneking WF: Musculoskeletal Tumor Surgery, vol II. New York, NY: Churchill Livingstone, New York, 1983.
[3] Source: Mirra JM, Picci P, Gold RH (eds): Bone Tumors: Clinical, Radiologic and Pathologic Correlations. Philadelphia, PA: Lea & Febiger, 1989.
[4] Ward WG. Surgical case files, 1991-2004
[5] Ward WG. Computation of relative prevalence based on n=75 cases of osteosarcoma (i.e., (column 4)/(75)).
[6] Calculated as annual prevalence of cases relative to osteosarcoma (i.e., column 5 * national cases of osteosarcoma ( n = 916)).
[7] Gross underestimate due to high frequency of treatments rendered by orthopaedic surgeons other than orthopaedic oncologists.
[8] Gross underestimate of prevalence since prior studies have indicated 1%-3% of children have these at some point in their childhood. Of the symptomaticones requiring surgery, many are managed by orthopaedists other than orthopaedic oncologists, so true incidence is vastly higher than that depicted by thisconservative estimate.
[9] The national prevalence of osteosarcoma between 2000 and 2003 was 916 cases. (Table 8.7) This value is used as the base for computing the estimatednational prevalence of benign bone tumors.

The Burden of Musculoskeletal Diseases in the United States - Copyright © 2008 193
Neoplasms of Bone and Connective Tissue Chapter 8
Table 8.12: Surgically Treated Benign So� Tissue Tumor Incidence
Tumor Number [1]Incidence Relative to
Osteosarcoma [2]Minimal Estimated
National Incidence [3]
Lipoma 182 2.43 2,226 Ganglion 95 1.27 1,163 Hemangioma 51 0.68 623 Pigmented Villonodular
Synovitis/Giant CellTumor of Tendon Sheath 45 0.60 550
Myxoma 38 0.51 467 Desmoid/Fibromatosis 39 0.52 476 Neurilemmoma 30 0.40 366 Neurofibroma 19 0.25 229 Myositis Ossificans 14 0.19 174 Fibroma 14 0.19 174 Other 293 3.91 3,582
[1] Ward WG: case series 1991-2004 by patients
[2] Ward WG: Computation of relative prevalence based on n=75 cases of osteosarcoma (i.e., (number/75).
[3] Calculated as annual prevalence of cases relative to osteosarcoma (i.e., column 2 * national cases of osteosarcoma ( n = 916)). Thisprovides a gross underestimate of the US national burden of these tumors, as many (perhaps most) are treated by other physicians,including family physicians, general surgeons and general orthopaedic surgeons.

The Burden of Musculoskeletal Diseases in the United States - Copyright © 2008
Chapter 8 Neoplasms of Bone and Connective Tissue
194
Table 8.13: Neoplasms of the Bones, Joints and So� Tissues, 20-Year Cumulative CaseCounts, 1985-2004, National Cancer Data Base of the American College of SurgeonsCommission on CancerBone & Joint Tumors Number So� Tissue Tumors by Type (continued) Number Total Bone Chondrosarcomas 11,585 Clear Cell Sarcoma 809 Total Bone & Joint Osteosarcomas 14,191 Dermatofibrosarcoma, NOS 2,956
Desmoplastic Small Round Cell Tumor 162 Bone & Joint Tumors by Type Epithelioid Sarcoma 1,271 Adamantinoma of Long Bones 196 Ewing's Sarcoma 1,113 Chondrosarcoma Dedifferentiated 238 Fibromyxosarcoma 1,523 Chondrosarcoma Juxtacortical 103 Fibrosarcoma Infantile 193 Chondrosarcoma Mesenchymal 251 Fibrosarcoma, NOS 3,421 Chondrosarcoma Myxoid 874 Giant Cell Sarcoma 1,660 Chondrosarcoma, NOS 10,119 Giant Cell Tumor of So� Parts Malignant 132 Chordoma 2,339 Granular Cell tumor Malignant 106 Ewing's Sarcoma 5,882 Hemangioendothelioma Malignant 162 Fibrosarcoma, NOS 405 Hemangioendothelioma Malignant Epithelioid 171 Giant Cell Tumor of Bone Malignant 606 Hemangiopericytoma Malignant 986 Hemangioendothelioma Malignant 141 Hemangiosarcoma 3,345 Hemangiosarcoma 322 Kaposi Sarcoma 2,914 Leiomyosarcoma 161 Leiomyosarcoma* 13,719 Malignant Fibrous Histiocytoma 1,266 Leiomyosarcoma Epithelioid* 629 Osteosarcoma Chondroblastic 1,564 Leiomyosarcoma Myxoid* 274 Osteosarcoma Fibroblastic 676 Liposarcoma Mixed 627 Osteosarcoma in Pagets Disease of Bone 285 Liposarcoma Myxoid 6,026 Osteosarcoma Parosteal 756 Liposarcoma Pleomorphic 2,288 Osteosarcoma Small Cell 120 Liposarcoma Round Cell 612 Osteosarcoma Telangiectatic 354 Liposarcoma Well Differentiated 3,989 Osteosarcoma, NOS 10,436 Liposarcoma, NOS 3,551 Primitive Neuroectodermal Tumor 213 Lipsosarcoma Dedifferentiated 1,013 Sarcoma, NOS 668 Malignant Fibrous Histiocytoma 25,559 Spindle Cell Sarcoma 338 Mesenchymoma Malignant 253 Total 38,313 Myxosarcoma 363
Neurilemmoma Malignant 1,343 So� Tissue Tumors Number Neurofibrosarcoma 1,583 So� Tissue Malignant Hemangioendothelioma 333 Osteosarcoma, NOS 571 So� Tissue Chondrosarcomas 1,711 Peripheral Neuroectodermal Tumor 386 So� Tissue Rhabdomyosarcomas 5,092 Primitive Neuroectodermal Tumor 581 So� Tissue Synovial Sarcomas 5,689 Rhabdomyosarcoma Alveolar 1,419 So� Tissue Leiomyosarcomas* 14,622 Rhabdomyosarcoma Embryonal 1,801 So� Tissue Liposarcomas 18,106 Rhabdomyosarcoma, NOS 1,316
Rhabdomysarcoma Pleomorphic 556 So� Tissue Tumors (by Type) Sarcoma Rhabdoid 140 Alveolar So� Part Sarcoma 517 Sarcoma, NOS 9,007 Carcinosarcoma, NOS 187 Small Cell Sarcoma 501 Chondrosarcoma Mesenchymal 227 Spindle Cell Sarcoma 4,181 Chondrosarcoma Myxoid 750 Synovial Sarcoma Biphasic 1,116 Chondrosarcoma, NOS 734 Synovial Sarcoma Spindle Cell 1,168 Chordoma 303 Synovial Sarcoma, NOS 3,405
* Totals include Gynecologic Leiomyosarcomas of the Uterus
Source: American College of Surgeons National Cancer Data Base

Chapter 9
Health Care Utilization and Economic Cost ofMusculoskeletal Diseases
The Burden of Musculoskeletal Diseases in the United States - Copyright © 2008 195
The annual average proportion of the UnitedStates population with a musculoskeletal diseaserequiring medical care has increased by morethan two percentage points over the past decadeand now includes more than 30% of thepopulation. The increasing prevalence ofmusculoskeletal diseases in a growing and agingpopulation has resulted in a more than 41%increase in total aggregate direct cost to treatpersons with a musculoskeletal disease. For theyears 2002-2004, the annual average direct cost, in2004 dollars, for musculoskeletal health care, bothas a direct result of a musculoskeletal disease andfor patients with a musculoskeletal disease inaddition to other health issues, is estimated to be$510 billion, the equivalent of 4.6% of the nationalgross domestic product (GDP). Incrementalmedical cost, that proportion of total direct costassociated with treatment incurred beyond that ofpersons of similar demographic and healthcharacteristics but who do not have one or moremusculoskeletal diseases (i.e., most likelyattributable to a musculoskeletal disease), isestimated to be $156.7 billion.
Indirect cost, expressed primarily as wage lossesfor persons aged 18 to 64 with a work history, addanother $339 billion, or 3.1% of the GDP, to thecost for all persons with a musculoskeletaldisease, either treated as a primary condition orin addition to another condition. The 2002-2004annual indirect cost estimated to be associatedwith persons treated only for a musculoskeletaldisease (incremental cost) is $110.5 billion.
Hence, the annual estimated direct and indirectcost associated with persons with a
musculoskeletal disease, but not treated for otherconditions, is $267.2 billion. Taking into accountall persons with a musculoskeletal disease inaddition to other medical conditions, the cost fortreatment in the 2002-2004 time period wasestimated to be $849 billion per year.
Treatments that mitigate the long-term impact ofmusculoskeletal diseases and return persons tofull and active lives are needed. The followingchapter explores the details of cost associatedwith musculoskeletal diseases and establishes abaseline against which to assess future needs.
Section 9.1: Musculoskeletal DiseasePrevalence
Over the period 2002-2004, an estimated 87.6million persons reported a musculoskeletaldisease in the Medical Expenditures Panel Survey(MEPS) as a primary health concern (Table 9.1and Graph 9.1.1), a substantially lower numberthan the 107.7 million musculoskeletal diseasesself-reported by adults aged 18 and over in the
Graph 9.1.1: Prevalence of Musculoskeletal Diseases andPercent of Total Population, United States 1996-2004
Source: Medical Expenditures Panel Survey (MEPS), Agency for HealthcareResearch and Quality, U.S. Department of Health and Human Services, 1996-2004

National Health Interview Survey (NHIS) in 2005and reported in Chapter 1 (Burden ofMusculoskeletal Disease Overview.) A moreexpansive definition of musculoskeletal diseasesincludes persons in whom the musculoskeletaldisease is a byproduct of another condition and,therefore, is often not the primary (1st) diagnosis(e.g., bone metastases from cancer), as well asmusculoskeletal diseases as a primary healthconcern. Using this more expansive definition ofmusculoskeletal diseases (discussed in Section 9.5and Table 9.15), an average of 135.6 millionpersons, or 46.6% of the population, reported amusculoskeletal disease annually for the years2002 to 2004. Assuming the proportion ofmusculoskeletal diseases among persons underthe age of 18 is at least 10%, the incidence ofmusculoskeletal diseases in the NHIS and MEPSare similar.
Between 1996-1998 and 2002-2004, the number ofpersons reporting a musculoskeletal diseaseincreased nearly 12 million from the 76 millionreported in 1996. During this same time period,the prevalence of musculoskeletal diseases in thetotal U.S. population increased by about 2%, from28% to 30%. (Table 9.1 and Graph 9.1.1)
Approximately 10% of all persons reportingmusculoskeletal diseases in MEPS are under theage of 18, primarily due to the higher prevalenceof musculoskeletal injuries (21%) in this agegroup. (Table 9.1 and Graph 9.1.2) Roughly one infour (23%) musculoskeletal diseases occur inpersons aged 65 and over. A relatively highproportion (54%) of the category that includesosteoporosis, “Other Disorders of Bone andCartilage,” occurs in this age group. In contrast,the proportion of injuries and spine conditionsare significantly lower in in persons aged 65 andover (14% and 17%, respectively). Approximatelyone-third (34%) of musculoskeletal diseases occuramong persons aged 45 to 64, yet this groupaccounts for 42% of the arthritis and joint pain
conditions. Overall, more than 75% ofmusculoskeletal diseases are reported by personsunder the age of 65.
Among the major subgroups of musculoskeletaldiseases, arthritis and joint pain have the highestprevalence, reflecting the overall agingpopulation. In 1996-1998, just under 30 millionpersons (11.0%) reported one or more conditionsrelated to arthritis and joint pain; by 2002-2004,37.6 million persons (12.9%) reported one or moresuch conditions. The effect of the baby boomgeneration aging has been an increase in theproportion of arthritis cases among those aged 45to 64 as they reach the typical age of onset ofarthritis. As this wave ages, the proportion ofpersons with arthritis in the 65 and older groupwill increase as well. In 1996-1998, 24.8% ofpersons reporting arthritis were aged 18 to 44;36.4% were aged 45 to 64. By 2002-2004, theproportions had changed to 21.7% and 41.6%,respectively. In the next decade, a higherprevalence of arthritis and joint pain is expectedto occur in persons aged 65 and over.
The number of persons reporting a spinecondition increased by just under 5 million, from27.4 million in 1996-1998 to 32.7 million in 2002-
The Burden of Musculoskeletal Diseases in the United States - Copyright © 2008
Chapter 9 Health Care Utilization and Economic Cost of Musculoskeletal Diseases
196
Graph 9.1.2: Age Distribution of Musculoskeletal Diseases,United States 2002-2004
Source: Medical Expenditures Panel Survey (MEPS), Agency for HealthcareResearch and Quality, U.S. Department of Health and Human Services, 2002-2004

2004, while the prevalence rate increased by morethan one percentage point, from 10.1% to 11.3% ofthe population. The majority of spine conditionsoccur in working age people, with 42% amongpersons aged 18 to 44 and another 37% amongthose aged 45 to 64. The higher prevalence rateamong working age persons is reflected in theprominence of spine conditions in workers’compensation and disability claims. Nevertheless,about one in six spine conditions (17%) occursamong persons 65 and older.
Population aging has also led to a dramaticincrease in the prevalence of the category thatincludes osteoporosis. In the period 1996-1998, 3.2million people (1.2%) indicated they had theseconditions, but by 2002-2004, 6.8 million (2.3%)reported having them. These numbers aresubstantially lower than the 8.9 million personswith self-reported osteoporosis presented inChapter 5 (Osteoporosis and Bone Health), eventhough the category in this chapter is not limitedto osteoporosis-related conditions, and by theNational Osteoporosis Foundation, whichprojected 44 million persons with osteoporosis in2002. Almost two-fifths of persons in the MEPSwith these conditions are aged 45 to 64,increasing the likelihood that the more than twoand a half million individuals in this age groupwill suffer from falls and fractures for therelatively long future they can expect to live.
In contrast to spine conditions, arthritis, and jointpain, and the category including osteoporosis, theprevalence of musculoskeletal injuries hasremained steady. In 1996-1998, 23.4 millionpersons reported a musculoskeletal injury, while24.7 million reported such an injury in 2002-2004.The prevalence of musculoskeletal injuriesremained relatively constant at 7.7% and 8.6% ofthe population. Age distribution of injuries mayexplain why the prevalence hasn’t increased. Inexcess of 60% of injuries occur among persons
younger than 45, a population segment growingmore slowly than those who are older. It ispossible improvements in the safety ofautomobiles and other public health preventionactivities have also played a role. However,although the MEPS reporting of musculoskeletalinjury trends supports trend data previouslyreported, the overall prevalence is substantiallylower than the 57.2 million injury treatmentincidents reported in Chapter 6 (MusculoskeletalInjuries) reported previously included total casestreated in doctors’ offices, outpatient clinics,emergency rooms, and inpatient admissions.
The percentage of the population reporting othermusculoskeletal diseases, which include a broadrange of conditions of less frequent prevalence,increased from 4.4% to 5.0% between 1996-1998and 2002-2004. The total number of personsreporting one or more such conditions increasedfrom 12 million to 14.5 million.
Over the period 1996-2004, the proportion ofpersons with one or more of the major subgroupsof musculoskeletal diseases, with the exception ofinjuries, has risen. Throughout the period under
The Burden of Musculoskeletal Diseases in the United States - Copyright © 2008 197
Health Care Utilization and Economic Cost of Musculoskeletal Diseases Chapter 9
Graph 9.1.3: Specific Musculoskeletal Diseases Reportedby Persons as a Proportion of Total Population, United States 1996-2004
Source: Medical ExpendituresPanel Survey (MEPS), Agencyfor Healthcare Research andQuality, U.S. Department ofHealth and Human Services,1996-2004.

study, arthritis and joint pain has been the majorcondition subgroup with the highest prevalencerate, followed by spine conditions (Table 9.1 andGraph 9.1.3).
Using the more expansive definition ofmusculoskeletal diseases (Table 9.15), in theperiod 2002-2004, 83.0 million persons (vs. 32.7million using the more conservative definition)reported one or more spine conditions and 41.7million (vs. 37.6 million) reported arthritis andjoint pain. The number reporting a conditionwithin the category that includes osteoporosiswas identical in the base and expansive cases, butsubstantially lower than reported in Chapter 5, asnoted above. The number reportingmusculoskeletal injuries was slightly higher thanin the more conservative definition (27.8 vs. 24.7million). The increased prevalence in the “other”musculoskeletal diseases category was alsosubstantial, with 45.1 million in the expansivedefinition versus 14.5 million, as discussed above.
Section 9.2: Musculoskeletal HealthCare Utilization
Persons with musculoskeletal diseases accountfor a large and growing share of health careutilization. (Table 9.2 and Graph 9.2.1) In anygiven year, abut 85% of persons withmusculoskeletal diseases have at least oneambulatory care visit to a physician’s office,averaging just under six such visits per year.Between 1996-1998 and 2002-2004, ambulatoryphysician visits increased from 425.5 million to507.9 million. Growth in the number of personswith musculoskeletal diseases, rather than anincrease in the number of visits by individuals, isprimarily responsible for this increase.
In contrast to the relatively stable number ofphysician office visits, there was an increase inthe proportion of the U.S. population with visitsto ambulatory providers other than medicalphysicians; the average number of visits to non-physician providers by persons withmusculoskeletal diseases also increased. Non-physician ambulatory health care providersinclude physical therapists, occupationaltherapists, chiropractors, social workers,physician assistants, nurse practitioners, andother related health care workers. In 1996-1998,approximately 40% of persons withmusculoskeletal diseases visited an ambulatoryhealth care resource at least once; by 2002-2004the proportion had jumped to nearly 52%. At thesame time, the average number of such visitsincreased from 2.6 per person to 3.8. The resultwas a 69% increase, from 197.5 million to 332.8million, in total non-physician ambulatory carevisits between 1996-1998 and 2002-2004. Theaggregate total for all ambulatory care visits,including those to physicians and non-physicians,thus increased over the 8 year period by 35%,from 623.0 million visits to 840.7 million visits.
The Burden of Musculoskeletal Diseases in the United States - Copyright © 2008
Chapter 9 Health Care Utilization and Economic Cost of Musculoskeletal Diseases
198
Graph 9.2.1: Total Units of Health Care Utilization forPersons with Musculoskeletal Diseases by TreatmentType, United States 1996-2004
Source: Medical Expenditures Panel Survey (MEPS), Agency for HealthcareResearch and Quality, U.S. Department of Health and Human Services, 1996-2004
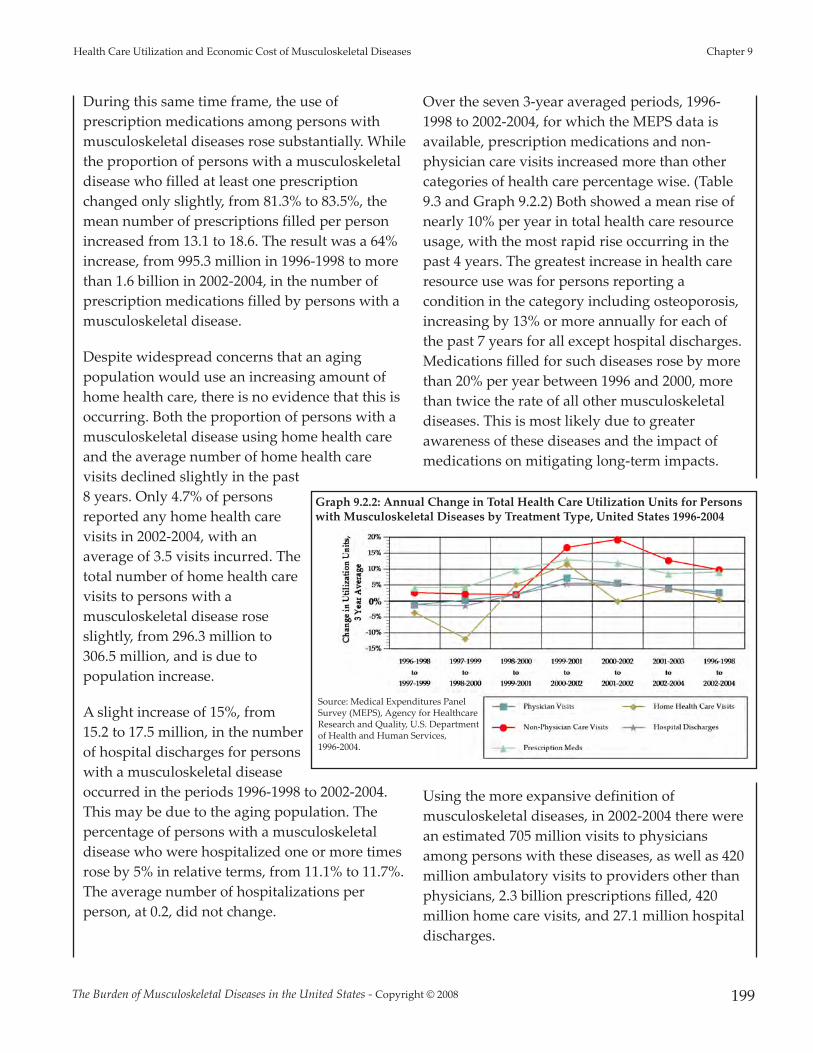
During this same time frame, the use ofprescription medications among persons withmusculoskeletal diseases rose substantially. Whilethe proportion of persons with a musculoskeletaldisease who filled at least one prescriptionchanged only slightly, from 81.3% to 83.5%, themean number of prescriptions filled per personincreased from 13.1 to 18.6. The result was a 64%increase, from 995.3 million in 1996-1998 to morethan 1.6 billion in 2002-2004, in the number ofprescription medications filled by persons with amusculoskeletal disease.
Despite widespread concerns that an agingpopulation would use an increasing amount ofhome health care, there is no evidence that this isoccurring. Both the proportion of persons with amusculoskeletal disease using home health careand the average number of home health carevisits declined slightly in the past8 years. Only 4.7% of personsreported any home health carevisits in 2002-2004, with anaverage of 3.5 visits incurred. Thetotal number of home health carevisits to persons with amusculoskeletal disease roseslightly, from 296.3 million to306.5 million, and is due topopulation increase.
A slight increase of 15%, from15.2 to 17.5 million, in the numberof hospital discharges for personswith a musculoskeletal diseaseoccurred in the periods 1996-1998 to 2002-2004.This may be due to the aging population. Thepercentage of persons with a musculoskeletaldisease who were hospitalized one or more timesrose by 5% in relative terms, from 11.1% to 11.7%.The average number of hospitalizations perperson, at 0.2, did not change.
Over the seven 3-year averaged periods, 1996-1998 to 2002-2004, for which the MEPS data isavailable, prescription medications and non-physician care visits increased more than othercategories of health care percentage wise. (Table9.3 and Graph 9.2.2) Both showed a mean rise ofnearly 10% per year in total health care resourceusage, with the most rapid rise occurring in thepast 4 years. The greatest increase in health careresource use was for persons reporting acondition in the category including osteoporosis,increasing by 13% or more annually for each ofthe past 7 years for all except hospital discharges.Medications filled for such diseases rose by morethan 20% per year between 1996 and 2000, morethan twice the rate of all other musculoskeletaldiseases. This is most likely due to greaterawareness of these diseases and the impact ofmedications on mitigating long-term impacts.
Using the more expansive definition ofmusculoskeletal diseases, in 2002-2004 there werean estimated 705 million visits to physiciansamong persons with these diseases, as well as 420million ambulatory visits to providers other thanphysicians, 2.3 billion prescriptions filled, 420million home care visits, and 27.1 million hospitaldischarges.
The Burden of Musculoskeletal Diseases in the United States - Copyright © 2008 199
Health Care Utilization and Economic Cost of Musculoskeletal Diseases Chapter 9
Graph 9.2.2: Annual Change in Total Health Care Utilization Units for Personswith Musculoskeletal Diseases by Treatment Type, United States 1996-2004
Source: Medical Expenditures PanelSurvey (MEPS), Agency for HealthcareResearch and Quality, U.S. Departmentof Health and Human Services, 1996-2004.

Section 9.3: Musculoskeletal MedicalCare Expenditures
Musculoskeletal medical care expenditures arepresented (1) for all persons with amusculoskeletal disease, regardless of whetherthe musculoskeletal disease was the reason forthe expenditure (total cost), and (2) as a measureof the expenditures beyond those expected forpersons of similar characteristics but who do nothave a musculoskeletal disease (incremental cost).Incremental cost, hence, is that share estimated tobe directly related to the musculoskeletalcondition. Both total and incremental costs areexpressed as the average cost per person with amusculoskeletal disease (Tables 9.4 and 9.4a) andthe aggregate cost (total) for all persons with amusculoskeletal disease. (Table 9.5) Medical carecosts are expressed in both the current yeardollars (i.e., the year the data was collected) andin 2004 dollars to provide a standard ofcomparison across years. Throughout thefollowing discussion, expenditures will bediscussed in 2004 dollars.
Section 9.3.1: Total and Per Person Expendituresfor Musculoskeletal Diseases
Overall, total average expenditures for personswith musculoskeletal diseases increased from$4,751 in 1996-1998 to $5,824 in 2002-2004, a 23%
increase. (Table 9.5, Column D and Graph 9.3.1)Aggregate total expenditures increased from$361.0 billion to $510.0 billion during this timeframe (Table 9.5, Column F and Graph 9.3.2), anincrease of 41%. In 1996-1998, aggregate totalexpenditures for persons with a musculoskeletaldisease, including both primary (1st) andsecondary (2nd or more) diagnoses, represented4.4% of the GDP. By 2002-2004, the proportionhad grown to 4.6% of the GDP. 1
Incremental average expenditures for personswith musculoskeletal diseases increased from$1,685 to $1,789 between 1996-1998 and 2002-2004, or a 6% increase. (Table 9.5, Column H andGraph 9.3.1) Aggregate incremental expendituresincreased from $128.0 billion to $156.7 billion(Table 9.5, Column J and Graph 9.3.2), or by about
The Burden of Musculoskeletal Diseases in the United States - Copyright © 2008
Chapter 9 Health Care Utilization and Economic Cost of Musculoskeletal Diseases
200
Graph 9.3.1: Mean Medical Care Cost per Person with aMusculoskeletal Disease in 2004 $, United States 1996-2000
[1] Includes all medical expenditures forpersons with a musculoskeletal conditionregardless of whether the expenditure was totreat the musculoskeletal condition or anothercondition.[2] Estimated additional medical expendituresbeyond those expected for persons of similarcharacteristics, but without a musculoskeletalcondition.
Source: Medical ExpendituresPanel Survey (MEPS), Agencyfor Healthcare Research andQuality, U.S. Department ofHealth and Human Services,1996-2004
Graph 9.3.2: Aggregate Medical Care Cost for Personswith a Musculoskeletal Disease in 2004 $, United States1996-2004
[1] Includes all medical expenditures forpersons with a musculoskeletal diseaseregardless of whether the expenditure wasto treat the musculoskeletal disease oranother disease.[2] Estimated additional medicalexpenditures beyond those expected forpersons of similar characteristics, butwithout a musculoskeletal disease.
Source: Medical ExpendituresPanel Survey (MEPS), Agencyfor Healthcare Research andQuality, U.S. Department ofHealth and Human Services,2002-2004

22%, representing the equivalent of 1.5% and1.4% of the GDP for the respective time frames.To provide a basis for comparison, the economy issaid to be in a recession when GDP declines by atleast 1% for two or more consecutive quarters.Accordingly, the aggregate economic impact ofthe medical expenditures on behalf of personswith musculoskeletal diseases is in excess of theamount used to define a recession and, unlike arecession, occurs in perpetuity.
Total per person medical care expenditures roseslightly for each of the major subconditionsbetween 1996-1998 and 2002-2004 (Tables 9.4 and9.5, Column D, and Graph 9.3.3), ranging from$5,161 per person for musculoskeletal injuries to$8,565 for conditions within the categoryincluding osteoporosis in 2002-2004. Due to thehigher prevalence and relatively high level ofexpenditures per person, aggregate expenditureshave consistently been greatest for arthritis andjoint pain, accounting for $281.5 billion ofmusculoskeletal health care costs in 2002-2004.(Table 9.5, Column F, and Graph 9.3.4) Asdiscussed previously, approximately one-third ofthe cost is for ambulatory care (33%), one-thirdfor emergency room and inpatient care (32%),and one-third for prescriptions and other costs(36%). Spine conditions, with an estimated $193.9billion cost in 2002-2004, have held steady as thesecond most expensive musculoskeletal healthcare condition. Spine costs also split evenly, with34%, 32%, and 34% going to ambulatory,emergency room and inpatient, andprescriptions/other costs, respectively.
The magnitude of increase in aggregateexpenditures between 1996-1998 and 2002-2004 isgreatest for the diseases within the categoryincluding osteoporosis (120%), but wassubstantial for all musculoskeletal diseases. (Table9.6) The aggregate cost of health care for spineconditions increased by 49%; arthritis and jointpain by 53%; musculoskeletal injuries by 37%;
The Burden of Musculoskeletal Diseases in the United States - Copyright © 2008 201
Health Care Utilization and Economic Cost of Musculoskeletal Diseases Chapter 9
Graph 9.3.3: Total and Incremental per Person MedicalCare Expenditures for Persons with MusculoskeletalDiseases, United States 2002-2004
[1] Includes all medical expenditures for persons with a musculoskeletaldisease regardless of whether the expenditure was to treat themusculoskeletal disease or another disease.[2] Estimated additional medical expenditures beyond those expected forpersons of similar characteristics, but without a musculoskeletal disease.[3] All individuals with osteoporosis had expenditures and total incrementcould not be calculated.Source: Medical Expenditures Panel Survey (MEPS), Agency for HealthcareResearch and Quality, U.S. Department of Health and Human Services, 2002-2004
Graph 9.3.4: Aggregate Total and Incremental MedicalCare Expenditures for Persons with MusculoskeletalDiseases, United States 2002-2004
[1] Includes all medical expenditures for persons with a musculoskeletaldisease regardless of whether the expenditure was to treat themusculoskeletal disease or another disease.[2] Estimated additional medical expenditures beyond those expected forpersons of similar characteristics, but without a musculoskeletal disease.[3] All individuals with osteoporosis had expenditures and total incrementcould not be calculated.Source: Medical Expenditures Panel Survey (MEPS), Agency for HealthcareResearch and Quality, U.S. Department of Health and Human Services, 2002-2004

and other musculoskeletal diseases by 44% overthe period 1996-2004.
Sampling variability limits inference about timetrends in incremental expenditures associatedwith the subcondition groups. However, whileestimates do not have the same precision as thosefor all musculoskeletal diseases, it is fair toconclude that 2002-2004 aggregate incrementalexpenditures were between $24.5 billion for othermusculoskeletal diseases and $37.3 billion forarthritis and joint pain. We were unable toestimate an increment in expendituresattributable to conditions in the categoryincluding osteoporosis. However, a “back of theenvelope” estimate of the ratio of incremental tototal expenditures for persons with all forms ofmusculoskeletal diseases for the period 2002-2004is possible. Applying the same ratio to thecategory including osteoporosis yields anestimate of about $18 billion in incrementalexpenditures for these conditions.
Using the more expansive definition ofmusculoskeletal diseases, aggregate total medical
care expenditures on behalf of persons with amusculoskeletal disease were $718.5 billion in2002-2004, while the aggregate increment inexpenditures was $322.2 in the same period. Totalexpenditures are the equivalent of 6.5% of GDPfor those years, while the incremental cost is theequivalent of 2.9% of GDP.
Section 9.3.2: Medical Care Expenditures forPersons with a Musculoskeletal Disease byDemographics
Expenditures for musculoskeletal diseases are notdistributed evenly across groups defined bygender, race, ethnicity, marital status, and type ofinsurance. (Table 9.7 and Graph 9.3.5) On anunadjusted basis, women with musculoskeletaldiseases have about a 20% higher level ofexpenditures than men; whites have a 30% higherlevel than non-whites; non-Hispanics report 67%higher expenditures than Hispanics; those whoare married or divorced, separated, or widowedhave more than 87% higher expenditures thanthose who have never been married; and thosewith private and public health insurance have
more than two and more than three times,respectively, the expenditures of those withoutany health insurance. Thus, lack of healthinsurance is associated with dramaticallylower expenditure levels, inconsistent with thebelief that persons who lack insurance aresomehow able to obtain care. In contrast to thedifferences in expenditure levels found forgender, race, ethnicity, marital status, and typeof health insurance, there was no discerniblepattern in expenditure levels by educationalattainment.
Adjustment for other characteristics reducedthe magnitude of the differences inexpenditures found for most demographiccharacteristics, but did not eliminate them.(Table 9.7 and Graph 9.3.6) Thus, whitesexperienced about 55% higher levels of
The Burden of Musculoskeletal Diseases in the United States - Copyright © 2008
Chapter 9 Health Care Utilization and Economic Cost of Musculoskeletal Diseases
202
Graph 9.3.5: Per Person Total Medical Care Expenditures forPersons with Musculoskeletal Diseases by SelectDemographics, United States 2002-2004
Source: Medical Expenditures Panel Survey (MEPS), Agency for HealthcareResearch and Quality, U.S. Department of Health and Human Services, 2002-2004
Includes all medical expenditures for persons with a musculoskeletal diseaseregardless of whether the expenditure was to treat the musculoskeletal conditionor another disease.
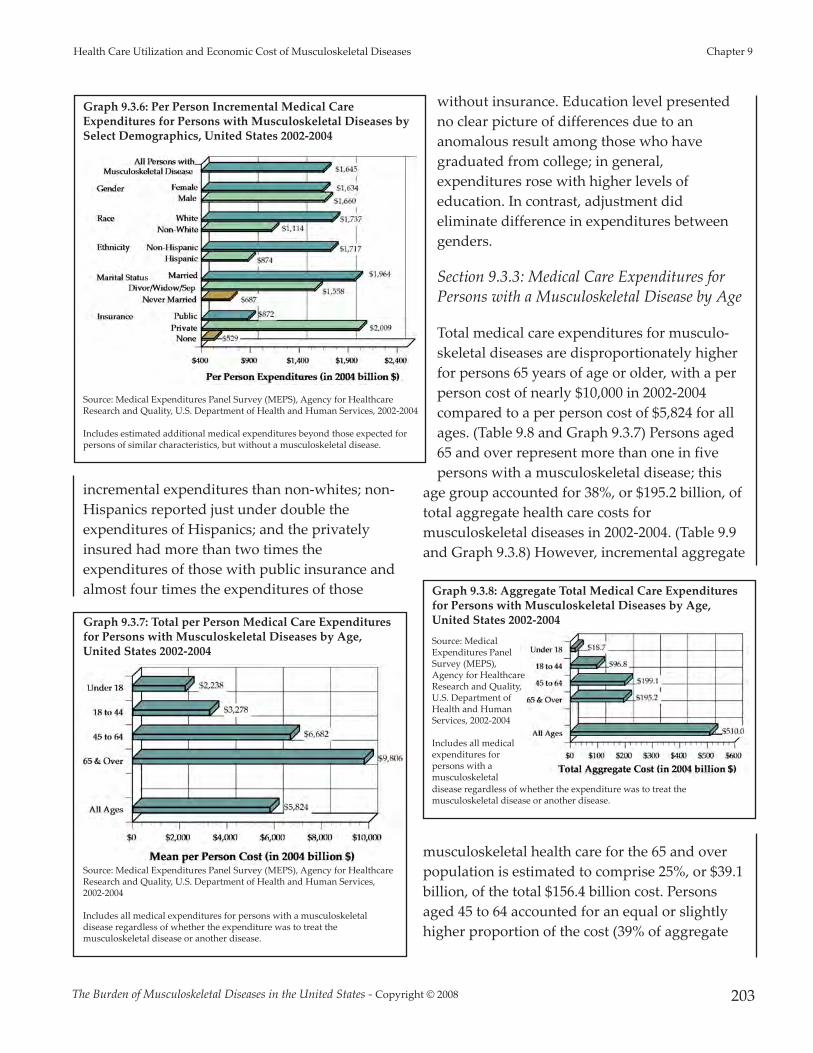
incremental expenditures than non-whites; non-Hispanics reported just under double theexpenditures of Hispanics; and the privatelyinsured had more than two times theexpenditures of those with public insurance andalmost four times the expenditures of those
without insurance. Education level presentedno clear picture of differences due to ananomalous result among those who havegraduated from college; in general,expenditures rose with higher levels ofeducation. In contrast, adjustment dideliminate difference in expenditures betweengenders.
Section 9.3.3: Medical Care Expenditures forPersons with a Musculoskeletal Disease by Age
Total medical care expenditures for musculo-skeletal diseases are disproportionately higherfor persons 65 years of age or older, with a perperson cost of nearly $10,000 in 2002-2004compared to a per person cost of $5,824 for allages. (Table 9.8 and Graph 9.3.7) Persons aged65 and over represent more than one in fivepersons with a musculoskeletal disease; this
age group accounted for 38%, or $195.2 billion, oftotal aggregate health care costs formusculoskeletal diseases in 2002-2004. (Table 9.9and Graph 9.3.8) However, incremental aggregate
musculoskeletal health care for the 65 and overpopulation is estimated to comprise 25%, or $39.1billion, of the total $156.4 billion cost. Personsaged 45 to 64 accounted for an equal or slightlyhigher proportion of the cost (39% of aggregate
The Burden of Musculoskeletal Diseases in the United States - Copyright © 2008 203
Health Care Utilization and Economic Cost of Musculoskeletal Diseases Chapter 9
Graph 9.3.6: Per Person Incremental Medical CareExpenditures for Persons with Musculoskeletal Diseases bySelect Demographics, United States 2002-2004
Source: Medical Expenditures Panel Survey (MEPS), Agency for HealthcareResearch and Quality, U.S. Department of Health and Human Services, 2002-2004
Includes estimated additional medical expenditures beyond those expected forpersons of similar characteristics, but without a musculoskeletal disease.
Graph 9.3.7: Total per Person Medical Care Expendituresfor Persons with Musculoskeletal Diseases by Age,United States 2002-2004
Source: Medical Expenditures Panel Survey (MEPS), Agency for HealthcareResearch and Quality, U.S. Department of Health and Human Services,2002-2004
Includes all medical expenditures for persons with a musculoskeletaldisease regardless of whether the expenditure was to treat themusculoskeletal disease or another disease.
Graph 9.3.8: Aggregate Total Medical Care Expendituresfor Persons with Musculoskeletal Diseases by Age,United States 2002-2004Source: MedicalExpenditures PanelSurvey (MEPS),Agency for HealthcareResearch and Quality,U.S. Department ofHealth and HumanServices, 2002-2004
Includes all medicalexpenditures forpersons with amusculoskeletal disease regardless of whether the expenditure was to treat themusculoskeletal disease or another disease.

and 47% of incremental), but represent asubstantially higher proportion of the population(34% aged 45 to 64; 23% aged 65 years and older).
Estimated 2002-2004 aggregate total expendituresfor persons aged 18 to 64 were $295.9 billion, or58% of total aggregate health care expendituresfor musculoskeletal diseases. This share occursdisproportionately among the 45 to 64 age group,which accounted for 67% of the cost for personsaged 18 to 64, and had an 83% relative increasebetween 1996-1998 and 2002-2004 in totalaggregate cost. This compares to a 12% to 30%relative increase in total cost for other age groups.Less than $19 billion of the total musculoskeletalhealth care costs went for persons under the ageof 18, representing only 10% of total cost.
With a 90% relative increase in incremental costover the two periods 1996-1998 and 2002-2004, the45 to 64 age group also accounts for the largestshare of incremental aggregate health care costfor musculoskeletal diseases. (Table 9.10) Incontrast, incremental costs were relatively stableover this same time period for both personsunder the age of 18 and those aged 18 to 44, while
the 65 and over population saw a 15% relativedecrease in total incremental musculoskeletalhealth care costs.
As the population aged, both the proportion oftotal persons with a musculoskeletal disease andthe share of cost attributed to the baby boomergeneration, the majority of whom are now 45 to64 years of age, rose steadily, while the sharesattributed to other ages declined. (Table 9.8 andGraph 9.3.9) As the U.S. population aging trendcontinues and boomers move into the 65 and overage group, the combination of a larger patientpopulation with potentially higher cost of care islikely to reflect increased cost associated withmusculoskeletal diseases in the years to come.These increases are likely to surpass even therapid increases seen in the past decade.
Section 9.4: Impact of MusculoskeletalDiseases on the U.S. Economy
Section 9.4.1: Overall Change in MusculoskeletalDiseases Health Care Cost
Over the period 1996-2004, slight changes in theproportion of total medical care expendituresdevoted to ambulatory physicians visits (from31% to 33% of total) and to emergency room andinpatient care (from 36% to 32%) occurred.However, the share of musculoskeletal healthcare costs devoted to prescription medicationsincreased the most, growing by 50%, from 14% to21% of total cost. Computed in 2004 dollars, themean annual prescription cost per personincreased 83%, from $653 to $1,196. During thistime, development of biologic agents for severalinflammatory conditions, particularly rheumatoidarthritis, occurred, as well as the widespread useof the coxibs for musculoskeletal pain,i and mayhave accounted for some of the rapid increase.
The Burden of Musculoskeletal Diseases in the United States - Copyright © 2008
Chapter 9 Health Care Utilization and Economic Cost of Musculoskeletal Diseases
204
Graph 9.3.9: Proportion of Total Medical CareExpenditures for Persons with Musculoskeletal Diseasesby Age, United States 1996-2004
Source: Medical Expenditures Panel Survey(MEPS), Agency for Healthcare Research andQuality, U.S. Department of Health andHuman Services, 2002-2004
Includes all medical expenditures for personswith a musculoskeletal disease regardless ofwhether the expenditure was to treat themusculoskeletal disease or another disease.
i Rofecoxib [Vioxx©] was removed from the market in September 2004; valde-coxib [Bextra©] was taken off the market in 2005; the use of celecoxib [Cele-brex©] was curtailed starting in 2005.
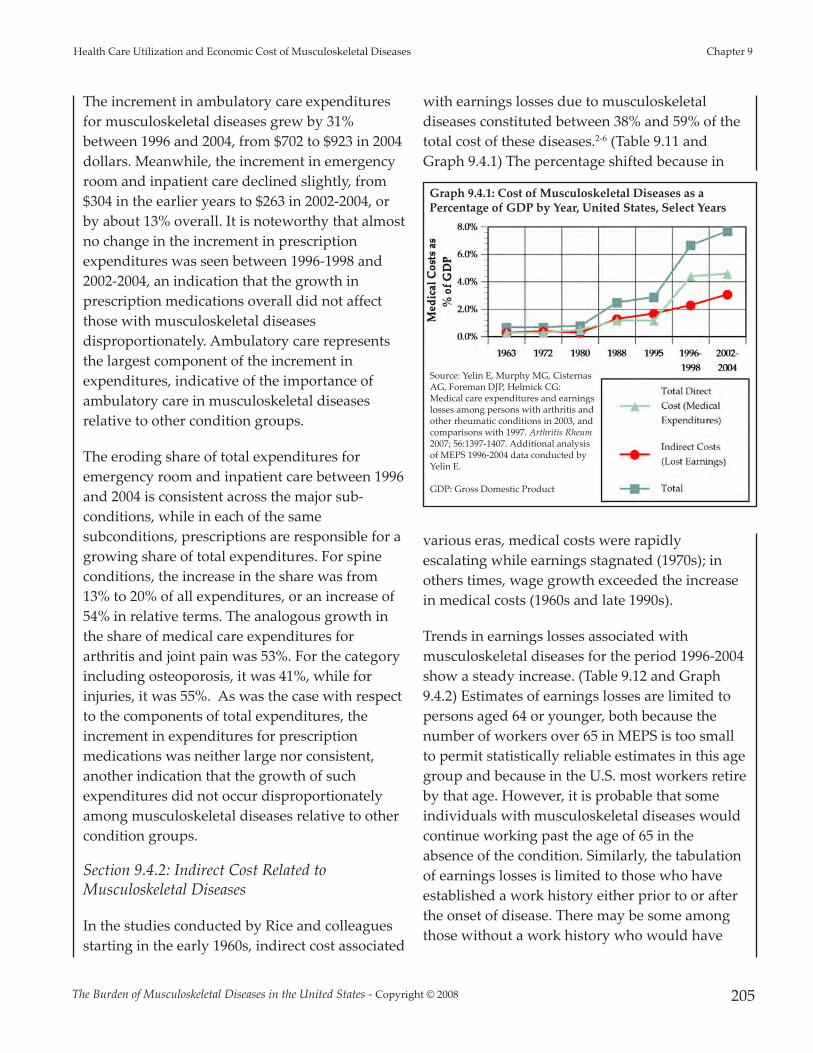
The increment in ambulatory care expendituresfor musculoskeletal diseases grew by 31%between 1996 and 2004, from $702 to $923 in 2004dollars. Meanwhile, the increment in emergencyroom and inpatient care declined slightly, from$304 in the earlier years to $263 in 2002-2004, orby about 13% overall. It is noteworthy that almostno change in the increment in prescriptionexpenditures was seen between 1996-1998 and2002-2004, an indication that the growth inprescription medications overall did not affectthose with musculoskeletal diseasesdisproportionately. Ambulatory care representsthe largest component of the increment inexpenditures, indicative of the importance ofambulatory care in musculoskeletal diseasesrelative to other condition groups.
The eroding share of total expenditures foremergency room and inpatient care between 1996and 2004 is consistent across the major sub-conditions, while in each of the samesubconditions, prescriptions are responsible for agrowing share of total expenditures. For spineconditions, the increase in the share was from13% to 20% of all expenditures, or an increase of54% in relative terms. The analogous growth inthe share of medical care expenditures forarthritis and joint pain was 53%. For the categoryincluding osteoporosis, it was 41%, while forinjuries, it was 55%. As was the case with respectto the components of total expenditures, theincrement in expenditures for prescriptionmedications was neither large nor consistent,another indication that the growth of suchexpenditures did not occur disproportionatelyamong musculoskeletal diseases relative to othercondition groups.
Section 9.4.2: Indirect Cost Related toMusculoskeletal Diseases
In the studies conducted by Rice and colleaguesstarting in the early 1960s, indirect cost associated
with earnings losses due to musculoskeletaldiseases constituted between 38% and 59% of thetotal cost of these diseases.2-6 (Table 9.11 andGraph 9.4.1) The percentage shifted because in
various eras, medical costs were rapidlyescalating while earnings stagnated (1970s); inothers times, wage growth exceeded the increasein medical costs (1960s and late 1990s).
Trends in earnings losses associated withmusculoskeletal diseases for the period 1996-2004show a steady increase. (Table 9.12 and Graph9.4.2) Estimates of earnings losses are limited topersons aged 64 or younger, both because thenumber of workers over 65 in MEPS is too smallto permit statistically reliable estimates in this agegroup and because in the U.S. most workers retireby that age. However, it is probable that someindividuals with musculoskeletal diseases wouldcontinue working past the age of 65 in theabsence of the condition. Similarly, the tabulationof earnings losses is limited to those who haveestablished a work history either prior to or afterthe onset of disease. There may be some amongthose without a work history who would have
The Burden of Musculoskeletal Diseases in the United States - Copyright © 2008 205
Health Care Utilization and Economic Cost of Musculoskeletal Diseases Chapter 9
Graph 9.4.1: Cost of Musculoskeletal Diseases as aPercentage of GDP by Year, United States, Select Years
Source: Yelin E, Murphy MG, CisternasAG, Foreman DJP, Helmick CG:Medical care expenditures and earningslosses among persons with arthritis andother rheumatic conditions in 2003, andcomparisons with 1997. Arthritis Rheum2007; 56:1397-1407. Additional analysisof MEPS 1996-2004 data conducted byYelin E.
GDP: Gross Domestic Product

begun to work in the absence of amusculoskeletal disease, but who never had theopportunity to do so. Thus, the magnitude ofearnings losses shown should be considered aconservative estimate.
As of 1996-1998, slightly fewer than 64 millionpersons with a musculoskeletal disease hadestablished a work history. On average, theseindividuals sustained $3,052 in earnings losses in2004 terms; their earnings losses aggregated to$194.8 billion, or the equivalent of 2.4% of GDPfor that period. By 2002-2004, the number ofpersons with musculoskeletal diseases and awork history had grown to over 73 million. Onaverage, these 73 million workers sustainedearnings losses of $4,618 each, an increase of 51%compared to 1996-1998, while aggregate earningslosses grew to $338.7 billion, an increase of 74%.
Aggregate losses in 2002-2004 were the equivalentof 3.1% of GDP for that period. Wage growth inthe late 1990s played a large role in the increase inthe estimate of earnings losses. Average earningslosses grew by more than one-third between1996-1998 and 1998-2000 (from $3,052 to $4,097);they stagnated through the next two 3-yearperiods due to the recession, before resumingtheir growth.
Some of the estimated earnings losses of personswith musculoskeletal diseases might haveoccurred in the absence of these conditions due toother factors. For example, older workers andwomen, two groups with high rates ofmusculoskeletal diseases, have loweremployment rates and earnings than the averageU.S. worker. The incremental earnings lossmeasure takes into consideration many of thefactors that might cause persons to have lowerearnings even without the presence of themusculoskeletal disease. However, earningslosses using the incremental measure also grewsubstantially between 1996-1998 and 2002-2004.In the earlier triad of years, the 64 million personswith musculoskeletal diseases and a work historysustained average incremental earnings losses of$706, or $45.1 billion overall, the equivalent of0.5% of GDP for 1996-1998. Average incrementalearnings losses approximately doubled by 2002-2004, to $1,506; aggregate incremental earningslosses increased by 2.5 times to $110.5 billion, or1.0% of GDP for 2002-2004.
Using the more expansive definition ofmusculoskeletal diseases, average earnings lossesincreased from $3,226 in 1996-1998 to $3,972 in2002-2004, or by just under one-fourth in realterms. At the same time, aggregate total earningslosses rose by almost 40%, from $306.0 billion in1996-1998 to $426.0 billion in 2002-2004. Over thesame time period, the average increment inearnings losses increased from $411 to $948, while
The Burden of Musculoskeletal Diseases in the United States - Copyright © 2008
Chapter 9 Health Care Utilization and Economic Cost of Musculoskeletal Diseases
206
Graph 9.4.2: Total and Incremental Aggregate IndirectCost [1] in 2004 Dollars for Persons Age 18 to 64 withMusculoskeletal Diseases and a Work History, United States 1996-2004
[1] Indirect cost calculated as estimated earnings loss per wage earner due toa musculoskeletal disease.[2] Includes all medical expenditures for persons with a musculoskeletaldisease regardless of whether the expenditure was to treat themusculoskeletal disease or another disease.[3] Estimated additional medical expenditures beyond those expected forpersons of similar characteristics, but without a musculoskeletal disease.
Source: Medical Expenditures Panel Survey (MEPS), Agency for HealthcareResearch and Quality, U.S. Department of Health and Human Services, 2002-2004

aggregate incremental earningslosses surged from $39.0 billionto $101.7 billion. Interestingly,the aggregate incrementalearnings losses are smaller,however, for the moreexpansive definition than themore conservative definition,presumably because manypersons with conditions oflesser severity are included.(Note: data on earnings losses ofpersons meeting the expansivedefinition of musculoskeletaldiseases not included in thetables.)
Section 9.4.3: Medical CareExpenditures and Earnings Losses for SelectMusculoskeletal Diseases
Medical conditions in MEPS are self-reported andmay result in misreporting of some conditions.With respect to musculoskeletal diseases, under-reporting might occur when physicians do notprovide patients with a discrete diagnosis formild osteoarthritis, for example, because it maybe too mild to be recognized or treatment isincluded with other conditions and not distinct.Over-reporting of a condition could occur whenthe respondent indicates they have a specific formof arthritis, e.g., rheumatoid arthritis, eventhough their physician did not so indicate. Itshould be noted that self-reporting of discretemedical conditions is lower than would beexpected on the basis of epidemiological studies,7
a conclusion that is supported by the higherprevalence numbers reported in the previouschapters of The Burden of Musculoskeletal Diseases.As a result of potential misreporting, themeasures of the aggregate economic impacts ofdiscrete conditions summarized in Table 9.13 andGraph 9.4.3 may not be as reliable as the
measures previously presented that are based onlarger samples, such as all musculoskeletaldisease, or major subcategories, such as all formsof arthritis. Nevertheless, they do indicate inbroad stroke the average economic impact forself-recognized disease and for conditions such asosteoarthritis, which are likely to be under-reported, a conservative estimate of aggregateeconomic impact. Estimates for discretemusculoskeletal diseases merged 5 years of MEPSdata (2000-2004) to provide more stable estimatesgiven the relatively few cases of each conditionreported in individual years.
Average total direct cost for all four conditionsstudied—disorders of the spine, rheumatoidarthritis, osteoarthritis and allied disorders, andgout—are relatively large. In the case of gout andspinal disorders, much of the health careexpenditures would not occur in the absence ofthe condition, as evidenced by the much smalleraverage incremental direct cost. Such is not thecase with rheumatoid arthritis and osteoarthritisand allied disorders, where the differencesbetween total and incremental cost are muchsmaller. Aggregate total cost for the persons with
The Burden of Musculoskeletal Diseases in the United States - Copyright © 2008 207
Health Care Utilization and Economic Cost of Musculoskeletal Diseases Chapter 9
Graph 9.4.3: Total and Incremental Direct Cost and Earnings Losses in 2004Dollars for Persons Aged 18 to 64 by Specific Musculoskeletal Conditions, United States 2000-2004
Source: Medical Expenditures Panel Survey(MEPS), Agency for Healthcare Research andQuality, U.S. Department of Health and HumanServices, 2000-2004

one of the four musculoskeletal diseases rangedfrom $12.0 billion for rheumatoid arthritis to $97.4billion for spine disorders, while aggregateincremental cost ranged from $1.9 billion for goutto $15.6 billion for back disorders.
Average total earnings losses were highest forrheumatoid arthritis, $14,175 per year, followedby osteoarthritis at $10,369 per year. They werelowest for back disorders at only $1,231 per year.As evidenced by the ratio of average total toaverage incremental earnings losses, a muchhigher proportion of earnings losses areattributable to rheumatoid arthritis and spinedisorders (45% and 63%, respectively) than toosteoarthritis or gout.
On an unadjusted basis for total cost, theconditions have an aggregate economic impactranging from $29.1 billion for rheumatoidarthritis to $119.7 billion for spine disorders.(Table 9.13 and Graph 9.4.4) The greateraggregate impact of spine disorders over averageearnings losses is likely due to demographics,with spine disorders occurring more frequently inpersons aged 18 to 64, prime working years,while rheumatoid arthritis has been shown toaffect persons 65 and older in greater numbers.After adjustment, or the incremental cost impact,
they have an aggregate impact of from $4.9billion for gout to $29.6 billion for spinedisorders. The incremental aggregate figure forrheumatoid arthritis, $12.7 billion, is particularlystriking given the relatively low prevalence of thiscondition and no doubt reflects the growing useof biological agents to treat this condition, alongwith high work disability rates.
Section 9.4.4: Summary and Conclusions
The economic impact of musculoskeletal diseasesis increasing due to a combination of factors thatinclude the aging of the U.S. population with theconcomitant increase in the prevalence ofmusculoskeletal diseases, the growth in averagetotal expenditures to treat musculoskeletaldiseases, and the average total and incrementalearnings losses that result from these conditions.
Between 1996 and 2004, the number of personswith one or more musculoskeletal diseases grewfrom 76.0 million, or 28.0% of the population, to87.6 million, or 30.1% of the population. Over thetime period, average total expenditures for healthcare for persons with a musculoskeletal diseasegrew from $4,751 to $5,824 in 2004 dollars, whileaggregate total expenditures grew from $361.0billion to $510.0 billion. Average incrementalexpenditures for persons of similar characteristicsbut without a musculoskeletal disease grewslower from $1,685 to $1,789, but due topopulation growth and increased prevalence ofthe conditions, aggregate incrementalexpenditures grew from $128.0 to $156.7 billion.
Average per person earnings losses between 1996and 2004 due to musculoskeletal diseasesincreased from $3,052 to $4,616, while totalearnings losses grew from $194.8 billion to $338.7billion in constant 2004 dollars. Incrementalearnings losses also increased dramatically, from$706 to $1,506 per person and from $45.1 to $110.5billion on an aggregate basis.
The Burden of Musculoskeletal Diseases in the United States - Copyright © 2008
Chapter 9 Health Care Utilization and Economic Cost of Musculoskeletal Diseases
208
Graph 9.4.4: Total and Incremental Direct Cost andEarnings Losses for Persons Aged 18 to 64 by SpecificMusculoskeletal Conditions, United States 2000-2004
Source: Medical Expenditures Panel Survey(MEPS), Agency for Healthcare Research andQuality, U.S. Department of Health and HumanServices, 1996-2004

Comparing the cost of musculoskeletal diseasesto the national gross domestic product (GDP)provides a perspective on these total costs (Table9.11). Earlier estimates summarize the evidencefrom the studies conducted by Dorothy Rice andcolleagues, the last two of which were from prioreditions of the present volume,ii while morerecent comparisons for 1996-2004 summarize thedata from the present analysis. As discussed inthe methodology section, the estimates ofincremental medical care expenditures andearnings losses are roughly comparable to theestimates from Rice and colleagues in which costsare allocated on the basis of the primarydiagnosis.
Notwithstanding the different methods of thestudies by Rice and colleagues and the analysis ofMEPS from the present volume, there is noquestion that the cost of musculoskeletal diseaseshas a profound economic impact on the nation,now considerably in excess of 2% of GDP. Theimpact has grown by at least 0.4% of GDP sincethe 1996-1998 period, and is likely to continue togrow more severe due to population aging, moreintensive treatment—particularly with respect toprescription medications, and growingdisplacement of older workers from industries indecline, a phenomenon that has been shown toaffect those with musculoskeletal diseasesdisproportionately.9
Society has the option of passively accepting theincreasing economic impact of musculoskeletaldiseases, or it can seek to alleviate this impact bythe use of primary, secondary, and tertiarypreventive measures with strong evidence ofeffectiveness. Such measures run the gamut fromweight loss and exercise programs designed toreduce the prevalence of arthritic conditions, to
self-management classes designed to reduce theimpact of existing conditions, to surgical andmedical interventions that return the individualto higher levels of functioning and quality oflife.10-12 In the discussion of demographicvariations, disparities in medical careexpenditures were identified. This suggests theneed for equal access to effective interventionsand treatment modalities to keep individualsparticipating in society through work and othermeaningful activities
Section 9.5: Background andMethodology
Economic cost for musculoskeletal-related healthcare diseases presented in this book are based ondata from the Medical Expenditures Panel Survey(MEPS) using a methodology developed by theprincipal author and colleagues at the U.S.Centers for Disease Control (CDC).13-16 The MEPSis a comprehensive data source designed for costof illness studies.17-20 The MEPS uses a randomsample of the U.S. population and annuallyqueries this sample three times about theirmedical conditions, health care utilization, andemployment status. Two estimates are produced.The first, total cost, is an indication of all medicalcare costs and earnings losses incurred bypersons with a musculoskeletal disease,regardless of the condition for which the cost wasincurred. The second, incremental cost, is anestimate of the magnitude of cost that would beincurred beyond those experienced by persons ofsimilar demographic and health characteristicsbut who do not have one or moremusculoskeletal disease. Cost estimates areproduced as the mean per person medical carecost and as the aggregate, or total cost, associatedwith all persons with musculoskeletal diseases.
Previous editions of this book based economicimpact and cost of musculoskeletal diseases on
The Burden of Musculoskeletal Diseases in the United States - Copyright © 2008 209
Health Care Utilization and Economic Cost of Musculoskeletal Diseases Chapter 9
ii The National Arthritis Data Task Force concluded that about half of the in-crease between the 1972 and 1980 studies by Rice and colleagues was due toimprovements in the data sources available to Rice and colleagues, but the re-mainder represented a real increase.8

the Rice cost of illness methodology.5,6 The Ricemodel utilized the National Hospital DischargeSurvey (NHDS) and other available nationalhealth care data sources. All costs associated withhospitalizations or treatments for persons with amusculoskeletal disease listed as the primary, or1st, diagnosis were included in the model. TheRice model defines direct cost as those associatedwith all components of medical care (i.e.,inpatient and outpatient care, medications,devices, and costs associated with procuringmedical care), and indirect cost as thoseassociated with wage loss due to morbidity ormortality, plus an estimate of intangible costs.
In the Rice model, mortality accounted for 7% oftotal indirect medical cost for all conditions. TheMEPS data do not provide a comparable methodfor calculating wage loss associated withmortality. Hence, total cost presented hererepresents an undercount by a similar percentage.Because musculoskeletal diseases have a smallerimpact on mortality than most other majorcategories of illness, the undercount will be anunknown, but smaller, percentage.
Comparing total cost for 1995,6 updated to 1996terms, the first year for which MEPS data isavailable, and omitting cost associated withmortality, the current analysis results in $207billion in total cost associated withmusculoskeletal diseases using the Rice methodand about $173 billion using the MEPS database.This suggests the two methods yield estimates ofsimilar magnitude, although the estimates basedon MEPS may be more conservative. A series ofpapers provide a detailed description of themethods of estimating total and incrementaldirect and indirect cost of conditions, and outlinethe regression model used to adjust fordifferences of persons with and withoutmusculoskeletal diseases due to demographiccharacteristics and health status.13,15
Conditions included in the musculoskeletaldisease rubric include spine conditions, arthritisand joint pain, the category that includesosteoporosis (other diseases of bone andcartilage), injuries, and an inclusive “other”category for the remaining conditions. Conditionsselected for the cost analysis presented above arebased on preceding chapters in the book. Data arereported primarily for base case ICD-9-CM codes,or those codes for which musculoskeletal diseaseis the principal etiology rather than aconsequence of a condition for which theprincipal etiology is another major healthcondition (e.g., cancer). (Table 9.14) Estimates arealso provided for a more expansive list of codesof musculoskeletal-related diseases that includesthe conditions for which the musculoskeletaldiseases are the primary and secondaryetiologies. (Table 9.15) Although this moreexpansive list of conditions yields a vastly largerprevalence estimate than the base case list, it isreasonable to assume the cost of musculoskeletaldiseases probably exceeds the conservativeestimates presented here. For example, a personwith bone metastases would incur costs to treatthe bone manifestation, even though the cancer,not the bone condition, is the primary etiology.ICD-9-CM codes included in each subcategory forthe base and expansive conditions are listed inTables 9.14 and 9.15.
Although generally prevalence and costassociated with musculoskeletal diseases increaseover time, sampling variability in the MEPS doesnot reflect this in each successive year. The impactof sampling variability is partially mitigated bysmoothing, or averaging, data across 3-yearperiods.
The Burden of Musculoskeletal Diseases in the United States - Copyright © 2008
Chapter 9 Health Care Utilization and Economic Cost of Musculoskeletal Diseases
210

1. US Bureau of the Census: Statistical Abstract of the US,2007. Available at:http://www.census.gov/prod/2006pubs/07statab/income.pdf. Accessed July 6, 2007
2. Rice D: Estimating the Cost of Illness. Hyattsville, MD:National Center for Health Statistics, Health EconomicSeries, 1966, No. 6.
3. Cooper B, Rice D: The economic cost of illness revisited.Health Economics Series No. 6. Social Security Bulletin1979;39:21-35.
4. Rice D, Hodgson T, Kopstein A: The economic costs ofillness: A replication and update. Health Care Fin Rev1985;7:61-80.
5. Rice D: Cost of musculoskeletal conditions, in Praemer A,Furner S, Rice D (eds): Musculoskeletal Conditions in theUS, ed 1. Rosemont, IL: American Academy ofOrthopaedic Surgeons, 1992.
6. Rice D: Cost of musculoskeletal conditions, in Praemer A,Furner S, Rice D (eds): Musculoskeletal Conditions in theUS, ed 2. Rosemont, IL: American Academy ofOrthopaedic Surgeons, 1999.
7. Lawrence R, Helmick C, Arnett F, et al: Estimates of theprevalence of arthritis and selected musculoskeletaldisorders in the United States. Arthritis Rheum1998;41:788-799.
8. Yelin E, Callahan L: The economic cost and social andpsychological impact of musculoskeletal conditions.Arthritis Rheum 1995;38:1351-1362.
9. Yelin E, Katz P: Labor force participation among personswith musculoskeletal conditions, 1970-1987: Nationalestimates derived from a series of cross sections. ArthritisRheum 1991;34:136-170.
10. Kruger J, Helmick C, Callahan L, Haddix A: Cost-effectiveness of the arthritis self-help course. Arch Int Med1998;158:1245-1249.
11. Minor M: 2002 Exercise and Physical ActivityConference, St. Louis, Missouri: Exercise and arthritis“We know a little bit about a lot of things.“ Arth Rheum2003;49:1-2.
12. Redelmeier D, Lorig K: Assessing the clinical importanceof symptomatic improvements: An illustration inrheumatology. Arch Int Med 1993;153:1337-1342.
13. Yelin E, Cisternas M, Pasta D, et al: Medical careexpenditures and earnings losses of persons witharthritis and other rheumatic conditions in the UnitedStates in 1997: Total and incremental estimates. ArthritisRheum 2004;50(7):2317-2326.
14. Yelin E, Herrndorf A, Trupin L, Sonneborn D: A nationalstudy of medical care expenditures for musculoskeletalconditions: The impact of health insurance and managedcare. Arthritis Rheum 2001;44:1160-1169.
15. Yelin E, Murphy L, Cisternas MG, et al: Medical careexpenditures and earnings losses among persons witharthritis and other rheumatic conditions in 2003 andcomparisons with 1997. Arthritis Rheum 2007;56(5):1397-1407.
16. Yelin E, Trupin L, Cisternas M: Direct and Indirect Costs ofMusculoskeletal Conditions in 1997: Absolute and IncrementalEstimates. Atlanta, GA: Centers for Disease Control, 2002.
17. Cohen J, Monheit A, Beauregard K. The medicalexpenditures panel survey: A national informationresource. Inquiry 1996/1997;33:373-389.
18. Cohen S: Sample Design of the 1996 Medical ExpenditurePanel Survey Household Component. Agency for HealthCare Policy and Research: U.S. Department of Health andHuman Services, 1997.
19. Cohen S: Sample Design of the 1997 Medical ExpenditurePanel Survey Household Component. Agency for HealthCare Policy and Research: U.S. Department of Health andHuman Services, 2000.
20. Cohen S, DiGaetano R, Goksel H: Estimation Procedures inthe 1996 Medical Expenditure Panel Survey HouseholdComponent. Agency for Health Care Policy and Research:U.S. Department of Health and Human Services, 1999.
The Burden of Musculoskeletal Diseases in the United States - Copyright © 2008 211
Health Care Utilization and Economic Cost of Musculoskeletal Diseases Chapter 9

The Burden of Musculoskeletal Diseases in the United States - Copyright © 2008
Chapter 9 Health Care Utilization and Economic Cost of Musculoskeletal Diseases
212
Section 9.6: Health Care Utilization and Economic Cost of MusculoskeletalDiseases Data Tables
Table 9.1: Number and Percent of Population with Musculoskeletal Diseases by Age,United States 1996-2004
Condition Year Sample N
TotalPopulation(in millions)
Persons with Condition Age Distribution
# Individuals (in millions)
% TotalPopulation Under 18 18-44 45-64
65 & Over
All MusculoskeletalDiseases
1996-1998 6,964 271.2 76.0 28.0% 11.6% 38.0% 28.7% 21.7%1997-1999 7,004 273.7 75.2 27.5% 11.4% 36.7% 29.5% 22.4%1998-2000 6,025 276.1 74.1 26.8% 11.2% 35.7% 30.5% 22.6%1999-2001 6,814 279.7 75.6 27.0% 10.5% 35.0% 31.6% 22.9%2000-2002 8,252 283.6 79.7 28.1% 9.8% 34.8% 32.5% 22.8%2001-2003 9,166 287.7 84.3 29.3% 9.5% 34.3% 33.4% 22.7%2002-2004 9,337 290.8 87.6 30.1% 9.5% 33.7% 34.0% 22.7%
Spine
1996-1998 2,510 271.2 27.4 10.1% 5.4% 47.5% 31.0% 16.1%1997-1999 2,580 273.7 27.9 10.2% 5.4% 45.8% 32.0% 16.8%1998-2000 2,199 276.1 27.2 9.9% 5.6% 44.6% 33.0% 16.9%1999-2001 2,411 279.7 27.3 9.8% 5.6% 44.4% 33.6% 16.4%2000-2002 2,927 283.6 28.8 10.2% 5.2% 44.1% 34.0% 16.7%2001-2003 3,258 287.7 30.6 10.6% 4.7% 42.8% 35.5% 17.0%2002-2004 3,408 290.8 32.7 11.3% 4.5% 41.5% 36.7% 17.3%
Arthritis and Joint Pain
1996-1998 2,804 271.2 29.9 11.0% 3.1% 24.8% 36.4% 35.7%1997-1999 2,853 273.7 30.0 11.0% 3.1% 23.3% 37.4% 36.3%1998-2000 2,498 276.1 30.3 11.0% 3.3% 22.0% 38.5% 36.2%1999-2001 2,936 279.7 32.2 11.5% 3.3% 21.4% 39.0% 36.2%2000-2002 3,632 283.6 34.7 12.2% 3.1% 21.6% 39.9% 35.4%2001-2003 4,058 287.7 36.9 12.8% 2.8% 22.1% 40.8% 34.3%2002-2004 4,103 290.8 37.6 12.9% 2.7% 21.7% 41.6% 34.0%
Osteoporosis
1996-1998 299 271.2 3.2 1.2% 4.3% 10.7% 34.8% 50.1%1997-1999 321 273.7 3.4 1.2% 3.1% 8.6% 32.8% 55.5%1998-2000 308 276.1 3.8 1.4% 2.3% 7.3% 31.5% 58.9%1999-2001 395 279.7 4.4 1.6% 2.2% 6.5% 32.1% 59.2%2000-2002 537 283.6 5.3 1.9% 1.9% 6.5% 34.7% 56.9%2001-2003 645 287.7 6.1 2.1% 1.7% 6.3% 37.5% 54.5%2002-2004 705 290.8 6.8 2.3% 1.3% 6.5% 38.2% 54.0%
Injuries
1996-1998 2,093 271.2 23.4 8.6% 24.2% 43.4% 19.4% 13.0%1997-1999 2,047 273.7 22.5 8.2% 24.8% 41.8% 20.0% 13.3%1998-2000 1,698 276.1 21.6 7.8% 24.5% 41.8% 21.0% 12.7%1999-2001 1,869 279.7 21.4 7.7% 23.0% 41.8% 22.4% 12.8%2000-2002 2,235 283.6 22.3 7.9% 21.4% 41.8% 23.4% 13.4%2001-2003 2,492 287.7 23.6 8.2% 21.0% 41.1% 24.1% 13.8%2002-2004 2,545 290.8 24.7 8.5% 21.2% 40.2% 24.6% 14.0%
OtherMusculoskeletalConditions
1996-1998 1,173 271.2 12.0 4.4% 11.8% 30.6% 31.5% 26.1%1997-1999 1,174 273.7 11.8 4.3% 10.4% 30.4% 32.9% 26.3%1998-2000 983 276.1 11.3 4.1% 9.7% 29.7% 34.2% 26.4%1999-2001 1,098 279.7 11.5 4.1% 9.7% 28.6% 35.5% 26.2%2000-2002 1,345 283.6 12.4 4.4% 9.6% 28.3% 36.4% 25.7%2001-2003 1,546 287.7 13.6 4.7% 9.8% 27.8% 37.1% 25.3%2002-2004 1,618 290.8 14.5 5.0% 9.5% 27.0% 38.4% 25.1%
Note: Totals may differ by orders of magnitude, e.g. prescriptions filled vs. hospital discharges
Source: Medical Expenditures Panel Survey (MEPS), Agency for Healthcare Research and Quality, U.S. Department of Health and Human Services, 1996-2004

The Burden of Musculoskeletal Diseases in the United States - Copyright © 2008 213
Health Care Utilization and Economic Cost of Musculoskeletal Diseases Chapter 9
Table 9.2: Health Care Utilization by Type for Persons with Musculoskeletal Diseases,United States 1996-2004
Condition Year
Ambulatory PhysicianVisits
Non-physician CareVisits
Prescription MedicationFilled
Home Health CareVisits Hospital Discharges
% WithAny
MeanVisits
TotalVisits
(inmillions)
% WithAny
MeanVisits
TotalVisits
(inmillions)
% WithAny
MeanVisits
TotalMeds
(inmillions)
% WithAny
MeanVisits
TotalVisits
(inmillions)
% WithAny
MeanVisits
Total (in
millions)
All Musculo-skeletalDiseases
1996-1998 84.8% 5.6 425.5 39.7% 2.6 197.5 81.3% 13.1 995.3 5.1% 3.9 296.3 11.1% 0.2 15.21997-1999 84.9% 5.6 421.0 40.9% 2.7 203.0 81.3% 13.8 1,037.4 5.0% 3.8 285.7 11.6% 0.2 15.01998-2000 85.3% 5.7 422.2 41.0% 2.8 207.4 82.5% 14.6 1,081.5 4.6% 3.4 251.9 11.6% 0.2 14.81999-2001 85.9% 5.7 430.9 42.0% 2.8 211.7 83.8% 15.7 1,186.9 4.6% 3.5 264.6 11.8% 0.2 15.12000-2002 86.0% 5.8 462.5 45.1% 3.1 247.2 84.5% 16.8 1,339.8 4.7% 3.7 295.1 11.7% 0.2 15.92001-2003 85.8% 5.8 488.9 49.2% 3.5 295.0 84.5% 17.8 1,500.5 4.8% 3.5 295.0 11.8% 0.2 16.92002-2004 85.1% 5.8 507.9 51.5% 3.8 332.8 83.5% 18.6 1,628.9 4.7% 3.5 306.5 11.7% 0.2 17.5
Spine
1996-1998 83.2% 6.2 169.7 46.7% 3.7 101.3 80.3% 12.9 353.2 4.1% 2.7 73.9 10.7% 0.2 5.51997-1999 83.0% 6.1 170.2 48.4% 3.9 108.8 80.3% 13.3 371.0 3.9% 3.0 83.7 11.0% 0.2 5.61998-2000 84.0% 6.2 168.7 49.1% 4.1 111.5 81.5% 14.2 386.3 3.6% 2.8 76.2 11.1% 0.2 5.41999-2001 84.6% 6.2 169.0 49.5% 4.2 114.5 82.9% 15.4 419.9 3.5% 2.5 68.2 11.5% 0.2 5.52000-2002 84.7% 6.2 178.7 52.4% 4.5 129.7 83.5% 16.7 481.4 3.7% 2.2 63.4 11.4% 0.2 5.82001-2003 84.3% 6.1 186.7 56.1% 4.9 150.0 83.6% 17.8 544.8 3.9% 2.2 67.3 11.5% 0.2 6.12002-2004 83.6% 6.1 199.7 58.6% 5.3 173.5 82.6% 18.6 609.0 4.0% 2.3 75.3 11.6% 0.2 6.5
Arthritis and Joint Pain
1996-1998 90.1% 6.8 203.3 42.4% 2.6 77.7 89.4% 18.9 565.0 7.9% 6.3 188.3 13.5% 0.2 6.01997-1999 90.4% 6.8 204.0 43.4% 2.6 78.0 89.1% 20.1 603.0 7.7% 6.3 189.0 14.2% 0.2 6.01998-2000 90.1% 6.8 205.7 43.2% 2.6 78.7 89.6% 21.0 635.3 7.0% 5.6 169.4 14.0% 0.2 6.11999-2001 90.3% 6.8 218.8 44.7% 2.8 90.1 90.5% 22.3 717.6 6.8% 5.4 173.8 14.4% 0.2 6.42000-2002 90.5% 6.9 239.2 47.8% 3.3 114.4 91.3% 23.5 814.6 6.9% 5.3 183.7 14.4% 0.2 6.92001-2003 90.8% 7.0 258.6 52.5% 3.8 140.4 91.3% 24.8 916.1 7.1% 5.1 188.4 14.6% 0.2 7.42002-2004 90.3% 7.1 267.3 55.0% 4.1 154.3 90.7% 26.0 978.7 6.9% 5.2 195.7 14.5% 0.2 7.5
Osteopor-osis
1996-1998 96.4% 9.5 30.0 54.1% 3.4 30.0 95.6% 27.8 87.8 10.3% 7.7 24.3 19.2% 0.3 0.91997-1999 97.3% 9.5 32.4 54.7% 4.0 32.4 95.5% 28.0 95.4 10.4% 8.5 28.9 18.5% 0.3 1.01998-2000 97.2% 9.2 34.8 54.6% 4.0 34.8 95.5% 27.9 105.7 8.7% 7.4 28.0 17.8% 0.3 1.11999-2001 96.6% 8.9 39.6 56.3% 3.6 39.6 95.9% 29.3 130.2 8.9% 7.8 34.7 17.2% 0.2 0.92000-2002 95.9% 8.8 46.3 58.9% 3.7 46.3 96.6% 31.4 165.3 9.4% 8.2 43.2 17.1% 0.2 1.12001-2003 95.2% 8.7 53.4 63.5% 4.2 53.4 97.2% 32.2 197.6 10.3% 8.6 52.8 17.1% 0.3 1.82002-2004 95.6% 8.4 57.3 64.8% 4.4 57.3 97.1% 31.3 213.5 9.7% 7.6 51.8 15.4% 0.2 1.4
Injuries
1996-1998 83.0% 4.8 112.1 36.2% 2.3 53.7 76.3% 8.6 200.9 4.2% 2.7 63.1 10.3% 0.1 2.31997-1999 82.9% 4.9 110.2 37.4% 2.6 58.5 76.4% 9.3 209.2 4.1% 3.1 69.7 10.8% 0.1 2.21998-2000 83.5% 5.0 108.0 37.3% 2.8 60.5 77.6% 10.0 215.9 4.1% 3.2 69.1 11.1% 0.1 2.21999-2001 84.0% 5.2 111.5 37.9% 2.8 60.0 78.7% 11.0 235.9 4.0% 3.3 70.8 11.4% 0.2 4.32000-2002 83.8% 5.3 118.1 40.3% 3.0 66.9 79.1% 12.1 269.7 4.2% 3.6 80.2 11.4% 0.2 4.52001-2003 83.6% 5.3 124.9 44.2% 3.3 77.8 78.5% 13.2 311.1 4.4% 3.4 80.1 11.3% 0.2 4.72002-2004 82.7% 5.2 128.3 46.3% 3.7 91.3 77.8% 13.8 340.6 4.3% 3.2 79.0 10.7% 0.2 4.9
OtherMusculo-skeletalConditions
1996-1998 89.8% 7.5 90.3 44.4% 3.4 41.0 86.6% 18.8 226.5 8.3% 6.7 80.7 14.0% 0.2 2.41997-1999 90.6% 7.6 89.8 45.5% 3.6 42.5 87.7% 19.9 235.0 8.1% 6.5 76.8 14.9% 0.2 2.41998-2000 90.8% 7.5 84.9 44.8% 3.4 38.5 88.4% 21.2 240.0 7.4% 6.0 67.9 16.2% 0.3 3.41999-2001 90.8% 7.5 86.4 46.7% 3.4 39.2 89.6% 22.5 259.3 7.4% 6.5 74.9 16.3% 0.3 3.52000-2002 90.6% 7.6 93.9 49.4% 3.7 45.7 89.8% 24.1 297.6 7.0% 6.8 84.0 16.0% 0.2 2.52001-2003 89.9% 7.7 105.1 54.4% 4.5 61.4 90.0% 25.4 346.5 6.7% 6.0 81.9 15.0% 0.2 2.72002-2004 90.2% 7.8 113.2 56.4% 4.9 71.1 89.5% 26.4 383.3 6.6% 5.8 84.2 15.3% 0.2 2.9
Note: Totals may differ by orders of magnitude, e.g. prescriptions filled vs. hospital discharges
Source: Medical Expenditures Panel Survey (MEPS), Agency for Healthcare Research and Quality, U.S. Department of Health and Human Services, 1996-2004

The Burden of Musculoskeletal Diseases in the United States - Copyright © 2008
Chapter 9 Health Care Utilization and Economic Cost of Musculoskeletal Diseases
214
Table 9.3: Annual Average Change in Total Units of Health Utilization by Type of Carefor Persons with Musculoskeletal Diseases, United States 1996-2004
MEPS Data Years AveragedAmbulatory
Physician Visits
Ambulatory Non-physician Visits
(Ambulatory Care)
PrescriptionMedication
Filled (Meds)Home Health
Care DaysHospital
Discharges1996-1998 to 1997-1999 -1.1% 2.7% 4.2% -3.6% -1.1%1997-1999 to 1998-2000 0.3% 2.2% 4.3% -11.8% -1.5%1998-2000 to 1999-2001 2.1% 2.1% 9.7% 5.1% 2.1%1999-2001 to 2000-2002 7.3% 16.8% 12.9% 11.5% 5.5%2000-2002 to 2001-2003 5.7% 19.3% 12.0% 0.0% 5.7%2001-2003 to 2002-2004 3.9% 12.8% 8.6% 3.9% 3.9%
1996-1998 to 2002-2004 2.8% 9.8% 9.1% 0.5% 2.2%
Annual Average Change for Select Musculoskeletal Diseases, 1996-1998 to 2002-2004Spine 2.5% 10.2% 10.3% 0.3% 2.8%Arthritis and Joint Pain 4.5% 14.1% 10.5% 0.6% 3.7%Osteoporosis 13.0% 13.0% 20.4% 16.2% 6.3%Musculoskeletal Injuries 2.1% 10.0% 9.9% 3.6% 15.9%Other Musculoskeletal Conditions 3.6% 10.5% 9.9% 0.6% 2.9%
Source: Medical Expenditures Panel Survey (MEPS), Agency for Healthcare Research and Quality, U.S. Department of Health and Human Services, 1996-2004
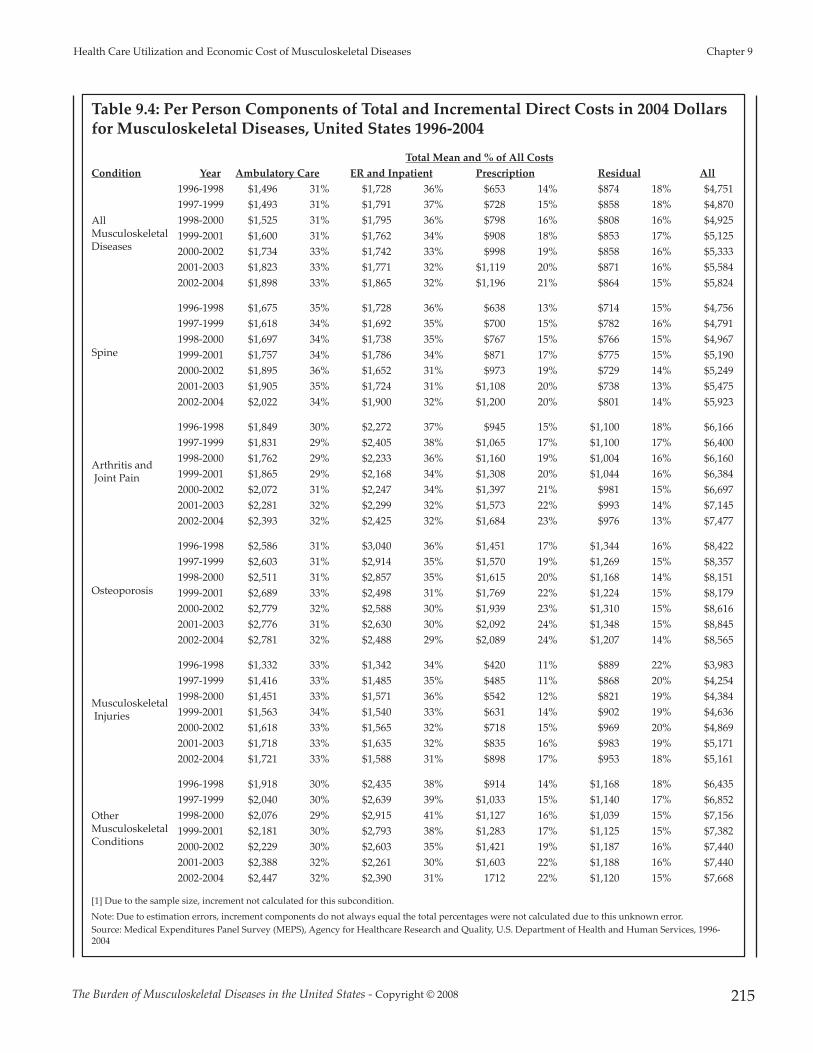
The Burden of Musculoskeletal Diseases in the United States - Copyright © 2008 215
Health Care Utilization and Economic Cost of Musculoskeletal Diseases Chapter 9
Table 9.4: Per Person Components of Total and Incremental Direct Costs in 2004 Dollarsfor Musculoskeletal Diseases, United States 1996-2004
Total Mean and % of All CostsCondition Year Ambulatory Care ER and Inpatient Prescription Residual All
All MusculoskeletalDiseases
1996-1998 $1,496 31% $1,728 36% $653 14% $874 18% $4,7511997-1999 $1,493 31% $1,791 37% $728 15% $858 18% $4,8701998-2000 $1,525 31% $1,795 36% $798 16% $808 16% $4,9251999-2001 $1,600 31% $1,762 34% $908 18% $853 17% $5,1252000-2002 $1,734 33% $1,742 33% $998 19% $858 16% $5,3332001-2003 $1,823 33% $1,771 32% $1,119 20% $871 16% $5,5842002-2004 $1,898 33% $1,865 32% $1,196 21% $864 15% $5,824
Spine
1996-1998 $1,675 35% $1,728 36% $638 13% $714 15% $4,7561997-1999 $1,618 34% $1,692 35% $700 15% $782 16% $4,7911998-2000 $1,697 34% $1,738 35% $767 15% $766 15% $4,9671999-2001 $1,757 34% $1,786 34% $871 17% $775 15% $5,1902000-2002 $1,895 36% $1,652 31% $973 19% $729 14% $5,2492001-2003 $1,905 35% $1,724 31% $1,108 20% $738 13% $5,4752002-2004 $2,022 34% $1,900 32% $1,200 20% $801 14% $5,923
Arthritis andJoint Pain
1996-1998 $1,849 30% $2,272 37% $945 15% $1,100 18% $6,1661997-1999 $1,831 29% $2,405 38% $1,065 17% $1,100 17% $6,4001998-2000 $1,762 29% $2,233 36% $1,160 19% $1,004 16% $6,1601999-2001 $1,865 29% $2,168 34% $1,308 20% $1,044 16% $6,3842000-2002 $2,072 31% $2,247 34% $1,397 21% $981 15% $6,6972001-2003 $2,281 32% $2,299 32% $1,573 22% $993 14% $7,1452002-2004 $2,393 32% $2,425 32% $1,684 23% $976 13% $7,477
Osteoporosis
1996-1998 $2,586 31% $3,040 36% $1,451 17% $1,344 16% $8,4221997-1999 $2,603 31% $2,914 35% $1,570 19% $1,269 15% $8,3571998-2000 $2,511 31% $2,857 35% $1,615 20% $1,168 14% $8,1511999-2001 $2,689 33% $2,498 31% $1,769 22% $1,224 15% $8,1792000-2002 $2,779 32% $2,588 30% $1,939 23% $1,310 15% $8,6162001-2003 $2,776 31% $2,630 30% $2,092 24% $1,348 15% $8,8452002-2004 $2,781 32% $2,488 29% $2,089 24% $1,207 14% $8,565
MusculoskeletalInjuries
1996-1998 $1,332 33% $1,342 34% $420 11% $889 22% $3,9831997-1999 $1,416 33% $1,485 35% $485 11% $868 20% $4,2541998-2000 $1,451 33% $1,571 36% $542 12% $821 19% $4,3841999-2001 $1,563 34% $1,540 33% $631 14% $902 19% $4,6362000-2002 $1,618 33% $1,565 32% $718 15% $969 20% $4,8692001-2003 $1,718 33% $1,635 32% $835 16% $983 19% $5,1712002-2004 $1,721 33% $1,588 31% $898 17% $953 18% $5,161
Other MusculoskeletalConditions
1996-1998 $1,918 30% $2,435 38% $914 14% $1,168 18% $6,4351997-1999 $2,040 30% $2,639 39% $1,033 15% $1,140 17% $6,8521998-2000 $2,076 29% $2,915 41% $1,127 16% $1,039 15% $7,1561999-2001 $2,181 30% $2,793 38% $1,283 17% $1,125 15% $7,3822000-2002 $2,229 30% $2,603 35% $1,421 19% $1,187 16% $7,4402001-2003 $2,388 32% $2,261 30% $1,603 22% $1,188 16% $7,4402002-2004 $2,447 32% $2,390 31% 1712 22% $1,120 15% $7,668
[1] Due to the sample size, increment not calculated for this subcondition.
Note: Due to estimation errors, increment components do not always equal the total percentages were not calculated due to this unknown error.Source: Medical Expenditures Panel Survey (MEPS), Agency for Healthcare Research and Quality, U.S. Department of Health and Human Services, 1996-2004

The Burden of Musculoskeletal Diseases in the United States - Copyright © 2008
Chapter 9 Health Care Utilization and Economic Cost of Musculoskeletal Diseases
216
Table 9.4a: Per Person Components of Incremental Direct Costs in 2004 Dollars forMusculoskeletal Diseases, United States 1996-2004
Mean IncrementCondition Year Ambulatory Care ER and Inpatient Prescription Residual
All Musculoskeletal Diseases
1996-1998 $702 $304 $210 $280 1997-1999 $714 $370 $196 $255 1998-2000 $783 $357 $206 $247 1999-2001 $798 $353 $188 $239 2000-2002 $849 $281 $179 $245 2001-2003 $874 $275 $219 $247 2002-2004 $923 $263 $212 $258
Spine
1996-1998 $690 $209 $99 $1111997-1999 $641 $253 $76 $1001998-2000 $780 $364 $60 $1081999-2001 $752 $473 $43 $1012000-2002 $767 $282 $55 $1052001-2003 $660 $155 $52 $902002-2004 $737 $176 $1 $101
Arthritis andJoint Pain
1996-1998 $578 $26 $138 $1371997-1999 $529 $125 $77 $1351998-2000 $511 $4 $56 $1391999-2001 $478 $97 $69 $1182000-2002 $508 $112 $59 $1032001-2003 $548 $189 $145 $892002-2004 $560 $283 $88 $104
Osteoporosis
1996-1998 [1] [1] [1] [1]1997-1999 [1] [1] [1] [1]1998-2000 [1] [1] [1] [1]1999-2001 [1] [1] [1] [1]2000-2002 [1] [1] [1] [1]2001-2003 [1] [1] [1] [1]2002-2004 [1] [1] [1] [1]
Musculoskeletal Injuries
1996-1998 $486 $485 $36 $4001997-1999 $547 $581 $19 $4131998-2000 $587 $655 $52 $4261999-2001 $624 $627 -$18 $4552000-2002 $581 $654 -$19 $4422001-2003 $569 $644 $12 $4172002-2004 $545 $593 $53 $411
Other Musculoskeletal Conditions
1996-1998 $647 $742 $194 $2471997-1999 $845 $744 $260 $2521998-2000 $845 $1,186 $293 $2491999-2001 $843 $1,052 $245 $2262000-2002 $679 $840 $191 $2532001-2003 $744 $412 $249 $2452002-2004 $755 $532 $205 $225
[1] Due to the sample size, increment not calculated for this subcondition.
Note: Due to estimation errors, increment components do not always equal the total percentages were not calculated due to this unknown error.
Source: Medical Expenditures Panel Survey (MEPS), Agency for Healthcare Research and Quality, U.S. Department of Health and Human Services, 1996-2004

The Burden of Musculoskeletal Diseases in the United States - Copyright © 2008 217
Health Care Utilization and Economic Cost of Musculoskeletal Diseases Chapter 9
Table 9.5: Total and Incremental Direct Costs for Musculoskeletal Diseases in Current and2004 Dollars, United States 1996-2004
Persons with condition
Total Incremental
Mean Aggregate [1] Mean Aggregate [1]
Condition Year Sample NTotal
PopulationCurrent
$s [2]2004
$s [2]Current $s
(in billions)2004 $s
(in billions)Current
$s [2]2004
$s [2]Current $s
(in billions)2004 $s
(in billions)
Column A Column B Column C Column D Column E Column F Column G Column H Column I Column J
All Musculo-skeletalDiseases
1996-1998 6,964 75,978,133 $3,600 $4,751 $274 $361 $1,276 $1,685 $97 $1281997-1999 7,004 75,173,840 $3,808 $4,870 $286 $366 $1,356 $1,733 $102 $1301998-2000 6,025 74,077,194 $3,993 $4,925 $296 $365 $1,482 $1,824 $110 $1351999-2001 6,814 75,600,394 $4,323 $5,125 $327 $387 $1,546 $1,838 $117 $1392000-2002 8,252 79,748,298 $4,704 $5,333 $375 $425 $1,582 $1,800 $126 $1442001-2003 9,166 84,297,419 $5,142 $5,584 $433 $471 $1,638 $1,777 $138 $1502002-2004 9,337 87,575,871 $5,594 $5,824 $490 $510 $1,715 $1,789 $150 $157
Spine
1996-1998 2,510 27,376,436 $3,600 $4,756 $99 $130 $759 $1,006 $21 $281997-1999 2,580 27,893,654 $3,749 $4,791 $105 $134 $812 $1,033 $23 $291998-2000 2,199 27,203,474 $4,030 $4,967 $110 $135 $1,050 $1,286 $29 $351999-2001 2,411 27,263,245 $4,376 $5,190 $119 $141 $1,151 $1,370 $31 $372000-2002 2,927 28,825,976 $4,623 $5,249 $133 $151 $998 $1,148 $29 $332001-2003 3,258 30,607,329 $5,044 $5,475 $154 $168 $754 $826 $23 $252002-2004 3,408 32,740,018 $5,700 $5,923 $187 $194 $898 $927 $29 $30
Arthritis and Joint Pain
1996-1998 2,804 29,893,915 $4,675 $6,166 $140 $184 $799 $1,057 $24 $321997-1999 2,853 29,998,123 $5,000 $6,400 $150 $192 $783 $1,007 $23 $301998-2000 2,498 30,254,301 $4,989 $6,160 $151 $186 $666 $823 $20 $251999-2001 2,936 32,177,862 $5,387 $6,384 $173 $205 $723 $857 $23 $282000-2002 3,632 34,664,846 $5,914 $6,697 $205 $232 $757 $858 $26 $302001-2003 4,058 36,938,769 $6,580 $7,145 $243 $264 $916 $992 $34 $372002-2004 4,103 37,643,137 $7,181 $7,477 $270 $281 $951 $992 $36 $37
Osteoporosis
1996-1998 299 3,158,916 $6,391 $8,422 $20 $27 [3] [3] [3] [3]1997-1999 321 3,405,501 $6,529 $8,357 $22 $28 [3] [3] [3] [3]1998-2000 308 3,787,044 $6,587 $8,151 $25 $31 [3] [3] [3] [3]1999-2001 395 4,444,849 $6,914 $8,179 $31 $36 [3] [3] [3] [3]2000-2002 537 5,264,938 $7,605 $8,616 $40 $45 [3] [3] [3] [3]2001-2003 645 6,136,560 $8,121 $8,845 $50 $54 [3] [3] [3] [3]2002-2004 705 6,819,738 $8,212 $8,565 $56 $58 [3] [3] [3] [3]
Injuries
1996-1998 2,093 23,358,073 $3,021 $3,983 $71 $93 $1,051 $1,386 $25 $321997-1999 2,047 22,495,891 $3,329 $4,254 $75 $96 $1,258 $1,604 $28 $361998-2000 1,698 21,590,412 $3,555 $4,384 $77 $95 $1,423 $1,751 $31 $381999-2001 1,869 21,442,353 $3,912 $4,636 $84 $99 $1,438 $1,715 $31 $372000-2002 2,235 22,285,775 $4,297 $4,869 $96 $109 $1,378 $1,571 $31 $352001-2003 2,492 23,570,429 $4,763 $5,171 $112 $122 $1,392 $1,508 $33 $362002-2004 2,545 24,680,193 $4,947 $5,161 $122 $127 $1,404 $1,468 $35 $36
Residual
1996-1998 1,173 12,046,200 $4,876 $6,435 $59 $78 $1,426 $1,885 $17 $231997-1999 1,174 11,809,322 $5,362 $6,852 $63 $81 $1,727 $2,191 $20 $261998-2000 983 11,322,533 $5,811 $7,156 $66 $81 $2,142 $2,633 $24 $301999-2001 1,098 11,524,129 $6,217 $7,382 $72 $85 $2,049 $2,456 $24 $282000-2002 1,345 12,350,398 $6,550 $7,440 $81 $92 $1,719 $1,971 $21 $242001-2003 1,546 13,643,094 $6,853 $7,440 $93 $102 $1,500 $1,624 $20 $222002-2004 1,618 14,518,291 $7,359 $7,668 $107 $111 $1,615 $1,685 $23 $24
[1] All aggregates (including total) are created by multiplying smoothed means by smoothed population in year.
[2] 2004 and current $ for year=2004 are no longer equal due to smoothing.
[3] All individuals with osteoporosis had expenditures and total increment could not be calculated.
Source: Medical Expenditures Panel Survey (MEPS), Agency for Healthcare Research and Quality, U.S. Department of Health and Human Services, 1996-2004
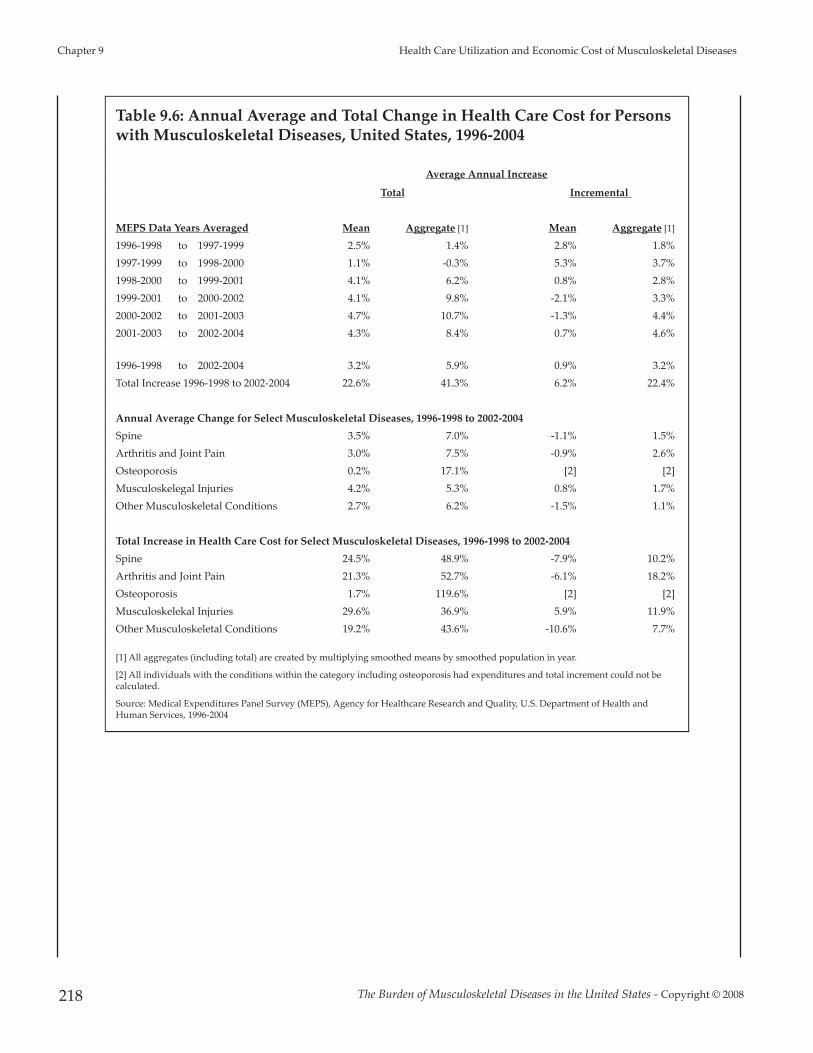
The Burden of Musculoskeletal Diseases in the United States - Copyright © 2008
Chapter 9 Health Care Utilization and Economic Cost of Musculoskeletal Diseases
218
Table 9.6: Annual Average and Total Change in Health Care Cost for Personswith Musculoskeletal Diseases, United States, 1996-2004
Average Annual Increase
Total Incremental
MEPS Data Years Averaged Mean Aggregate [1] Mean Aggregate [1]
1996-1998 to 1997-1999 2.5% 1.4% 2.8% 1.8%1997-1999 to 1998-2000 1.1% -0.3% 5.3% 3.7%1998-2000 to 1999-2001 4.1% 6.2% 0.8% 2.8%1999-2001 to 2000-2002 4.1% 9.8% -2.1% 3.3%2000-2002 to 2001-2003 4.7% 10.7% -1.3% 4.4%2001-2003 to 2002-2004 4.3% 8.4% 0.7% 4.6%
1996-1998 to 2002-2004 3.2% 5.9% 0.9% 3.2%Total Increase 1996-1998 to 2002-2004 22.6% 41.3% 6.2% 22.4%
Annual Average Change for Select Musculoskeletal Diseases, 1996-1998 to 2002-2004Spine 3.5% 7.0% -1.1% 1.5%Arthritis and Joint Pain 3.0% 7.5% -0.9% 2.6%Osteoporosis 0.2% 17.1% [2] [2]Musculoskelegal Injuries 4.2% 5.3% 0.8% 1.7%Other Musculoskeletal Conditions 2.7% 6.2% -1.5% 1.1%
Total Increase in Health Care Cost for Select Musculoskeletal Diseases, 1996-1998 to 2002-2004Spine 24.5% 48.9% -7.9% 10.2%Arthritis and Joint Pain 21.3% 52.7% -6.1% 18.2%Osteoporosis 1.7% 119.6% [2] [2]Musculoskelekal Injuries 29.6% 36.9% 5.9% 11.9%Other Musculoskeletal Conditions 19.2% 43.6% -10.6% 7.7%
[1] All aggregates (including total) are created by multiplying smoothed means by smoothed population in year.
[2] All individuals with the conditions within the category including osteoporosis had expenditures and total increment could not becalculated.
Source: Medical Expenditures Panel Survey (MEPS), Agency for Healthcare Research and Quality, U.S. Department of Health andHuman Services, 1996-2004

The Burden of Musculoskeletal Diseases in the United States - Copyright © 2008 219
Health Care Utilization and Economic Cost of Musculoskeletal Diseases Chapter 9
Table 9.7: Total and Incremental Expenditures for Musculoskeletal Diseases byDemographic Characteristics, United States, 2004
Number of Respondents
Estimated Population(in 1000s) Total Expenditures
IncrementalExpenditures
Demographic Characteristics Total
WithMusculo-
skeletalDiseases Total
WithMusculo-
skeletalDiseases Mean
StandardError (±)
Aggregate(in millions) Mean
Aggregate(in millions)
Total Population 32,737 9,027 293,527 89,740 $6,018 $213 $540.1 $1,645 $147.6
GenderFemale 17,298 5,264 149,658 49,916 $6,506 $225 $324.8 $1,634 $81.6 Male 15,439 3,763 143,869 39,824 $5,407 $371 $215.3 $1,660 $66.1
RaceWhite 25,210 7,301 236,409 76,489 $6,227 $244 $476.3 $1,737 $132.9 Nonwhite 7,527 1,726 57,118 13,252 $4,809 $261 $63.7 $1,114 $14.8
Ethnicity Hispanic 9,022 1,523 42,212 7,668 $3,730 $323 $28.6 $874 $6.7 Nonhispanic 23,715 7,504 251,315 82,072 $6,232 $229 $511.5 $1,717 $140.9
Education [1]
Less than High School 8,359 2,299 49,087 16,141 $6,509 $402 $105.1 $1,056 $17.0 High School 10,422 2,876 91,613 28,947 $6,165 $297 $178.5 $1,731 $50.1 Some College 6,935 1,956 70,070 21,377 $5,847 $384 $125.0 $2,070 $44.3 College Graduate 4,071 1,103 48,284 13,596 $4,762 $334 $64.7 $730 $9.9 Graduate School 2,681 737 32,730 9,256 $6,974 $1,195 $64.6 $2,770 $25.6
Marital status [2]
Never Married 7,012 1,469 62,411 14,975 $3,235 $194 $48.4 $687 $10.3 Married or w/Partner 19,205 5,043 175,791 51,417 $6,067 $298 $311.9 $1,964 $101.0 Divorced-Widowed-Separated 6,457 2,507 55,005 23,289 $7,708 $426 $179.5 $1,558 $36.3
InsuranceAny Private 18,364 5,530 200,787 63,323 $6,062 $284 $383.9 $2,009 $127.2 Public 9,180 2,535 56,530 18,347 $7,679 $313 $140.9 $872 $16.0 None 5,193 962 36,211 8,071 $1,899 $192 $15.3 $529 $4.3
[1] Education status for individuals < 18 was set to the highest level in the household. *Education status for individuals < 18 was set to the highest level in thehousehold marital status for individuals < 18 were set hierarchically by household to married, div/wid/sep, and never married.
[2] Marital status for individuals < 18 were set hierarchically by household to married, div/wid/sep, and never married.
Source: Medical Expenditures Panel Survey (MEPS), Agency for Healthcare Research and Quality, U.S. Department of Health and Human Services, 2004

The Burden of Musculoskeletal Diseases in the United States - Copyright © 2008
Chapter 9 Health Care Utilization and Economic Cost of Musculoskeletal Diseases
220
Table 9.8: Age Distribution of Total and Incremental Direct Costs [1] of MusculoskeletalDiseases, United States 1996-2004
Years AveragedAge 1996-1998 1997-1999 1998-2000 1999-2001 2000-2002 2001-2003 2002-2004
TOTAL COST
Persons with Condition(Sample N)
< 18 858 849 715 762 893 989 1,00218-44 2,481 2,419 2,020 2,252 2,715 3,012 3,03045-64 2,118 2,171 1,922 2,243 2,765 3,102 3,17965+ 1,506 1,564 1,368 1,557 1,879 2,063 2,127
Persons with Condition(Total Population)
< 18 8,837,738 8,587,926 8,270,671 7,909,778 7,812,654 8,015,131 8,339,76618-44 28,857,105 27,582,172 26,465,903 26,434,506 27,764,847 28,914,760 29,523,06945-64 21,794,220 22,136,282 22,574,221 23,930,631 25,951,528 28,209,432 29,802,13565+ 16,489,070 16,867,460 16,766,399 17,325,479 18,219,269 19,158,096 19,910,901
Total Mean in 2004 $
< 18 1,880 2,034 2,271 2,586 2,535 2,359 2,23818-44 2,945 3,019 3,036 3,101 3,148 3,221 3,27845-64 4,993 5,062 5,237 5,598 5,934 6,401 6,68265+ 9,132 9,092 8,792 8,712 9,009 9,283 9,806
Total Aggregate in 2004 $ (in billions)
< 18 16.6 17.5 18.8 20.5 19.8 18.9 18.718-44 85.0 83.3 80.4 82.0 87.4 93.1 96.845-64 108.8 112.1 118.2 134.0 154.0 180.6 199.165+ 150.6 153.4 147.4 150.9 164.1 177.8 195.2
INCREMENTAL COST
Persons with Condition(Sample N)
< 18 858 849 715 762 893 989 1,00218-44 2,481 2,419 2,020 2,252 2,715 3,012 3,03045-64 2,118 2,171 1,922 2,243 2,765 3,102 3,17965+ 1,506 1,564 1,368 1,557 1,879 2,063 2,127
Persons with Condition(Total Population)
< 18 8,837,738 8,587,926 8,270,671 7,909,778 7,812,654 8,015,131 8,339,76618-44 28,857,105 27,582,172 26,465,903 26,434,506 27,764,847 28,914,760 29,523,06945-64 21,794,220 22,136,282 22,574,221 23,930,631 25,951,528 28,209,432 29,802,13565+ 16,489,070 16,867,460 16,766,399 17,325,479 18,219,269 19,158,096 19,910,901
Increment Mean in 2004 $
< 18 1,145 1,191 1,365 1,445 1,355 1,261 1,25018-44 1,140 1,251 1,185 1,208 1,175 1,156 1,10545-64 1,794 1,884 2,186 2,336 2,364 2,577 2,49265+ 2,797 2,598 2,569 2,289 2,156 1,735 1,965
Increment Aggregate in 2004 $ (in billions)
< 18 10.1 10.2 11.3 11.4 10.6 10.1 10.418-44 32.9 34.5 31.4 31.9 32.6 33.4 32.645-64 39.1 41.7 49.3 55.9 61.3 72.7 74.365+ 46.1 43.8 43.1 39.7 39.3 33.2 39.1
[1] In 2004 $.
Source: Medical Expenditures Panel Survey (MEPS), Agency for Healthcare Research and Quality, U.S. Department of Health and Human Services, 1996-2004

The Burden of Musculoskeletal Diseases in the United States - Copyright © 2008 221
Health Care Utilization and Economic Cost of Musculoskeletal Diseases Chapter 9
Table 9.9: Distribution of Total Direct Costs forMusculoskeletal Diseases by Age, United States 1996-2004
Total Aggregate in 2004 $ (in billions)
< 18 18-44 45-64 65+1996-1998 5% 24% 30% 42%1997-1999 5% 23% 31% 42%1998-2000 5% 22% 32% 40%1999-2001 5% 21% 35% 39%2000-2002 5% 21% 36% 39%2001-2003 4% 20% 38% 38%2002-2004 4% 19% 39% 38%
Increment Aggregate in 2004 $ (in billions)
< 18 18-44 45-64 65+1996-1998 8% 26% 30% 36%1997-1999 8% 26% 32% 34%1998-2000 8% 23% 37% 32%1999-2001 8% 23% 40% 29%2000-2002 7% 23% 43% 27%2001-2003 7% 22% 49% 22%2002-2004 7% 21% 47% 25%
Source: Medical Expenditures Panel Survey (MEPS), Agency for Healthcare Research and Quality, U.S.Department of Health and Human Services, 1996-2004
Table 9.10: Annual Change in Total and Incremental Health Care Cost forPersons with Musculoskeletal Diseases by Age, United States 1996-2004
Total Aggregate CostMEPS Data Years Averaged <18 18 to 44 45 to 64 65 & Over1996-1998 to 1997-1999 5.1% -2.0% 3.0% 1.8%1997-1999 to 1998-2000 7.5% -3.5% 5.5% -3.9%1998-2000 to 1999-2001 8.9% 2.0% 13.3% 2.4%1999-2001 to 2000-2002 -3.2% 6.6% 15.0% 8.7%2000-2002 to 2001-2003 -4.5% 6.6% 17.3% 8.4%2001-2003 to 2002-2004 -1.3% 3.9% 10.3% 9.8%Annual Average Increase 1.8% 2.0% 11.9% 4.2%Total Increase 12.3% 13.9% 83.0% 29.7%
Incremental Aggregate CostMEPS Data Years Averaged <18 18 to 44 45 to 64 65 & Over1996-1998 to 1997-1999 1.1% 4.9% 6.7% -5.0%1997-1999 to 1998-2000 10.4% -9.1% 18.3% -1.7%1998-2000 to 1999-2001 1.2% 1.8% 13.3% -7.9%1999-2001 to 2000-2002 -7.4% 2.2% 9.7% -1.0%2000-2002 to 2001-2003 -4.5% 2.5% 18.5% -15.4%2001-2003 to 2002-2004 3.1% -2.4% 2.2% 17.7%Annual Average Increase 0.4% -0.1% 12.8% -2.2%Total Increase 3.0% -0.8% 89.9% -15.2%
Source: Medical Expenditures Panel Survey (MEPS), Agency for Healthcare Research and Quality, U.S. Department of Health and HumanServices, 1996-2004

The Burden of Musculoskeletal Diseases in the United States - Copyright © 2008
Chapter 9 Health Care Utilization and Economic Cost of Musculoskeletal Diseases
222
Table 9.11: Costs of Musculoskeletal Diseases as a Percentage ofGDP by Year, United States, Select Years
Year Direct Costs Indirect Costs Total1963 0.3 0.3 0.71972 0.3 0.4 0.71980 0.5 0.3 0.81988 1.2 1.3 2.51995 1.2 1.7 2.9
1996-1998Total 4.4 2.3 6.7Incremental 1.5 0.5 2.0
2002-2004Total 4.6 3.1 7.7Incremental 1.4 1.0 2.4
Source: Yelin E, Murphy MG, Cisternas AG, Foreman DJP, Helmick CG. Medical care expenditures and earningslosses among persons with arthritis and other rheumatic conditions in 2003, and comparisons with 1997. ArthritisRheum 2007 56:1397-1407. Additional analysis of MEPS 1996-2004 data conducted by Yelin E.
Table 9.12: Total and Incremental Indirect Cost [1] in 2004 Dollarsfor Persons Age 18 to 64 with Musculoskeletal Diseases and aWork History, United States 1996-2004
Indirect Cost (Earnings Loss)
Year
Population withMusculoskeletal
Disease Who Ever Worked
Raw Increment
MeanAggregate(in billion $) Mean
Aggregate(in billion $)
1996-1998 63,840,865 3,052 194.8 706 45.11997-1999 62,603,143 3,773 236.2 983 61.51998-2000 61,508,942 4,097 252.0 1,003 61.71999-2001 63,182,182 4,055 256.2 975 61.62000-2002 66,886,534 4,061 271.6 977 65.32001-2003 70,931,602 4,167 295.6 1,183 83.92002-2004 73,343,698 4,618 338.7 1,506 110.5
[1] Calculated as estimated earnings loss per wage earner due to a musculoskeletal condition in 2004 $.
Source: Medical Expenditures Panel Survey (MEPS), Agency for Healthcare Research and Quality, U.S. Departmentof Health and Human Services, 1996-2004

The Burden of Musculoskeletal Diseases in the United States - Copyright © 2008 223
Health Care Utilization and Economic Cost of Musculoskeletal Diseases Chapter 9
Table 9.13: Average Annual Total and Incremental Direct Costs and Total andIncremental Earnings Losses of Persons Age 18 to 64 for Select MusculoskeletalDiseases, United States 2000-2004
Musculoskeletal Disease
Gout [1]
Osteoarthritis and Allied
Disorders [2]RheumatoidArthritis [3]
Other andUnspecified
Disorders of theBack [4]
Sample N 227 206 128 1,860 # individuals 2,309,103 2,120,057 1,205,328 18,160,441 % total pop 0.8 0.7 0.4 6.3
Direct Costs Total Mean 7,389 10,730 9,938 5,361 Aggregate (in billions) 17.1 22.7 12.0 97.4
Incremental Mean 834 3,883 4,116 857 Aggregate (in billions) 1.9 8.2 5.0 15.6
Earnings Losses Total Mean 6,594 10,369 14,175 1,231 Aggregate (in billions) 15.2 22.0 17.1 22.4
Incremental Mean 1,296 1,175 6,414 771 Aggregate (in billions) 3.0 2.5 7.7 14.0
Total Total Aggregate (in billions) 32.3 44.7 29.1 119.7 Incremental Aggregate (in billions) 4.9 10.7 12.7 29.6
[1] ICD-9-CM Codes: Gout=274 [2] ICD-9-CM Codes: Osteoarthritis and Allied Disorders=715
[3] ICD-9-CM Codes: Rheumatoid Arthritis=714 [4] ICD-9-CM Codes: Other and Unspecified Disorders of the Back=724
Source: Medical Expenditures Panel Survey (MEPS), Agency for Healthcare Research and Quality, U.S. Department of Health and Human Services, 2000-2004

The Burden of Musculoskeletal Diseases in the United States - Copyright © 2008
Chapter 9 Health Care Utilization and Economic Cost of Musculoskeletal Diseases
224
Table 9.14: Base Case ICD-9-CM Codes by Musculoskeletal Disease Included inEconomic Impact AnalysisICD-9-CMCode
ICD-9-CMCodeCondition Name Condition Name
Spine Musculoskeletal Injuries (continued)720 Ankylosing Spondylitis and Other Inflammatory Spondylopathies 810 Fracture of Clavicle721 Spondylosis and Allied Disorders 811 Fracture of Scapula722 Intervertebral Disc Disorders 812 Fracture of Humerus723 Other Disorders of Cervical Region 813 Fracture of Radius and Ulna724 Other and Unspecified Disorders of Back 814 Fracture of Carpal Bone(s)737 Curvature of Spine 815 Fracture of Metacarpal Bone(s)781 Symptoms Involving Nervous and Musculoskeletal Systems 816 Fracture of One or More Phalanges of Hand805 Fracture of Vertebral Column without Mention of Spinal Corde
Injury817 Multiple Fractures of Hand Bones818 Ill-defined Fractures of Upper Limb
806 Fracture of Vertebral Column with Spinal Cord Injury 819 Multiple Fractures Involving Both Upper Limbs, and UpperLimb with Rib(s) and Sternum830 Dislocation of Jaw
846 Sprains and Strains of Sacroiliac Region 820 Fracture of Neck of Femur847 Sprains and Strains of Other and Unspecified Parts of Back 821 Fracture of Other and Unspecified Parts of FemurArthritis and Joint Pain 822 Fracture of Patella274 Gout 823 Fracture of Tibia and Fibula390 Rheumatic Fever without Mention of Heart Involvement (arthritis,
rheumatic, acute or subacute)824 Fracture of Ankle825 Fracture of One or More Tarsal and Metatarsal Bones
391 Rheumatic Fever with Heart Involvement 826 Fracture of One or More Phalanges of Foot710 Diffuse Diseases of Connective Tissue 827 Other, Multiple, and Ill-defined Fractures of Lower Limb711 Arthropathy Associated with Infections 828 Multiple Fractures Involving Both Lower Limbs, Lower with
Upper Limb, and Lower Limb(s) with Rib(s)*712 Crystal Arthropathies713 Arthropathy Associated w/Other Disorders Classified Elsewhere 829 Fracture of Unspecified Bones714 Rheumatoid Arthritis and Other Inflammatory Polyarthropathies 831 Dislocation of Shoulder715 Osteoarthrosis and Allied Disorders 832 Dislocation of Elbow716 Other and Unspecified Arthropathies 833 Dislocation of Wrist719 Other and Unspecified Disorders of Joint 834 Dislocation of Finger725 Polymyalgia Rheumatica 835 Dislocation of Hip726 Peripheral Enthesopathies and Allied Syndromes 836 Dislocation of Knee727 Other Disorders of Synovium, Tendon, and Bursa 837 Dislocation of AnkleOsteoporosis 838 Dislocation of Foot733 Other Disorders of Bone and Cartilage 839 Other, Multiple, and Ill-defined DislocationsOther Musculoskeletal Conditions 840 Sprains and Strains of Shoulder and Upper Arm015 Tuberculosis of Bones and Joints 841 Sprains and Strains of Elbow and forearm135 Sarcoidosis Lupoid of Boeck Lupus Pernio 842 Sprains and Strains of Wrist and Hand170 Malignant Neoplasm of Bone and Articular Cartilage 843 Sprains and Strains of Hip and Thigh171 Malignant Neoplasm of Connective and Other So� Tissue 844 Sprains and Strains of Knee and Leg213 Benign Neoplasm of Bone and Articular Cartilage 845 Sprains and Strains of Ankle and Foot268 Vitamin D Deficiency 848 Other and Ill-defined Sprains and Strains728 Disorders of Muscle, Ligament, and Fascia 875 Open Wound of Chest (wall)729 Other Disorders of So� Tissues 876 Open Wound of Back730 Osteomyelitis, Periostitis, and Other Infections Involving Bone 877 Open Wound of Bu�ock731 Osteitis Deformans & Osteopathies Assoc with Disorders Classified
Elsewhere880 Open Wound of Shoulder and Upper Arm881 Open Wound of Elbow, forearm, and Wrist
732 Osteochondropathies 882 Open Wound of Hand Except Finger(s) Alone734 Flat Foot Pesplanus (acquired) Talipes planus (acquired) 883 Open Wound of Finger(s)735 Acquired Deformities of Toe 884 Multiple and Unspecified Open Wound of Upper Limb736 Other Acquired Deformities of Limbs 885 Traumatic Amputation of Thumb (complete) (partial)738 Other Acquired Musculoskeletal Deformity 886 Traumatic Amputation of Other Finger(s) (complete) (partial)739 Nonallopathic Lesions, NEC 887 Traumatic Amputation of Arm and Hand (complete) (partial)741 Spina Bifida 890 Open Wound of Hip and Thigh754 Certain Congenital Musculoskeletal Deformities 891 Open Wound of Knee, Leg (except Thigh), and Ankle755 Other Congenital Anomalies of Limbs 892 Open Wound of Foot Except Toe(s) Alone756 Other Congenital Musculoskeletal Anomalies 893 Open Wound of Toe(s)V49 Other Conditions Influencing Health Status 894 Multiple and Unspecified Open Wound of Lower LimbV54 Other Orthopaedic A�ercare 895 Traumatic Amputation of Toe(s) (complete) (partial)Musculoskeletal Injuries 896 Traumatic Amputation of Foot (complete) (partial)717 Internal Derangement of Knee 897 Traumatic Amputation of Leg(s) (complete) (partial)718 Other Derangement of Joint 905 Late Effects of Musculoskeletal and Connective Tissue Injuries807 Fracture of Rib(s), Sternum, Larynx, and Trachea 927 Crushing Injury of Upper Limb808 Fracture of Pelvis 928 Crushing Injury of Lower Limb809 Ill-defined Fractures of Bones of Trunk 929 Crushing Injury of Multiple and Unspecified Sites
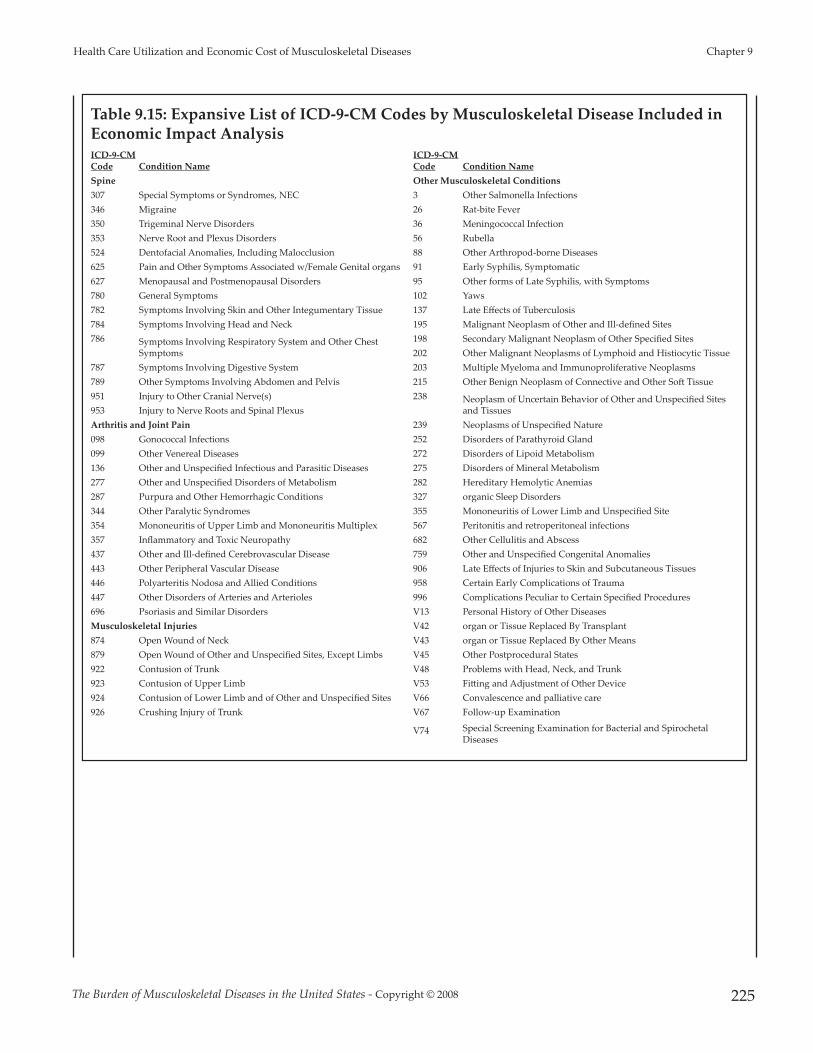
The Burden of Musculoskeletal Diseases in the United States - Copyright © 2008 225
Health Care Utilization and Economic Cost of Musculoskeletal Diseases Chapter 9
Table 9.15: Expansive List of ICD-9-CM Codes by Musculoskeletal Disease Included inEconomic Impact AnalysisICD-9-CMCode
ICD-9-CMCodeCondition Name Condition Name
Spine Other Musculoskeletal Conditions307 Special Symptoms or Syndromes, NEC 3 Other Salmonella Infections346 Migraine 26 Rat-bite Fever350 Trigeminal Nerve Disorders 36 Meningococcal Infection353 Nerve Root and Plexus Disorders 56 Rubella524 Dentofacial Anomalies, Including Malocclusion 88 Other Arthropod-borne Diseases625 Pain and Other Symptoms Associated w/Female Genital organs 91 Early Syphilis, Symptomatic627 Menopausal and Postmenopausal Disorders 95 Other forms of Late Syphilis, with Symptoms780 General Symptoms 102 Yaws782 Symptoms Involving Skin and Other Integumentary Tissue 137 Late Effects of Tuberculosis784 Symptoms Involving Head and Neck 195 Malignant Neoplasm of Other and Ill-defined Sites786 Symptoms Involving Respiratory System and Other Chest
Symptoms198 Secondary Malignant Neoplasm of Other Specified Sites202 Other Malignant Neoplasms of Lymphoid and Histiocytic Tissue
787 Symptoms Involving Digestive System 203 Multiple Myeloma and Immunoproliferative Neoplasms789 Other Symptoms Involving Abdomen and Pelvis 215 Other Benign Neoplasm of Connective and Other So� Tissue951 Injury to Other Cranial Nerve(s) 238 Neoplasm of Uncertain Behavior of Other and Unspecified Sites
and Tissues953 Injury to Nerve Roots and Spinal PlexusArthritis and Joint Pain 239 Neoplasms of Unspecified Nature098 Gonococcal Infections 252 Disorders of Parathyroid Gland099 Other Venereal Diseases 272 Disorders of Lipoid Metabolism136 Other and Unspecified Infectious and Parasitic Diseases 275 Disorders of Mineral Metabolism277 Other and Unspecified Disorders of Metabolism 282 Hereditary Hemolytic Anemias287 Purpura and Other Hemorrhagic Conditions 327 organic Sleep Disorders344 Other Paralytic Syndromes 355 Mononeuritis of Lower Limb and Unspecified Site354 Mononeuritis of Upper Limb and Mononeuritis Multiplex 567 Peritonitis and retroperitoneal infections357 Inflammatory and Toxic Neuropathy 682 Other Cellulitis and Abscess437 Other and Ill-defined Cerebrovascular Disease 759 Other and Unspecified Congenital Anomalies 443 Other Peripheral Vascular Disease 906 Late Effects of Injuries to Skin and Subcutaneous Tissues446 Polyarteritis Nodosa and Allied Conditions 958 Certain Early Complications of Trauma447 Other Disorders of Arteries and Arterioles 996 Complications Peculiar to Certain Specified Procedures696 Psoriasis and Similar Disorders V13 Personal History of Other DiseasesMusculoskeletal Injuries V42 organ or Tissue Replaced By Transplant874 Open Wound of Neck V43 organ or Tissue Replaced By Other Means879 Open Wound of Other and Unspecified Sites, Except Limbs V45 Other Postprocedural States922 Contusion of Trunk V48 Problems with Head, Neck, and Trunk923 Contusion of Upper Limb V53 Fi�ing and Adjustment of Other Device924 Contusion of Lower Limb and of Other and Unspecified Sites V66 Convalescence and palliative care926 Crushing Injury of Trunk V67 Follow-up Examination
V74 Special Screening Examination for Bacterial and SpirochetalDiseases

The Burden of Musculoskeletal Diseases in the United States - Copyright © 2008 227
Appendices

228

The Burden of Musculoskeletal Diseases in the United States - Copyright © 2008 229
ICD-9-CM Codes for Musculoskeletal Diseases Appendix A
Appendix A - Musculoskeletal Diseases Diagnosis Codes
Table A1: ICD-9-CM Diagnosis Codes for Specific Musculoskeletal Diseases
Condition ICD-9-CM Code Description
Chapter 2: Spinal Deformity and Related Conditions737 Curvature of the spine
Chapter 3: Spine: Low Back and Neck PainLumbar/ Low Back Pain
Back Disorders 720*Ankylosing spondylitis and other inflammatoryspondylopathies
721.2-.721.9 Spondylosis and allied disorders724 Other and unspecified disorders of back
Disk Disorders 722.10, 722.11 Displacement of intervetebral disc722.30-722.39 Schmorl's nodes722.51, 722.52, 722.60 Degeneration of intervetebral disc722.72, 722.73 Intervertebral disc disorder with myelopathy722.80, 722.82, 722.83 Postlaminectomy syndrome722.90, 722.92, 722.93 Other and unspecified disc disorder
Back Injury 805.20-805.80Closed fracture of vertebra without mention of spinalcoard injury
806.20-806.90 Closed fracture of vertebra with spinal cord injury839.20-839.49 Closed dislocation, betebra846 Sprains and strains of sacroiliac region847.10-749.90 Other sprains and strains of back
Cervical/Neck PainNeck Disorders 721.00, 721.11 Cervical spondylosis
723.00-723.90 Disorders of cervical region
Disk Disorders 722.00 Displacement of cervical intervertebral disc722.40 Degeneration of cervical intervertebral disc722.71 Intervertebral disc disorder, with myelopathy722.81 Postlaminectomy syndrome of cervical region722.91 Other and unspecified disc disorders of cervical region
Neck Injury 805Closed fFracture of cervical vertebra without mentionof spinal cord injury
806Closed fracture of cervical bertebra with spinal cordinjury
839 Closed dislocation, cervical vertebra847.00 Neck sprain
Spine Procedures 81.02, 81.03 Cervical fusion(ICD-9-CM ProceduresCode) 81.04, 81.05 Thoracic fusion
81.06-81.08 Lumbar fusion81.00, 81.01 Other fusion81.62-81.64 Fusion/refusion multiple vertebrae81.30-81.39 Spine refusion03.09 Spinal decompression80.50, 80.51 Spinal diskectomy

The Burden of Musculoskeletal Diseases in the United States - Copyright © 2008230
Appendix A ICD-9-CM Codes for Musculoskeletal Diseases
Table A1 (continued) : ICD-9-CM Diagnosis Codes for Specific Musculoskeletal Diseases
Condition ICD-9-CM Code Description
Chapter 4: Arthritis and Joint Pain
Arthritis and OtherRheumatic Conditions
715 Osteoarthritis714 Rheumatoid arthritis274, 712 Gout and other crystal arthropathies710.00 Systemic lupus erythematosus (Lupus)710.01 Sytemic sclerosis710.20 Sjogren's syndrome729.10 Fibromyalgia446.50, 725.00 Polymyalgia rheumatica and giant cell arteritis099.30, 696.00, 720, 721 Spondylarthropathies716, 719 Joint pain354, 711, 726, 727, 728, 729.40 All other arthritis and rheumatic conditions
Joint replacement 81.54, 815.5, 00.80-00.84 Knee arthroplasty/revision arthroplasty
(ICD-9-CM ProceduresCode)
81.51-81.53, 00.70-00.76 Hip arthroplasty/revision arthroplasty81.56, 81.57, 81.59 Ankle, foot, toe arthroplasty81.71, 81.72 Finger arthroplasty81.73-81.73, 81.79 Wrist arthroplasty81.80, 81.81, 81.83 Shoulder arthroplasty81.84, 81.85 Elbow arthroplasty81.97 Upper extremity unspecified
Chapter 5: Osteoporosis and Bone HealthPrimary Osteoporosis 733 Osteoporosis
Low Energy Fractures805.00-805.08, 805.20, 805.40, 805.60, 805.80, 808.00,808.41-808.49, 808.80 Vertebral and pelvic fracture
810.00-810.03, 811.00-811.03, 811.09, 812.00-812.03,812.09, 812.20, 812.21, 812.40-812.44, 812.49 Upper limb fracture (closed)
813.00-813.08, 813.20-813.23, 813.40-813.45, 813.80-813.83, 814.00-814.09, 815.00-815.04, 815.09 Wrist fracture (closed)820.00-820.03, 820.09, 820.20-820.22, 820.80 Hip fracture (closed)
821.00-821.01, 821.20-821.23, 821.29, 822.00, 823.00-823.02, 823.20-823.22, 823.80-823.82 Lower limb fracture, excluding foot and ankle (closed)
824.00, 824.20, 824.40, 824.60, 824.80, 825.00,825.20-825.25, 825.29 Ankle and foot fracture (closed)733.10-733.16, 733.19, 733.93-733.95 Stress and pathological fracturesE800-E807, E810-E838, E840-E848, E990-E999 Exclude cases with E-code of high energy fracture
Secondary Osteoporosis
242.90-242.91, 252.00-252.02, 252.08, 255.00, 255.30,256.20, 256.31, 256.39, 257.10, 257.20, 259.30, 259.90,268.20, 268.90, 588.00, 588.81, 627.20, 627.40, 627.80,627.90 Diagnosis that may lead to osteoporosis
806.00-806.40, 806.50, 806.60-806.62, 806.69, 807.70-706.72, 706.79, 806.80, 806.90 Vertebral fractures with spinal cord injury

The Burden of Musculoskeletal Diseases in the United States - Copyright © 2008 231
ICD-9-CM Codes for Musculoskeletal Diseases Appendix A
Table A1 (continued) : ICD-9-CM Diagnosis Codes for Specific Musculoskeletal Diseases
Condition ICD-9-CM Code Description
Chapter 6: Musculoskeletal InjuriesFractures 807.00-807.4, 808, 809, 819, 828, 829 Trunk and multiple site fractures
810, 811, 812, 813, 814, 815, 816, 817 Upper limb fractures820, 821, 822, 823, 824, 825, 826, 827 Lower limb fractures
Derangement 717 Knee derangement718 Other joint derangement
Dislocation 831, 832, 833 Upper limb dislocation834, 835, 836, 837, 838 Lower limb dislocatin839 Other site dislocation
Sprains/Strains 840, 841, 842 Upper limb sprain/strain843, 844, 845 Lower limb sprain/strain848 Other site sprain/strain
Contusions 922, 923, 924Crushing Injury 926, 927, 928, 929
Open Wound874, 875, 876, 877, 879, 880, 881, 882, 883, 884, 890,891, 892, 893, 894
Traumatic Amputation 885, 886, 887, 895, 896, 897Late Effect of Injury 954, 955, 956, 957, 959
Chapter 7: Musculoskeletal Congenital and Infantile Developmental Conditions741 Spina bifida754.1-754.9 Certain congenital musculoskeletal deformities755 Other congenital anomalies of limbs756 Other congenital musculoskeletal anomalies
Chapter 8: Neoplasms of Bone and Connective TissueData based on National Cancer Institute Classifications

232

The Burden of Musculoskeletal Diseases in the United States - Copyright © 2008 233
Musculoskeletal Diseases Data Summaries Appendix B
Appendix B - Musculoskeletal Data Summaries
Table B1: Hospitalizations by First Listed Diagnosis, All Musculoskeletal Diseases byAge Category and Diagnosis Code, United States 2004
ICD-9-CMDescription < 18 18 - 44 45 - 64 64+ Total 88.8 Other arthropod-borne disease Other specified arthropod-
borne diseases * * * * 2,271
135 Sarcoidosis . 2,816 3,296 * 6,900 170.7 Malignant neoplasm of bone and articular cartliage Long bones
of lower limb 890 * * * 1,606 171.2 Malignane neoplasm of connective and other so� tissue Upper
limb, including shoulder * * * * 869 171.3 Malignane neoplasm of connective and other so� tissue Lower
limb, including hip * * 867 * 2,207
171.4 Malignane neoplasm of connective and other so� tissue Thorax * * * * 853 171.5 Malignane neoplasm of connective and other so� tissue
Abdomen * * * * 1,286
171.6 Malignane neoplasm of connective and other so� tissue Pelvis * * * * 1,059 198.5
Secondary malignant neoplasm of other specified sites Boneand bone marrow * 2,761 13,015 19,779 35,682
203 Multiple myeloma ad immunoproliferative neoplasms * * 7,179 11,663 19,324 213.7 Benign neoplasm of bone and articular cartilage Long bones of
lower limb * * * * 861
214.1 Lipoma Other skin and subcutaneous tissue * * * * 1,030 238.1 Neoplasm of uncertain behavior of other and unspecified sites
and tissues Connective and other so� tissue * * * * 1,028
239.2 Neoplasms of unspecified nature Bone so� tisue and skin * * * * 949
252 Disorders of parathyroid gland Hyperthroidism * 1,404 3,724 3,569 8,751
252.1 Disorders of parathyroid gland Hypoparathyroidism * * * * 1,172
274 Gout Gouty arthroplathy . 1,049 2,993 7,075 11,117 275.4 Disorders of mineral metabolism Disorders of calcium
metabolism * 2,163 4,780 7,864 14,943
282.6 Hereditary hemolytic anemias Sickle-cell disease 18,597 47,744 6,515 * 72,910
343 Infantile cerebral palsy 1,449 * * * 2,097
344 Other paraltic syndromes * 1,396 1,020 904 3,880
354 Mononeuritis of upper limb and mononeuritis multiplex * 928 1,851 1,530 4,359
355 Mononeuritis of lower limb and unspecified site * 1,597 2,370 2,492 6,600
356.90 Hereditary and idiopathic peripheral neuropathy Unspecified * * * 1,549 2,716
682.20 Other cellulitis and abscess Trunk 4,859 14,386 16,776 7,087 43,108
682.30 Other cellulitis and abscess Upper arm and forearm 3,959 20,415 15,686 13,361 53,421
682.40 Other cellulitis and abscess Hand, except fingers and thumb 2,341 12,390 9,173 6,770 30,674
682.60 Other cellulitis and abscess Leg, except foot 11,577 52,038 74,888 92,290 230,793
682.70 Other cellulitis and abscess Foot, except toes 3,635 8,829 15,380 16,893 44,737
696.00 Psoriasis and similar disorders Psoriatic arthropathy * * * * 811
710 Diffuse diseases of connective tissue 2,634 10,716 5,722 2,865 21,937
711 Arthropathy associated with infections 2,515 6,259 7,627 7,910 24,311 714 Rheumatoid arthritis and other inflammatory
polyarthropathies * 2,864 7,200 8,982 19,832
* Estimate does not meet standard of reliability or precision.
Source: National Center for Health Statistics, National Inpatient Survey, 2004

The Burden of Musculoskeletal Diseases in the United States - Copyright © 2008
Appendix B Musculoskeletal Diseases Data Summaries
234
Table B1 (continued): Hospitalizations by First Listed Diagnosis, All Musculoskeletal Diseasesby Age Category and Diagnosis Code, 2004
ICD-9-CM Description < 18 18 - 44 45 - 64 64+ Total
715 Osteoarthrosis and allied disorders * 19,347 236,387 406,485 662,357
716 Other and unspecified arthroplasties * 4,404 7,891 7,583 20,133
717 Internal derangement of knee 891 3,567 2,538 931 7,927
718 Other derangement of joint 2,399 6,444 4,074 3,116 16,033
719 Other and unspecified disorders of joint 1,442 4,855 7,794 14,723 28,814
720 Ankylosing spondylitis and other inflammatoryspondylopathies * * * * 1,854
721 Spondylosis and allied disorders * 13,290 43,215 40,516 97,104
722 Intervertebral disc disorders * 121,008 143,816 70,139 335,619
723 Other disorder of cervical region * 5,603 13,572 7,858 27,461
724 Other and unspecified disorders of back * 18,634 46,448 82,387 148,266
725 Polymyalgia rheumatica * * * 2,147 2,397
726 Peripheral enthesopathies and allied syndromes * 7,862 14,997 14,128 37,633
727 Synovitis & tenosynovitis 2,656 4,645 9,321 7,795 24,417
728 Disorders of muscle, ligament, and fascia 1,604 9,027 9,463 12,411 32,504
729 Other disorders of so� tissue 1,892 8,998 12,507 11,628 35,025
730 Acute osteomyelitis 3,968 11,866 20,069 22,188 58,091
732 Osteochondropathies 3,135 * * * 4,046
733 Osteoporosis 4,993 24,706 40,572 89,527 159,797
734 Flat foot * * * * 975
735 Acquired deformities of toe * * 1,044 1,148 2,564
736 Acquired deformities of forearm 2,189 1,695 2,760 2,604 9,249
737 Curvature of spine 6,637 1,820 2,130 1,776 12,364
738.1 Other acquired deformity of head, other specified deformity * 1,888 1,198 * 3,874
738.4 Other acquired deformity (Acquired spondylolisthesis) * 4,401 11,008 10,493 26,181
741 Spina bifida 1,261 * * * 2,043
754.3 Congenital musculoskeletal deformities (congenitaldislocation of hip), unilateral dislocation 1,368 * * * 1,514
754.5 Congenital musculoskeletal deformities (Varus deformities of feet) 1,097 * * * 1,422
754.8 Congenital musculoskeletal deformities (Other specifiednonteratogenic anomalies), pectus excavatum 1,697 * * * 1,887
755 Other congenital anomalies of limbs (Polydactyly) 2,813 1,101 * * 4,743
756.1 Other congenital musculoskeletal anomalies (spine) * 1,787 3,557 2,762 8,877
756.6 Other congenital musculoskeletal anomalies (Anomalies of diaphragm) 852 * * * 902
756.7Other congenital musculoskeletal anomalies (Anomalies ofabdominal wall) 1,123 * * * 1,123
781.00 Symptoms involving nervous & musculoskeletal systems(Abnormal involuntary movements) 982 1,217 827 906 3,932
* Estimate does not meet standard of reliability or precision.
Source: National Center for Health Statistics, National Inpatient Survey, 2004

The Burden of Musculoskeletal Diseases in the United States - Copyright © 2008 235
Musculoskeletal Diseases Data Summaries Appendix B
Table B1 (continued): Hospitalizations by First Listed Diagnosis, All MusculoskeletalDiseases by Age Category and Diagnosis Code, 2004
ICD-9-CM Description < 18 18 - 44 45 - 64 64+ Total
781.20 Symptoms involving nervous & musculoskeletal systems(Abnormality of gait) * * 1,947 10,884 13,691
781.30 Symptoms involving nervous & musculoskeletal system(Lack of coordination) * 966 2,238 3,550 7,068
781.9 Symptoms involving nervous & musculoskeletal systems(Other symptoms) * * 1,252 * 2,534
805 Fracture of vertebral column without mention of spinal cordinjury 3,523 20,394 15,436 46,025 85,379
806 Fracture of vertebral column with mention of spinal cordinjury * 5,347 3,207 2,415 11,502
807 Fracture of vertebral column with mention of spinal cordinjury 919 7,832 12,255 20,178 41,184
808 Fracture of pelvis (Acetabulum, closed) 2,577 12,013 9,590 34,950 59,130 810 Fracture of clavicle (closed) * 2,364 1,304 1,352 5,581 811 Fracture of scapula (closed) * 1,325 * * 2,549 812 Fracture of humerus (Upper end, closed) 16,000 8,607 12,414 35,858 72,879 813 Fracture of radius and ulna (Upper end, closed) 11,633 17,762 14,859 18,220 62,473 814 Fracture of carpal bone(s) (Closed) * 845 * * 1,659 815 Fracture of metacarpal bone(s) (Closed) * 2,776 951 * 4,906 816 Fracture of one or more phalanges of hand (Closed) 821 4,253 2,520 1,136 8,730 820 Fracture of neck of femur (transcervical fracture, closed) 2,500 7,988 27,812 263,244 301,545
821 Fracture of other and unspecified parts of femur (Sha� orunspecified part, closed) 14,140 16,619 9,643 21,646 62,047
822 Fracture of patella * 2,763 3,751 6,072 12,907 823 Fracture of tibia & fibula, upper end (closed) 8,601 30,748 22,136 14,314 75,799 824 Fracture of ankle 7,631 33,878 35,469 29,586 106,564 825 Fracture of one or more tarsal and metatarsal bones 1,290 11,257 5,784 2,607 20,938 826 Fracture of one or more phalanges of foot * 1,252 902 * 2,818 831 Dislocation of shoulder * 810 * 1,375 3,085 835 Dislocation of hip * 1,060 * * 2,739 836 Dislocation of knee * 1,744 1,001 1,096 4,027 839 Other, multiple, and ill-defined dislocations * 1,425 * 1,103 3,677 840 Sprains and strains of shoulder and upper arm * 1,352 6,027 6,854 14,327
843 Sprains and strains of hip and thigh * * * 2,120 2,695 844 Sprains and strains of knee and leg 1,123 4,873 3,139 3,257 12,391 845 Sprains and strains of ankle and foot * 1,844 1,158 852 4,050 846 Sprains and strains of sacroiliac region * 911 * 814 2,348 847 Sprains and strains of other and unspecified parts of back * 6,353 4,457 2,800 14,326
848.8 Other and ill-defined sprains and strains (Other specifiedsites of sprains and strains) * * * * 1,121
876.00 Open wound of back * 940 * * 1,267
* Estimate does not meet standard of reliability or precision.
Source: National Center for Health Statistics, National Inpatient Survey, 2004

The Burden of Musculoskeletal Diseases in the United States - Copyright © 2008236
Appendix B Musculoskeletal Diseases Data Summaries
Table B1 (continued): Hospitalizations by First Listed Diagnosis, All MusculoskeletalDiseases by Age Category and Diagnosis Code, 2004
ICD-9-CM Description < 18 18 - 44 45 - 64 64+ Total 877.00 Open wound of bu�ock * * * * 813 880.00 Open wound of shoulder and upper arm * 1,831 * * 2,813 881.00 Open wound of elbow, forearm, and wrist 828 5,264 2,138 1,207 9,436 882.00 Open wound of hand except finger(s) alone * 4,248 1,767 948 7,723 883.00 Open wound of finger(s) * 4,667 1,879 * 7,638
885 Traumatic amputation of thumb * 925 * * 1,715 886 Traumatic amputation of other finger(s) * 3,097 1,425 * 5,624 890 Open wound of hip and thigh 951 2,236 * * 4,068 891 Open wound of knee, leg [except thigh], and ankle 1,748 5,448 2,151 2,762 12,110 892 Open wound of foot except toe(s) alone 1,243 1,610 1,049 * 4,325 893 Open wound of toe(s) * * * * 925 895 Traumatic amputation of toe(s) * * * * 1,102 897 Traumatic amputation of leg(s) * * * * 932 922 Contusion of trunk 1,036 3,638 3,205 5,420 13,300 923 Contusion of upper limb * 986 * 1,674 3,748 924 Contusion of lower limb and of other and unspecified sites 892 2,611 3,811 14,159 21,472 927 Crushing injury of upper limb * 1,379 * * 2,389 928 Crushing injury of lower limb * 1,218 899 * 2,733
955 Injury to peripheral nerve(s) of shoulder girdle and upperlimb * 1,953 * * 2,975
958.30 Pos�raumatic wound infection, not else classified * 1,120 995 * 2,769 959.10 Injury, other & unspecified (trunk) 910 1,465 1,229 1,785 5,390 959.60 Injury, other & unspecified (Hip & thigh) * * * 1,174 1,416 959.70 Injury, other & unspecified (Knee, leg, ankle & foot) * * * * 1,248
996.40 Mechanical complication of internal orthopaedic device,implant & gra� * 10,484 31,651 50,958 94,061
996.60 Infection & inflammatory reaction due to internal prostheticdevice, implant & gra�- internal joint prosthesis 10,623 35,215 67,178 74,523 187,540
996.70 Infection and inflammatory reaction (due to other internalorthopaedic device, implant, and gra�) 2,316 20,266 59,662 67,863 150,107
997.60 Amputation stump complication * 2,755 9,939 10,618 23,457
997.79Other complication of internal prosthetic device, implant, &gra� - due to internal joint prosthesis * * * * 1,004
V54.00 Other orthopaedic a�ercare 860 1,424 2,934 10,229 15,447 V67.00 Follow-up examination, following surgery * * 1,261 1,276 3,285
* Estimate does not meet standard of reliability or precision.
Source: National Center for Health Statistics, National Inpatient Survey, 2004

The Burden of Musculoskeletal Diseases in the United States - Copyright © 2008 237
Musculoskeletal Diseases Data Summaries Appendix B
Table B2: Total Hospitalizations for the 30 Most Frequently Listed MusculoskeletalDiseases by 3-digit ICD-9-CM code, United States 2004
3-Digit ICD-9-CM
Code Description Hospitalizations715 Osteoarthrosis and allied disorders 826,022272 Disorders of lipoid metabolism 467,005722 Intervertebral disc disorders 416,141733 Other disorders of bone and cartilage 352,170V45 Other postprocedural states 328,291820 Fracture of neck of femur 305,553996 Complications peculiar to certain specified procedures 239,841724 Other and unspecified disorders of back 199,936V10 Personal history of malignant neoplasm 190,379V43 Organ or tissue replaced by other means 171,072721 Spondylosis and allied disorders 148,515997 127,802824 Fracture of ankle 117,405682 Other cellulitis and abscess 117,053730 Osteomyelitis, periostitis, and other infections involving bone 102,332813 Fracture of radius and ulna 92,251823 Fracture of tibia & fibula 83,320726 Peripheral enthesopathies and allied syndromes 75,361812 Fracture of humerus 74,556716 Other and unspecified arthroplasties 72,446714 Rheumatoid arthritis and other inflammatory polyarthropathies 66,511821 Fracture of other and unspecified parts of femur 66,502727 Other disorders of synovium, tendon and bursa 61,697729 Other disorders of so� tissue 61,242790 Nonspecificfindings on examination of blood 60,882805 Fracture of vertebral column without mention of spinal cord injury 60,866738 Other acquired deformity 56,731357 Inflammatory and toxic neuropathy 51,502274 Gout 51,033719 Other and unspecified disorders of joint 50,055
Source: National Center for Health Statistics, National Inpatient Survey, 2004

The Burden of Musculoskeletal Diseases in the United States - Copyright © 2008238
Appendix B Musculoskeletal Diseases Data Summaries
Table B1: Most Frequently Performed Operations on the Musculoskeletal System,Excluding Jaw, United States 2004
ICD-9-CM Code Description Procedures81.54 Total knee replacement 463,27003.31 Spinal tap 378,07380.51 Excision of intervertebral disc 336,84703.09 Other exploration and decompression of spinal canal 268,95581.62 Fusion or refusion of 2-3 vertebrae 243,799
03.90 Insertion of catheter into spinal canal for infusion of therapeutic orpalliative substances 234,821
81.51 Total hip replacement 230,09279.35 Open reduction of fracture with internal fixation, Femur 171,02879.36 Open reduction of fracture with internal fixation, Tibia and fibula 155,03503.91 Injection of anesthetic into spinal canal for analgesia 137,29081.08 Lumbar lumbosacral fusion, posterior technique 126,44181.02 Other cervical fusion, anterior technique 123,14477.79 Excision of bone for gra�, Other (pelvic bones, phalanges, vertebrae) 110,96384.51 Insertion of interbody spinal fusion device 108,57681.52 Partial hip replacement 105,20081.91 Arthrocentesis 69,10403.92 Injection of other agent into spinal canal 59,58884.11 Amputation of toe 59,48679.15 Closed reduction of fracture with internal fixation, Femur 57,45479.32 Open reduction of fracture with internal fixation, Radius and ulna 48,83204.81 Injection of anesthetic into peripheral nerve for analgesia 43,99384.15 Other amputations below knee 38,44181.53 Revision of hip replacement 38,04278.55 Internal fixation of bone without fracture reduction, Femur 36,21381.92 Injection of therapeutic substance into joint or ligament 35,87581.55 Revision of knee replacement 35,75779.31 Open reduction of fracture with internal fixation, Humerus 35,047
78.69 Removal of implanted devices from bone, Other (pelvic bones, phalanges,vertebrae) 33,031
84.17 Amputation above knee 32,72383.63 Rotator cuff repair 32,175
Source: National Center for Health Statistics, National Inpatient Survey, 2004

The Burden of Musculoskeletal Diseases in the United States - Copyright © 2008 239
Data Sources Appendix C
Appendix C - Data SourcesThe primary sources of data used in this publicationwere the National Health Care Surveys (NHCS) familyof provider-based surveys conducted by the NationalCenter for Health Statistics (NCHS). NCHS surveysare designed to meet the need for objective, reliableinformation about the organizations and providersthat supply health care, the services rendered, and thepatients they serve. The National Health Care Surveysare designed to answer key questions of interest tohealth care policy makers, public health professionals,and researchers. These can include the factors thatinfluence the use of health care resources, the qualityof health care, including safety, and disparities inhealth care services provided to population subgroupsin the United States.
Collectively, NCHS surveys have a combination ofdesign features that make them unique. The surveysare nationally representative, provider-based, andcover a broad spectrum of health care se�ings. Withineach se�ing, data are collected from a sample oforganizations that provide care (such as home healthcare agencies, inpatient hospital units, or physicianoffices) and from samples of patient (or discharge)encounters within the sampled organizations.
Each of the National Health Care Surveys collects coreinformation which remains stable over time.Consequently, trends in the types of care delivered ineach se�ing can be monitored in an objective andreliable manner and can be examined in relation tocharacteristics of providers, patients, and clinicalmanagement of patients’ care. In addition, the surveysare flexible enough to accommodate special datacollection modules and to sample new providerorganizations as new information is needed. For mostdatabases, the most current year of data available atthe time of analysis was for the year 2004.
Timeliness of data releases and the time required forthorough analysis of multiple databases limits the time
span for data presented in the book. In recent years,the release of NCHS databases has shortened.Currently data for 2005 is available. However, at thetime work began on this project, 2004 data was themost current year available for most databases.
NHCS surveys used in the Burden of MusculoskeletalDiseases in the United States include:
[1] The National Health Interview Survey (NHIS), anationwide cross-sectional survey of the non-institutional population conducted by householdinterview, designed to monitor the health of theUnited States population through the collectionand analysis of data on a broad range of healthtopics. 2005 survey data used; sample size 98,649.
[1a] The National Health Interview Survey InjuryDatabase (NHIS-Injury).
[2] The National Hospital Discharge Survey (NHDS),is a national probability survey designed to meetthe need for information on characteristics ofinpatients discharged from non-Federal short-stayhospitals in the United States. The NHDS collectsdata from a sample of approximately 270,000inpatient records acquired from a national sampleof about 500 hospitals. Only hospitals with anaverage length of stay of fewer than 30 days for allpatients, general hospitals, or children’s generalhospitals are included in the survey. Federal,military, and Department of Veterans Affairshospitals, as well as hospital units of institutions(such as prison hospitals), and hospitals withfewer than six beds staffed for patient use, areexcluded. 2004 survey data used; sample size370,785.
[3] The National Ambulatory Medical Care Survey(NAMCS), based on a sample of visits to

nonfederally employed office-based physicianswho are primarily engaged in direct patient care(physicians in the specialties of anesthesiology,pathology, and radiology are excluded from thesurvey). 2004 survey data used; sample size 25,286.
[4]&[5] The National Hospital Ambulatory MedicalCare Survey (NHAMCS), which collects data onthe utilization and provision of ambulatory careservices in hospital emergency (ER) and outpatientdepartments (OP). Findings are based on anational sample of visits to the emergencydepartments and outpatient departments ofnoninstitutional general and short-stay hospitals,exclusive of Federal, military, and VeteransAdministration hospitals, located in the 50 Statesand the District of Columbia. 2004 survey dataused; sample size 36,589 (ER) and 31,783 (OP).
[6] The National Health and Nutrition ExaminationSurvey (NHANES), the only national survey thatcollects extensive health information from bothface-to-face interviews and medical examinations,providing unique opportunities to study majornutrition, infection, environmental, and chronichealth conditions in the U.S. 2004 survey dataused; sample size 10,122.
[7] The National Nursing Home Survey (NNHS), onein a continuing series of nationally representativesample surveys of United States nursing homes,their services, their staff, and their residents. 2004survey data used; sample size 13,507.
The following surveys were also used:
[8] The Healthcare Cost and Utilization ProjectNationwide Inpatient Sample (HCUP-NIS),conducted by the Agency for Healthcare Researchand Quality (AHRQ), a family of health caredatabases that brings together the data collectionefforts of state data organizations, hospital
associations, private data organizations, and theFederal government to create a nationalinformation resource of patient-level health caredata. 2004 survey data used; sample size 800,457.
[9] The Medical Expenditures Panel Survey (MEPS) ,conducted by the Agency for Healthcare Researchand Quality, a set of large-scale surveys of familiesand individuals, their medical providers, andemployers across the United States, and the mostcomplete source of data on the cost and use ofhealth care and health insurance coverage. Dataaveraged for seven 3-year periods from 1996 to2004.
[10] The Survey of Occupational Injuries and Illnesses,conducted by the Bureau of Labor Statistics, U.S.Department of Labor, that provides data onillnesses and injuries on the job and data onworker fatalities. Published summary data from2005.
[11] The National Birth Defects Prevention Network(NBDPN), from which estimates of prevalence forselected defects are drawn based on state birthdefects surveillance programs.
[12] The Centers for Disease Control and Prevention(CDC) Metropolitan Atlanta Congenital DefectsProgram (MACDP), which collects data on birthdefects.
[13] The CDC Metropolitan Atlanta DevelopmentalDisabilities Surveillance Program (MADDSP),which monitors the occurrence of selecteddevelopmental disabilities in school-age children.
[14] The Surveillance, Epidemiology, and End Results(SEER) Program of the National Cancer Institute,DCCPS, Surveillance Research Program, CancerStatistics Branch, an authoritative source ofinformation on cancer incidence and survival in
The Burden of Musculoskeletal Diseases in the United States - Copyright © 2008
Appendix C Data Sources
240

the United States, including cancer incidence andsurvival data from population-based cancerregistries covering approximately 26% of the U.S.population. Published summary data from 2005data submission.
[15] National Cancer Data Base (NCDB), maintainedby the American College of Surgeons Commissionon Cancer.
The small size of some databases precludes analysis ata detailed level. In general, ICD-9-CM codes werecombined into major musculoskeletal diseaseclassifications to provide sufficient sample size forreliable estimates.
Extensive use was also made of published studies inscientific and epidemiologic journals as secondarysources of data.
it is important to recognize that any one source of dataprovides an incomplete view of the frequency andimpact of a disease or condition. Interview surveys, forinstance, generally underestimate the frequency ofmost musculoskeletal diseases. However, informationobtained through the use of interviews is essential toassess an individual’s symptoms or how thatindividual indicates he or she has been affected by adisease. In addition, for some conditions, this may bethe only possible means of diagnosis and collection ofdata.
In contrast, the use of objective methods such asphysical examination, laboratory measurements, andradiographs for the detection and diagnosis of diseaseand injury is not dependent on the subjective reportingof symptoms. However, the objective evidence used toestablish the presence or absence of a condition doesnot always correlate with reported symptoms. It isclear that numerous individuals who report symptomsdo not have evidence of disease upon examinationand, conversely, some individuals who have objective
evidence of disease do not experience symptoms.Thus, although objective measures are valuable tools,they may yield an incomplete picture of the impact ofa given disease. They are also more expensive, involvea smaller number of individuals, and mayunderrepresent less frequently occurring disorders.
Data obtained from medical records are also subject tocertain limitations. Many persons affected with certainmusculoskeletal diseases do not seek medical care.Although records of visits to physicians and hospitalsprovide estimates of the volume of visits, these recordsdo not include those who do not seek medical care.Therefore, data based on existing records, will yieldonly a partial representation of how variousmusculoskeletal diseases affect the population.
Medical records do not necessarily indicate theunderlying musculoskeletal condition. For instance,fractures at various sites, especially hip fractures, are amajor consequence of osteoporosis. when admi�ed tothe hospital; however, a fracture diagnosis is usuallylisted rather than osteoporosis. Medical records mayalso be subject to “upcoding” to maximizereimbursement and may overstate the frequency ofmore severe conditions.
By analyzing and including data from a wide range ofsources, each with its own strength and weaknesses, itis hoped that the results presented have beenintegrated into a comprehensive and reasonableunderstanding of the impact of musculoskeletaldiseases on the United States population.
The Burden of Musculoskeletal Diseases in the United States - Copyright © 2008 241
Data Sources Appendix C

Index
The Burden of Musculoskeletal Diseases in the United States - Copyright © 2008 243
A
Activities of daily living, 1. See also Bed days, Lostwork days
Related to arthritis, 82Related to injury, 128, 129Related to medical conditions, 4, 5Related to osteoporosis, 97Related to spine problems, 29
Activity restrictions, 28. See also Activities of daily living; Impairment; Limitations
Adolescent idiopathic scoliosis. See ScoliosisAging, 6, 22, 29, 62, 64, 97, 104, 195, 196, 197, 199, 204,
208, 209Allergies, 21Ambulatory care, 198, 19, 201, 204, 205. See also
Outpatient careArthritis, 72, 74, 75, 76, 77, 78, 83Injuries, 137Spine, 33
American College of Surgeons, 173, 179, 184Amputation. See InjuriesAnkylosing spondylitis, 78Arthritis, 3, 4, 6, 8, 71-96, 97, 129, 173, 196, 197, 198,
201, 202, 204, 205, 207, 208, 210. See also Fi-bromyalgia; Giant cell arteritis; Gout; JuvenileArthritis; Lupus; Osteoarthritis; Polymyalgiarheumatica; Rheumatoid; Sclerosis; Sjögren’ssyndrome
Arthroplasty, 73, 79-83
B
Back pain, 3, 6, 21-53, 61, 62, 130, 131. See also Low backpain; Neck pain
Age, 23, 24, 26Bed days, 6, 28-29, 47 Burden, 27Cervical (neck), 3, 21, 25-26, 27, 28, 31, 33 Gender, 25, 26-27 Length of stay (inpatient), 24, 26Limitations, 27-29Lost work, 27-28, 47Lumbar (low back), 3, 6, 21-24, 25, 26, 27, 28, 29, 31,
57 Procedures (spine), 29-32Prevalence, 3, 6
Radiating leg pain, 6, 21, 29 Site, 22Treatment episodes, 22Treatment location, 23, 25
Bed days, due toChronic conditions, 5-6Musculoskeletal injuries, 129Spine conditions, 28-29
Biological agent, 78Blacks/African Americans, 5, 61, 71, 99 Bone and Joint Decade, 1Bone mass, 97, 98, 99Bracing, 55, 57, 58, 59, 60, 61, 64 Burden, 1, 2, 6
Arthritis, 71, 72, 73, 78, 82Back pain, 27Congenital conditions, 163Musculoskeletal injury, 123, 134Neoplasms, 175, 178, 179, 181, 184Osteoporosis, 97, 104, 107
C
Carpal tunnel syndrome, 130, 131, 132, 133Centers for Disease Control and Prevention (CDC),
163, 209Cerebral palsy, 60, 163, 164-165, 168-169Cervical pain. See Neck painChondrosarcoma. See NeoplasmsChronic conditions
Chronic circulatory conditions, 2-6 Chronic joint pain, 3-4, 6, 78Chronic musculoskeletal conditions, 3-4 Chronic respiratory conditions, 2-6
Clubfoot, 163, 164, 166-167Cobb angle, 55, 56, 58Congenital
Cerebral palsy, 60, 163, 164-165, 168-169Clubfoot, 163, 164, 166-167Dysplasia of the hip, 163, 164, 166, 169Limb deficiencies, 163, 164, 167Metropolitan Atlanta Congenital Defects Program
(MACDP), 163, 164, 168, 169, 170National Birth Defects Prevention Network
(NBDPN), 163, 164, 169Polydactyly, 163, 164, 168Prevalence, 163-165, 166, 167, 168, 169, 170
Skeletal dysplasias, 163, 164, 167-168Spina bifida, 60, 163, 164, 165-166, 169Surveillance 163, 164, 169-170
Contusion. See InjuriesCost, 2, 23, 195-225
Arthritis, 72, 83 Back pain. See Cost: SpineDirect cost, 1, 6, 7, 195, 207, 208, 210Fracture, 107Incremental, 7, 21, 33, 72, 83, 195, 200, 202, 203, 204,
206, 207, 208, 209, 210 Indirect cost, 1, 6, 83, 195, 205-207Joint replacement, 81-82Morbidity, 1, 57, 74, 97, 128, 163, 184, 210Neoplasm, 179Osteoporosis, 107Prescription drugs, 1, 33, 81, 83, 137Spinal deformity, 64Spine, 21, 27, 30-33
Diskectomy, 31-32Spinal fusion, 30-31
Cox-2 inhibitors, 78Crushing injury. See InjuriesCrystal arthropathies. See Gout
D
DMARD, 78 Death, 1. See also Mortality
Arthritis, 72Injuries, 126, 127Low energy fracture, 104Neoplasms, 175, 180, 183, 184
Derangement. See InjuriesDevelopmental. See CongenitalDisc degeneration, 22-25, 27, 30, 31 Discharge, 80, 81Disk displacement. See HerniationDiskectomy, 29, 31-32Dislocation, 23, 128
Hip, 164, 166, 169Division of Birth Defects and Developmental
Disabilities, 163Dysplasia
Hip, 163, 164, 166, 169
E
Emergency room care, 1, 197, 201, 204, 205 Arthritis, 72, 83, Injuries, 123, 124, 125, 126, 134, 135, 136, 137Osteoporosis, 101, 102, 103, 104, 106Spine, 22, 23, 24, 25, 26, 33
Enteropathic arthritis, 78Ewing’s sarcoma. See Neoplasms
F
Falls, 97, 104-106Fibromyalgia, 71, 77Folic acid, 60, 165-166Fracture, 4, 16, 60, 97-100, 104, 128, 129, 183. See also
InjuriesCost, 107, 135-136Hip, 79-81, 99, 100, 102, 103, 104, 105, 106Low energy fracture. See OsteoporosisTrends, 125-126Vertebral (spine), 99, 100, 101, 104, 105, 106Wrist, 99, 100, 102, 103, 104, 105, 106
Funding (research), 2, 75
G
Giant cell arteritis, 77-78Gout, 71, 76, 83
Cost, 207-208Gross Domestic Product (GDP), 6, 7, 83, 195, 200, 201,
202, 206, 209
H
Headache, 21, 28, 32 Health care utilization, 6
Arthritis, 72-75, 83, 198-199Costs, 195, 200-204, 208, 209, 210Osteoporosis, 101
Health care visits. See also Health care utilization;Treatment episodes
Arthritis, 72Spine, 22-27
Hemiepiphysiodesis, 58Herniation/Herniated, 23, 29, 32, 60Hip pain, 4Hispanics, 71, 99, 165Home health care, 1, 33, 136, 199Hospitalization. See also Inpatient
Arthroplasty, 80-82Injuries, 126, 129, 135Osteoporosis, 101, 104Spinal deformity, 63, 64Spine, 22
The Burden of Musculoskeletal Diseases in the United States - Copyright © 2008
Index
244

I
Idiopathic scoliosis. See ScoliosisImpairment, 5. See also Activities of daily living;
Activity restrictions; LimitationsIncidence, 1, 196
Arthritis, 73Arthroplasty, 79Fracture
Hip, 80Spine, 105
Injuries, 136 Unintentional, 123Workplace, 132-133
Neoplasms, 175-176, 177, 178, 181, 182, 183, 184Osteoporosis, 98, 100, 104, 105, Spinal deformity, 60, 61, 62 Spine (pain), 21, 23, 32
Injuries, 23, 24, 25, 26, 104, 123-162, 196, 197, 198, 201,205, 210
Activities of daily living, 128 Amputation (amputated limb), 4, 133, 179, 184Back, 23, 24, 127, 129, 130, 131, 132, 133Bed days, 129 Contusion, 127Cost, 134, 136-137 Crushing injuries, 123 Derangements, 123Dislocation, 128Falls, 123, 126, 127Fractures, 107, 125-126, 127, 128, 129, 135, 136 Health care utilization, 134-136Incidence, 123, 132, 133, 136 Limitations, 128-130Lost wages, 134Lower limb, 126 Neck, 25, 26, 123, 129Open wounds, 123, 124, 125, 135Pelvis, 123 Prevalence, 123-126Spine, 123Sprains and strains, 23, 32, 123, 124, 125, 127, 128,
132, 135Treatment episodes, 123-126, 134, 135, 136Upper limb, 22, 107, 126, 127Work days (lost), 129, 130Workplace, 123, 130-134
Inpatient, 1, 197, 201, 204, 205, 210 Arthritis, 79, 80, 83Injuries, 126, 136, 137Osteoporosis, 97, 101, 102, 103, 106-107Spine, 26, 29, 31, 33
Intermediate care, 80, 103
J
Juvenile Arthritis, 76Joint pain, 3, 4, 6, 21-22, 28, 78, 83. See also Back pain;
Hip pain; Knee pain; Leg pain; Shoulder painCost, 196, 197, 198, 201, 202, 205, 210
Joint replacement. See Arthroplasty
K
Knee pain, 4 Kyphosis, 55, 56, 63. See also Sheuermann kyphosis
L
Laminectomy, 23Leg pain, 62
Radiating, 29Length of stay, 80, 81, 136 Lenke classification, 56, 57Limb deficiencies, 163, 164, 167Limb reduction defects. See Limb deficienciesLimitations, 5. See also Activities of daily living;
Activity restrictions; ImpairmentBack pain, 27-29Fracture, 129Spine, 21
Lordosis, 63Lost work days, 1, 5, 6
Injuries, 129, 130Spine, 28, 29
Low back pain. See Back painLower limb pain
Foot, 27, 28Leg, 27, 28
Lumbago, 23Lumbar pain. See Low back painLupus (Systemic lupus erythematosus), 71, 76
M
Medical care. See Emergency room; Hospitalization;Inpatient; Outpatient; Physicians office
Medical conditions. See Chronic conditionsMedical Expenditures Panel Survey (MEPS), 33 Medications, 64, 78, 79, 98, 199, 204, 205, 209, 210. See
also PrescriptionsMetropolitan Atlanta Developmental Disabilities Sur-
veillance Program (MADDS), 163, 164, 169 Migraine. See HeadacheMorbidity, 1, 210
Arthritis, 74
The Burden of Musculoskeletal Diseases in the United States - Copyright © 2008 245
Index

Congenital conditions, 163Injuries, 128Neoplasms, 184 Osteoporosis, 97Spinal deformity, 57
Mortality, 1, 210. See also DeathsArthritis, 74Congenital, 163 Neoplasms, 175, 177, 178, 180Osteoporosis, 97
Low energy falls, 104, 105Spinal deformity, 57
Muscular dystrophy, 60Myeloma. See Neoplasms
N
NSAID, 73, 74, 75National Arthritis Data Workgroup, 71 National Birth Defects Prevention Network (NBDPN),
163, 164, 169 National Cancer Data Base, 175, 179, 184National Cancer Institute, 175, 180, National Health and Nutrition Examination Survey
(NHANES), 74, 98, 99, 106National Health Interview Survey (NHIS), 2, 4, 33, 123,
128, 136, 196National Hospital Discharge Survey, 32, 80, 210National Institute of Arthritis and Musculoskeletal and
Skin Diseases, 2 National Institutes of Health (NIH), 1, 2National Osteoporosis Foundation (NOF), 99, 197Neck pain. See Back painNeoplasms
Benign tumorsBone, 181-183Soft tissue, 184
Bone and connective tissue, 175-177Children, 177-179Chondrosarcoma, 175, 176, 177, 178, 179, 182Cost, 179Deaths, 175, 180, 183, 184Endoprostheses, 178Ewing’s sarcoma, 175, 177, 178, 179Incidence, 175-176, 177, 178, 181, 182, 183, 184Kaposi’s sarcoma, 176Morbidity, 184Mortality, 175, 177, 178, 180Myeloma, 175, 176, 177National Cancer Data Base, 175, 179, 184National Cancer Institute, 175, 180, Osteosarcoma, 175, 177, 178, 179, 182, 184Soft tissue sarcomas, 179-181
Surveillance Epidemiology and End Results Pro-gram (SEER), 175
Survival rate, 177, 180Neuromusculoskeletal, 32-33Nursing home, 1, 72, 104
O
Osteoarthritis, 73-74, 75, 79, 80, 83Cost, 207-208
Osteoporosis, 55, 62, 71, 97-121Cost, 107, 196, 197, 198, 201, 202, 205, 210Diagnosis, 97-98
Age, 102Health care utilization, 100-104Incidence, 98, 100, 104, 105Low energy fracture, 98, 101, 102-103, 104, 106, 107.
See also Fracture: Hip; Vertebral (spine); WristPrevalence, 98, 99, 101, 105Primary osteoporosis, 98, 100, 101, 102Secondary osteoporosis, 98, 101
Osteosarcoma. See NeoplasmsOutpatient, 1, 197, 210
Arthritis, 72, Arthroplasty, 79Injuries, 123, 124, 125, 134, 135, 136Osteoporosis, 97, 103 Spinal deformity, 63Spine, 22, 23, 24, 25, 26
P
Pain. See Back pain; Hip pain; Joint pain; Knee pain;Lower limb pain; Neck pain; Upper limb pain
Physician office visit, 1, 3 Arthritis, 72, 81Injuries, 123, 124, 125, 126, 127, 128, 134, 136Osteoporosis, 101Spinal deformity, 63 Spine, 21, 22, 23, 24, 25, 26, 27, 32, 33 Utilization, 198, 207
Polydactyly, 163, 164, 168Polymyalgia rheumatica, 77-78Prescriptions, 199, 201, 205. See also MedicationsPrevalence, 195-198, 201
Arthritis, 71, 72, 75-78Osteoarthritis, 73-74, 79Rheumatoid arthritis, 74
Congenital conditions, 163-165, 169Cerebral palsy, 164, 169Club foot, 164, 167Developmental dysplasia of the hip, 164, 166
The Burden of Musculoskeletal Diseases in the United States - Copyright © 2008
Index
246

Limb deficiencies, 164 Polydactyly, 168Spina bifida, 163, 164, 165, 166
Injuries, 123-126Musculoskeletal conditions, 1, 2, 6, 195-198, 201,
207, 208, 209, 210 Age, 2, 3, Gender, 4,
Neoplasms, 175Benign bone and soft tissue tumors, 181-182Benign soft tissue tumors, 184Malignant bone tumors, 179
Osteoporosis, 98-100, 101, 105Select medical conditions, 2-4Spinal deformity, 55, 56, 57, 60, 61, 62Spine, 21, 22, 24, 33
Prevention, 1, 78, 107, 163, 167, 169, 197Psoriatic arthritis, 78
R
Rheumatic diseases, 75Rheumatism, 4, 72, 129 Rheumatoid arthritis, 71, 74-75, 77, 78, 79
Cost, 83, 204, 207-208Juvenile rheumatoid arthritis, 76
Rib vertebral angle degree (RVAD), 58Reiter’s syndrome, 78
S
Scheuermann kyphosis, 55, 60, 61-62Sciatica, 23Sclerosis (Systemic sclerosis), 77Scoliosis, 55-60, 183
Adolescent idiopathic scoliosis, 55, 56-57Congenital scoliosis, 59Cost, 63-64Degenerative scoliosis, 62, 63Infantile idiopathic scoliosis, 55, 58-59Juvenile idiopathic scoliosis, 55, 58Neuromuscular scoliosis, 60
Scoliosis Research Society, 56Short-term care, 80, 103Shoulder pain, 4Sjögren’s syndrome, 77Skeletal dysplasias, 163, 164, 167-168Skilled nursing, 80, 103Spina bifida, 60, 163, 164, 165-166, 169Spinal deformity, 55-70Spinal fusion, 29-31, 58, 60, 61Spinal muscular atrophy, 60
Spinal stenosis, 23, 24, 29, 30, 31, 62Spine, 21-53, 196, 197, 198, 201, 205, 210
Cost, 33, 207-208Neuromusculoskeletal, 32-33Procedures, 29-32
Diskectomy, 31-32Spinal fusion, 29-31
Spondylarthropathies, 78Spondylolisthesis, 30, 55, 60, 61Spondylolysis, 30, 55, 60, 61Spondylosis, 23, 25, 78 Sprain and strain. See InjuriesSurveillance
Congenital, 163, 164, 169-170Neoplasms, 175, 178
Surveillance Epidemiology and End Results Program(SEER), 175
Survival rate (neoplasms), 177, 180
T
Tendonitis, 131, 132, 133
U
Upper limb painArm, 21, 22, Elbow, 22Hand, 22Shoulder, 21, 22, 27Wrist, 22
V
Vertical expandable prosthetic titanium rib (VETPR), 58-59
W
Wage, lost, 21, 134, 195, 205, 206, 210. See also Costs:Indirect
Whites, 5, 61, 98, 99, 131, 176Work limitations. See also Lost work days
Arthritis, 71Back pain, 21, 28
Workplace (injuries), 123, 130-134World Health Organization, 97
The Burden of Musculoskeletal Diseases in the United States - Copyright © 2008 247
Index
