bureau of business & economic research
TRANSCRIPT
Bureau of Business & Economic Research
i
Bureau of Business & Economic Research
The Economic Impact of Coalin West Virginia
is published by:Bureau of Business & Economic Research
West Virginia University College of Business and Economics
PO Box 6527, Morgantown, WV 26506 6527(304) 293 7831; [email protected]
bber.wvu.edu
WRITTEN BY
Christiadi, Ph.D.Research AssociateJohn Deskins, Ph.D.
Director
Funding for this research was provided by the WestVirginia Coal Forum. The opinions herein are those of theauthors and do not necessarily reflect those of the WestVirginia Coal Forum or theWest Virginia University Boardof Governors.
© Copyright 2018 WVU Research Corporation
ii
Bureau of Business & Economic Research
Table of Contents
List of Figures and Tables............................................................................................................................. iii
Executive Summary............................................................................................................................... ........ 2
1 Introduction ............................................................................................................................... ......... 3
2 Coal and the West Virginia Economy: Recent Trends......................................................................... 4
3 West Virginia Coal Exports ................................................................................................................ 13
4 Economic Impact of Coal in West Virginia ........................................................................................ 19
iii
Bureau of Business & Economic Research
List of Figures and Tables
Figure 1: Annual Coal Production, West Virginia vs Other U.S. States ......................................................... 4Figure 2: West Virginia Share of U.S. Annual Coal Production ..................................................................... 5Figure 3: West Virginia Regional Coal Production ........................................................................................ 6Figure 4: Coal Mining Employment in West Virginia .................................................................................... 7Figure 5: Annual Wage by Industry, West Virginia, 2017 ............................................................................. 8Figure 6: Coal Mining Share in Employment and Wages, West Virginia ...................................................... 9Figure 7: Distribution of West Virginia Coal by Consumer ......................................................................... 10Figure 8: West Virginia Coal Shipments to Power Plants by Destination State, 2011 vs 2017................... 11Figure 9: U.S. Coal Demand Forecast.......................................................................................................... 12Figure 10: Coal Exports, West Virginia vs Other U.S. States ....................................................................... 13Figure 11: West Virginia Coal Exports as a Share of U.S. Coal Exports ....................................................... 14Figure 12: West Virginia Coal Exports as a Share of the State’s Total Exports ........................................... 15Figure 13: West Virginia Coal Exports by Country of Destination, 2017 .................................................... 16Figure 14: West Virginia Coal Exports by Destination Region .................................................................... 17Figure 15: World Coal Exports, West Virginia vs Other Countries, 2017.................................................... 18Figure 16: Economic Impact of Coal Mining in West Virginia..................................................................... 20Figure 17: Economic Impact of Coal Fired Power Plants ............................................................................ 21Figure 18: Overall Economic Impact of Coal (Mining and Power Generation) in West Virginia ................ 21
2
Bureau of Business & Economic Research
Executive Summary
In this report we consider the role of coal in the West Virginia economy. We begin with a detailedexamination of recent trends in coal production, employment, employee compensation, and destinationfor West Virginia over the past several years. We devote a large portion of the report to coal exports.This is driven by the likelihood that domestic demand for coal will be flat at best in the coming years andany potential growth in coal production will likely come through export markets.
The core of this report is an estimate of the economic impact of coal on the West Virginia economy.Statistics indicate that coal mining directly employs over 13 thousand workers in West Virginia who earna total compensation of around $1.1 billion annually. Further, our estimates indicate that coal minesspend a total of around $6.5 billion in the state’s economy directly. However, the total economic impactof the industry does not end there. As coal mines operate, they purchase various inputs from localsuppliers, thereby increasing demand for upstream businesses. Further, as coal mine employees spendtheir earnings in the local economy, additional economic activity is created. The primary usage of coal –electric power generation – also injects billions of dollars into the state’s economy and employs around2,800 high wage workers. Highlights of our economic impact analysis are as follows:
Coal mining and coal fired electric power generated approximately $12.9 billion in totaleconomic activity in the state of West Virginia in 2017. For context, total economic output forthe state, as measured by gross domestic product (GDP), was around $77 billion in 2017.Coal mining and coal fired electric power generation supported around 39 thousand jobs inWest Virginia in 2017.Coal mining and coal fired electric power generation provided around $2.5 billion in employeecompensation in West Virginia in 2017.Coal mining and coal fired electric power generation supported nearly $652 million in selectstate and local tax revenue for West Virginia and its local governments.
3
Bureau of Business & Economic Research
1 Introduction
In this report we consider the role of coal in the West Virginia economy. In Section 2, we begin with adetailed examination of recent trends in coal production, employment, employee compensation, anddestination for West Virginia over the past several years. In Section 3, we devote a large portion of thereport to coal exports. This is driven by the likelihood that domestic demand for coal will be flat at bestin coming years and any potential growth in coal production will likely come through export markets.
The core of this report is an estimate of the economic impact of coal on the West Virginia economy,which we present in Section 4. Statistics indicate that coal mining directly employs over 13 thousandworkers in West Virginia who earn a total compensation of around $1.1 billion annually. Further, ourestimates indicate that coal mines spend a total of around $6.5 billion in the state’s economy directly.However, the total economic impact of the industry does not end there. As coal mines operate, theypurchase various inputs from local suppliers, thereby increasing demand for upstream businesses.Further, as coal mine employees spend their earnings in the local economy, further economic activity iscreated. And the primary usage of coal – coal fired electric power generation – injects billions of dollarsinto the state’s economy as well and employee around 2,800 high wage workers. Overall, we estimatethe total economic impact of coal mining and coal fired electric power generation on the state’seconomy. Our research indicates that coal mining generated around $12.9 billion in economic activity inWest Virginia in 2017.
4
Bureau of Business & Economic Research
2 Coal and the West Virginia Economy: Recent Trends
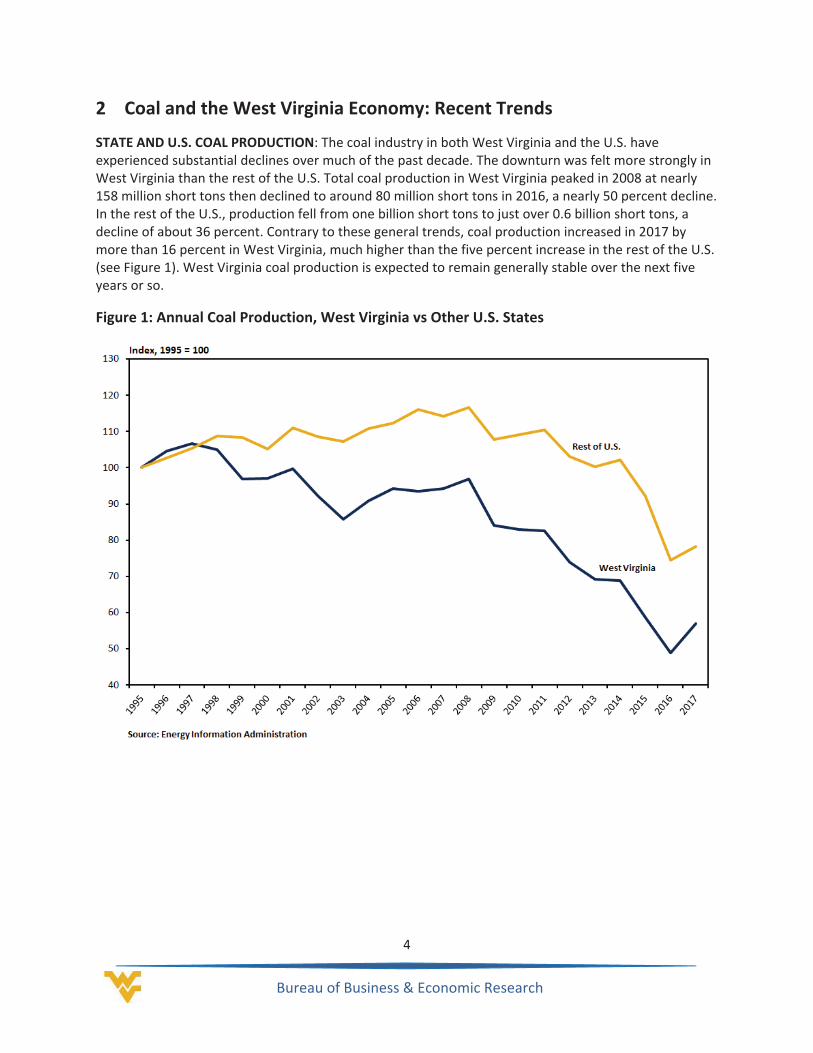
STATE AND U.S. COAL PRODUCTION: The coal industry in both West Virginia and the U.S. haveexperienced substantial declines over much of the past decade. The downturn was felt more strongly inWest Virginia than the rest of the U.S. Total coal production in West Virginia peaked in 2008 at nearly158 million short tons then declined to around 80 million short tons in 2016, a nearly 50 percent decline.In the rest of the U.S., production fell from one billion short tons to just over 0.6 billion short tons, adecline of about 36 percent. Contrary to these general trends, coal production increased in 2017 bymore than 16 percent in West Virginia, much higher than the five percent increase in the rest of the U.S.(see Figure 1). West Virginia coal production is expected to remain generally stable over the next fiveyears or so.
Figure 1: Annual Coal Production, West Virginia vs Other U.S. States
5
Bureau of Business & Economic Research
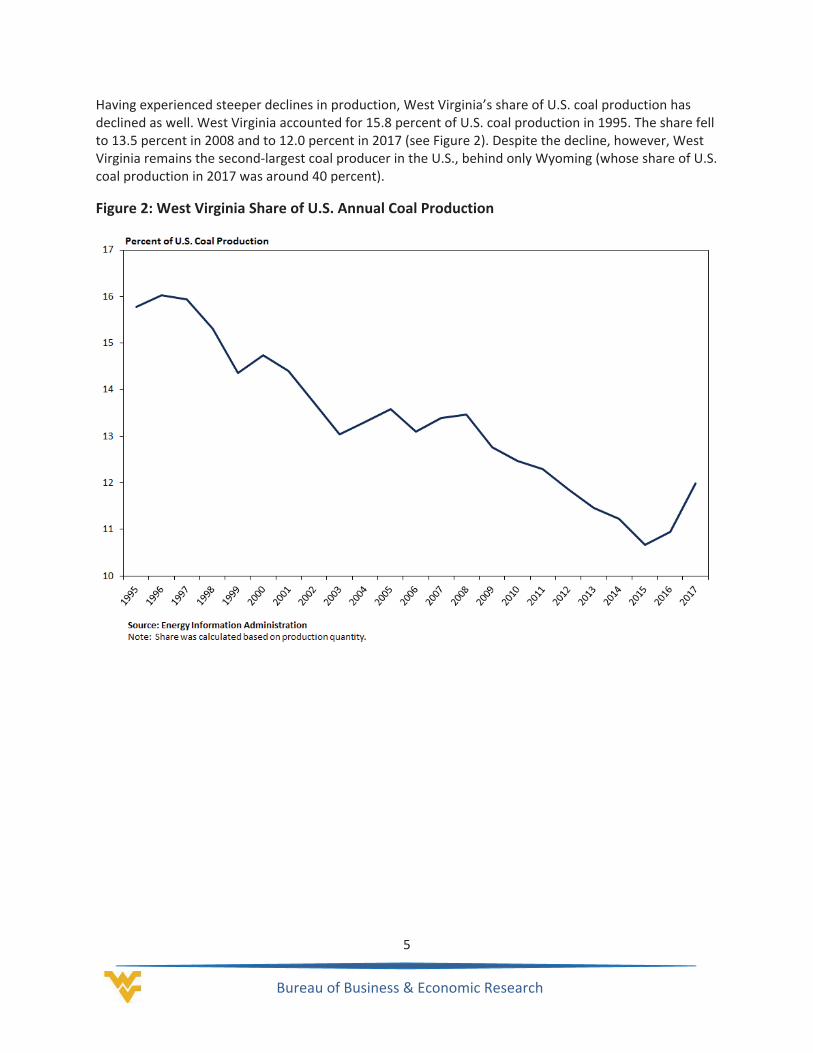
Having experienced steeper declines in production, West Virginia’s share of U.S. coal production hasdeclined as well. West Virginia accounted for 15.8 percent of U.S. coal production in 1995. The share fellto 13.5 percent in 2008 and to 12.0 percent in 2017 (see Figure 2). Despite the decline, however, WestVirginia remains the second largest coal producer in the U.S., behind only Wyoming (whose share of U.S.coal production in 2017 was around 40 percent).
Figure 2: West Virginia Share of U.S. Annual Coal Production
6
Bureau of Business & Economic Research
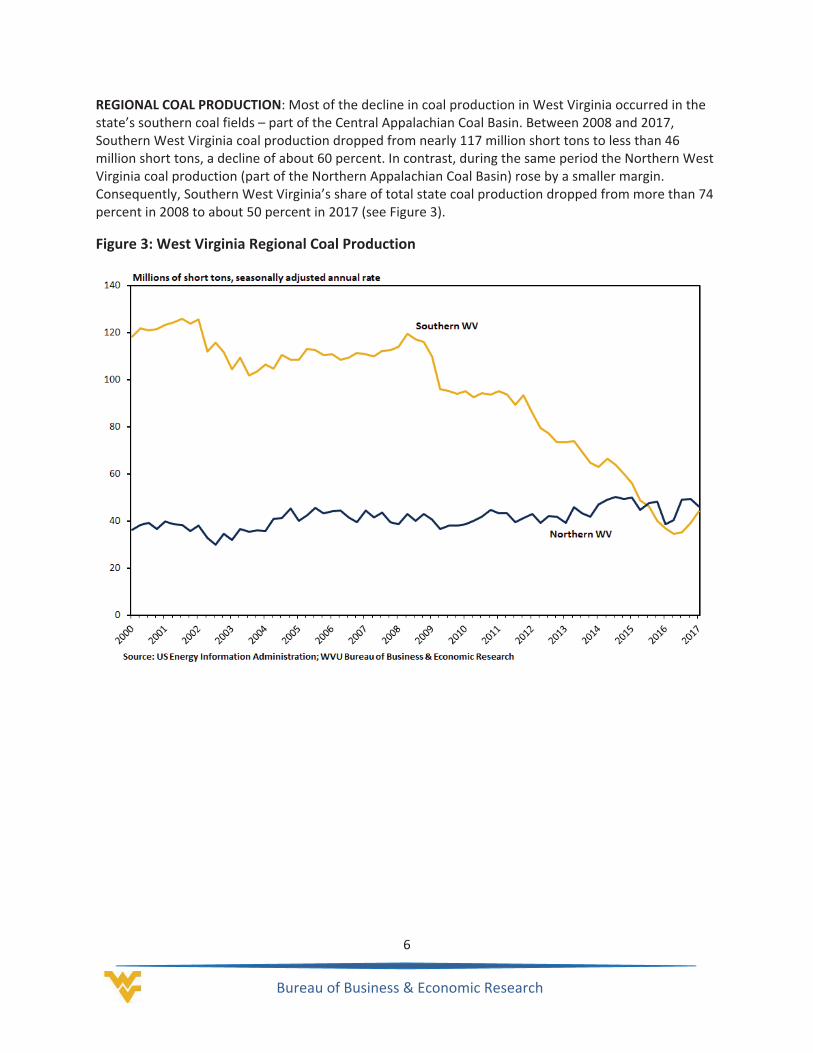
REGIONAL COAL PRODUCTION: Most of the decline in coal production in West Virginia occurred in thestate’s southern coal fields – part of the Central Appalachian Coal Basin. Between 2008 and 2017,Southern West Virginia coal production dropped from nearly 117 million short tons to less than 46million short tons, a decline of about 60 percent. In contrast, during the same period the Northern WestVirginia coal production (part of the Northern Appalachian Coal Basin) rose by a smaller margin.Consequently, Southern West Virginia’s share of total state coal production dropped from more than 74percent in 2008 to about 50 percent in 2017 (see Figure 3).
Figure 3: West Virginia Regional Coal Production
7
Bureau of Business & Economic Research
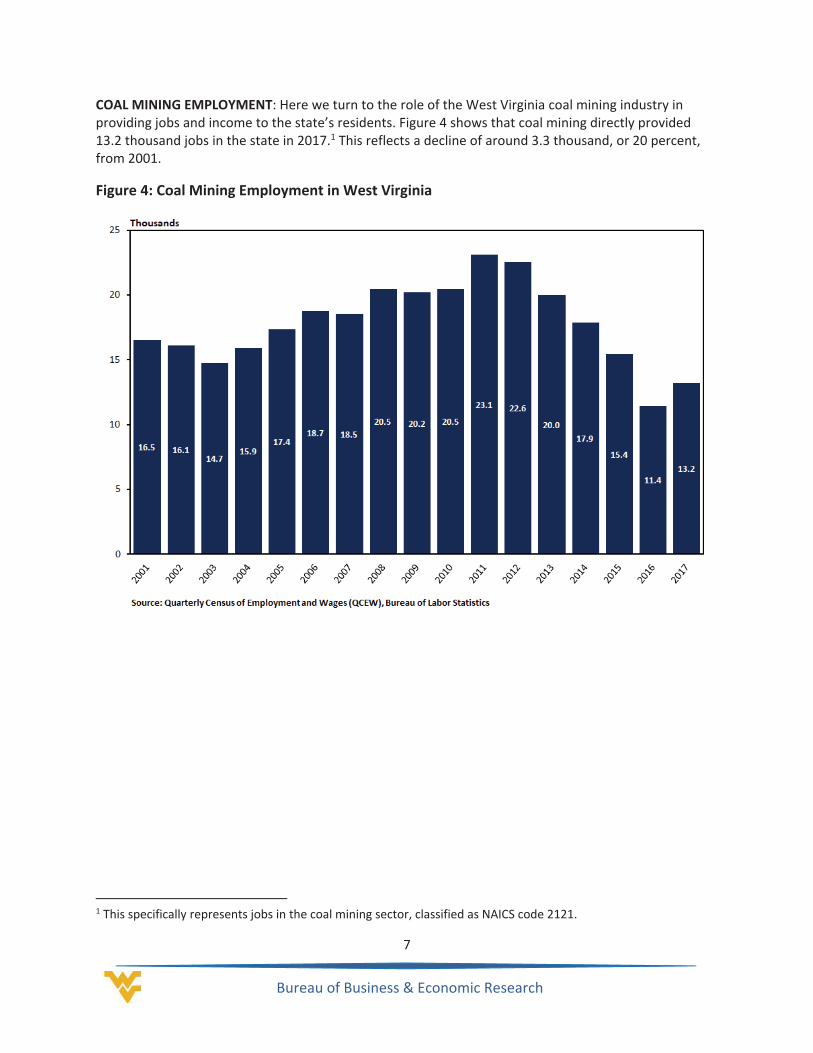
COAL MINING EMPLOYMENT: Here we turn to the role of the West Virginia coal mining industry inproviding jobs and income to the state’s residents. Figure 4 shows that coal mining directly provided13.2 thousand jobs in the state in 2017.1 This reflects a decline of around 3.3 thousand, or 20 percent,from 2001.
Figure 4: Coal Mining Employment in West Virginia
1 This specifically represents jobs in the coal mining sector, classified as NAICS code 2121.
8
Bureau of Business & Economic Research
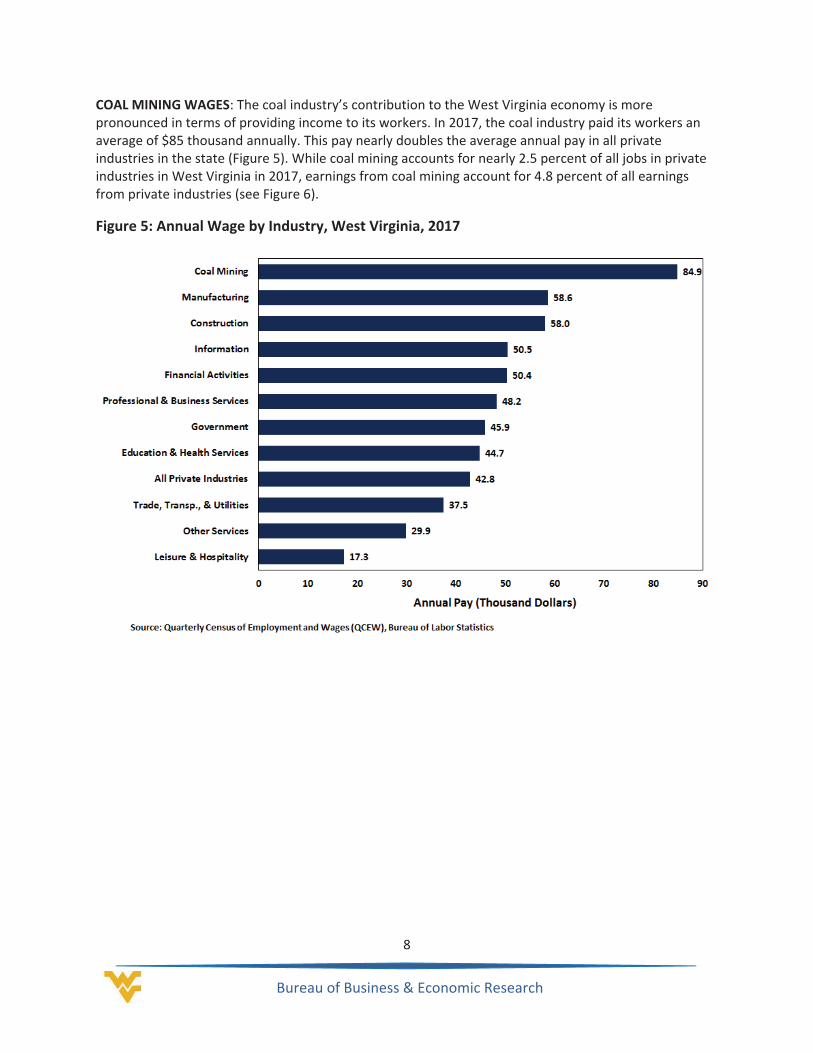
COAL MININGWAGES: The coal industry’s contribution to the West Virginia economy is morepronounced in terms of providing income to its workers. In 2017, the coal industry paid its workers anaverage of $85 thousand annually. This pay nearly doubles the average annual pay in all privateindustries in the state (Figure 5). While coal mining accounts for nearly 2.5 percent of all jobs in privateindustries in West Virginia in 2017, earnings from coal mining account for 4.8 percent of all earningsfrom private industries (see Figure 6).
Figure 5: Annual Wage by Industry, West Virginia, 2017

9
Bureau of Business & Economic Research
Figure 6: Coal Mining Share in Employment and Wages, West Virginia
10
Bureau of Business & Economic Research
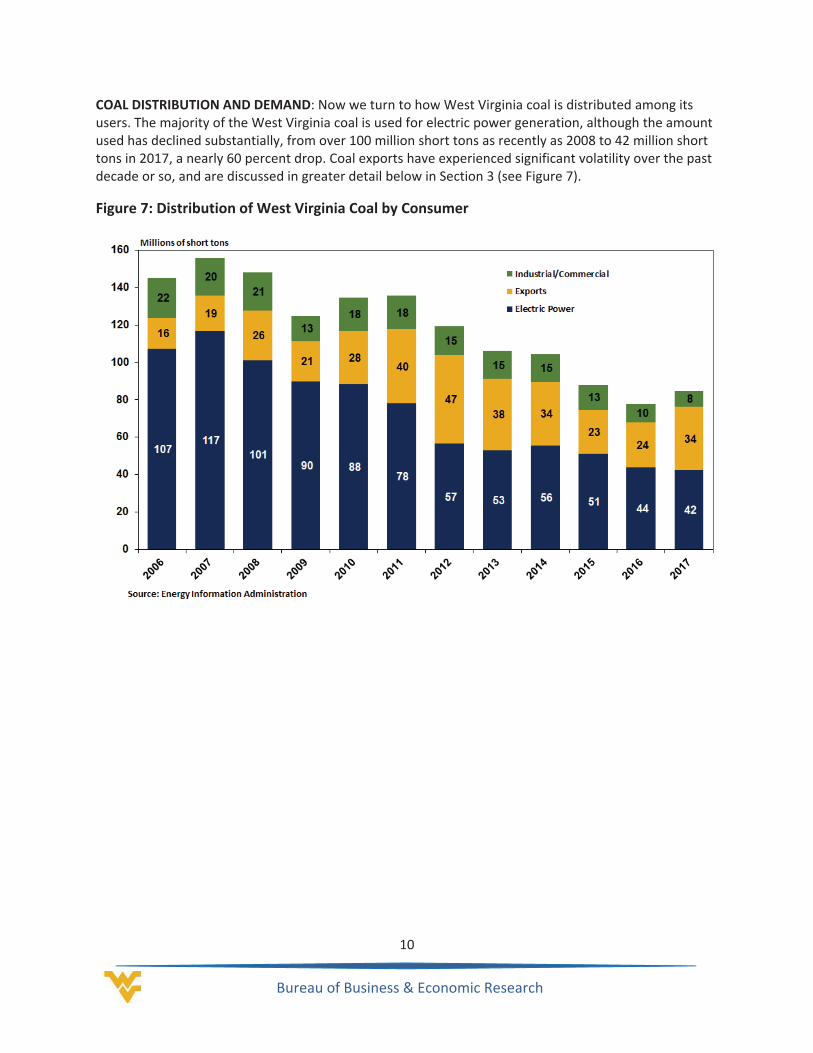
COAL DISTRIBUTION AND DEMAND: Now we turn to how West Virginia coal is distributed among itsusers. The majority of the West Virginia coal is used for electric power generation, although the amountused has declined substantially, from over 100 million short tons as recently as 2008 to 42 million shorttons in 2017, a nearly 60 percent drop. Coal exports have experienced significant volatility over the pastdecade or so, and are discussed in greater detail below in Section 3 (see Figure 7).
Figure 7: Distribution of West Virginia Coal by Consumer
11
Bureau of Business & Economic Research
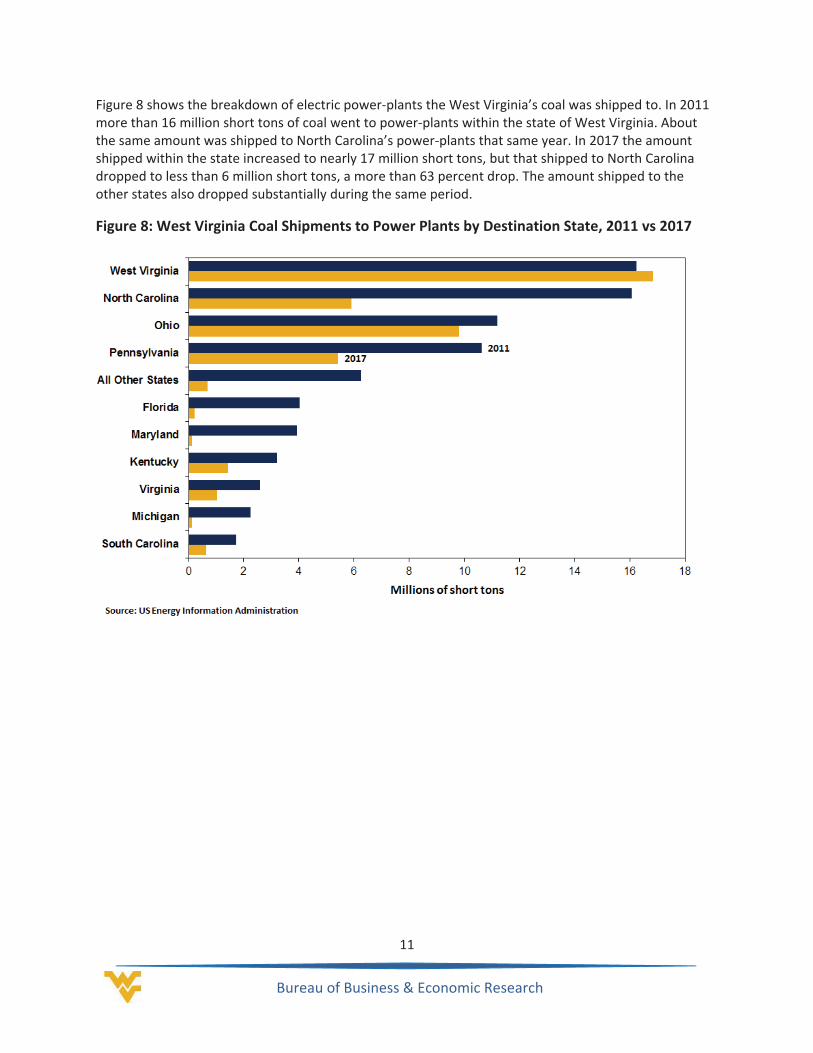
Figure 8 shows the breakdown of electric power plants the West Virginia’s coal was shipped to. In 2011more than 16 million short tons of coal went to power plants within the state of West Virginia. Aboutthe same amount was shipped to North Carolina’s power plants that same year. In 2017 the amountshipped within the state increased to nearly 17 million short tons, but that shipped to North Carolinadropped to less than 6 million short tons, a more than 63 percent drop. The amount shipped to theother states also dropped substantially during the same period.
Figure 8: West Virginia Coal Shipments to Power Plants by Destination State, 2011 vs 2017

12
Bureau of Business & Economic Research
COAL PRODUCTION FORECAST: After looking at recent trends in coal consumption we now examinecoal consumption projections for the long run. The U.S. Energy Information Administration (EIA) predictsthat domestic demand for U.S. coal is expected to remain relatively flat through 2050 (Figure 9). Coalexports are expected to grow over the next few decades and are explored in more detail in the nextsection.
Figure 9: U.S. Coal Demand Forecast
13
Bureau of Business & Economic Research
3 West Virginia Coal Exports
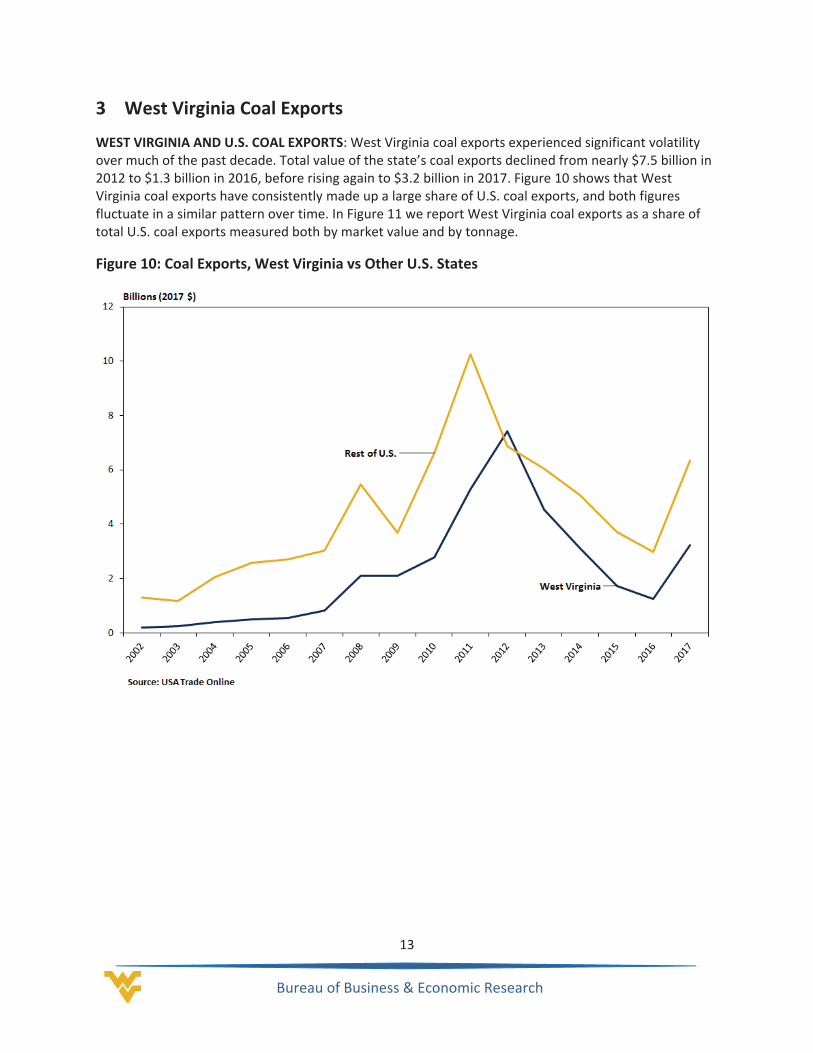
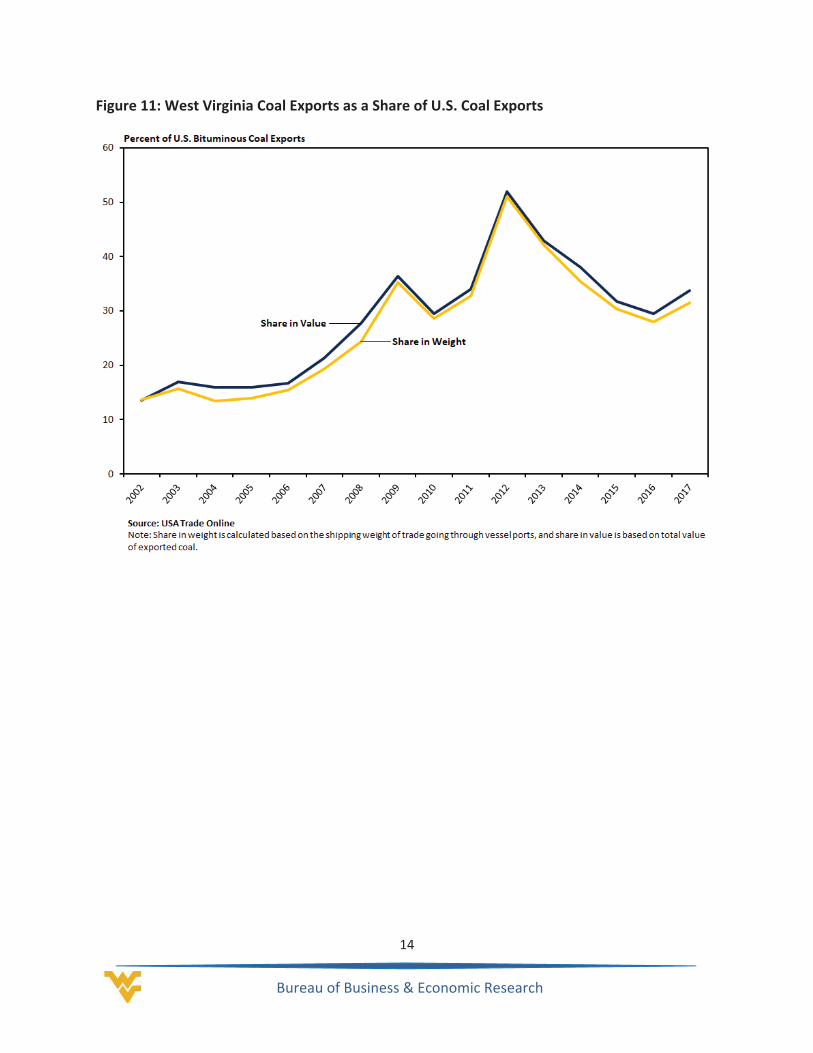
WEST VIRGINIA AND U.S. COAL EXPORTS: West Virginia coal exports experienced significant volatilityover much of the past decade. Total value of the state’s coal exports declined from nearly $7.5 billion in2012 to $1.3 billion in 2016, before rising again to $3.2 billion in 2017. Figure 10 shows that WestVirginia coal exports have consistently made up a large share of U.S. coal exports, and both figuresfluctuate in a similar pattern over time. In Figure 11 we report West Virginia coal exports as a share oftotal U.S. coal exports measured both by market value and by tonnage.
Figure 10: Coal Exports, West Virginia vs Other U.S. States
14
Bureau of Business & Economic Research
Figure 11: West Virginia Coal Exports as a Share of U.S. Coal Exports
15
Bureau of Business & Economic Research
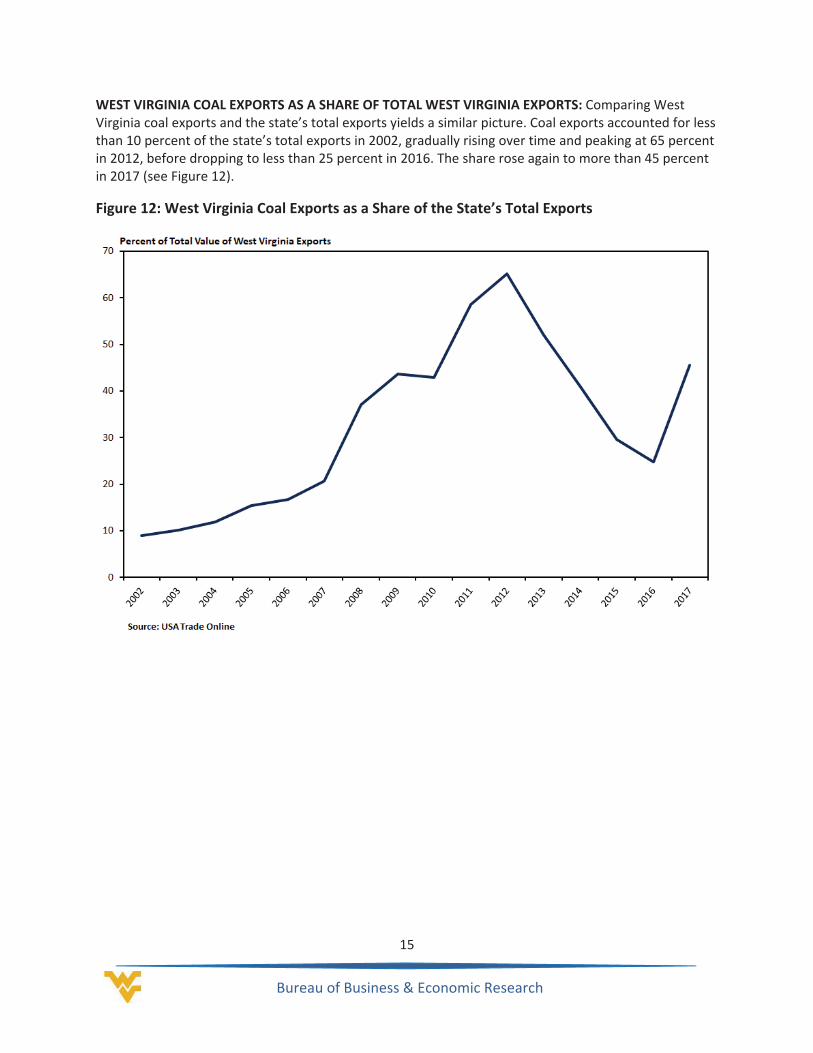
WEST VIRGINIA COAL EXPORTS AS A SHARE OF TOTAL WEST VIRGINIA EXPORTS: Comparing WestVirginia coal exports and the state’s total exports yields a similar picture. Coal exports accounted for lessthan 10 percent of the state’s total exports in 2002, gradually rising over time and peaking at 65 percentin 2012, before dropping to less than 25 percent in 2016. The share rose again to more than 45 percentin 2017 (see Figure 12).
Figure 12: West Virginia Coal Exports as a Share of the State’s Total Exports
16
Bureau of Business & Economic Research
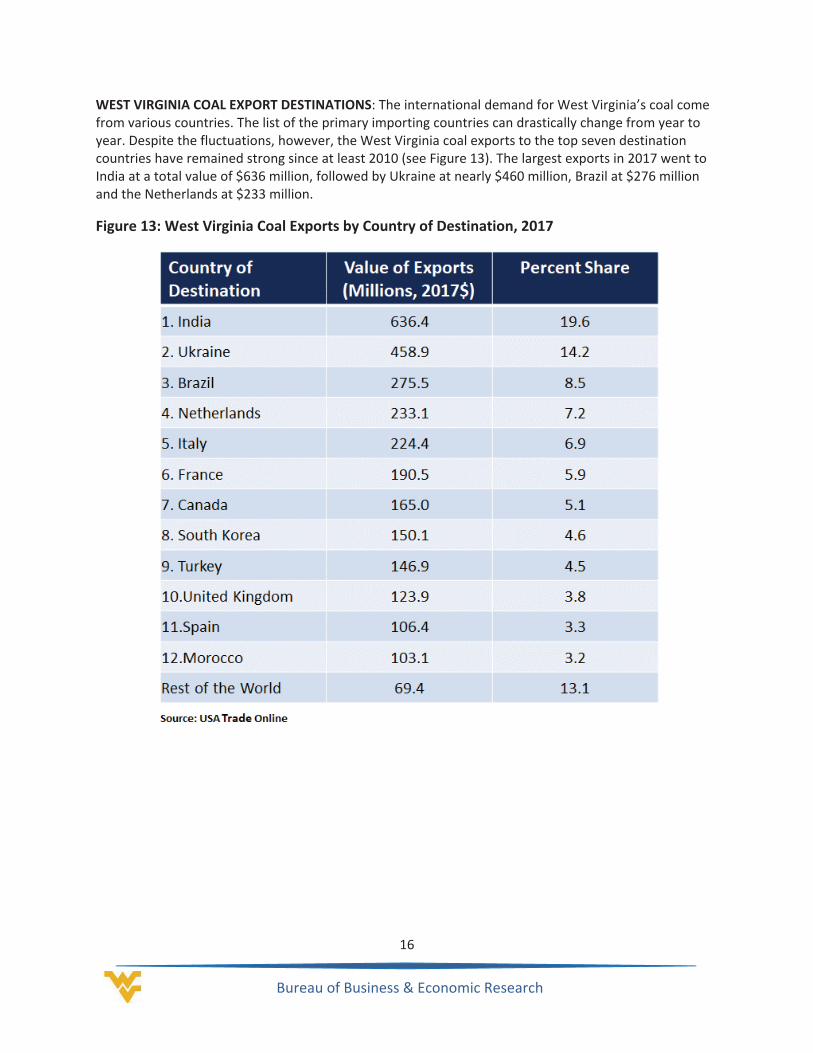
WEST VIRGINIA COAL EXPORT DESTINATIONS: The international demand for West Virginia’s coal comefrom various countries. The list of the primary importing countries can drastically change from year toyear. Despite the fluctuations, however, the West Virginia coal exports to the top seven destinationcountries have remained strong since at least 2010 (see Figure 13). The largest exports in 2017 went toIndia at a total value of $636 million, followed by Ukraine at nearly $460 million, Brazil at $276 millionand the Netherlands at $233 million.
Figure 13: West Virginia Coal Exports by Country of Destination, 2017
17
Bureau of Business & Economic Research
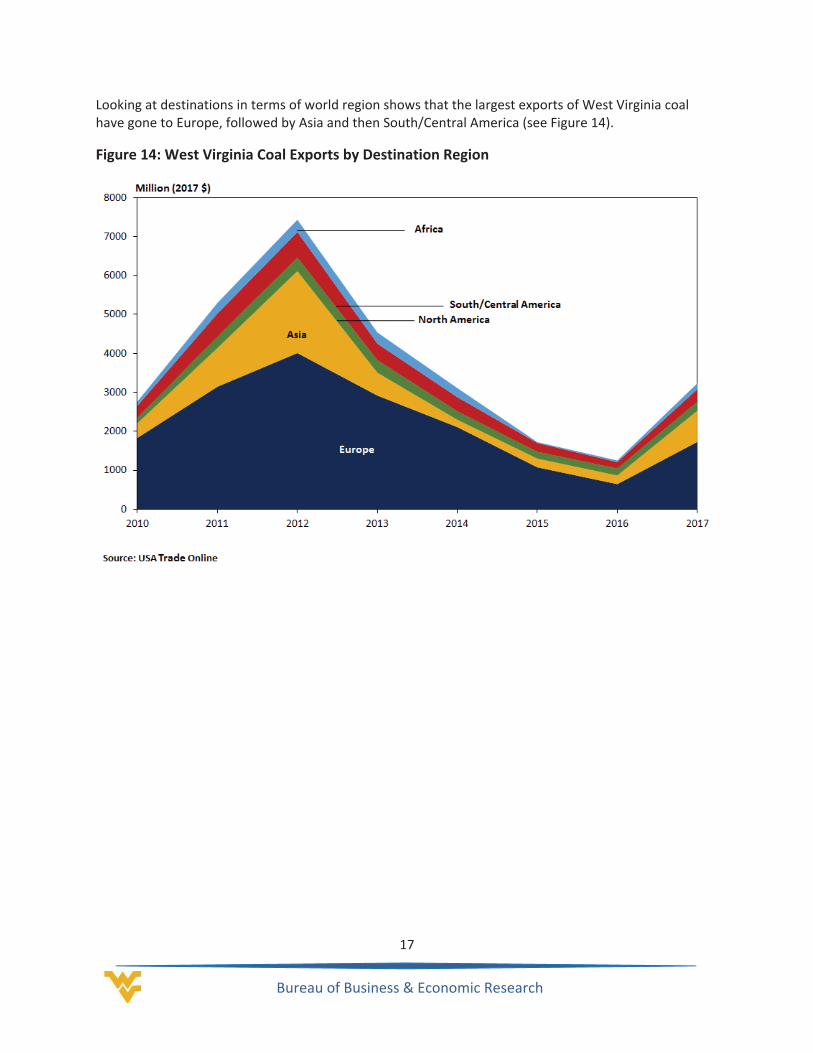
Looking at destinations in terms of world region shows that the largest exports of West Virginia coalhave gone to Europe, followed by Asia and then South/Central America (see Figure 14).
Figure 14: West Virginia Coal Exports by Destination Region
18
Bureau of Business & Economic Research
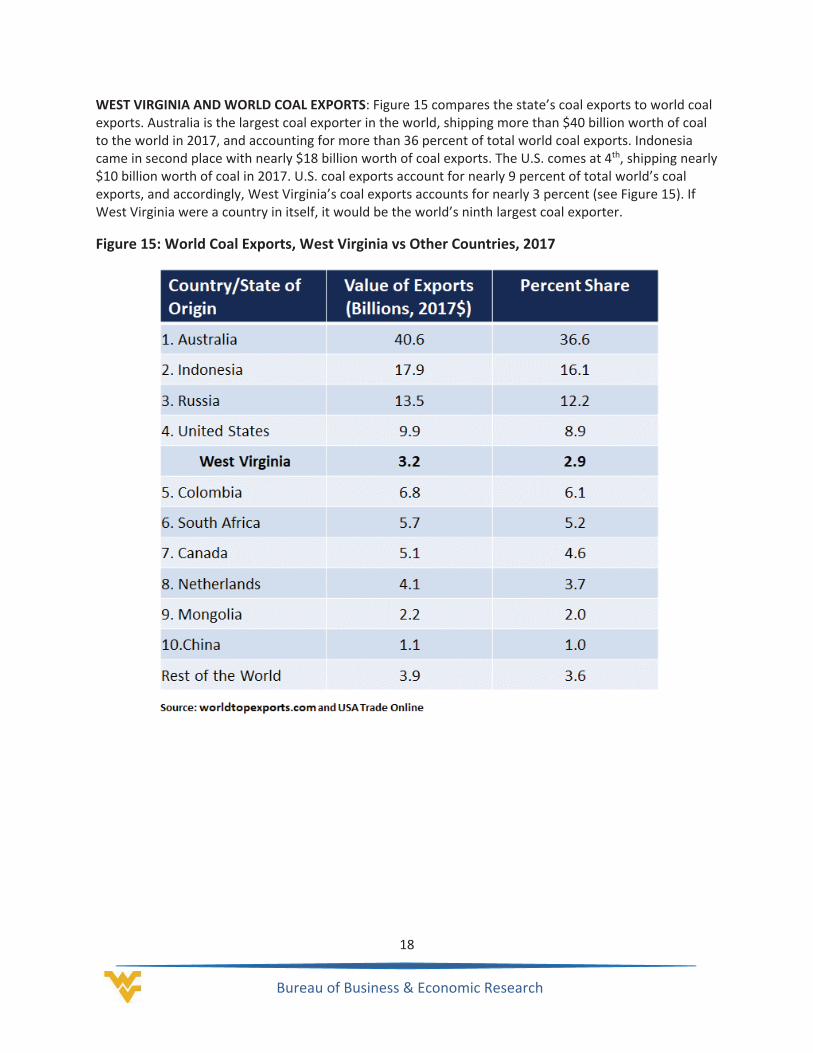
WEST VIRGINIA ANDWORLD COAL EXPORTS: Figure 15 compares the state’s coal exports to world coalexports. Australia is the largest coal exporter in the world, shipping more than $40 billion worth of coalto the world in 2017, and accounting for more than 36 percent of total world coal exports. Indonesiacame in second place with nearly $18 billion worth of coal exports. The U.S. comes at 4th, shipping nearly$10 billion worth of coal in 2017. U.S. coal exports account for nearly 9 percent of total world’s coalexports, and accordingly, West Virginia’s coal exports accounts for nearly 3 percent (see Figure 15). IfWest Virginia were a country in itself, it would be the world’s ninth largest coal exporter.
Figure 15: World Coal Exports, West Virginia vs Other Countries, 2017
19
Bureau of Business & Economic Research
4 Economic Impact of Coal in West Virginia
In this section we examine the economic impact of coal on the West Virginia economy in 2017. Toestimate the economic impact, we apply a detailed model of the West Virginia economy that outlineshow industry specific trade flows interact with key economic indicators such as employment, income,output, and tax revenue. Our analysis consists of two aspects of the coal economy: First, we consider theeconomic impact of coal mining. Second, we consider the impact of the primary use of coal in the state –coal fired electric power generation.
ECONOMIC IMPACT ANALYSIS BACKGROUND: Expenditures that take place directly to mine coal andcompensate coal mine workers are referred to as the direct economic impact of coal mining.2 However,the total economic impact of coal mining is not limited to the direct impact, but also includes thesecondary economic impacts accrued as those initial direct expenditures are re spent throughout therest of the economy. For example, to support coal mining, contractors providing services such as sitepreparations, tunneling, coal stripping, truck transportation, etc., will increase their production incorrespondence with an increase in coal mining. As these suppliers increase production, theirsubsequent suppliers will increase production, and so on. All of this additional economic activity thatstems from coal mining is referred to as indirect impacts. In addition, the coal mine and these suppliersemploy numerous workers, part of whose income will be spent in the West Virginia economy,generating additional output, income, and employment. This activity associated with employeesspending their income in the state is referred to as induced impacts. These indirect and induced impactstogether form what is known as the “multiplier effect.” The original stimulus to the economy from theoperation’s total expenditures is re spent multiple times through the rest of the economy. Thecombined direct impact and secondary impacts constitute the total economic impact of coal mining.
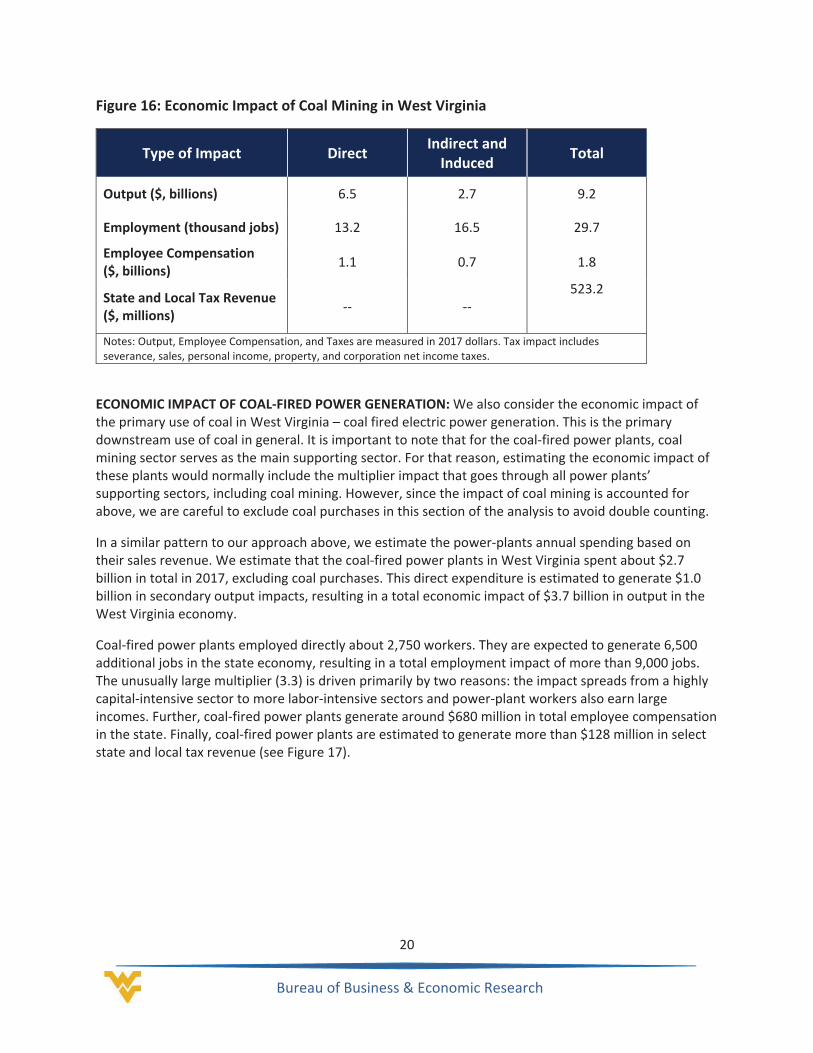
ECONOMIC IMPACT OF COAL MINING Since we do not have access to data on direct expenditures atcoal mines in West Virginia, we estimate total spending based on the sales value of coal produced inWest Virginia, and we assume zero profit for the year 2017. As such, based on the total value of coalsales, we estimate that coal mines in West Virginia spent around $6.5 billion in total in 2017. Asreported in Figure 16, this direct expenditure is estimated to generate $2.7 billion in secondary outputimpacts, resulting in a total economic impact of $9.2 billion in output in the West Virginia economy. Forcontext, total economic output (GDP) in West Virginia was around $77 billion in 2017.3
Further, the 13,200 coal mining jobs in West Virginia in 2017 are expected to generate 16,500 additionaljobs in the state economy, resulting in a total employment impact of just under 30,000 jobs. Theunusually large multiplier (2.25) is driven by the fact that coal miners earn unusually large incomes.Further, coal mining generates around $1.8 billion in total employee compensation in the state. Finally,coal mining is estimated to generate more than $523 million in select state and local tax revenue.
2 Employment data are provided by the U.S. Bureau of Labor Statistics, Quarterly Censes of Employment andWages, NAICS code 2121, shown in Figure 4 above.
3 U.S. Bureau of Economic Analysis.
20
Bureau of Business & Economic Research
Figure 16: Economic Impact of Coal Mining in West Virginia
Type of Impact Direct Indirect andInduced Total
Output ($, billions) 6.5 2.7 9.2
Employment (thousand jobs) 13.2 16.5 29.7
Employee Compensation($, billions) 1.1 0.7 1.8
State and Local Tax Revenue($, millions)
523.2
Notes: Output, Employee Compensation, and Taxes are measured in 2017 dollars. Tax impact includesseverance, sales, personal income, property, and corporation net income taxes.
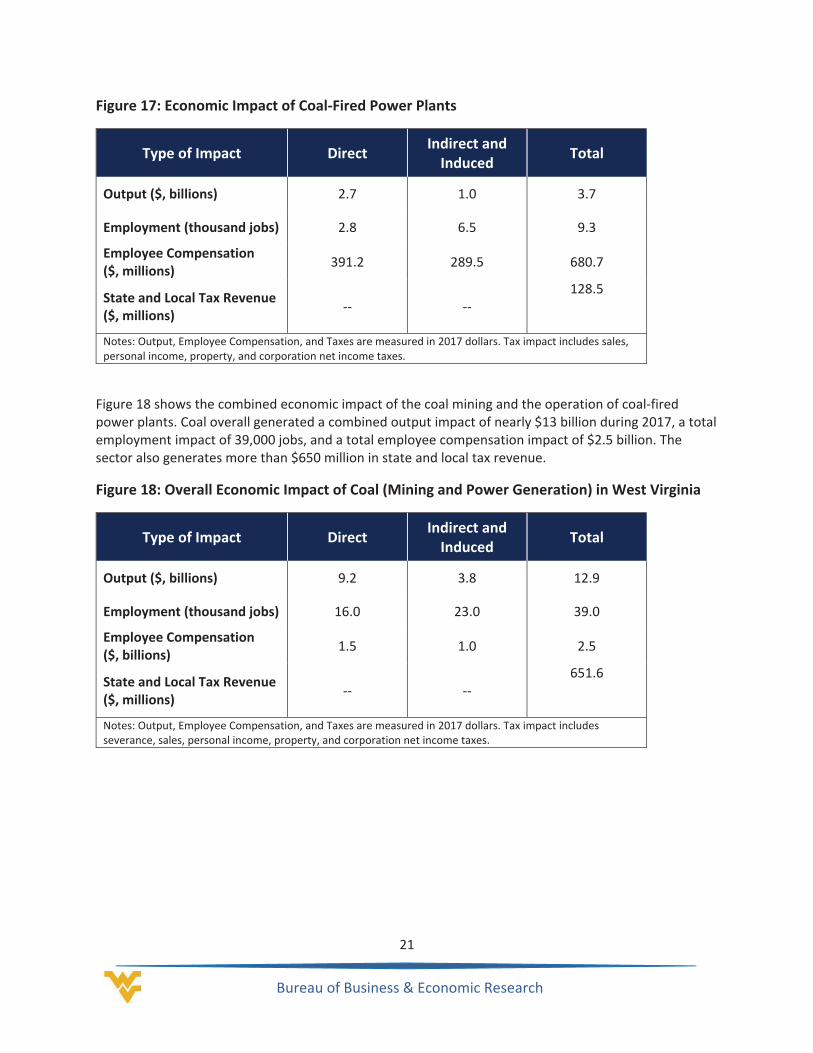
ECONOMIC IMPACT OF COAL FIRED POWER GENERATION:We also consider the economic impact ofthe primary use of coal in West Virginia – coal fired electric power generation. This is the primarydownstream use of coal in general. It is important to note that for the coal fired power plants, coalmining sector serves as the main supporting sector. For that reason, estimating the economic impact ofthese plants would normally include the multiplier impact that goes through all power plants’supporting sectors, including coal mining. However, since the impact of coal mining is accounted forabove, we are careful to exclude coal purchases in this section of the analysis to avoid double counting.
In a similar pattern to our approach above, we estimate the power plants annual spending based ontheir sales revenue. We estimate that the coal fired power plants in West Virginia spent about $2.7billion in total in 2017, excluding coal purchases. This direct expenditure is estimated to generate $1.0billion in secondary output impacts, resulting in a total economic impact of $3.7 billion in output in theWest Virginia economy.
Coal fired power plants employed directly about 2,750 workers. They are expected to generate 6,500additional jobs in the state economy, resulting in a total employment impact of more than 9,000 jobs.The unusually large multiplier (3.3) is driven primarily by two reasons: the impact spreads from a highlycapital intensive sector to more labor intensive sectors and power plant workers also earn largeincomes. Further, coal fired power plants generate around $680 million in total employee compensationin the state. Finally, coal fired power plants are estimated to generate more than $128 million in selectstate and local tax revenue (see Figure 17).
21
Bureau of Business & Economic Research
Figure 17: Economic Impact of Coal Fired Power Plants
Type of Impact Direct Indirect andInduced Total
Output ($, billions) 2.7 1.0 3.7
Employment (thousand jobs) 2.8 6.5 9.3
Employee Compensation($, millions) 391.2 289.5 680.7
State and Local Tax Revenue($, millions)
128.5
Notes: Output, Employee Compensation, and Taxes are measured in 2017 dollars. Tax impact includes sales,personal income, property, and corporation net income taxes.
Figure 18 shows the combined economic impact of the coal mining and the operation of coal firedpower plants. Coal overall generated a combined output impact of nearly $13 billion during 2017, a totalemployment impact of 39,000 jobs, and a total employee compensation impact of $2.5 billion. Thesector also generates more than $650 million in state and local tax revenue.
Figure 18: Overall Economic Impact of Coal (Mining and Power Generation) in West Virginia
Type of Impact Direct Indirect andInduced Total
Output ($, billions) 9.2 3.8 12.9
Employment (thousand jobs) 16.0 23.0 39.0
Employee Compensation($, billions) 1.5 1.0 2.5
State and Local Tax Revenue($, millions)
651.6
Notes: Output, Employee Compensation, and Taxes are measured in 2017 dollars. Tax impact includesseverance, sales, personal income, property, and corporation net income taxes.
22
Bureau of Business & Economic Research
About the Bureau of Business and Economic Research
Since the 1940s, the BBER’s mission has been to serve the people of West Virginia by providing thestate’s business and policymaking communities with reliable data and rigorous applied economicresearch and analysis that enables the state’s leaders to design better business practices and publicpolicies. BBER research is disseminated through policy reports and briefs, through large public forums,and through traditional academic outlets. BBER researchers are widely quoted for their insightfulresearch in state and regional news media. The BBER’s research and education/outreach efforts topublic and private sector leaders are typically sponsored by various government and private sectororganizations.
The BBER has research expertise in the areas of public policy, health economics, energy economics,economic development, economic impact analysis, economic forecasting, tourism and leisureeconomics, and education policy, among others. The BBER has a full time staff of three PhD economistsand one master’s level economist. This staff is augmented by PhD student research assistants. The BBERalso collaborates with affiliated faculty from within the College of Business and Economics as well asfrom other parts of WVU.
To learn more about our research, please visit our website at http://www.be.wvu.edu/bber.