bureau of labor statistics: back to college
TRANSCRIPT

8/8/2019 Bureau of Labor Statistics: Back to College
http://slidepdf.com/reader/full/bureau-of-labor-statistics-back-to-college 1/15
BLS SPOTLIGHT ON STATISTICS BACK TO COLLEGE www.bls.gov/spotlight
U.S. BUREAU OF LABOR STATISTICS 1
Back to College September 201 0 Whether you're a bright‐eyed freshman, an experienced upper‐classman, a faithful alumnus, an educated professor, a capable
administrator, or even acollege‐sports enthusiast,you are probably familiarwith some of the numerouspublic and private collegesand universities spreadacross the United States. Theestablishment and growth of
these institutions, and theircontributions to the Nation,have long been one of the most notable aspects of U.S. history.
The first institutions of higher learning in colonial North Americawere founded to supply the demand for clergy and school teachers. Inrecent decades, colleges and universities have trained the workersthat put men on the moon and created the Internet age.
In 2009, there were over 10,000 establishments (places of employment, whether campuses, offices, research facilities, or otherlocations) operated by colleges and universities in the United States.(Source: QCEW)
This Spotlight presents BLS data related to college anduniversity students and graduates, as well as colleges and universitiesas an industry and place of employment.

8/8/2019 Bureau of Labor Statistics: Back to College
http://slidepdf.com/reader/full/bureau-of-labor-statistics-back-to-college 2/15
BLS SPOTLIGHT ON STATISTICS BACK TO COLLEGE www.bls.gov/spotlight
U.S. BUREAU OF LABOR STATISTICS 2
COLLEGE STUDENTS AND GRADUATES For the College Educated: Increasing Employment...
All of the increase in employment over the past two decades has beenamong workers who have taken at least some college classes or whohave associate or bachelor's degrees—and mostly among workerswith bachelor's degrees. The number of these college‐educatedworkers has increased almost every year. Over the 1992–2009 period,the number of college‐educated workers increased from 27 million to44 million. In contrast, the number of employed people with only ahigh school diploma or without a high school diploma has remainedsteady or decreased.
Source: Current Population Survey

8/8/2019 Bureau of Labor Statistics: Back to College
http://slidepdf.com/reader/full/bureau-of-labor-statistics-back-to-college 3/15
BLS SPOTLIGHT ON STATISTICS BACK TO COLLEGE www.bls.gov/spotlight
U.S. BUREAU OF LABOR STATISTICS 3
... Lower Unemployment...Business cycles run their course and the economy goes fromexpansion to recession—but regardless of whether the economy is
booming or contracting, an inverse relationship exists betweeneducation and unemployment: more education is associated with lessunemployment. In 2009, the unemployment rate for workers withcollege degrees was 4.6 percent. The rate for workers without a highschool diploma was 10 points higher.
Source: Current Population Survey
8/8/2019 Bureau of Labor Statistics: Back to College
http://slidepdf.com/reader/full/bureau-of-labor-statistics-back-to-college 4/15
BLS SPOTLIGHT ON STATISTICS BACK TO COLLEGE www.bls.gov/spotlight
U.S. BUREAU OF LABOR STATISTICS 4
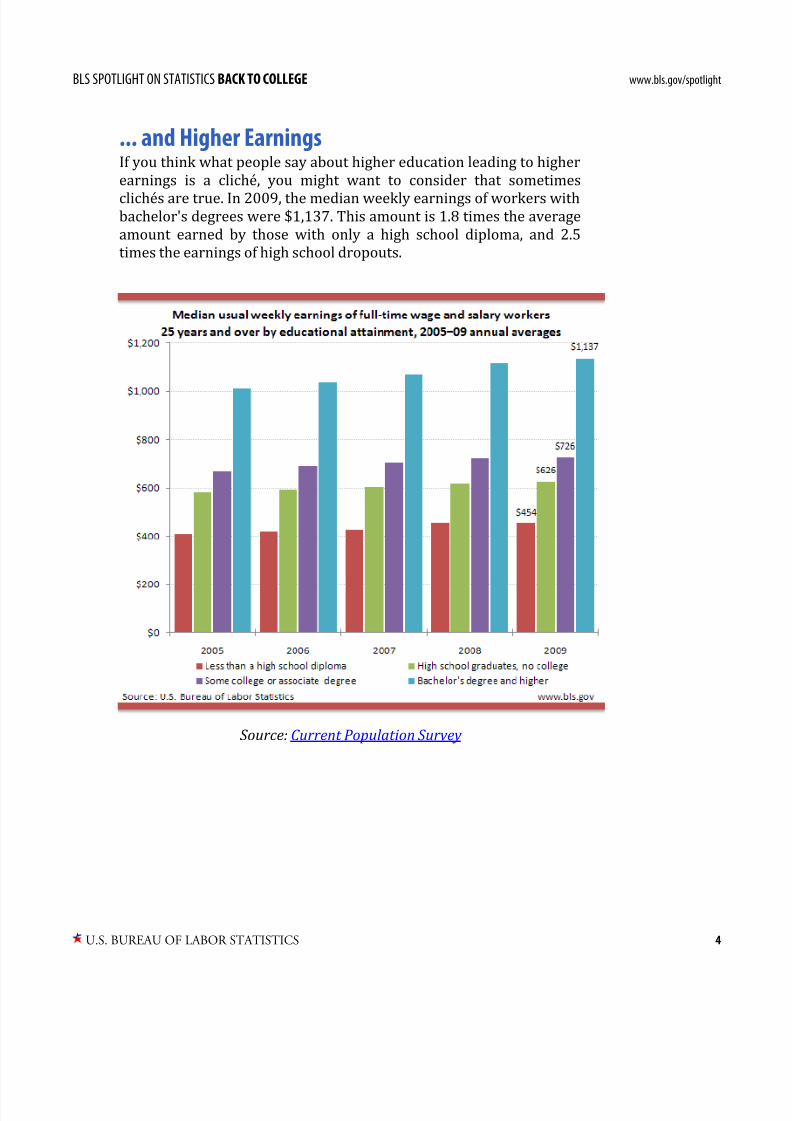
... and Higher EarningsIf you think what people say about higher education leading to higherearnings is a cliché, you might want to consider that sometimes
clichés are true. In 2009, the median weekly earnings of workers withbachelor's degrees were $1,137. This amount is 1.8 times the averageamount earned by those with only a high school diploma, and 2.5times the earnings of high school dropouts.
Source: Current Population Survey

8/8/2019 Bureau of Labor Statistics: Back to College
http://slidepdf.com/reader/full/bureau-of-labor-statistics-back-to-college 5/15
BLS SPOTLIGHT ON STATISTICS BACK TO COLLEGE www.bls.gov/spotlight
U.S. BUREAU OF LABOR STATISTICS 5
Degree Attainment by Age 22
In October when they were 22 years old, 9.7 percent of young adultshad bachelor's degrees and 27.0 percent were enrolled in collegeduring the 2002–2007 period. Young women were more likely to havefinished their degrees or be enrolled than young men.
Source: National Longitudinal Surveys
8/8/2019 Bureau of Labor Statistics: Back to College
http://slidepdf.com/reader/full/bureau-of-labor-statistics-back-to-college 6/15
BLS SPOTLIGHT ON STATISTICS BACK TO COLLEGE www.bls.gov/spotlight
U.S. BUREAU OF LABOR STATISTICS 6
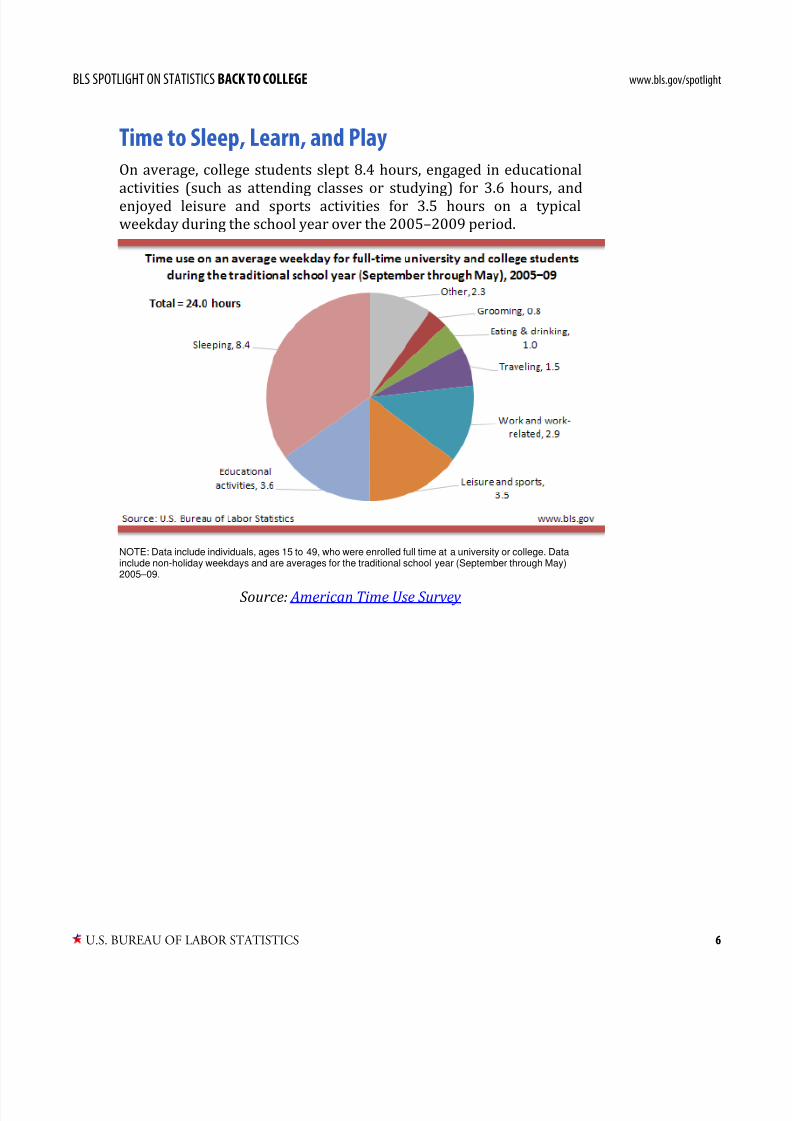
Time to Sleep, Learn, and PlayOn average, college students slept 8.4 hours, engaged in educationalactivities (such as attending classes or studying) for 3.6 hours, andenjoyed leisure and sports activities for 3.5 hours on a typicalweekday during the school year over the 2005–2009 period.
NOTE: Data include individuals, ages 15 to 49, who were enrolled full time at a university or college. Datainclude non-holiday weekdays and are averages for the traditional school year (September through May)2005–09.
Source: American Time Use Survey

8/8/2019 Bureau of Labor Statistics: Back to College
http://slidepdf.com/reader/full/bureau-of-labor-statistics-back-to-college 7/15
BLS SPOTLIGHT ON STATISTICS BACK TO COLLEGE www.bls.gov/spotlight
U.S. BUREAU OF LABOR STATISTICS 7
Around the World
In the United States, 40 percent of adults between the ages of 25 and64 had bachelor's degrees in 2007. In Canada, 48 percent hadbachelor's degrees.
Source: International Labor Comparisons

8/8/2019 Bureau of Labor Statistics: Back to College
http://slidepdf.com/reader/full/bureau-of-labor-statistics-back-to-college 8/15
BLS SPOTLIGHT ON STATISTICS BACK TO COLLEGE www.bls.gov/spotlight
U.S. BUREAU OF LABOR STATISTICS 8
The Price of Tuition
Since 1981, the cost of college tuition has consistently increased fasterthan the overall inflation rate.
Source: Consumer Price Index

8/8/2019 Bureau of Labor Statistics: Back to College
http://slidepdf.com/reader/full/bureau-of-labor-statistics-back-to-college 9/15
BLS SPOTLIGHT ON STATISTICS BACK TO COLLEGE www.bls.gov/spotlight
U.S. BUREAU OF LABOR STATISTICS 9
THE COLLEGE AND UNIVERSITY WORKPLACE
College and University Employment Increasing...Over the past five decades, college and university employment—bothin terms of absolute numbers and as a percentage of totalemployment—has increased significantly. In 1960, about 850,000people were employed in colleges and universities; in 2009 thenumber was over 3.9 million. Over the same period, the percentage of all workers who were employed by colleges and universities hasdoubled, increasing from 1.5 percent in 1960 to 3.0 percent in 2009.
NOTE: Employment in colleges and universities is the sum of private sector employment in colleges anduniversities and State government employment in education. Federal and local government college anduniversity employment, which is relatively small, is not included. State employment in education may includesome employees that are not employed in colleges and universities.
Source: Current Employment Statistics

8/8/2019 Bureau of Labor Statistics: Back to College
http://slidepdf.com/reader/full/bureau-of-labor-statistics-back-to-college 10/15
BLS SPOTLIGHT ON STATISTICS BACK TO COLLEGE www.bls.gov/spotlight
U.S. BUREAU OF LABOR STATISTICS 10
... And Expected to Continue Increasing
In 2008, about 1.7 million of the people employed on campus werepostsecondary teachers (that is, college professors and instructors).Their number is projected to increase to over 1.9 million—an increaseof over 15 percent—from 2008 to 2018. Over the same period,employment in all occupations is projected to increase about 10percent.
Source: Employment Projections
8/8/2019 Bureau of Labor Statistics: Back to College
http://slidepdf.com/reader/full/bureau-of-labor-statistics-back-to-college 11/15
BLS SPOTLIGHT ON STATISTICS BACK TO COLLEGE www.bls.gov/spotlight
U.S. BUREAU OF LABOR STATISTICS 11
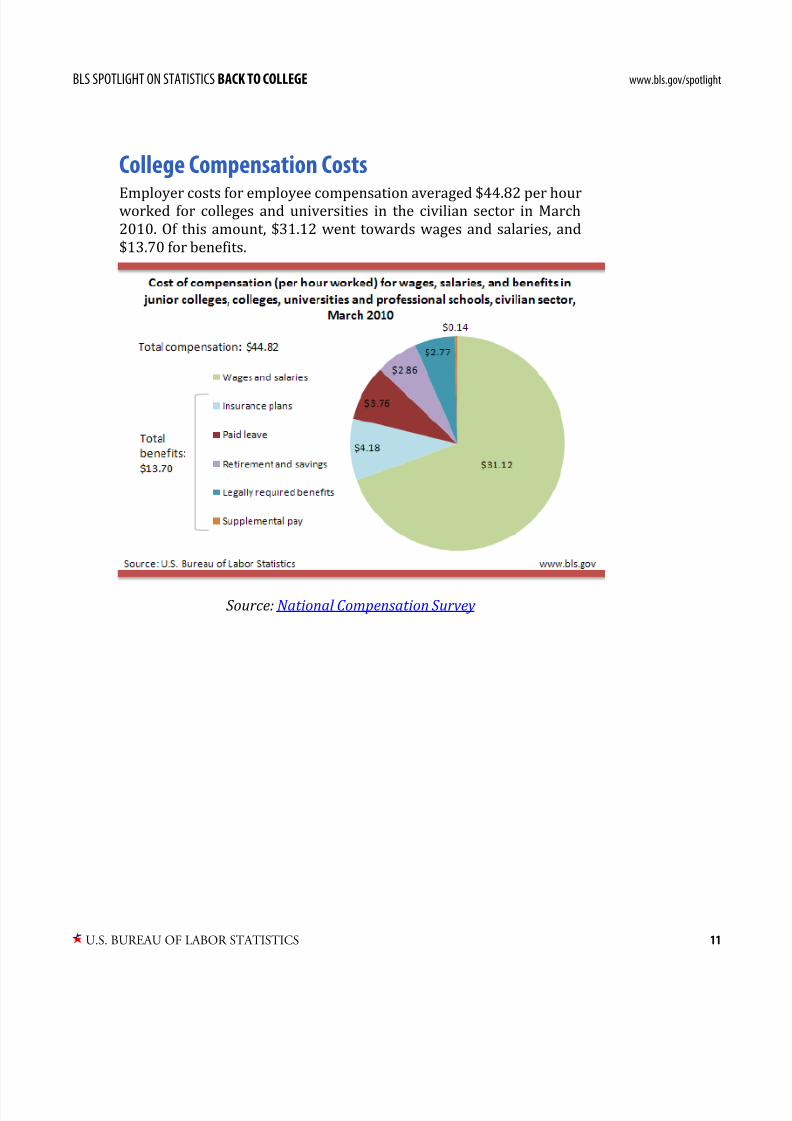
College Compensation Costs
Employer costs for employee compensation averaged $44.82 per hourworked for colleges and universities in the civilian sector in March2010. Of this amount, $31.12 went towards wages and salaries, and$13.70 for benefits.
Source: National Compensation Survey

8/8/2019 Bureau of Labor Statistics: Back to College
http://slidepdf.com/reader/full/bureau-of-labor-statistics-back-to-college 12/15
BLS SPOTLIGHT ON STATISTICS BACK TO COLLEGE www.bls.gov/spotlight
U.S. BUREAU OF LABOR STATISTICS 12
Professor Pay
The earnings of postsecondary teachers, and the number employed,varied by subject and specialty. Health specialties teachers, withemployment of over 130,000 in May 2009, were more numerous thanany other type of college or university postsecondary teacher. Thenumber of postsecondary health specialties teachers is more than 10times greater than the number of physics, economics, law, criminaljustice and law enforcement, or agricultural science teachers. Lawteachers and health specialties teachers were the highest paidpostsecondary teachers; both had average annual earnings over$100,000 in 2009.

8/8/2019 Bureau of Labor Statistics: Back to College
http://slidepdf.com/reader/full/bureau-of-labor-statistics-back-to-college 13/15
BLS SPOTLIGHT ON STATISTICS BACK TO COLLEGE www.bls.gov/spotlight
U.S. BUREAU OF LABOR STATISTICS 13
Source: Occupational Employment Statistics
8/8/2019 Bureau of Labor Statistics: Back to College
http://slidepdf.com/reader/full/bureau-of-labor-statistics-back-to-college 14/15
BLS SPOTLIGHT ON STATISTICS BACK TO COLLEGE www.bls.gov/spotlight
U.S. BUREAU OF LABOR STATISTICS 14
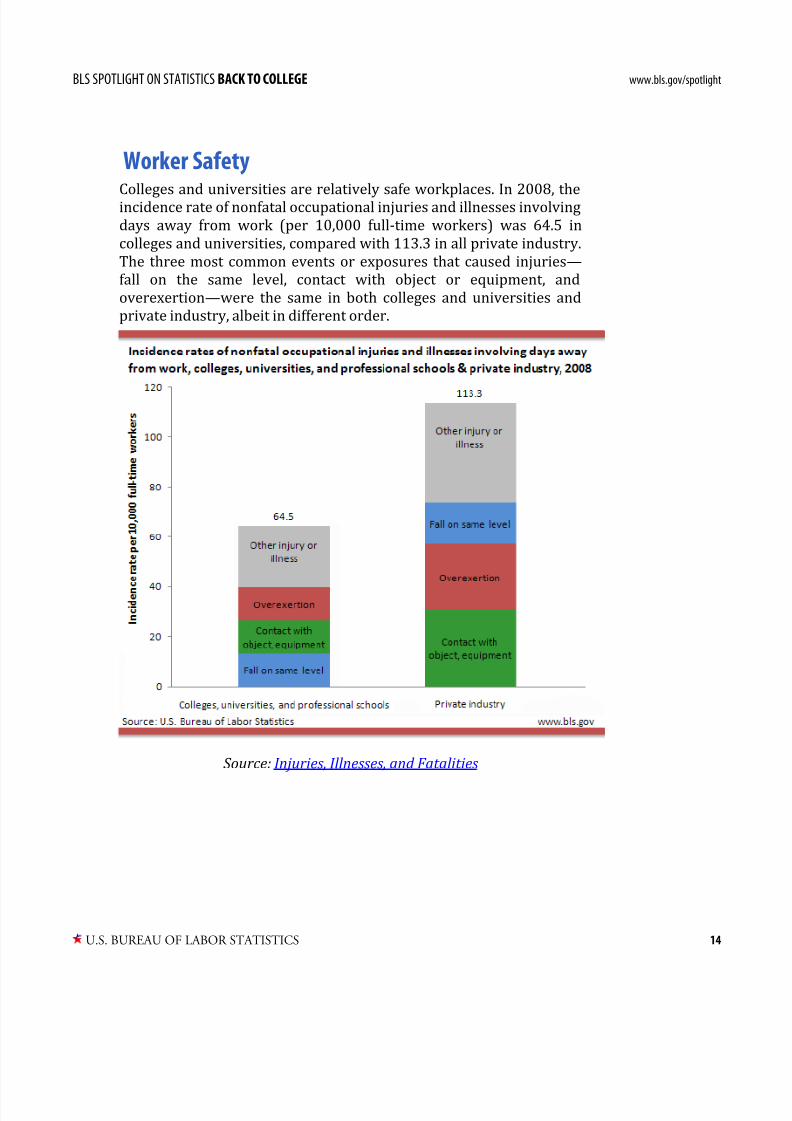
Worker Safety
Colleges and universities are relatively safe workplaces. In 2008, theincidence rate of nonfatal occupational injuries and illnesses involvingdays away from work (per 10,000 full‐time workers) was 64.5 incolleges and universities, compared with 113.3 in all private industry.The three most common events or exposures that caused injuries—fall on the same level, contact with object or equipment, andoverexertion—were the same in both colleges and universities andprivate industry, albeit in different order.
Source: Injuries, Illnesses, and Fatalities

8/8/2019 Bureau of Labor Statistics: Back to College
http://slidepdf.com/reader/full/bureau-of-labor-statistics-back-to-college 15/15
BLS SPOTLIGHT ON STATISTICS BACK TO COLLEGE www.bls.gov/spotlight
U.S. BUREAU OF LABOR STATISTICS 15
Note: Data in text, charts and tables are the latest available at the time of publication. Internet links may lead to more recent data. General Information
For more information, please call (202) 691‐5200.
Media Contact
The news media can contact the BLS Press Officer at (202) 691‐5902.