burglars’ specialisation: development of a...
TRANSCRIPT
BehaviormetrikaVol.31, No.2, 2004, 153–167
BURGLARS’ SPECIALISATION: DEVELOPMENT OFA THEMATIC APPROACH IN INVESTIGATIVE PSYCHOLOGY
Kaeko Yokota∗ and David Canter∗∗
In this study, the process of burglars’ specialisation was examined. 15 sub-categoriesof burglaries committed by 3,066 burglars were analysed, using a thematic approach.The result of an SSA-I showed that four themes existed in the structure of burglary:‘residential’, ‘commercial’, ‘public’, and ‘industrial/storage’. Also it was found that ‘res-idential’ and ‘commercial’ burglaries were the most distinct from each other, providingfor two dominant foci for burglaries. The results of POSA also confirmed that most bur-glars specialised in either ‘residential’ or ‘commercial’ burglaries. Few were specialisedin ‘public’ or ‘industrial/storage’ burglaries. In addition, the number of people who spe-cialised in commercial burglaries decreased with the increase of burgling experiences.The psychological processes underlying burglars’ specialisation in one theme, or shiftfrom one to another, are discussed. This study shows that the thematic approach offersa method of studying the multidimensional nature of burglars’ psychological processesof specialisation.
1. Introduction
‘Burglary’ is one of the most common serious crimes in many countries. In Japan,296,486 burglaries (i.e. thefts through breaking and entering) were recorded in 2000, being12.1% of all crimes (National Police Agency, 2001). However the majority of burglariesremained unsolved. In 2000 only 36.8% of all burglaries (n = 109,128) were solved inJapan. The chief reason for such a poor clear-up rate is probably the delay in reportingthe offence. A lot of victims are not able to report the offence as soon as it has occurredbecause, being away at the time, they knew nothing about it (Walsh, 1980). Moreover,burglars do not contact or confront their victims directly (Walsh, 1980). This makes iteven more difficult for the police to get information about criminals from eyewitnesses orvictims.
A number of studies have pointed out criminals’ specialisation in burglaries, where thespecialisation is defined as the consistent perpetration of one type of crimes (e.g. arson,burglary). A criminal development theory suggests that the individual learns that he orshe is particularly successful or particularly attracted to certain types of activities andso a form of specialism evolves through experiences of crimes (Canter, 1995; p.352). Ithas been pointed out that some recidivists particularly specialise in burglaries across theircriminal careers. For instance, the study of Farrington, Snyder, and Finnegan (1988)
Key Words and Phrases: thematic approach, burglary, specialisation, criminal career, investigative
psychology, POSA
∗ Investigation Support Section, National Research Institute of Police Science, 6–3–1, Kashiwanoha,
Kashiwa, Chiba 277–0882, Japan.
E-mail: [email protected]
∗∗ Centre for Investigative Psychology, Department of Psychology, The University of Liverpool, Liver-pool L69 7ZA UK.
E-mail: [email protected]
154 K. Yokota and D. Canter
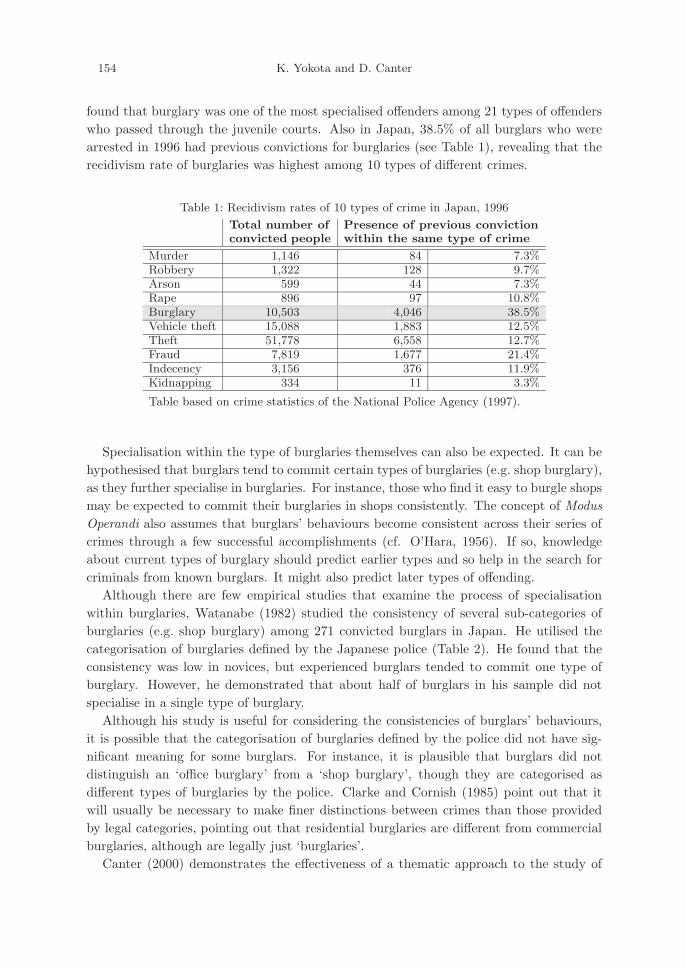
found that burglary was one of the most specialised offenders among 21 types of offenderswho passed through the juvenile courts. Also in Japan, 38.5% of all burglars who werearrested in 1996 had previous convictions for burglaries (see Table 1), revealing that therecidivism rate of burglaries was highest among 10 types of different crimes.
Table 1: Recidivism rates of 10 types of crime in Japan, 1996
Total number ofconvicted people
Presence of previous convictionwithin the same type of crime
Murder 1,146 84 7.3%Robbery 1,322 128 9.7%Arson 599 44 7.3%Rape 896 97 10.8%Burglary 10,503 4,046 38.5%Vehicle theft 15,088 1,883 12.5%Theft 51,778 6,558 12.7%Fraud 7,819 1,677 21.4%Indecency 3,156 376 11.9%Kidnapping 334 11 3.3%
Table based on crime statistics of the National Police Agency (1997).
Specialisation within the type of burglaries themselves can also be expected. It can behypothesised that burglars tend to commit certain types of burglaries (e.g. shop burglary),as they further specialise in burglaries. For instance, those who find it easy to burgle shopsmay be expected to commit their burglaries in shops consistently. The concept of ModusOperandi also assumes that burglars’ behaviours become consistent across their series ofcrimes through a few successful accomplishments (cf. O’Hara, 1956). If so, knowledgeabout current types of burglary should predict earlier types and so help in the search forcriminals from known burglars. It might also predict later types of offending.
Although there are few empirical studies that examine the process of specialisationwithin burglaries, Watanabe (1982) studied the consistency of several sub-categories ofburglaries (e.g. shop burglary) among 271 convicted burglars in Japan. He utilised thecategorisation of burglaries defined by the Japanese police (Table 2). He found that theconsistency was low in novices, but experienced burglars tended to commit one type ofburglary. However, he demonstrated that about half of burglars in his sample did notspecialise in a single type of burglary.
Although his study is useful for considering the consistencies of burglars’ behaviours,it is possible that the categorisation of burglaries defined by the police did not have sig-nificant meaning for some burglars. For instance, it is plausible that burglars did notdistinguish an ‘office burglary’ from a ‘shop burglary’, though they are categorised asdifferent types of burglaries by the police. Clarke and Cornish (1985) point out that itwill usually be necessary to make finer distinctions between crimes than those providedby legal categories, pointing out that residential burglaries are different from commercialburglaries, although are legally just ‘burglaries’.
Canter (2000) demonstrates the effectiveness of a thematic approach to the study of

BURGLARS’ SPECIALISATION 155
Table 2: Categorisation of burglaries (i.e. thefts through breaking and entering)defined by the Japanese police
1) House burglary (stealing daytime)2) House burglary (sneak thieving)3) House burglary (stealing late at night)4) Hotel burglary5) Locker room burglary6) Hospital burglary7) School burglary8) Public office burglary9) Petrol station burglary10) Safe breaking11) Office burglary12) Shop burglary13) Factory burglary14) Warehouse burglary15) Shed burglary
NB: ‘House burglary (sneak thieving)’ is defined as burglary where acriminal targets an unoccupied house, distinguishing from ‘House bur-glary (stealing daytime)’ or ‘House burglary (stealing late at night)’.
criminals’ actions. He points to the need to identify the dominant ‘themes’ amongst vari-ables that characterise an offence rather than focussing on very detailed consideration ofspecific actions. This is like adjusting the magnification of a microscope to a lower preci-sion in order to see the patterns that are obscured at very high magnification. He arguesthat with crime records the noise in the data is often so great that very precise sets ofvery many variables may hide the overall structure that is apparent when variables areconsidered as reflecting a set of related issues that cohere around a common theme. The‘theme’ can be defined as a ‘coherent set of actions’ (Canter, 1994; p.333). Each themehas a different focus and meaning, so that it reflects a style of each burglar’s behaviours.
The central hypothesis that emerges from these considerations is that there are somedominant themes in burglaries. For instance, a shop burglary and an office burglary mighthave the same psychological meanings for most burglars and belong to the same themeof commercial premises, although they may be classified into different sub-categories inthe official records for the police. The thematic approach makes it possible to examineburglars’ specialisation from a psychological point of view. The consistencies or inconsis-tencies of each theme across offenders are an indication of whether burglars specialise ina certain burglary theme or not. If the change from one theme to another is recognisedacross a series of crimes for one offender, it can be regarded as the reflection of his orher psychological change. If no change is apparent across the crimes of one offender thisindicates a preference for a particular type of burglary, in terms of specialising in it.
It is of value to clarify the difference between the ‘thematic’ approach, as utilised here,and the more traditional factor analytic approach in which dimensions are identified. Can-ter (2000) uses the analogy of the discrimination of colours. For most perceptual tasksthe underlying dimension of wavelength is not especially helpful in describing the psy-chological experience of colours. Instead we work with the primary colours, of red, blue,yellow and green. However, it is misleading to think of redness or blueness as independent

156 K. Yokota and D. Canter
dimensions. There are many colours in daily experience that are a combination of theseprimary colours, such as purple or pink. Therefore the primary colours are best thoughtof as dominant themes that can usefully be drawn upon to describe any colour withoutthe need to assume that they always operate independently from each other.
Themes, therefore, are sets of related variables that have an underlying common mean-ing. The difference from a ‘dimension’ or ‘factor’ lies in the fact that a) they are notassumed to be independent of (orthogonal to) one another and b) that they are a com-bination of a number of facet elements. This latter point derives from Guttman’s FacetTheory (cf. Canter 1985). In the colour analogy one facet would be ‘hue’ indicating thewavelength of the colour. The other could be, say, ‘intensity’, which may be defined ashow much grey the colour has in it. Together these describe the how strong the pink maybe.
Over the years a powerful approach has been developed for identifying facets and theirdominant themes within a facet structure. This uses the MDS procedure of SSA-I torepresent the variables as points in space, such that the more highly correlated those vari-ables are the higher their spatial propinquity is. This allows either the test of a priorimodels of the facet structure or, as in this case, an exploration of the likely facet structureand related underlying themes. In essence, themes will be expected to bring togethervariables with similar meaning into the same region of the space. So by examining theregional distribution of variables it is possible to infer the likely themes of which theyare constituted. In the current study patterns of co-occurrence of burglar’s crimes thatrevealed interpretable ‘themes’ within the SSA-I space were taken as empirical indicationof burglars’ specialisation.
2. Sample selection and features considered
In the current study, the data set was extracted from the database of the NationalPolice Agency, which consisted of records of burglaries that occurred from the periods of1993 to 1999 in Japan. However if a criminal was arrested just after the perpetration ofan incident, the case was not recorded in the database. Also only solved cases were takenfor the current study. Based on the database, a data matrix for the current study wasproduced (Table 3).
Table 3: Example from the data matrix created in the current study
CriminalID Number
House burglary(stealing daytime)
House burglary(sneak thieving)
Warehouseburglary
Shed burglary
1 1/5 0 . . . 3/5 02 1/13 11/13 0 1/13
. . . . . . . . . . . . . . .
The variables are included the 15 sub-categories of burglaries shown in Table 2. Thiscategorisation is based on types of buildings predefined by the police. The data used inthe current study was collected by the police, based on this categorisation, independently

BURGLARS’ SPECIALISATION 157
of the current research. A probability was assigned to each variable within the range of0 to 1, based on the frequency of occurrence of that variable within the total number ofcrimes for that offender from 1993 to 1999. The probability (pi) was calculated as:Formula 1—Calculation of an Offender’s Crime Type Probabilities
Pi =fi
nwhere (n =
15∑
i=1
fi + fother, 0 < Pi < 1)
where fi is the frequency that a variable i (e.g. shop burglary) was chosen, while n isthe total number of crimes of a certain burglar. fother is the frequency that an offendercommitted a burglary that did not match any 15 sub-categories in Table 2. For instance, ifa burglar committed shop burglaries 3 times (fi(shop burglary)) across his or her 10 crimes(n), the probability, 3/10, was assigned to Pi(shop burglary) for him or her.
Five samples were created, depending on the total number of each burglar’s recordsin the original database (n), as shown in Table 4. One sample included burglars whowere recorded as having committed 5 burglaries between 1993–1999, and so on. Thosewhose total number of records was large, were regarded as experienced burglars, havingcommitted a considerable number of burglaries between 1993 and 1999. On the otherhand, those whose total number of records was few, were regarded as less experienced.
Table 4: The five samples in the current study
Subjects descriptions in five samplesNumberof subjects
1) Burglars who committed 5 burglaries between 1993–1999 7342) Burglars who committed 10–19 burglaries between 1993–1999 1,7663) Burglars who committed 40–49 burglaries between 1993–1999 2584) Burglars who committed 90–199 burglaries between 1993–1999 2525) Burglars who committed 200 or more burglaries between 1993–1999 56
Total 3,066
The police information is not collected for the purpose of scientific examination, there-fore it can be used as the basis of valuable resource for research as it is an ‘unobtrusiveor non-reactive measurement’ (Canter and Alison, 2003). Webb, Campbell, Schwartz andSechrest (1966) defined an unobtrusive measurement as one that does not have the re-searcher’s input into the data collection and the subject of the data is not aware thattheir actions are being recorded at the time that they carry them out. Canter and Alison(2003) have pointed out police data is a particularly rich source of such unobtrusive data.There are difficulties associated with this data, but the current sample was of such a largescale that it was unlikely to be biased.
3. A study of underlining themes in burglary, based on SSA-I
3.1 Smallest Space Analysis (SSA) and data descriptions for the SSA-I
As mentioned, a considerable amount of research (reviewed by Canter, 2000) has

158 K. Yokota and D. Canter
found non-metric multi-dimensional scaling (MDS) to be useful for finding the under-lining themes. SSA is one of the MDS methods that represents the relationship betweenvariables as distances in a geometric space. The computing algorithm of the SSA rank-orders the correlations between items. It then generates a spatial representation of thoseitems as points in the space, and rank-orders the distances between the points. In general,then, in the SSA configuration, the more highly correlated two variables are, the closer willbe the points representing those variables in the space. Themes can then be determinedby considering the items in each region on the assumption that any items that belongto the same theme will be found in the same region of the space (see Canter, 1985, fordetails).
For the current analysis of the SSA-I, 50 burglars were extracted from each of the fivesamples of burglars (see Table 4) by random sampling. The total number of subjects inthe new data set was 250 (50×5). The SSA-I was then carried out on a correlation matrixof Pearson coefficients (Table 5), based on the data matrix of 15 variables shown in Table3. The correlation matrix from which the SSA is derived, is given in Table 5. The SSArepresents these correlations as distances in a space.
Table 5: Correlation matrix of probabilities of 15 variables1)
1 2 3 4 5 6 7 8 9 10 11 12 13 14 151 House burglary(stealing daytime)
1.00 .02 −.02 −.02 −.02 −.04 −.04 −.04 −.04 −.08 −.11 −.13∗∗ .04 −.04 −.03
2 House burglary(sneak thieving)
1.00 −.29∗∗−.02 −.06 −.12 −.11 −.11 −.15∗−.25∗∗−.37 −.45 −.10 −.12 −.07
3 House burglary(stealing late at night)
1.00 .10 −.03 −.05 −.06 −.07 −.08 −.15∗−.21∗∗−.23∗∗−.08 −.05 −.06
4 Hotel burglary 1.00 −.00 −.01 −.01 −.01 −.01 −.02 −.04 −.04 −.01 −.01 −.015 Locker room burglary 1.00 −.01 −.01 −.01 −.01 −.02 −.03 −.04 −.01 −.01 −.016 Hospital burglary 1.00 .00 −.02 −03 .00 .02 −.02 −.03 −.03 −.027 School burglary 1.00 .02 −.03 −.02 −.04 −.07 −.02 .18∗∗ .23∗∗
8 Public office burglary 1.00 −.03 .37∗∗ .14∗−.02 .03 −.02 −.029 Petrol station burglary 1.00 .19∗∗−.01 .02 −.03 −.02 −.0210 Safe breaking 1.00 .26∗∗−.01 −.02 −.04 −.0411 Office burglary 1.00 −.09 .07 −.02 .0112 Shop burglary 1.00 .00 −.01 −.0713 Factory burglary 1.00 .10 −.0214 Warehouse burglary 1.00 .30∗∗
15 Shed burglary 1.00∗p < .05, ∗∗p < .01 (n = 250)1)As calculated in Formula 1
3.2 Results of the SSA-I
For the acceptability of the result of the SSA-I, there are several criteria includingthe Guttman-Lingoes’ coefficient of alienation. In the current analysis, the 3-dimensionalsolution has a coefficient of alienation 0.18 with 13 iterations, indicating a good fit. How-ever, the interpretation of this configuration was very close to the regional structure ofthe 2-dimensional solution that has a coefficient of alienation of 0.25 with 10 iterations,so for simplicity the 2-dimensional structure will be presented.
BURGLARS’ SPECIALISATION 159
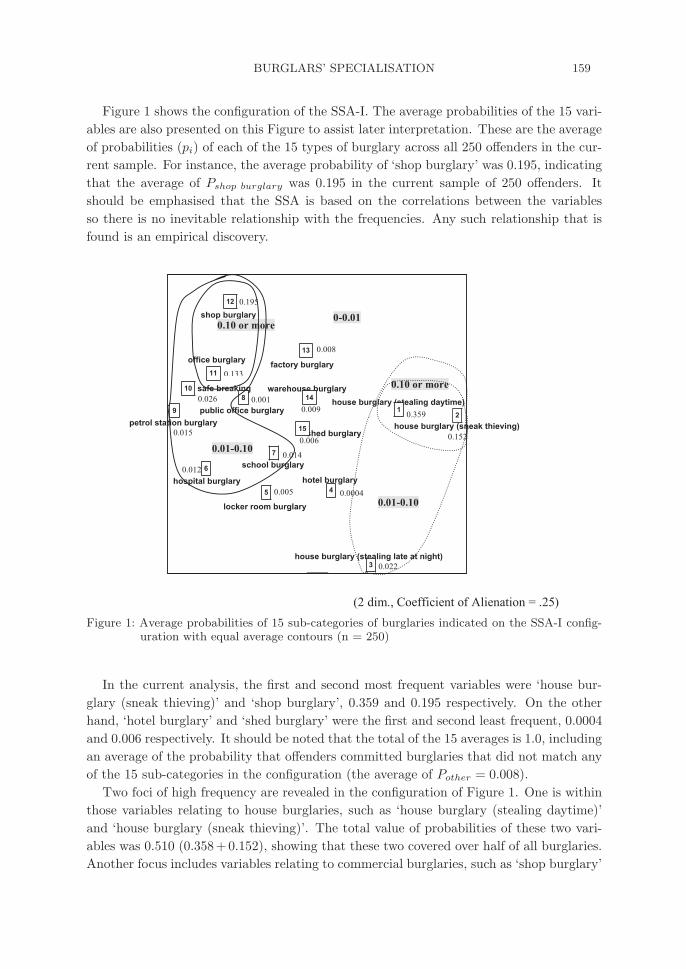
Figure 1 shows the configuration of the SSA-I. The average probabilities of the 15 vari-ables are also presented on this Figure to assist later interpretation. These are the averageof probabilities (pi) of each of the 15 types of burglary across all 250 offenders in the cur-rent sample. For instance, the average probability of ‘shop burglary’ was 0.195, indicatingthat the average of Pshop burglary was 0.195 in the current sample of 250 offenders. Itshould be emphasised that the SSA is based on the correlations between the variablesso there is no inevitable relationship with the frequencies. Any such relationship that isfound is an empirical discovery.
Figure 1: Average probabilities of 15 sub-categories of burglaries indicated on the SSA-I config-uration with equal average contours (n = 250)
In the current analysis, the first and second most frequent variables were ‘house bur-glary (sneak thieving)’ and ‘shop burglary’, 0.359 and 0.195 respectively. On the otherhand, ‘hotel burglary’ and ‘shed burglary’ were the first and second least frequent, 0.0004and 0.006 respectively. It should be noted that the total of the 15 averages is 1.0, includingan average of the probability that offenders committed burglaries that did not match anyof the 15 sub-categories in the configuration (the average of Pother = 0.008).
Two foci of high frequency are revealed in the configuration of Figure 1. One is withinthose variables relating to house burglaries, such as ‘house burglary (stealing daytime)’and ‘house burglary (sneak thieving)’. The total value of probabilities of these two vari-ables was 0.510 (0.358+0.152), showing that these two covered over half of all burglaries.Another focus includes variables relating to commercial burglaries, such as ‘shop burglary’

160 K. Yokota and D. Canter
and ‘office burglary’. The total proportions of these two variables was 0.328 (0.195+0.133),showing that these two include approximately 30 percent of all burglaries. The two focisuggest that they were psychologically different for many burglars and not committed bysame offenders in many cases. It shows that there were mainly two styles among bur-glars: one group of burglars mainly committed residential burglaries, while others mainlycommitted commercial burglaries.
The values in the correlation matrix in Table 5 support this distinction between thetwo sets of burglaries. The two most frequent types of burglary, ‘house’ and ‘shop’ havea highly significant negative correlation of −0.45. This shows the reluctance with whichburglars will carry out both types of crime.
Figure 2 shows the same configuration as in Figure 1 with the interpretation of regionalpartitions to indicate ‘themes’. Behaviourally more similar variables are expected to befound in the same region of the space, belonging to the same theme. Four themes wereidentified as described in Figure 2. Table 5 summarises the four themes, describing thevariables in each theme.
Figure 2: The SSA1 of 15 sub-categories of burglaries with the regional interpretation (n = 250)
One theme was defined as ‘residential’, including variables relevant to residential bur-glaries; ‘house burglary (stealing daytime)’, ‘house burglary (sneak thieving)’, and ‘houseburglary (stealing late at night)’. They are close together in the space, indicating thatthey are conceptually similar to each other. However, it is interesting that ‘house burglary(stealing late at night)’ was plotted further from the other two residential burglaries (i.e.
BURGLARS’ SPECIALISATION 161
‘house burglary (stealing daytime)’ and ‘house burglary (sneak thieving)’). This indicatesthat ‘house burglary (stealing late at night)’ is distinguishable from the other two, thoughall three belong to a ‘residential’ theme.
A second theme was defined as ‘commercial’, including variables relevant to burglarswho targeted commercial buildings (i.e. ‘office burglary’, ‘shop burglary’, ‘safe breaking’,and ‘petrol station burglary’). These two themes, ‘residential’ and ‘commercial’, can beregarded as dominant in the structure of burglary, considering the average probabilitiesof 15 variables shown in Figure 1.
The other two themes, ‘public’ and ‘industrial/storage’ were less dominant. The thirdtheme of ‘public’ included the following 5 variables: ‘hotel burglary’, ‘locker room bur-glary’, ‘hospital burglary’, ‘public office burglary’, and ‘school burglary’. All of themoccur in public places, where anonymous people come and go. The fourth theme, ‘indus-trial/storage’ included the targeting of industrial or storage places (i.e. ‘factory burglary’,‘warehouse burglary’, and ‘shed burglary’).
4. A study of the burglars’ specialisation, based on the POSA diagrams
4.1 Partial-Order Scalograms and data descriptions for the POSA
The SSA focuses on variables, representing the relationship between crimes not vari-ations between criminals. Various forms of individual crime profiles could therefore becreated from this mixture of variables. It is therefore valuable to determine exactly whatcombinations of variables co-exist in the patterns of offences of individuals. The analysisprocedure that allows this exploration of types of offenders (as distinct from the SSAstructuring of offences) is POSA (Shye 1994).
POSA starts from the assumption that each variable has a ‘common order’, meaningthat the changes of magnitude of each item has the same sense and direction, having thesame underlying meaning (Shye, 1994). A diagram is then created representing individ-uals with respect to the structured attribute. In the POSA diagrams, a profile of eachindividual is produced and ordered according to their score. For instance, a profile, ‘1113’(which gives a total ‘score’ of 6) is higher than ‘1003’ (with a total ‘score’ of 4). In thepresent case only binary values were used, so the ‘score’ is most appropriately the numberof variables endorsed. So if 2 indicates endorsement and 1 lack of it, a profile of ‘1112’would have a score = 1 and ‘2112’ a score = 2.
In order to determine if the four themes of offending created distinct sub-types of of-fenders, four thematic variables were created, one for each of the four themes revealed inthe SSA-I (Table 6). Based on the data matrix in Table 2, probabilities of variables foreach offender were summed up within each theme and each was marked ‘2’ as a high prob-ability or ‘1’ as a low probability. If the total probability was below 0.5, it was regardedas low specialisation, and categorised as ‘1’ because it indicated that a person committedburglaries of a certain theme in less than 50 percents of all his or her burglaries. For exam-ple, the score of the variable, ‘commercial’ was categorised as ‘1’, if the total probability offour variables belonging to a theme of ‘commercial’ (i.e. ‘office burglary’, ‘safe breaking’,

162 K. Yokota and D. Canter
‘shop burglary’, and ‘petrol station burglary’) was below 0.5. On the other hand, it wascategorised as ‘2’, if the total probability of all variables within one theme was above 0.5up to 1.0.
Table 6: Four themes derived from Figure 2
Theme Variables
Residential house burglary (stealing daytime), house burglary (sneak thieving),house burglary (stealing late at night),
Commercial office burglary, safe breaking, shop burglary, petrol station burglaryPublic school burglary, hospital burglary, locker room burglary,
public office burglary, hotel burglaryIndustrial/storage warehouse burglary, factory burglary, shed burglary
Consequently, each criminal was assigned a four-score profile. Each profile, such as‘2111’, consists of four values one for each of the four themes: ‘commercial’, ‘public’,‘industrial/storage’, and ‘residential’ from the left to the right. In this categorisationscheme, ‘2111’, ‘1211’, ‘1121’, and ‘1112’ were defined as specialisation, showing that aburglar committed burglaries with the same theme in 50 percents or more of cases. Forinstance, ‘1112’ indicates that a burglar specialised in ‘residential’ burglaries, committinghalf or more of his or her burglaries in this theme. On the other hand, ‘1111’ was regardedas versatility, suggesting that a burglar did not specialise in any particular theme. Profilessuch as ‘2211’ or ‘2112’ would be obtained when a burglar committed one theme of bur-glaries in 50 percent and another theme in the other 50 percent. ‘2221’, ‘2122’, ‘2212’, and‘2221’ could not logically exist because of the way in which the assignment to themes wascalculated. Therefore the proportion of individuals with a score of 1 provides a furthertest of thematic specialisation. These individuals only indicate one theme in more than50% of their offences. Table 7 summarises the profiles.
Table 7: Profiles for the POSA, together with the degree of specialisation
Profile Degree of specialisation
2111, 1211, 1121, 1112 High2211, 2121, 1221, 2112, 1212, 1122 �
1111 Low
Of interest also is whether offenders who have criminal histories of different lengths,i.e. had different amounts of criminal ‘experience’ would show different proportions ofspecialisation. This was examined by comparing the POSA diagrams derived from differ-ent samples of burglars, divided on the basis of the lengths of their criminals histories asshown in Table 4.
4.2 Results of the POSA diagrams
The POSA diagrams with joint scores are shown in Figure 3-1 to Figure 3-5. Linesconnecting comparable profiles represent order relations. Joint scores were calculated by

BURGLARS’ SPECIALISATION 163
Figure 3-1: The POSA diagram of 4 themes by burglars who were found to commit 5 burglariesbetween 1993–1999 (n = 734)
Figure 3-2: The POSA diagram of 4 themes by burglars who were found to commit 10–19 bur-glaries between 1993–1999 (n = 1766)
Figure 3-3: The POSA diagram of 4 themes by burglars who were found to commit 40–49 bur-glaries between 1993–1999 (n = 258)
Figure 3-4: The POSA diagram of 4 themes by burglars who were found to commit 90–199burglaries between 1993–1999 (n = 252)
Figure 3-5: The POSA diagram of 4 themes by burglars who were found to commit 200 or moreburglaries between 1993–1999 (n = 56)
164 K. Yokota and D. Canter
summing up the number of ‘2’s in profiles. For instance, a joint score of ‘0’ indicates thata burglar did not specialise in any theme, while a joint score of ‘1’ indicates that a burglarspecialised in one of four themes. In addition, the proportion of each profile is shown inFigure 3-1 to Figure 3-5.
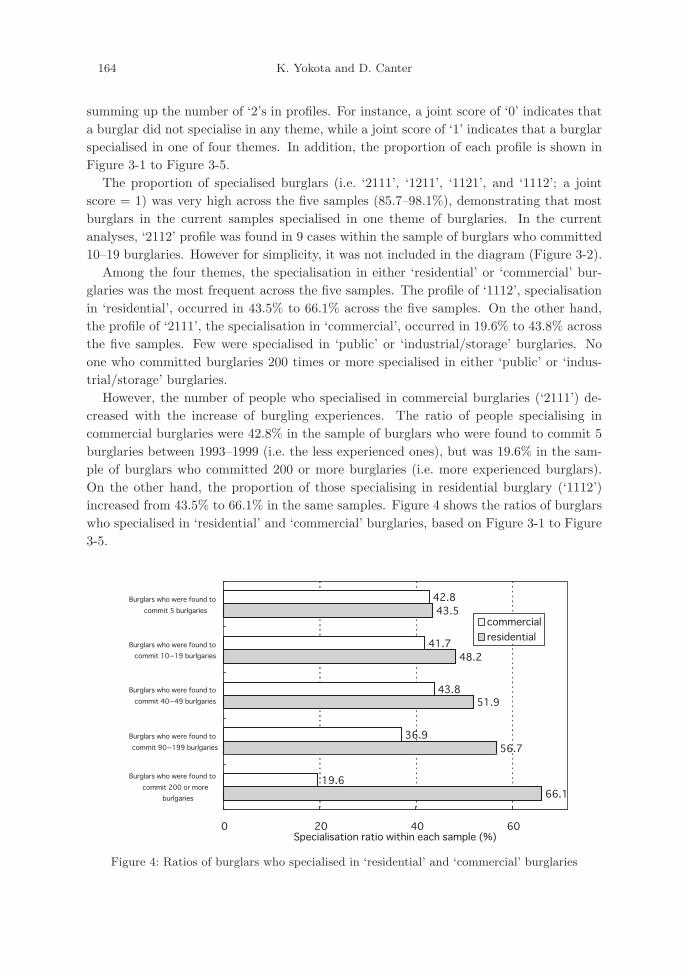
The proportion of specialised burglars (i.e. ‘2111’, ‘1211’, ‘1121’, and ‘1112’; a jointscore = 1) was very high across the five samples (85.7–98.1%), demonstrating that mostburglars in the current samples specialised in one theme of burglaries. In the currentanalyses, ‘2112’ profile was found in 9 cases within the sample of burglars who committed10–19 burglaries. However for simplicity, it was not included in the diagram (Figure 3-2).
Among the four themes, the specialisation in either ‘residential’ or ‘commercial’ bur-glaries was the most frequent across the five samples. The profile of ‘1112’, specialisationin ‘residential’, occurred in 43.5% to 66.1% across the five samples. On the other hand,the profile of ‘2111’, the specialisation in ‘commercial’, occurred in 19.6% to 43.8% acrossthe five samples. Few were specialised in ‘public’ or ‘industrial/storage’ burglaries. Noone who committed burglaries 200 times or more specialised in either ‘public’ or ‘indus-trial/storage’ burglaries.
However, the number of people who specialised in commercial burglaries (‘2111’) de-creased with the increase of burgling experiences. The ratio of people specialising incommercial burglaries were 42.8% in the sample of burglars who were found to commit 5burglaries between 1993–1999 (i.e. the less experienced ones), but was 19.6% in the sam-ple of burglars who committed 200 or more burglaries (i.e. more experienced burglars).On the other hand, the proportion of those specialising in residential burglary (‘1112’)increased from 43.5% to 66.1% in the same samples. Figure 4 shows the ratios of burglarswho specialised in ‘residential’ and ‘commercial’ burglaries, based on Figure 3-1 to Figure3-5.
Figure 4: Ratios of burglars who specialised in ‘residential’ and ‘commercial’ burglaries

BURGLARS’ SPECIALISATION 165
5. Discussion
The current study shows that four themes exist in 15 sub-categories of burglaries. Byexamining a thematic approach based on SSA-I, four themes were found: ‘residential’,‘commercial’, ‘public’ and ‘industrial/storage’. In addition, ‘residential’ and ‘commercial’burglaries were shown to be more prevalent than the other two, suggesting that offendersmainly targeted either residential or commercial buildings. Even those who committed‘public’ or ‘industrial/storage’ burglaries a few times did not commit the same burglarythemes consistently. The results of the POSA diagrams supported the result of the SSA-I,showing that most burglars specialised in either ‘residential’ or ‘commercial’ burglaries,while few specialised in ‘public’ or ‘industrial/storage’ burglaries.
Some previous researchers have pointed out that a residential burglary is clearly distin-guished from other types of burglaries. For instance, Walsh indicated that ‘the situationof a residential burglary is very different from a theft in a public place or at a place ofwork, since any burglary is far more personally disturbing because of its enforced intimacy’(Walsh, 1980; p.17). Also Clarke and Cornish (1985) insist that it is necessary to differen-tiate at least between commercial and residential burglary when studying burglars. Theresults of the current study support their ideas with Japanese data, demonstrating thata theme of ‘residential’ predominantly exists in burglary, together with the less frequenttheme of ‘commercial’. The rarer themes of ‘public’ and ‘industrial/storage’ were alsorecognised in the current study.
Two reasons for the non-specialisation in ‘public’ and ‘industrial/storage’ burglariescan be pointed out. First of all, it can be hypothesised that the lack of availability of‘public’ or ‘industrial/storage’ buildings makes it difficult for offenders to commit thosetypes of burglaries. Situational crime prevention assumes that a physical environmentthat provides opportunities for crimes influences the amount of offending (Bennett, &Wright, 1984). There are not so many ‘public’ or ‘industrial/storage’ buildings in manycommunities, compared with ‘residential’ or ‘commercial’ buildings. The infrequent op-portunities for encountering ‘public’ or ‘industrial/storage’ buildings possibly decreasedthe amount of offending.
Secondly, it can be assumed that ‘public’ or ‘industrial/storage’ burglaries are less at-tractive to offenders. A number of studies examine burglars’ decision making from theviewpoint of rational choice theory (e.g. Clarke and Cornish, 1985; Nee and Taylor, 1988;Logie, Wright, and Decker, 1992; Decker, Wright, Logie, 1993; Wright and Decker, 1994;Baker, 2000). Originally, rational choice theory was based on economic models of crimi-nals’ decision making, which assumes that criminals choose options that maximise theirexpected utilities (i.e. the expected utility maximisation model of economics), dependingon the balance between the rewards and risks of criminal and alternative lawful activities(Blackburn, 1993). The possibilities of getting financial gain from ‘public’ or ‘indus-trial/storage’ buildings are lower, as cash or materials suitable for the theft are rarely leftin such places. Also burgling such places is sometimes dangerous, because of the tightsecurity and/or people’s frequent coming and going. In terms of rational choice theory,‘public’ or ‘industrial/storage’ burglaries likely have more risks and few rewards for many

166 K. Yokota and D. Canter
burglars.The results also showed that many ‘commercial’ burglars tended to have more com-
mercial targets to residential ones if they commit many crimes. The ratio of burglarsspecialising in commercial burglaries decreased from 42.8% (in the sample of burglarswho were found to commit 5 burglaries between 1993–1999) to 19.6% (in the sample ofburglars who were found to commit 200 or more burglaries between 1993–1999). On theother hand, the proportion of those specialising in residential burglaries increased from43.5% to 66.1% in the same samples.
It suggests that residential burglaries are more attractive than commercial ones for someexperienced burglars. One reason is that many commercial buildings are more secure thanresidential ones in guarding from thieves, which makes it difficult for burglars to breakinto such commercial buildings. The possibility of burglars’ being arrested would increasein commercial burglaries. On the other hand, a number of residential buildings are lesssecure so that burglars possibly enter houses more easily to steal. However, Walsh (1980)indicated that a burglars’ ideal target was a business firm rather than a private house,because there was more to be stolen in the former. His study was based on interviews withconvicted burglars in British prisons. Though the sample in his study was rather differentfrom those in the current study, it should be noted that a certain percentage of burglars(19.6%) who committed 200 or more burglaries were shown to specialise in commercialburglaries in the current sample also. It can be hypothesised that commercial burglarshave more opportunities to get higher rewards together with more risks, compared withresidential burglary. Also prison sentences are more likely so that they would fall intoa prison population sample more readily. Further research is necessary to examine theprocess of commercial and residential burglaries more closely.
The results have demonstrated the process of burglars’ specialisation, showing fourthemes of burglaries and the consistencies and inconsistencies of each theme. Findings inthe current study can help police investigations in many ways. As mentioned, knowledgeabout current types of burglary may help to predict earlier or later types. For instance, apetrol station burglar might have previous experiences of ‘office burglary’, ‘safe breaking’or ‘shop burglary’ because they belong to the same theme (i.e. commercial burglary).
Although a cross sectional approach was applied in the current study, longitudinalresearch is the method of choice to describe or assess change or development (Robson,1993). Further research is crucial to understand the process of the burglars’ specialisationcomprehensively.
REFERENCES
Baker, M. (2000). The criminal range of small town burglars. In D. Canter, & L. Alison (Eds.),
Profiling Property Crimes. in Offender profiling series: Vol. IV, Dartmouth: Ashgate.
Bennett & Wright, (1986). Burglars on Burglary: Prevention and the offender, Hampshire:
Gower.
Blackburn, R. (1993). The psychology of criminal conduct, New York: Wiley.
Canter, D. (1983). The potential of facet theory for applied social psychology. Quality and Quan-
tity, 17, 36–57.

BURGLARS’ SPECIALISATION 167
Canter, D. (Ed.) (1985). Facet Theory, New York: Springer Verlag.
Canter, D. (1994). Psychology of offender profiling. In Ray Bull & David Carson (Eds.), Handbook
of Psychology in Legal Contexts, Chichester: John Wiley and Sons, 343–355.
Canter, D. (1995). Psychology of offender profiling. In Ray Bull & David Carson (eds.), Handbook
of Psychology in Legal Contexts, Chichester: John Wiley and Sons, 343–355.
Canter, D. (2000). Offender profiling and criminal differentiation. Journal of Criminal and Legal
Psychology, 5, 23–46.
Canter, D. & Alison, L. (2000). Profiling property crimes. In D. Canter, & L. Alison (Eds.),
Profiling Property Crimes. in Offender profiling series: Vol. IV, Dartmouth: Ashgate.
Canter, D. & Lawrence, L.J. (2003). Converting evidence into data: The use of law enforcement
archives as unobtrusive measurement. The Qualitavive Report, 8(2), 151–176.
Clarke, R., & Cornish, D. (1985). Modelling of offenders’ decisions: A framework for research
and policy. In M. Tonry, & N. Morris, Crime and Justice: An annual review of research, 6,
147–185, Chicago: University of Chicago Press.
Decker, S., Wright, R., & Logie, R. (1993). Perceptual deterrence among active residential bur-
glars: A research note. Criminology, 31(1), 135–147.
Farrington, D.P., Snyder, H.N., & Finnegan, T.A. (1988). Specialisation in juvenile court careers.
Criminology, 26, 461–487.
Logie, R., Wright, R., & Decker, S. (1992). Recognition memory performance and residential
burglary. Applied Cognitive Psychology, 6(2), 109–123.
National Police Agency (2001). Hanzai tokeisho (Crime statistics in 2000) (in Japanese).
Nee, C., & Taylor, M. (1988). Residential burglary in the Republic of Ireland: A situational
perspective. The Howard Journal, 27(2), 105–116.
O’Hara, C.E. (1956). Fundamentals of Criminal Investigation. Charles C Thomas Publisher.
Robson, C. (1993). Real world research: a resource for social scientists and practitioner-
researchers, Massachusetts: Blackwell.
Shaughnessy, J.J., & Zechmeister, E.B. (1997). Research methods in psychology, New York: The
McGraw-Hill Companies, Inc.
Shey, S. (1994). Introduction to facet theory: content design and intrinsic data analysis in behav-
ioral research, California: SAGE Publications.
Walsh, D. (1980). Break-ins: burglary from private houses, London: Constable.
Watanabe, S (1982). Shinnyusettohan no hanzai teguchi ni kansuru kenkyu (Modus Operandi of
burglars. I.: The consistency of types of burglary). Reports of National Research Institute
of Police Science: Research on Forensic Science, 35(1), 48–55 (in Japanese).
Wright, R., & Decker, S. (1994). Burglars on the job, Boston: Northeastern University Press.
(Received April 2004, Revised June 2004)