bus 419 canadian chartered financial institutions economic and market analysis
Post on 19-Dec-2015
214 views
TRANSCRIPT

BUS 419BUS 419
Canadian Chartered Financial Institutions
Economic and Market Analysis

AgendaAgenda
• Structure of the Industry
• Scotiabank
• TD Financial Group
• Bank Comparison
• Recommendations

Structure of the IndustryStructure of the Industry• 14 domestic banks, 33 foreign bank subsidiaries, and
20 foreign bank– In 1999, restrictions on foreign bank operations lowered
• Managed over $1.7 trillion in assets, which account for over 70 % of the total assets of the Canadian financial services sector
• Big 6 accounted for over 90% of the assets of the industry
• 8,000 branches and close to 18,000 ABMs– the highest number of ABMs per capita in the world
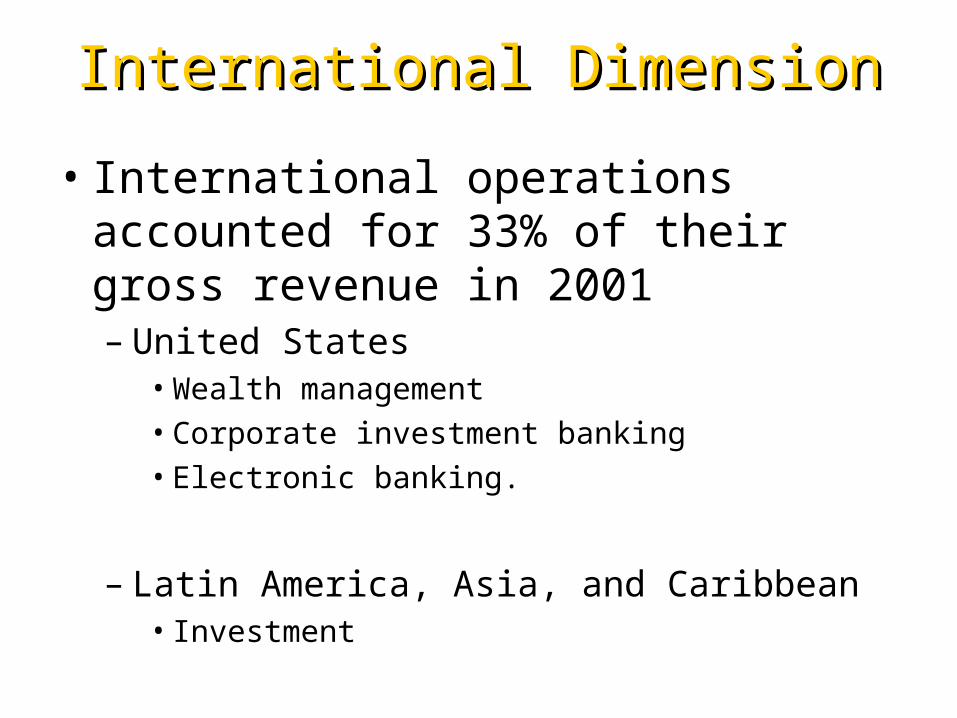
International DimensionInternational Dimension
• International operations accounted for 33% of their gross revenue in 2001– United States
• Wealth management • Corporate investment banking• Electronic banking.
– Latin America, Asia, and Caribbean• Investment

ProductsProducts
• Banking – Personal and business banking– TD Canada Trust– ScotiaOne
• Insurance – Creditor, life, health, travel, home, and auto products– TD Insurance– ScotiaLine, ScotiaPlan
• Investment – Wealth management services for private clients– TD Canada Trust – Money market, health protection– TD Waterhouse – Discount brokerage– Scotia McLeod
• Capital Market – products and services offered to corporations, governments, and institutional clients– TD Commercial Banking– Scotia Capital

Revenue CompositionRevenue Composition
• Major source of revenue– Net interest income
• Other non-interest income – Mutual fund– Wealth management– Foreign exchange– Derivative trading

Revenue Composition …cont’dRevenue Composition …cont’d
Increasing of non-interest income over the past 10 years

Regulatory EnvironmentRegulatory Environment
BANK ACT– Federal government is responsible for the
regulation of the banking industry in Canada
• The Office of the Superintendent of Financial Institutions (OSFI) – Reporting to Minister of Finance– Safeguard policyholders, depositors and
pension plan members from undue loss

Regulatory Environment Regulatory Environment
• Hybrid nature of the banks activities– Some of their subsidiary activities are
provincially regulated

Regulatory EnvironmentRegulatory Environment
• “The regulatory and supervisory structure in Canada is well developed, complies with the major international principles and standards, and is a source of international best practice in a number of areas”
~~ IMF

Industry PlayersIndustry Players

Scotia Bank vs. TD BankScotia Bank vs. TD Bank

SCOTIABANKSCOTIABANK
Life, Money, Balance Both

Organizational StructureOrganizational Structure
R e ta ilB a nk ing
S co tia M cL e od S co tia C a sse ls S co tia T ru st
W e a lthM a na ge m e nt
S m a llB u s in e ss
C o m m e rc ia lB a nk ing
D o m es tic B a n k ing In te rn a tio na l B a nk ing
S co tia M oca tta
S co tia C a p ita l
S co tia b an k G ro up

Earnings by Business LineEarnings by Business Line
1142
125
380
1094
669721
0
200
400
600
800
1000
1200
Mill
ion
2002 2003
Domestic Banking International Banking Scotia Capital

Scotia’s Risk ManagementScotia’s Risk Management

Risk Management StructureRisk Management Structure
L oanP o licy
C o m m ittee
L ia b ilityC o m m ittee
S e n io rC re d it
C o m m ittee
M a rke t R iskM a na ge m e nt
& P o licyC o m m ittee
S co tiaC a p ita l
T ra d in g R iskC o m m ittee
R e pu ta tio n a lR is k
C o m m ittee
S e n io r M an a ge m en t C om m itte es
B o a rd o f D ire c to rs

Credit RiskCredit Risk
D e c is io n H ie ra rchy
C re d itU n it1A
C re d itU n it1B
C re d itU n it1 C
S e n io r C red it C o m m itte e 1
C re d itU n it2A
C re d itU n it2B
C re d itU n it2 C
S e n io r C red it C o m m itte e 2
L o a n P o licy C o m m ittee
B o a rd o f D ire c to rs

Credit Risk (cont’d)Credit Risk (cont’d)
• Commercial & corporate credit requests assessed by credit units
• Assessment criteria:• current & future credit statistics• industry & economic trends• geo-political risk• management
• Assignment of risk rating using a rating system with 19 categories
• Decision factors to be considered, such as:• Risk rating• Facility risk• Industry & country limits

Credit Risk (cont’d)Credit Risk (cont’d)
13.0%
7.7%
3.5%
5.5%9.7% 0.2%
60.5%
Canada
North America
Europe
Asia
Caribbean
Latin America
Middle East & Africa
40.2%
38.4%
16.3%
5.2%
Business
Residential
Personal
Financial &Government
Diversified Internationally…
…and Diversified by Borrower Types

Market RiskMarket Risk
• Summary of Market Risks– FUNDING
• Interest Rate Risk• Foreign Exchange Risk
– INVESTMENT• Interest Rate Risk• Foreign Exchange Risk• Equities Risk
– TRADING• Interest Rate Risk• Foreign Exchange Risk• Equities Risk• Commodities Risk

Market Risk (cont’d)Market Risk (cont’d)• Risk Assessment & Measurement
– Value at Risk (VaR)– Stress Testing– Sensitivity Analysis– Simulation Modeling– Gap Analysis
• Managed risks mainly through limits

Liquidity RiskLiquidity Risk
• Liquidity risk controlled through…– Liquidity position assessment– Scenario analysis and their assumptions– Contingency plans development
• Broad range of funding sources…– Capital– Deposits from retail / commercial clients– Wholesale funding
• Enhanced term funding through…– Note issuance program– Sale of mortgage-backed securities

Liquidity Risk (cont’d)Liquidity Risk (cont’d)
• As of October 31, 2003– $75 billion liquid assets (26% of total assets), of
which…
Cash & Deposit
27%
Securities73%

Derivative SecuritiesDerivative Securities
• 2 primary objectives:– Manage risks from funding & investment activities– Lower the cost of capital
• Markets derivatives to customers & take positions for own account
• Trades a wide variety of instruments– Forwards and futures– Interest rate swaps and options– Currency swaps– Equity and credit derivatives– Other more complex structured products

Derivative Securities (cont’d)Derivative Securities (cont’d)
• To control credit risk of derivatives:– Use of credit mitigation techniques
• Applies limits to each counterparty• Measures exposure as current fair value plus potential
future exposure• Portfolio of mostly short-term instruments• Investment grade counterparties (90% of total credit risk)
– Use of credit derivatives such as credit default swaps

Foreign Exchange and Gold Foreign Exchange and Gold ContractsContracts
0
50,000
100,000
150,000
200,000
250,000
1998 1999 2000 2001 2002 2003
Futures Spots and Forwards Swaps
Options Purchased Options Written

Total Notional Value of OTC and Exchange Traded Total Notional Value of OTC and Exchange Traded Derivative Financial instrumentsDerivative Financial instruments
0
200,000
400,000
600,000
800,000
1,000,000
1,200,000
1998 1999 2000 2001 2002 2003
Total Interest Rate Contracts Total Foreign Exchange Contracts
Total Other Contracts

Proportion Invested in Each Proportion Invested in Each Derivative InstrumentDerivative Instrument
Other Contracts
(Equity, Credit)3%
Interest Rate Contracts
74%
Foreign Exchange Contracts
23%
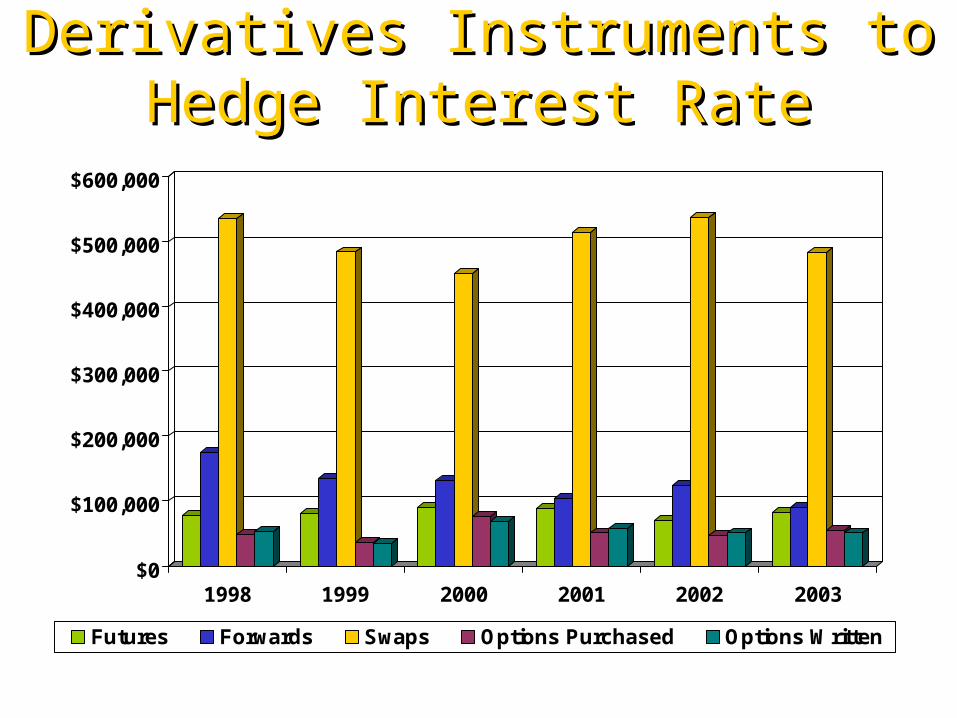
Derivatives Instruments to Derivatives Instruments to Hedge Interest RateHedge Interest Rate
$0
$100,000
$200,000
$300,000
$400,000
$500,000
$600,000
1998 1999 2000 2001 2002 2003
Futures Forwards Swaps Options Purchased Options Written

Trading vs. Non-TradingTrading vs. Non-Trading
Favourable
Trading94%
Non Trading
6%
Unfavourable
Trading87%
Non Trading
13%

Non-Trading DerivativesNon-Trading Derivatives2003
37%
17% 46%
Interest RateContractsFX Contracts
Other
2002
28%
3%
69% Interest RateContractsFX Contracts
Other

Scotia’s Employee Stock Scotia’s Employee Stock OptionsOptions

Employee Stock OptionsEmployee Stock Options
• Exercise price will not be less than the closing price of common shares on the trading day before grant date
• Options vest over 4 years and expire after 10 years, subject to early expiration
• Outside Canada, where options granting are restricted, SARs have been granted instead
• Will start expensing options in 2004 due to new CASB rule
• Ownership requirement for chief executives = 3 times the base salary
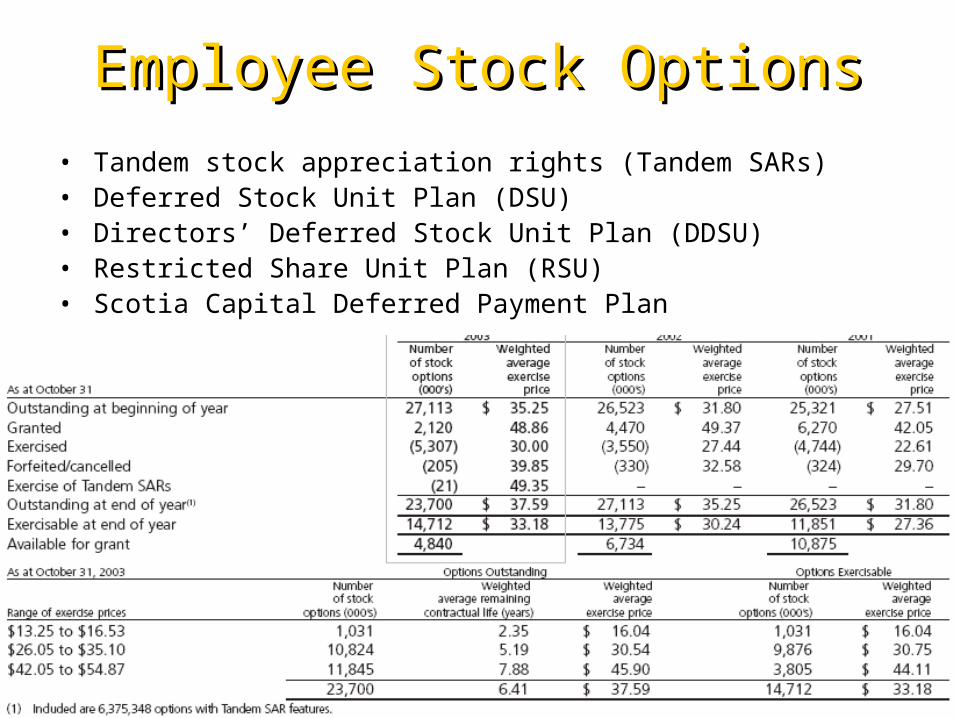
Employee Stock OptionsEmployee Stock Options• Tandem stock appreciation rights (Tandem SARs)• Deferred Stock Unit Plan (DSU)• Directors’ Deferred Stock Unit Plan (DDSU)• Restricted Share Unit Plan (RSU)• Scotia Capital Deferred Payment Plan

TD Bank Financial GroupTD Bank Financial Group

HistoryHistory
• 1855 Bank of Toronto is founded
• 1871 The Dominion Bank is founded
• 1955 Bank of Toronto + The Dominion Bank = Toronto Dominion
• 2002 Acquire Canada Trust and become TD Canada Tust

TD Bank CompositionTD Bank Composition
T D C a n ad a T ru st T D C o m m e rc ia lB a nk ing
P e rson a l &C o m m e rc ia l B a n k ing
T DS e cu rit ies
W h o le sa leB a nk ing
T D A sse tM a na ge m e nt
T DW a te rho u se
W e a lthM a na ge m e nt
T D F ina n c ia l G ro up

OperationsOperations

Overall PerformanceOverall Performance
http://www.td.com/ar2003/md_02_01.htmlhttp://www.td.com/investor/2001/complete.PDF pg.18
Million
$1,567
$526
$2,158$2,018
$1,076
-$76
$1,300
$969
-$500
$0
$500
$1,000
$1,500
$2,000
$2,500
2003 2002 2001 2000
Cash Basis Reported

Income by Business Income by Business SegmentSegment
Adapted from: http://www.td.com/ar2003 Note: Cash Basis
Million
$1,277
$363
-$75
$1,114
-$657
$125
-$800
-$400
$0
$400
$800
$1,200
$1,600
2003 2002
Personal Wholesale Wealth Management

Risk ManagementRisk Management

Risk Factors Risk Factors
• Strategic Risk
• Credit Risk
• Market Risk
• Operational Risk
• Liquidity Risk
• Investment Risk
• Regulatory Risk
• Reputational Risk

Risk Management CommitteesRisk Management Committees
R isk C om m ittee A u d it C o m m ittee
B o a rd o f D ire c to rs

Risk Management CommitteesRisk Management Committees
S e n io r E xe cu tive T e am C re d it an d M arke t R isk C o m m ittee
B u s ine ss P e rfo rm an ce C o m m ittee O p e ra tio n a l R isk O vers ig h t C o m m ittee
In ves tm en t C o m m ittee A sse t/L ia b ility C o m m ittee
E xe cu tive M an a g em e nt C om m itte es

Value at RiskValue at Risk
2002
+ve 88%
2003+ve 96.4%
Adapted from: http://www.td.com/ar2003;and annual report 2002

Value at RiskValue at Risk
2002 2003
Adapted from: http://www.td.com/ar2003;and annual report 2002

Market Risk and DerivativesMarket Risk and Derivatives
Risk Derivative
•Interest Rate Risk •Interest Rate Swaps•Forward rate agreements
•Foreign Exchange •Foreign Exchange Swaps•Foreign Exchange Forward Contracts•Cross-currency interest rate swaps

Trading vs. Non-TradingTrading vs. Non-Trading
90%
10%
Trading
Non-Trading
Adapted from:http://www.td.com/ar2003/pdf/ar2003.pdf pg.57

Non-Trading DerivativesNon-Trading Derivatives
29%
70%
1%
Interest Rate Contracts
FX Contracts
Other
41%
4%
55%
2003
2002
Adapted from:http://www.td.com/ar2003/pdf/ar2003.pdf pg.57

0
100
200
300
400
500
600
1998 1999 2000 2001 2002 2003
Forward contracts Swaps
Cross-country Int. rate swaps Options Written
Options Purchased
Derivatives used to hedge Derivatives used to hedge Foreign Exchange RiskForeign Exchange Risk

Derivatives Instruments to Derivatives Instruments to hedge Interest Ratehedge Interest Rate
0
100
200
300
400
500
600
700
800
900
1998 1999 2000 2001 2002 2003
Futures Forwards Swaps Options Written Options Purchased

Total Notional value of OTC and Exchange traded Total Notional value of OTC and Exchange traded Derivative Financial instrumentsDerivative Financial instruments
0
500
1000
1500
2000
2500
3000
3500
4000
4500
1998 1999 2000 2001 2002 2003
Total Interest Rate contracts Total Foreign Exchange contracts
Total Other Contracts

Concentration of Credit Risk – Derivative Financial Concentration of Credit Risk – Derivative Financial Instruments by countryInstruments by country
0.00
1,000.00
2,000.00
3,000.00
4,000.00
5,000.00
6,000.00
7,000.00
8,000.00
9,000.00
1999 2000 2001 2002 2003
Europe – excluding the UK United States Canada
United Kingdom Other countries

TD Bank’s Employee Stock TD Bank’s Employee Stock OptionsOptions

Employee Stock OptionsEmployee Stock Options
Options for common shares granted to eligible employees and non-employee directors of the bank
Before Oct. 5, 2002 Oct. 6, 2002 onwards
•Settlement terms of 10 years, vested for periods of 4 years•Can settle the options for cash up to the intrinsic value of the option
•Reduced use of stock options•Reduced terms to 7 years•No longer settle for cash•More disclosure from senior executive who plan to exercise•More ownership req. for senior executives

Employee Stock OptionsEmployee Stock Options
2003
Weighted Average exercise price 2002
Weighted Average exercise price 2001
Weighted Average exercise price
Number outstanding, beginning of year 23,859,413 30.35$ 22,218,787 26.65$ 23,403,443 22.53$ Granted 4,065,116 33.42$ 478,800 41.11$ 3,639,640 41.66$ Exercised - cash - -$ 1,673,495- 17.51$ 2,593,303- 15.30$ - shares 2,900,483- 16.25$ 836,754- 15.84$ 1,303,943 79 Forfeited/cancelled 644,350- 40.00$ 557,925- 36.06$ 927,050- 32.27$ Number outstanding, end of year 24,379,696 32.28$ 23,859,413 30.35$ 22,218,787 26.65$ Exercisable, end of year 14,775,784 28.87$ 13,239,598 23.94$ 13,081,260 20.49$
Range of exercise prices Number outstanding
Weighted av. Remaining contractual life (years)
Weighted Average exercise price
Number exercisable
Weighted Average exercise price
$10.44-$11.81 1,293,662 2.4 11.08$ 1,293,662 11.08$ $17.45-$25.43 5,214,309 4.6 22.05$ 5,214,309 22.05$ $27.15-$40.55 10,550,500 6.9 33.65$ 10,550,500 33.40$ $40.80-$42.90 7,321,225 7.6 41.32$ 7,321,225 41.45$
Options outstanding Options exerciseable

Asset BaseAsset Base
22%
19%
19%
16%
19%
5%
Royal BankTDCIBCBMOScotiaNational
http://www.fin.gc.ca/toce/2002/bank_e.html; Last Updated: 2003-09-05

Stock PerformanceStock Performance

ROI for Big 6 BanksROI for Big 6 Banks
-5
0
5
10
15
20
%
1998 1999 2000 2001 2002
Period
Return on Investment
SCOTIA BANK
TD BANK
BIG 6 AVERAGE

Comparison: Executive Stock Comparison: Executive Stock OptionsOptions
Scotiabank TD Bank
•10 year settlement terms•Can receive cash for intrinsic value or settle for shares
•Moved from 10 year to 7 year settlement terms•Can only be settled for common shares•Increased executive share ownership requirements•Reduced use of stock options

RecommendationsRecommendations
• Minimize spread between favourable and non-favourable
• Re-evaluating executive stock options– Reduce time to expiration– Expense options immediately
• Create a natural hedge for Foreign Exchange

Questions?Questions?

SourcesSources
• Scotiabank Annual Reports, for fiscal years ending 1999 to 2003
• TD Bank Financial Group Annual Reports, for fiscal years ending 1999 to 2003
• “TD Bank Financial Group Enhances Corporate Governance Policies On Executive Compensation” from http://biz.yahoo.com/cnw/031218/td_exec_compensation_1.html, March 10, 2004