bus safety report - nsw office of transport safety ... 2016_final.pdf · investigation report into...
TRANSCRIPT
BUS SAFETY REPORT BUS FIRES IN NEW SOUTH WALES IN 2016

BUS SAFETY REPORT BUS FIRES IN NEW SOUTH WALES IN 2016
Released under the provisions of Section 45C (2) of the Transport Administration Act 1988
File Reference: 04594 (4)
Published by: The Office of Transport Safety Investigations
Postal address: PO Box A2616, Sydney South, NSW 1235
Office location: Level 17, 201 Elizabeth Street, Sydney NSW 2000
Telephone: 02 9322 9200
Accident and incident notification: 1800 677 766
Facsimile: 02 9322 9299
E-mail: [email protected]
Internet: www.otsi.nsw.gov.au
This document is Copyright. In the interests of enhancing the value of the
information contained in this document, its contents may be copied, downloaded,
displayed, printed, reproduced and distributed, but only in unaltered form (and
retaining this notice). However, copyright in material contained in this document
which has been obtained by the Office of Transport Safety Investigations from other
agencies, private individuals or organisations, belongs to those agencies, individuals
or organisations. Where use of their material is sought, a direct approach will need
to be made to the owning agencies, individuals or organisations.
Subject to the provisions of the Copyright Act 1968, no other use may be made of the
material in this document unless permission of the Office of Transport Safety
Investigations has been obtained.

THE OFFICE OF TRANSPORT SAFETY INVESTIGATIONS
The Office of Transport Safety Investigations (OTSI) is an independent NSW agency whose
purpose is to improve transport safety through the investigation of incidents and accidents in
the rail, bus and ferry industries. OTSI investigations are independent of regulatory, operator
or other external entities.
Established on 1 January 2004 by the Transport Administration Act 1988 (NSW), and
confirmed by amending legislation as an independent statutory office on 1 July 2005, OTSI is
responsible for determining the contributing factors of accidents and to make
recommendations for the implementation of remedial safety action to prevent
recurrence. Importantly, however, OTSI does not confine itself to the consideration of just
those matters that contributed to a particular accident; it also seeks to identify any transport
safety matters which, if left unaddressed, might contribute to other accidents.
OTSI’s investigations are conducted under powers conferred by the Transport Administration
Act 1988 (NSW) and Passenger Transport Act 1990 (NSW). Additionally, all OTSI
publications that are considered investigation reports are also conferred by these Acts. OTSI
also conducts rail investigations on behalf of the Australian Transport Safety Bureau under
the Transport Safety Investigation Act 2003 (Cwlth). OTSI investigators normally seek to
obtain information cooperatively when conducting an accident investigation. However, where
it is necessary to do so, OTSI investigators may exercise statutory powers to interview
persons, enter premises and examine and retain physical and documentary evidence.
It is not within OTSI’s jurisdiction, nor an object of its investigations, to apportion blame or
determine liability. At all times, OTSI’s investigation reports strive to reflect our balanced
approach to the investigation, in a manner that properly explains what happened, and why, in
a fair and unbiased manner.
Once OTSI has completed an investigation, its report is provided to the NSW Minister for
Transport and Infrastructure for tabling in Parliament. The Minister is required to table the
report in both Houses of the NSW Parliament within seven days of receiving it. Following
tabling, the report is published on OTSI’s website at www.otsi.nsw.gov.au.

OTSI Bus Safety Report
BUS FIRES IN NEW SOUTH WALES IN 2016
Introduction In June 2013, the Office of Transport Safety Investigations (OTSI) released an
investigation report into common safety-related issues that had been revealed
through its examination of the nature and circumstances of bus and coach fires in the
period 2005 to 2012 inclusive (The 2005 - 2012 Report).1 This was followed by the
following annual reports:
• The Bus Fires in NSW in 2013 Report (published in April 2014).
• The Bus Fires in NSW in 2014 Report (published in February 2015).
• The Bus Fires in NSW in 2015 Report (published in February 2016).2
Monitoring of the extent, origins and causes of bus fires reported to OTSI continued
through 2016 and resulted in the publication of this report in February 2017.
In line with previous years all reported fires were documented and included incidents
which did not progress to a fire although involved excessive heat and the generation
of smoke. This year, for the first time, the reports were assessed and grouped into
two categories: fire incidents and thermal incidents. 3
In most cases the origin and cause of the incident was readily identifiable and did not
require an in-depth investigation. OTSI investigators examined vehicles on 15
occasions following the report of a fire. Four incidents were formally investigated and
documented in more comprehensive OTSI bus safety investigation reports.
This report contains a summary of the information gathered in 2016 and provides
commentary on comparisons with the information reported in previous years. The
report also summarises the progress in implementation of recommendations made in
previous reports.
1 OTSI Bus Safety Investigation Report, An Investigation into Bus Fires in NSW 2005 - 2012, available at www.otsi.nsw.gov.au
2 All OTSI investigation reports are available at www.otsi.nsw.gov.au 3 Fire: Visible fire seen by driver, passengers or witnesses. Fire or flames are mentioned in the
report. Flaming combustion has occurred (Rapid oxidation of gases and vapours that generate detectable heat and light.) The level of damage was such that it was likely that an actual fire occurred. Thermal incident: No mention of fire or flames seen by driver, passengers or witnesses. Heat only. No fire damage.
Bus Fires in New South Wales in 2016 1

OTSI Bus Safety Report
Data for this report came primarily from information provided by operators using the
same methodology as used for recording occurrences in the previous years.
Data Analysis In 2016 there were a total of 77 reported incidents: 37 fire incidents and 40 thermal
incidents. This was an increase of 92% from 2015. The total represents a significant
increase over the number of incidents recorded for prior years: 28 in 2013, 29 in
2014, 40 in 2015 and 77 in 2016 (see Figure 1).
Figure 1: Overall number of incidents 2013-2016
The 77 incidents reported in 2016 were distributed through the year as shown in
Figure 2. Brief details of each incident are recorded at Appendix A.
Figure 2: Incident spread 2013-2016
0102030405060708090
2013 2014 2015 2016
Num
ber o
f inc
iden
ts
Year
Incidents 2013 - 2016
0
2
4
6
8
10
12
Jan Feb Mar Apr May Jun Jul Aug Sep Oct Nov Dec
2013 2014 2015 2016
Bus Fires in New South Wales in 2016 2
OTSI Bus Safety Report
The growth appears to be a result of a combination of increased reporting by
operators and a rise in actual incidents. There was an increase across all categories
of incidents including destroyed and major damage levels. There also appears to be
an increased awareness among bus operators of the importance of reporting
incidents.
Damage levels of incidents. In previous years incidents were classified into
various severity levels. This year incidents were classified into the following levels
(see Appendix B for a more detailed description):
• Destroyed.
• Major.
• Minor.
• Smoke damage.
• Nil damage.
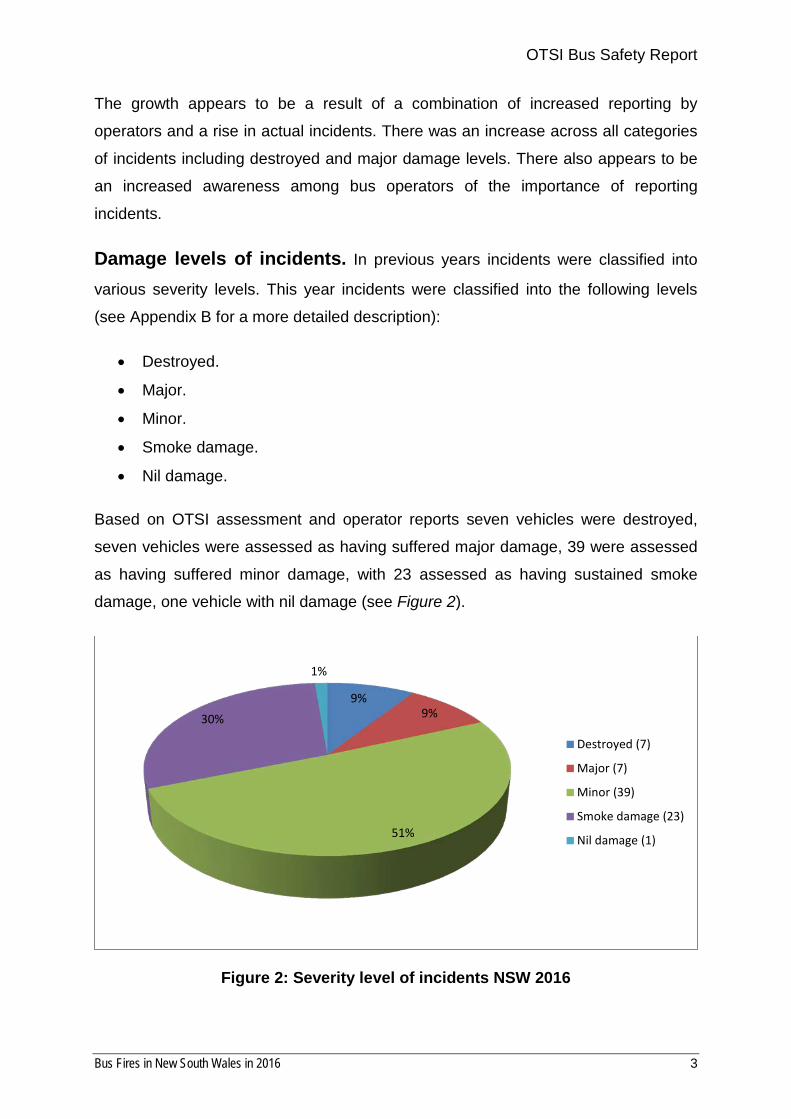
Based on OTSI assessment and operator reports seven vehicles were destroyed,
seven vehicles were assessed as having suffered major damage, 39 were assessed
as having suffered minor damage, with 23 assessed as having sustained smoke
damage, one vehicle with nil damage (see Figure 2).
Figure 2: Severity level of incidents NSW 2016
9% 9%
51%
30%
1%
Destroyed (7)
Major (7)
Minor (39)
Smoke damage (23)
Nil damage (1)
Bus Fires in New South Wales in 2016 3
OTSI Bus Safety Report
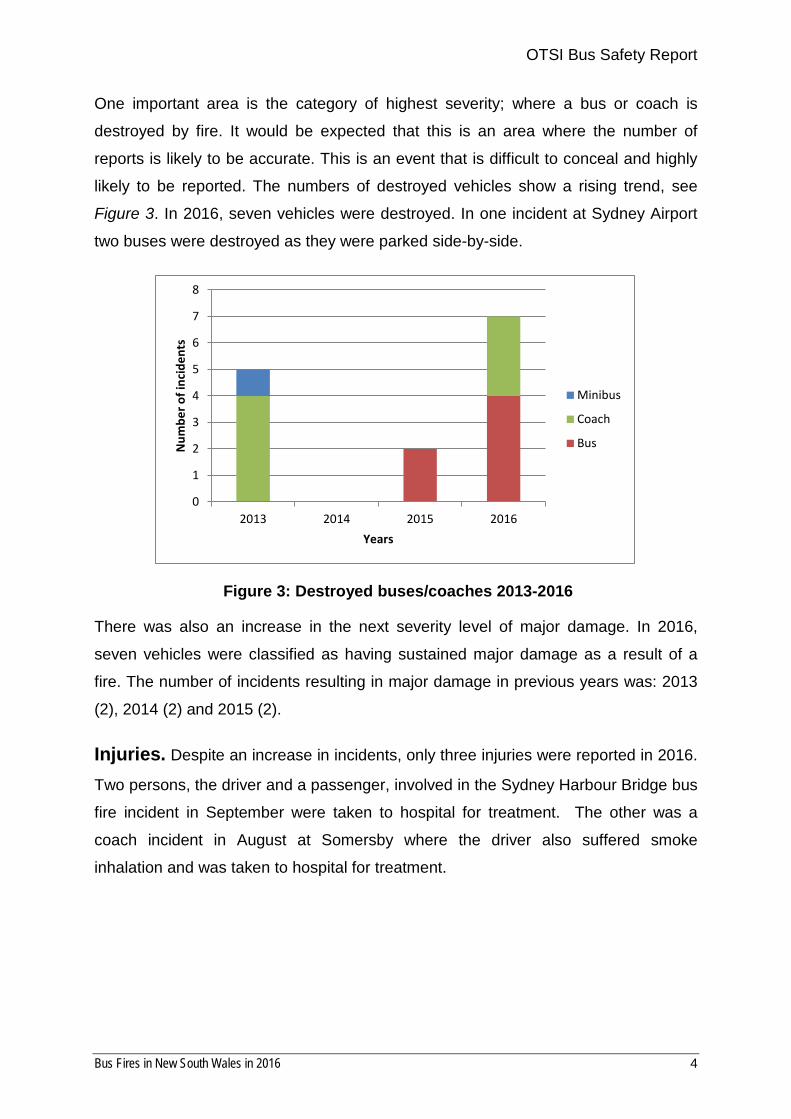
One important area is the category of highest severity; where a bus or coach is
destroyed by fire. It would be expected that this is an area where the number of
reports is likely to be accurate. This is an event that is difficult to conceal and highly
likely to be reported. The numbers of destroyed vehicles show a rising trend, see
Figure 3. In 2016, seven vehicles were destroyed. In one incident at Sydney Airport
two buses were destroyed as they were parked side-by-side.
Figure 3: Destroyed buses/coaches 2013-2016
There was also an increase in the next severity level of major damage. In 2016,
seven vehicles were classified as having sustained major damage as a result of a
fire. The number of incidents resulting in major damage in previous years was: 2013
(2), 2014 (2) and 2015 (2).
Injuries. Despite an increase in incidents, only three injuries were reported in 2016.
Two persons, the driver and a passenger, involved in the Sydney Harbour Bridge bus
fire incident in September were taken to hospital for treatment. The other was a
coach incident in August at Somersby where the driver also suffered smoke
inhalation and was taken to hospital for treatment.
0
1
2
3
4
5
6
7
8
2013 2014 2015 2016
Num
ber o
f inc
iden
ts
Years
Minibus
Coach
Bus
Bus Fires in New South Wales in 2016 4

OTSI Bus Safety Report
Approximately 6684 passengers had their travel affected by the incidents. The largest
number involved in a single incident was approximately 90 passengers. There was a
significant disruption to the transport network as a result of some of these incidents.
On 44% of occasions the vehicle involved in the incident was empty of passengers.
On one occasion a bus was destroyed with no driver or passengers on board.
Age of vehicles. The ages of the vehicles involved ranged between 2 and 31
years. The majority of incidents involved buses between 5 and 10 years old, this
correlated approximately to the number of buses manufactured in each year
operating in NSW (see Figure 4). Seven different makes of vehicle were involved. No
make or model trends were identified.
Figure 4: Year of manufacture and incidents NSW 2016
4 The number is approximate as some of the operators were only able to provide estimates of passenger numbers.
0
100
200
300
400
500
600
0
2
4
6
8
10
12
14
1985 1987 1989 1991 1993 1995 1997 1999 2001 2003 2005 2007 2009 2011 2013 2015
Num
ber o
f inc
iden
ts
Year of manufacture
Bus Fires in New South Wales in 2016 5

OTSI Bus Safety Report
The seven destroyed vehicles ranged in year of manufacture from 1995 to 2004. The
seven vehicles that sustained major damage ranged in year of manufacture from
1993 to 2011. The average age for buses in the destroyed and major damage
category was 16.4 years. The average age for buses in the all categories in 2016
was 9.7 years. This shows that older buses sustained a great level of damage than
newer buses in 2016.
The severity level and the average age of buses involved in incidents in 2016 is
shown in Figure 5.
Figure 5: Severity level and average age of vehicles
0
5
10
15
20
25
Destroyed Major Minor Smoke All categories
Age
in y
ears
Severity level
Bus Fires in New South Wales in 2016 6

OTSI Bus Safety Report
Origins and Causes Overall origin. In 2016, the majority of incidents originated in the engine bay (45%),
the wheel well had 43% and the body 10%. One fire originated outside the bus,
caused by radiant heat from another burning bus. The following figure shows the
originating area of the 77 incidents in 2016 (see Figure 6).
Figure 6: Location by origin NSW 2016
Overall causation. The data for the causes of incidents in 2016 are shown in Figure
7.
Figure 7: Causes of incidents NSW 2016
45%
43%
10%
1%
Engine Bay (35)
Wheel Well (33)
Body (8)
Other (1)
38%
23%
18%
16%
3% 1% 1%
Brakes (29)
Electrical (18)
Fluid (14)
Mechanical (12)
Tyre (2)
Other (1)
Unknown (1)
Bus Fires in New South Wales in 2016 7

OTSI Bus Safety Report
Brake-related incidents have increased markedly over the four years from 6 (23%) in
2013, 10 (34%) in 2014, 17 (42%) in 2015 and 29 (38%) in 2016. In part the increase
may be attributable to increased reporting of brake-related thermal incidents which
were often not reported in the past as they did not involve an actual fire. More bus
operators are now reporting these incidents. The maintenance and adjustment of
brakes are a continuing concern.
Though the number of electrical incidents has varied over time, the percentage has
not varied significantly. The results were 4 (27%) in 2013, 6 (21%) in 2014, 11 (28%)
in 2015, and 18 (23%) in 2016. The majority of the incidents were caused by short
circuits, which highlights the need for extra vigilance in checking the condition and
securing of electrical wiring.
There was a large increase in the number of incidents attributed to fluid leaks from
the previous year. The results were 11 (39%) in 2013, 10 (34%) in 2014, 3 (7%) in
2015, and 14 (18%) in 2016.
The reasons for the fluid leaks were diverse, a sample are listed below:
• A small crack developed in the power steering hydraulic hose.
• An electrical loom rubbed through a fuel line.
• An oil leak developed in the air conditioning pump.
• A faulty seal allowed brake fluid to leak onto the wheel.
The number of incidents attributable to mechanical failures was a similar percentage
to the previous year. The results were 1 (4%) in 2013, 2 (7%) in 2014, 7 (18%) in
2015, and 12 (16%) in 2016.
The reasons were diverse:
• An alternator bearing collapsed (two occasions).
• An engine injector failed.
• A fan belt failed, and the old engine belt was left in the engine.
• An exhaust pipe leaked.
• An air conditioning compressor seized.
Bus Fires in New South Wales in 2016 8

OTSI Bus Safety Report
Number of Engine Bay incidents. 35 incidents (45%) originated in the engine bay.
This is a large increase from previous years. In 2013, the 16 engine bay incidents
represented 59% of the total number of incidents. In 2014, the 14 engine bay
incidents represented 48% of the total. In 2015, the 16 engine bay incidents
represented 40% of the total (see Figure 8).
Figure 8: Number of engine bay incidents 2013-16
The cause of the engine bay incidents in 2016 was fairly evenly split between fluid
(37%), mechanical (34%) and electrical causes (26%) (see Figure 9). An example of
fluid causation was the November M2 Motorway bus fire at Cheltenham. In this fire it
was found that a hydraulic power steering pipe had a fatigue crack which caused
hydraulic fluid to be sprayed over the engine which then ignited. An example of
mechanical causation was in December at Manly where an air conditioning
compressor failed.
0
5
10
15
20
25
30
35
40
2013 2014 2015 2016
Num
ber o
f inc
iden
ts
Year
Origin - Engine bay
Bus Fires in New South Wales in 2016 9

OTSI Bus Safety Report
Figure 9: Cause of engine bay incidents 2016
Number of wheel well incidents. In 2016, 33 (43%) incidents were located around
the wheel well; most of these incidents were a result of poorly adjusted or faulty
brakes. It should be noted that the majority of these incidents (62%) resulted in
smoke damage only. OTSI believes that it is likely the increasing trend of wheel well
thermal incidents is due mainly to an increase in reporting. However, these precursor
incidents should not be ignored as one wheel well fire destroyed a coach at Appin in
June 2016.
In 2013, there were 6 wheel well incidents (22% of the total number of incidents in
2013), in 2014 there were 11 (38%) and, in 2015, there were 17 (43%) (see Figure
10).
Figure 10: Number of wheel well incidents 2013-16
37%
34%
26%
3%
Fluid (13)
Mechanical (12)
Electrical (9)
Unknown (1)
0
5
10
15
20
25
30
35
2013 2014 2015 2016
Num
ber o
f inc
iden
ts
Year
Origin- Wheel well
Bus Fires in New South Wales in 2016 10
OTSI Bus Safety Report
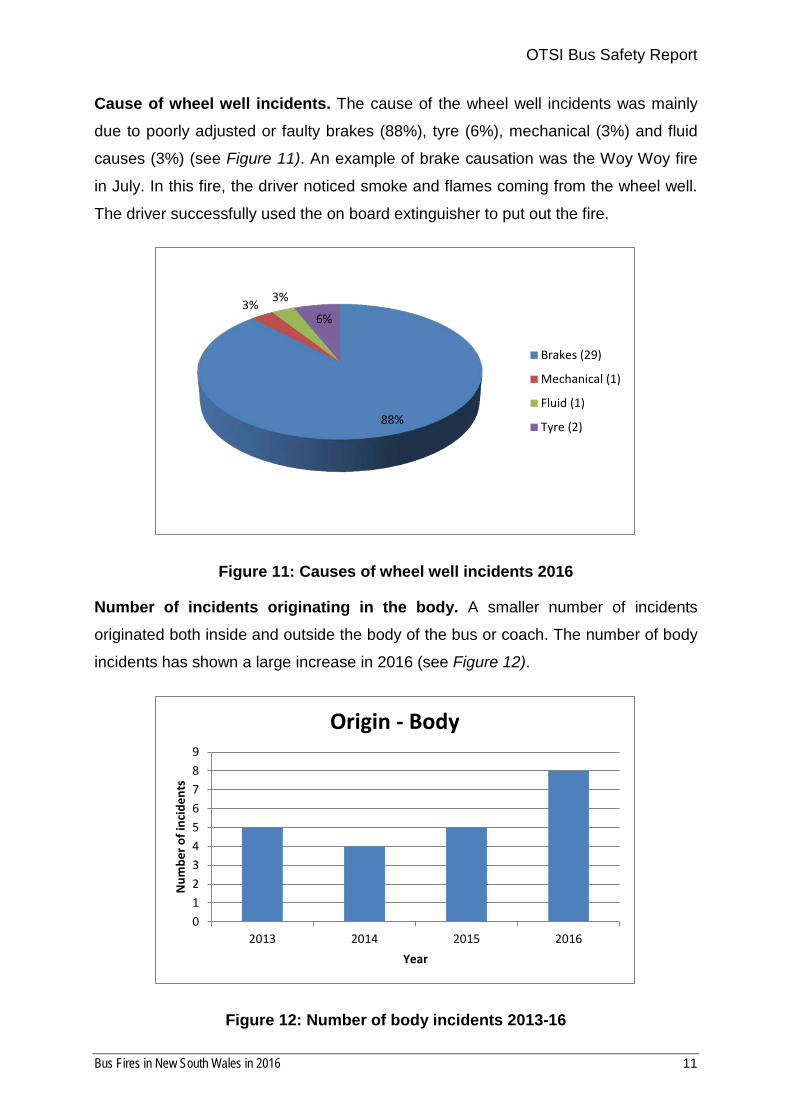
Cause of wheel well incidents. The cause of the wheel well incidents was mainly
due to poorly adjusted or faulty brakes (88%), tyre (6%), mechanical (3%) and fluid
causes (3%) (see Figure 11). An example of brake causation was the Woy Woy fire
in July. In this fire, the driver noticed smoke and flames coming from the wheel well.
The driver successfully used the on board extinguisher to put out the fire.
Figure 11: Causes of wheel well incidents 2016
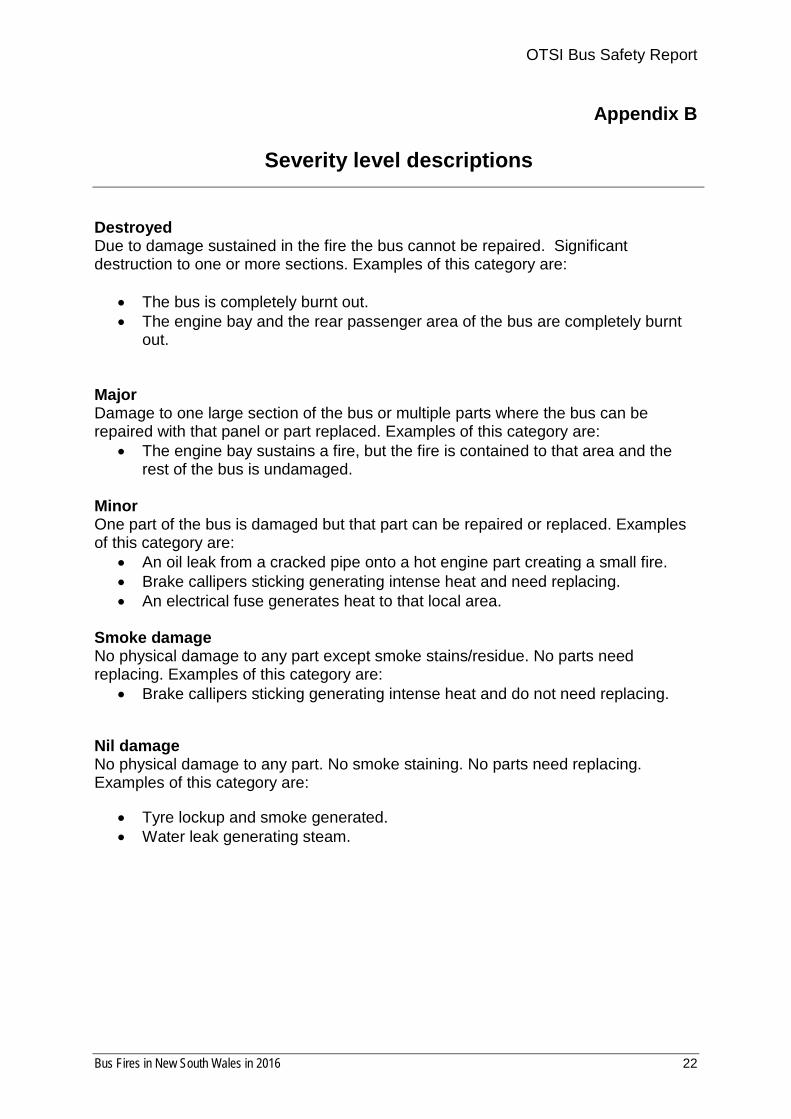
Number of incidents originating in the body. A smaller number of incidents
originated both inside and outside the body of the bus or coach. The number of body
incidents has shown a large increase in 2016 (see Figure 12).
Figure 12: Number of body incidents 2013-16
88%
3% 3%
6%
Brakes (29)
Mechanical (1)
Fluid (1)
Tyre (2)
0123456789
2013 2014 2015 2016
Num
ber o
f inc
iden
ts
Year
Origin - Body
Bus Fires in New South Wales in 2016 11

OTSI Bus Safety Report
Cause of body incidents. The cause of body incidents was mainly due to electrical
malfunction or failure (87%) (see Figure 13).
Figure 13: Causes of body incidents 2016
The seven electrical incidents had a wide variety of origins: battery compartment,
battery isolator switch, heater, CD player and headlight relay. Another incident
involved a fault in the exhaust stack which led to a fire in the rear roof area which
eventually destroyed the coach.
87%
13%
Electrical (7)
Other (1)
Bus Fires in New South Wales in 2016 12

OTSI Bus Safety Report
Compressed Natural Gas (CNG) incidents. The number of CNG fuelled buses that
reported incidents was up from 2015, but did not exceed the 2013 or 2014 numbers.
Figure 15: Number of CNG bus incidents 2013-16
Figure 16: Causes of CNG bus incidents 2013-16
In 2016, five of the incidents were CNG fuelled buses, four sustained minor damage
and one major damage. One was electrical in nature and the other four were
associated with leaking liquids in the engine bay (see Figure 17).
0
1
2
3
4
5
6
7
8
2013 2014 2015 2016
Num
ber o
f inc
iden
ts
Year
CNG bus incidents
84%
11% 5%
Fluid (16)
Electrical (2)
Brakes (1)
Bus Fires in New South Wales in 2016 13

OTSI Bus Safety Report
Description of CNG bus incidents Damage level5
‘Oil leaking from tappet cover.’ Minor
‘Heat damage to small wiring harness.’ Minor ‘Oil leak from air compressor feed line onto manifold.’ Minor
‘Oil leak from air compressor onto upper engine surface and then onto manifold.’ Minor
‘Coolant leak caused overheating and oil filter to ignite, significant damage to engine with the rear window bursting causing internal damage.’
Major
Figure 17: Description of CNG bus incidents NSW 2016
Detection of Fire
The data for the detection of incidents in 2016 are shown (see Figure 18).
Figure 18: Detection of incidents 2016
In 2016 bus drivers were the first to either see or smell smoke or see flames on 77%
of occasions. This was an increase from 2015 where the driver detected the incident
5 For description of damage level classifications see Appendix B.
70%
8%
7% 7%
5%
1% 1% 1%
Driver saw smoke (54) Passenger told driver (6)
Alarm on dashboard (5) Passing motorist informed driver (5)
Driver smelled smoke (4) Driver heard tyre fail (1)
Driver saw fire (1) No driver, empty bus (1)
Bus Fires in New South Wales in 2016 14

OTSI Bus Safety Report
on 58% of occasions. On one occasion the driver heard the sound of the tyre
rupturing which alerted him to a problem.
Only on five occasions was the driver alerted by a dashboard alarm. During the
Sydney Harbour Bridge bus fire in September the dash alarm activated only after the
driver had stopped the bus and was evacuating the passengers.
Passengers were the first to detect smoke on six occasions while external parties
raised the alarm on the remaining five occasions.
Fire Fighting
Portable fire extinguishers were used on 31 (40%) occasions. The use of portable
extinguishers was successful on 23 of those occasions, a success rate of 74%. This
highlights the importance of the role of fire extinguishers in limiting damage.
An extinguisher was unsuccessful in defeating the fire on six occasions. On the
wheel well fire at Appin in June, where the coach was destroyed, the driver stated
that the fire extinguisher was used but was extremely ineffective. In August at
Somersby, two fire extinguishers were used in an attempt to extinguish the fire, four
times the fire seemed to be extinguished; the fire kept igniting and eventually
destroyed the bus.
In one case at Haymarket, the driver discharged the fire extinguisher prematurely
with the hose still attached to the clip in the holder. The driver was attempting to fight
an engine bay fire which eventually caused major damage to the bus.
On five of occasions the smoke or flames ceased when the vehicle was stopped and
the ignition or battery power was switched off. There were two confirmed occasions
where the battery power was not switched off and it is likely the fire continued due to
the power not being isolated. One of these buses was completely destroyed while the
other sustained major damage.
In 2016, NSW Fire and Rescue was called upon to attend on 27 (35%) occasions.
This is an increase from 2015 where they attended on 11 (28%) occasions. Given
that there were occasions where the battery power was not isolated there may be
some value in increasing awareness of first responders of the stored energy in those
battery systems.
Bus Fires in New South Wales in 2016 15

OTSI Bus Safety Report
Non-reporting of fire incidents It is a legislative requirement that: ‘An operator of a bus service who becomes aware
that a bus being used to provide the service has been involved in an accident or
incident must notify the Chief Investigator of the accident or incident … if the accident
or incident involves a mechanical or electrical fire or an explosion on the bus.’6
It was found that on seven occasions OTSI were not notified of a fire incident. The
incidents were instead reported in the online Roads and Maritime Services (RMS)
bus incident management database. It is important that the legislative requirement is
met by all operators in order to gather a complete record of incidents for analysis.
Progress on Implementing Recommendations Based on advice from Transport for NSW (TfNSW), the RMS and the State Transit
Authority (STA), the status of actions in response to the key recommendations
contained in the 2005 - 2012 Report is as set out below.
The installation of engine bay bus fire suppression systems was commenced by STA
in 2009 where all new bus supply contracts from 2009 required the bus to be
delivered with a fire suppression system installed. In 2013 STA retrofitted their
Mercedes Benz 0500 CNG bus fleet with fire suppression systems and in 2015
commenced their fire suppression retrofit programme of the rest of their fleet, this
project was completed in December 2016. There were 21 different STA bus models
which required modification to the specified suppression system design. STA used
in-house expertise to ensure each suppression system was tailored to the different
engine bay configuration. All STA buses are now fitted with engine bay fire
suppression systems.
Previously, the Minister for Transport and Infrastructure announced that all private
operator buses covered under the TfNSW metropolitan and outer metropolitan
private bus operators’ contract will also be retro-fitted with engine bay bus fire
suppression systems.7 This project is expected to be completed by September 2017.
All future buses supplied under the Bus Procurement Panel will be delivered with
engine bay bus fire suppression systems.
6 NSW Passenger Transport Regulation 2007 clause 88. 7 A Constance (Minister for Transport and Infrastructure), Safety Boost for Bus Customers, media
release, Sydney, 6 August 2015.
Bus Fires in New South Wales in 2016 16

OTSI Bus Safety Report
The installation project is applying international standards for designing, testing and
installation of automatic fire suppression systems to ensure consistency of the
solution.8
No bus with an engine bay fire suppression system fitted was destroyed in 2016 in
NSW. OTSI will monitor the effectiveness of the engine bay bus fire suppression
systems in the future.
RMS communicates key information to operators in various ways such as by
distributing OTSI bus safety investigation reports and issuing information alerts.
Recently RMS issued the following alerts:
• A bus driver’s pocket guide for managing critical incidents (RMS 16.627)
• A bus operator’s procedure in the event of a serious incident or accident (RMS
16.628).
Previously RMS has issued a checklist for fires on buses containing information and
advice.
Conclusions There was a 92% increase in the number of fire and thermal incidents reported to
OTSI in 2016.
There was a corresponding increase in severity of damage to vehicles, with seven
vehicles destroyed in 2016 compared to two in 2015.
Despite the large increase in incidents there were only three injuries reported. These
individuals were treated for smoke inhalation at hospital.
The majority of incidents originated in the engine bay (45%). There are a wide range
of ignition sources of bus incidents. The three main initiators were fluid leaks,
mechanical malfunction and electrical malfunction.
There is a continuing increase in the number of brake related thermal incidents. It is
likely a result of increased reporting; however, these incidents should not be ignored
as 20% of these wheel well incidents led to actual fires.
8 The P-Mark certification process developed and controlled by the RISE Research Institutes of Sweden (formerly SP Technical Research Institute of Sweden), consisting of a series of tests (SP Method 4912) to rate suppression performance and limitations of fire suppression systems installed in engine compartments of buses and coaches.
Bus Fires in New South Wales in 2016 17

OTSI Bus Safety Report
All STA buses are now fitted with engine bay fire suppression systems. Progress is
also being made to retrofit engine bay fire suppression systems to private buses
operating under the Sydney Metropolitan and Outer Metropolitan contracts. Also,
new buses purchased under these contracts will be delivered with fire suppression
systems.
No bus with an engine bay fire suppression system fitted was destroyed in 2016 in
NSW.
Bus Fires in New South Wales in 2016 18

OTSI Bus Safety Report
Appendix A
BUS INCIDENTS RECORDED IN 2016
MONTH VEHICLE TYPE YEAR LIKELY FIRE SOURCE SEVERITY ONBOARD FIRE
EQUIPMENT USED
Jan Bus 2009 Broken hydraulic hose Minor Yes*
Jan Bus 2009 Broken hydraulic hose Minor Yes
Jan Bus 2004 Electrical short - overheating of air brake condenser valve Minor Yes*
Jan Coach 1987 Engine fire unknown Destroyed Yes
Jan Bus 2008 Oil leaking from tappet cover Minor Yes
Feb Bus 2013 Alternator bearing collapsed Minor Yes
Feb Bus 2015 Failure of the starter motor caused a plastic cover on the solenoid to ignite
Minor Yes
Mar Bus 2004 Loom rubbed through fuel line Minor Yes*
Mar Bus 2006 Engine bay mechanical issue Minor Yes*
Mar Bus 2003 Alternator mechanical failure propagating into electrical fire Major Yes*
Mar Bus 2011 Oil leak from air conditioning pumped onto the engine Major No*
Apl Bus 2011 Smoke at back of bus Smoke damage No
Apl Bus 2010 Oil leak Smoke damage No*
Apl Bus 2015 Brake issue Smoke damage No
Apl Bus 2010 Rail pressure fault, causing injector to fail Minor No
Apl Bus 2003 Short circuit to alternator progressed to fire Major No*
May Bus 2011 Brakes over adjusted Smoke damage No
May Bus 2004 Front air conditioning unit electrical board failure Major No*
May Bus 1993 Starter motor terminal melted from mounting block Minor Yes*
May Bus 2010 Heat damage to small wiring harness Minor No
May Bus 2009 Electrical short in battery compartment Minor Yes
May Bus 2010 Leak found on brake service module
Smoke damage No
May Bus 2007 Old fan belt left on hot exhaust manifold Minor Yes
May Bus 2007 Brakes binding Minor Yes
May Bus 1996 Brake adjustment Smoke damage No
Bus Fires in New South Wales in 2016 19

OTSI Bus Safety Report
Jun Coach 1998 Tyre failure led to wheel well fire Destroyed Yes*
Jun Bus 2009 Brake issue Minor Yes
Jun Bus 2010 Brake issue Smoke damage No
Jun Bus 2007 Brake issue Smoke damage No
Jun Bus 2007 Brake issue Smoke damage No
Jun Bus 1997 Cracked fuel line sprayed fuel onto hot turbocharger Minor Unknown
Jun Bus 2013 Brake issue Smoke damage No
Jun Bus 2008 Battery terminal short Smoke damage No
Jul Bus 2010 An oil leak caused fire under bus
Smoke damage No
Jul Bus 2008 Flames from RNS wheel - brake issue
Smoke damage No
Jul Bus 2014 Leaking hub seal Smoke damage No
Jul Bus 2008 Brake issue Minor Yes
Jul Bus 2009 Brakes overheated due to air leak from brake booster Minor Yes
Jul Bus 2011 Brake issue Minor Yes
Jul Bus 2013 Short circuit in CD drive Minor No*
Aug Bus 2010 Air con compressor failed minor Yes*
Aug Bus 1998 Short circuit in engine bay Major Yes*
Aug Bus 2012 Brake calliper over adjusting Minor Yes
Aug Bus 2010 Coolant leak Minor No
Aug Bus 2006 Brake issue Smoke damage No
Aug Coach 1985 Exhaust stack caught fire Destroyed Yes*
Sep Bus 2009 Air conditioning condenser fan failed Minor No
Sep Bus 2011 Brake issue Smoke damage No
Sep Bus 2009 Brake issue Smoke damage No
Sep Bus 2009 Brake issue Minor No*
Sep Bus 1996 Short circuit in engine bay Destroyed No*
Sep Bus 2010 Brake issue Minor No
Sep Coach 1999 Cooling system fault Nil No
Sep Bus 2010 Brake issue Smoke damage No
Sep Bus 2011 Rear brakes bind due to pressure limiting value leak
Smoke damage No
Sep Bus 2008 Air conditioning compressor seized Minor Yes
Bus Fires in New South Wales in 2016 20

OTSI Bus Safety Report
Oct Bus 2015 Brake issue Minor Yes
Oct Bus 2009 Brake issue Minor Yes
Oct Bus 1995 Electrical short in heater on dashboard Minor No
Oct Bus 2011 Brake pad issue Smoke damage No
Oct Bus 2009 Oil leak from air compressor feed line onto manifold Minor Yes*
Oct Bus 2009 Brake issue Smoke damage No
Oct Bus 2009 Brake issue Smoke damage No
Oct Bus 2003 Gearbox electrical fault Minor Yes
Nov Bus 2001 Cracked pipe Destroyed Yes*
Nov Bus 2000 Leak from power steering return line onto exhaust Minor yes
Nov Bus 1993 Exhaust pipe leak due to cracked pipe Minor Yes*
Nov Bus 2010 Oil leak from air compressor onto upper engine surface and then onto manifold
Minor Yes
Nov Bus 1999 Electrical short in headlight relay on dashboard Minor No
Nov Bus 2007 Front tyre caught fire Minor no
Nov Bus 2010 Brake issue Minor No
Dec Bus 2010 Brake overheat Smoke damage No
Dec Bus 2004 Arcing on the battery isolator switch Destroyed No*
Dec Bus 2004 Bus parked next to bus that caught fire Destroyed No*
Dec Bus 2007 Leaking seal onto wheel Minor No
Dec Bus 1993 Electrical problem engine bay Major Yes*
Dec Bus 2005 Air conditioner compressor seized Minor No*
Dec Bus 2007
Coolant leak caused overheating and oil filter to ignite Major Yes*
* Denotes attendance by NSW Fire and Rescue.
Bus Fires in New South Wales in 2016 21
OTSI Bus Safety Report
Appendix B
Severity level descriptions Destroyed Due to damage sustained in the fire the bus cannot be repaired. Significant destruction to one or more sections. Examples of this category are:
• The bus is completely burnt out. • The engine bay and the rear passenger area of the bus are completely burnt
out. Major Damage to one large section of the bus or multiple parts where the bus can be repaired with that panel or part replaced. Examples of this category are:
• The engine bay sustains a fire, but the fire is contained to that area and the rest of the bus is undamaged.
Minor One part of the bus is damaged but that part can be repaired or replaced. Examples of this category are:
• An oil leak from a cracked pipe onto a hot engine part creating a small fire. • Brake callipers sticking generating intense heat and need replacing. • An electrical fuse generates heat to that local area.
Smoke damage No physical damage to any part except smoke stains/residue. No parts need replacing. Examples of this category are:
• Brake callipers sticking generating intense heat and do not need replacing. Nil damage No physical damage to any part. No smoke staining. No parts need replacing. Examples of this category are:
• Tyre lockup and smoke generated. • Water leak generating steam.
Bus Fires in New South Wales in 2016 22