bus travel time optimization with unequal...
TRANSCRIPT

Type: Regular 1 Hafezi and Habib
BUS TRAVEL TIME OPTIMIZATION WITH
UNEQUAL HEADWAY PATTERN Mohammad Hesam Hafezi, Department of Civil and Resource
Engineering, Dalhousie University, Halifax, NS, Canada
Muhammad Ahsanul Habib, School of Planning, and Department of
Civil and Resource Engineering, Dalhousie University, Halifax, NS,
Canada
Introduction
In urban areas, bus networks are a major part of the public
transportation system because they are easily accessible and more
affordable than other types of public transportation [1, 2]. Operating
costs and fixed costs are an important issue for Transit companies [3].
Also, travelling with minimum time and cost is significant for
passengers [4]. Studying ways of improving the performance of bus
services is important due to increasing operating costs and passenger
demand [5]. Verifying the level of cost is important for optimizing
public transportation [6]. A number of bus control strategies for
improving the efficiency and reliability of bus systems include: bus
signal priority (BSP), bus-holding, dedicated bus lanes, stop-skipping,
and deadheading.
BSP is an operational tool which facilitates and eases the movement
of buses through traffic signal controlled intersections in network by
providing priority service opportunities to buses by implementing
temporary signal timing alternation designed to reduce bus wait time
and travel time at a relatively low cost to other traffic [7, 8]. Bus-
holding can improve bus schedule reliability by decreasing
disturbances to bus motion [9, 10]. In relation to the layout of routes,
dedicated bus lanes can increase the reliability of bus service [11].
Bus stop skipping allows some buses to skip certain stops; this can
decrease passenger waiting time and increase operation speed in the
one operation cycle. On the other hand, a deadheading bus strategy
Type: Regular 2 Hafezi and Habib
can decrease operating costs by moving empty buses from an origin
depot to a pointed stop. This paper will place more emphasis on the
stop-skipping strategy. Research on optimizing bus travel time by
way of stop-skipping pattern has been accomplished by many
researchers, for example, by Fu and Yang (2002) [12], Furth (1985)
[13] Delle Site and Filippi (1998) [14], Li et al. (1991) [15] and Sun
(2005) [16]. However, in most of past studies, researchers used
homogeneous temporal distribution (equal headway) and there has
been a few studies on optimizing bus stop-skipping with un-equal
headway.
Stop-skipping has been studied by many researchers using different
assumptions and solution methodologies. Liu et al. (2013)
investigated stop-skipping with random travel time in order to
understand the variance of travel time instead of constant values. This
particular stop-skipping strategy was developed to minimize both
passenger and operating costs using a nonlinear integer programming
program. The study found that by using random travel time, the
optimal value is better than assuming the constant value [17]. In
addition, travel time between any two successive bus stop is mostly
determined by the corresponding road traffic conditions [18]. Sun et
al. (2008) proposed dividing paths among bus stops to reduce the
inadequacy of the bus schedule. Further, they tested three different
stop skipping patterns including: normal scheduling (stop in all
stations), zone scheduling (stop only in end of zone node), and
express scheduling (stop in first, middle and end node of bus route).
They examined different frequencies with assuming equal bus
headway for these three types of scheduling. They found that higher
traffic volumes cause decreased frequency, increased headway, and
reduced travel cost [3]. Li et al. (1991) investigated the real-time
scheduling problem for stop-skipping strategy by formulating a
binary stochastic programming model. Within their study, they
considered both schedule unconventionality and unsatisfied passenger
demand [19]. Fu et al. (2003) also studied the stop skipping problem.
In their approach, the stop skipping problem was simplified and they
provided a minimum level of service for passengers waiting at
skipped stations with considering equal bus headway. They found that
if one bus skipped stations, the next following bus should have
Type: Regular 3 Hafezi and Habib
layover on that skipped stations for avoiding of increasing of
passengers cost [20].
Literature gaps of the previous studies are as follows: Firstly, delay
time penalty value is not considered in the optimization model
formulation. Secondly, bus headway planning is considered with
equal intervals in which the arrival rate patterns are not measured in
the planning. Thirdly, certain stops in bus stop-skipping scheme are
rationally assumed to be a random point or zonal stop pattern. In
truth, demand pattern, arrival rate and bus headway have influences
in stops selection [21, 22]. Nevertheless, these assumptions have a
tremendous impact on bus operation performance and subsequently
on delay time and running time in point of passenger’s view and the
fleet size in point of bus authorities view. However to obtain the best
formulation for bus stop-skipping models these assumptions should
be considered, which are taken into account in this paper.
The contribution of this study is to cover the literature gaps to
selection of certain stops and bus headway pattern in bus stop-
skipping scheme. For this reason, passengers waiting time at the
station and bus headway were balanced according to the arrival rate
pattern and O-D matrix. Ultimately, fleet size will be considered as a
fixed value. The first two considerations are proposed to discover the
passengers cost and the last one is embraced to realize the total
operating cost of the bus authority. Bus stop-skipping scheme should
be considered in both of bus passenger and authority satisfaction.
Thus, after the formulation of the above addressed the problem, an
optimization model is proposed with the objective of minimizing the
weighted sum of total in-station passenger delay, in-bus passenger
delay and fleet size. The bus stop-skipping decision along with the
bus route is reflected by a binary variable (0, 1). Thus, the proposed
optimization model is a nonlinear integer programming.
The objective function presented in this paper is NP-hard (non-
deterministic polynomial-time hard) and solutions out there to two
powers of 𝑛 which is the total number of bus bays. Therefore, it is
problematical to find a precise method to solve this model. Hence, a
genetic algorithm is suitable tools to solve the NP-hard optimization
problem [17, 23]. Genetic algorithms (GAs) have some superiority

Type: Regular 4 Hafezi and Habib
for minimization of highly bumpy cost functions in comparing with
other optimization tools such as: as long as no needed to have
information that is based on other sources during the processing, GA
performs well in combination with non-differentiable cost functions
[24]. Furthermore, GA is randomized search methods, thus it has a
better chance to explore the intact design space and reach the global
optimum [25]. The population which is number of stop-skipping
updated by mutation (criteria stop selection), crossover (random
number of binary variables) and stop test (predetermined generation
size).
Proposed optimization model
Problem description and assumption
This study focuses on bus stop-skipping optimization in a certain
stop-skipping, which examines the stop-skipping effect to minimize
the objective function. First, the following assumptions are given: (a)
to involve the arrival rate and passenger demand on the service
pattern, bus headway is planned with un-equal interval. (b) Chosen
certain stops in bus stop-skipping scheme is considered by the
interaction of origin-destination matrix pattern and recommended bus
stop spacing. (c) Buses capacity is considered as criteria in stop
selection in bus stop-skipping. In other words, it is assumed that all
passengers on each bus stop able to boarding to the bus. This
assumption, however, has increased the challenge of figuring out bus
stop-skipping optimization. The Schematic of frequency and headway
of bus operation are shown in Figure 1.

Type: Regular 5 Hafezi and Habib
Figure 1 The schematic of frequency and headway of bus
operation Symbol definition
Considering a robustly connected bus network, the target bus line,
denoted by 𝑚, is operating between bus stops, denoted by 𝑛, on this
network. For the sake of presentation in the study, the key variables
are defined as follows:
i Bus line l number i = 1,2, . . . , m
j Bus stop of bus line i, j = 1,2, … , n, n + 1
Pi,jl The number of passengers waiting on bus line l number i at stop j
Pi−1,jl Total number of passengers remaining from a bus line l number
i − 1 at bus stop j and waiting for bus number i ωi,j Stop-skipping decision which is a binary variable “0-1”, ωi,j =
{1; when bus line l number i stops at station j
0; otherwise
DTi,jz Departure time bus number i at bus stop j in the operation cycle
z DWi,j Dwell time bus number i at bus stop j
Hi,j bus headway number i at station j where
Bi,j The number of passengers boarding bus number i at stop j
Bi,j∗ The number of boarding passengers remaining from bus number
i − 1 at bus j Ai,j The number of passenger alighting bus number i at stop j

Type: Regular 6 Hafezi and Habib
Ai,j∗ The number of alighting passengers remaining from bus number
i − 1 at bus j Ti,j Travel time between two successive station i and i − 1
RTi,j Runing time between two successive station i and i − 1
α Coefficient time for the average boarding one passenger
β Coefficient time for the average alighting one passenger
c Number of bus channels i Dj Distance between bus stop 1 to j
Vi,j Bus travel speeds i
σj Variance of running time bus line i, σj = m. RTi,j, m is the
coefficient of variance
ρi,j Deceleration time
τi,j Acceleration time
ATi,jP Planning arrival time of bus line i at stop j
ATi,jz Actual arrival time of bus line i at stop j in the operation cycle z
Di,j Delay time bus number i at station j
Ri Recovery time bus number i at the depot where 0 ≤ Ri < Rmax
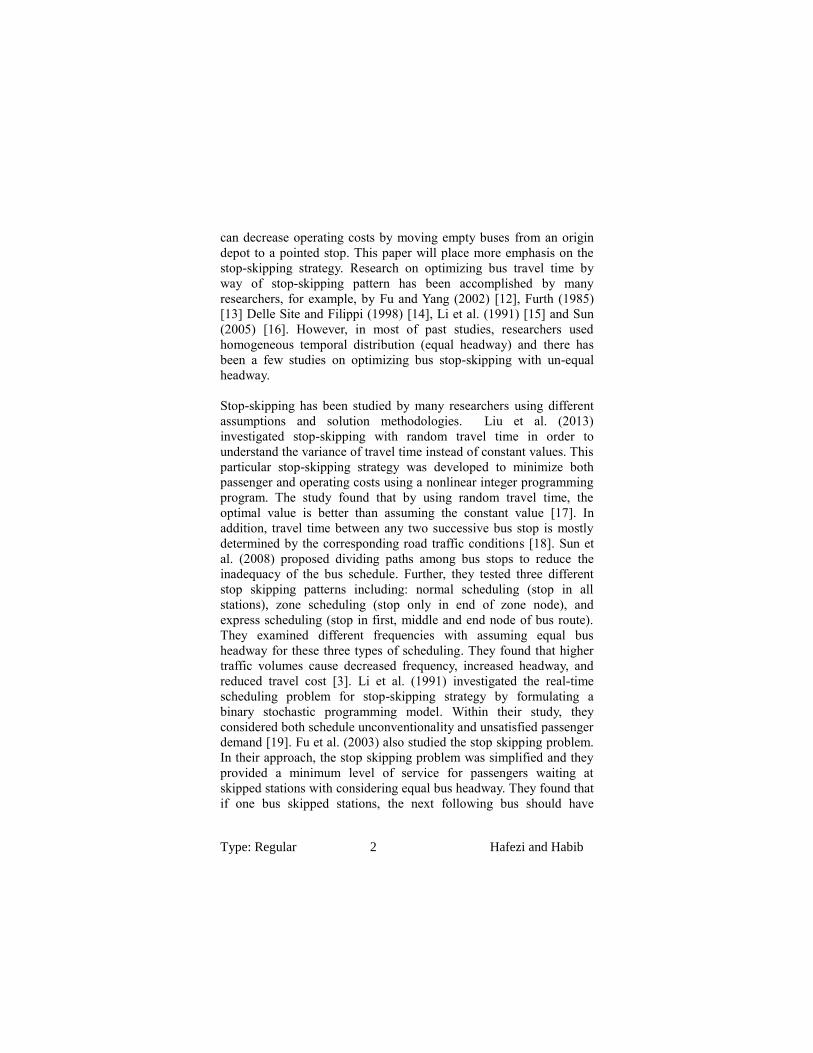
Arrival time formulation
The arrival time of bus line l number i at stop j, ATi,jl , is equal by the
total sum of departure time bus number i at station i − 1, DTi,j, plus
by the dwell time bus number i at station j − 1, DWi,j, plus by travel
time between two successive station i and i − 1, Ti,j, plus by
coefficient parameters for running time variance, σj, deceleration, ρi,j,
and acceleration, τi,j. The stop-skipping decision is defined by as a
binary variable in the arrival time formula, ωi,j, and if bus have a stop
at station i the value of ωi,j is equal by 1 and ωi,j is equal by 0
otherwise. ATi,jl is given by:
Type: Regular 7 Hafezi and Habib
, = ∑ ∑( , −1
1
1
+ 𝑚 { . , −1 + −1, −1∗ . , −1 ⁄
+ . [ , −1 + −1, −1∗ . . )] } +
, ⁄ +
+ , + , + , −1 . , )
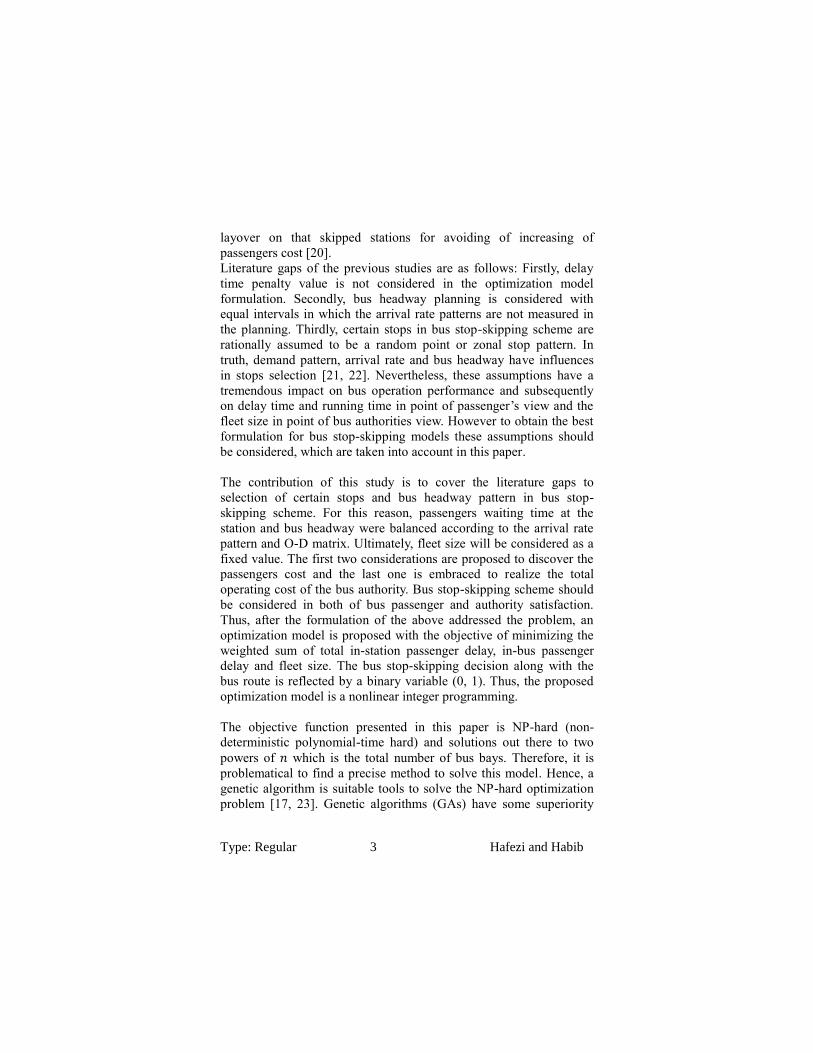
Minimizing the total in-station passenger delay time (𝐟𝟏)
In the situation where binary variable ωi,j of bus number i at station j
is equal by 0, passenger remaining from bus number i should be
waiting for the next arrival bus number i + 1 which in this case their
average waiting time will be equal by three half bus headway, Hi,j,
(1 2⁄ bus headway number i and 1 bus headway number i + 1). In the
meantime, the new arrival passengers will be added to the passenger
remaining from bus number i which their average waiting time is
equal by half bus headway i + 1. Bus headway number i at station j is
equal by the gap between the departure time bus number i at station
j − 1 and arrival time bus number i at station j. A passenger waiting
time is impressed by bus headway and bus delay time. With
minimized bus headway times and delay time, passenger waiting time
at the station subsequently decreases. Delay time bus number 𝑖 at
station 𝑗, , is equal by the difference between actual arrival time
and planning arrival time. , will be considered as a delay time
penalty value in the bus stop-skipping formulation. , is given by:
, = , − , 𝑃
The total in-station passenger delay time included both new arrival,
, , and passengers remaining from bus number 𝑖 − 1, −1, ∗ , can be
expressed as:
Type: Regular 8 Hafezi and Habib
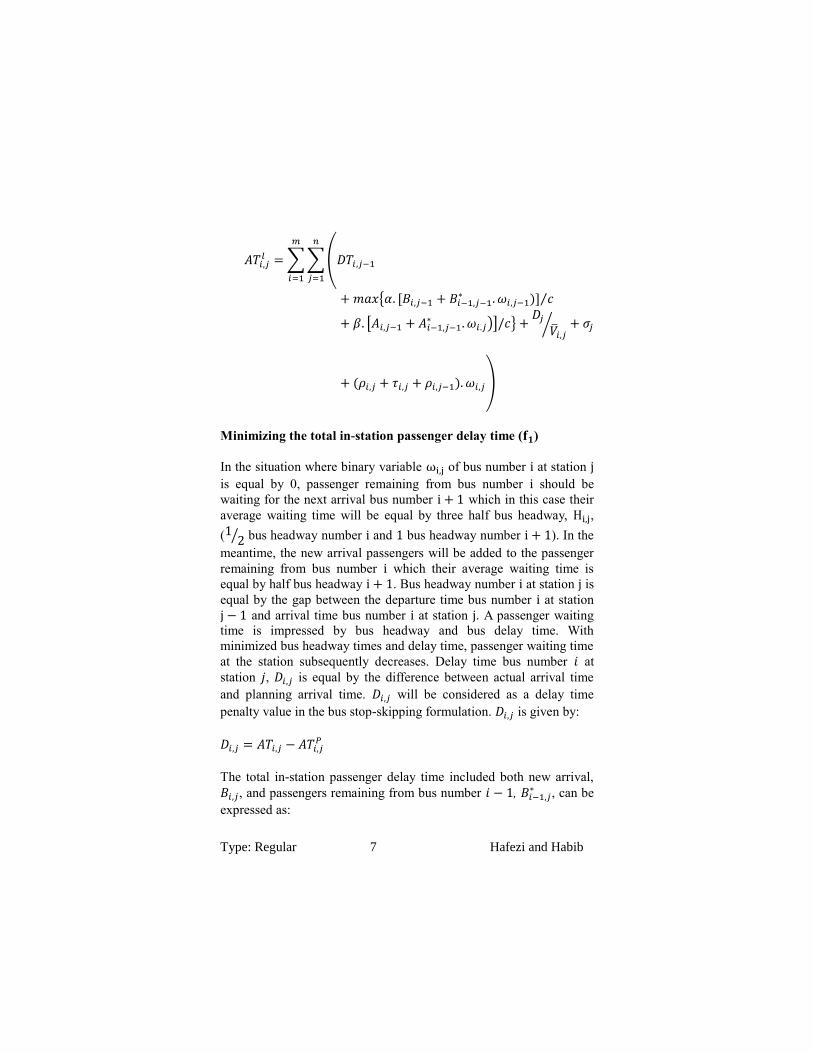
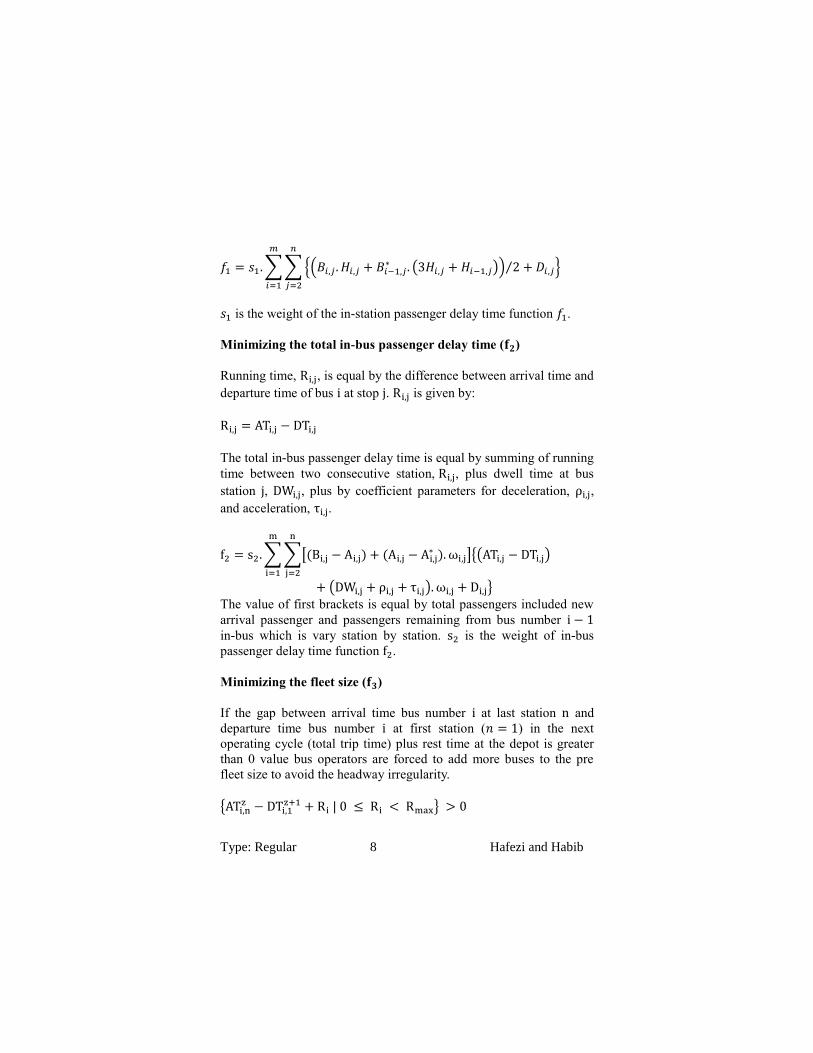
𝑓1 = 𝑠1.∑∑{( , . 𝐻 , + −1, ∗ . (3𝐻 , + 𝐻 −1, )) 2⁄ + , }
2
1
𝑠1 is the weight of the in-station passenger delay time function 𝑓1.
Minimizing the total in-bus passenger delay time (𝐟𝟐)
Running time, Ri,j, is equal by the difference between arrival time and
departure time of bus i at stop j. Ri,j is given by:
Ri,j = ATi,j − DTi,j
The total in-bus passenger delay time is equal by summing of running
time between two consecutive station, Ri,j, plus dwell time at bus
station j, DWi,j, plus by coefficient parameters for deceleration, ρi,j,
and acceleration, τi,j.
f2 = s2.∑∑[ Bi,j − Ai,j + Ai,j − Ai,j∗ . ωi,j]{(ATi,j − DTi,j)
n
j 2
m
i 1
+ (DWi,j + ρi,j + τi,j). ωi,j + Di,j}
The value of first brackets is equal by total passengers included new
arrival passenger and passengers remaining from bus number i − 1
in-bus which is vary station by station. s2 is the weight of in-bus
passenger delay time function f2.
Minimizing the fleet size (𝐟𝟑)
If the gap between arrival time bus number i at last station n and
departure time bus number i at first station (𝑛 = 1) in the next
operating cycle (total trip time) plus rest time at the depot is greater
than 0 value bus operators are forced to add more buses to the pre
fleet size to avoid the headway irregularity.
{ATi,nz − DTi,1
z+1 + Ri | 0 ≤ Ri < Rmax} > 0

Type: Regular 9 Hafezi and Habib
The total trip time of bus number i is given by:
f3 = s3.∑∑{(ATi,j − DTi,j) + (DWi,j + ρi,j + τi,j). ωi,j + Di,j
n
j 2
m
i 1
− DTi,1z+1 + Ri}
s3 is the weight of the fleet size function f3.
Objective function
The objective function consists of the three objectives that are
covered in this paper including minimizing the total in-station
passenger delay, f1, minimizing the total in-bus passenger delay, f2,
and minimizing of the fleet size, f3.
min Z = f1 + f2 + f3
min Z s1.∑ ∑{(Bi,j. Hi,j + Bi−1,j∗ . (3Hi,j + Hi−1,j)) 2⁄ + Di,j}
n
j 2
m
i 1
+ s2.∑∑[ Bi,j − Ai,j + Ai,j
n
j 2
m
i 1
− Ai,j∗ . ωi,j]{(ATi,j − DTi,j)
+ (DWi,j + ρi,j + τi,j). ωi,j + Di,j}
+ s3.∑ ∑{(ATi,j − DTi,j)
n
j 2
m
i 1
+ (DWi,j + ρi,j + τi,j). ωi,j + Di,j − DTi,1z+1 + Ri}
Constraints
The constraints for objective function are as follows: first, last, and
transfer stations are not allowed to be skipped. Bus headways for both
stop-skipping planed and non-stop skipping planed always should be
between the maximum and minimum planed value to avoid the

Type: Regular 10 Hafezi and Habib
bunching and overtaking occurrence (Hmin ≤ Hi,j ≤ Hmax). The last
bus arrival at last station plus recovery time is defined to the
departure time in the first station on the new bus motion. The
headway of first vehicle is equal by 0. Stop or non-stop need consider
the factors including passenger OD pattern, arrival rate, and the land
use comprehensively.
Genetic algorithm based solutions
The minimization models including three objective functions are non-
deterministic polynomial optimization problem and complicated to be
solved by any faithful algorithm. The number of stop-skipping
patterns is equal by 2n which is very large amount for a check-up.
Thus, a genetic algorithm was used to solve the optimization problem
[23]. Genetic algorithms, which have been originally introduced by
John Holland (1975) is a gradient-free, stochastic-based optimization
method that uses the idea of survival of the fittest and natural
selection. The genetic algorithm concept is based on genetic
evolution, where the fittest model has an upper probability of survival
and reproduction, while lower-fitness values have lesser probabilities.
The genetic algorithm based optimization solution was built with a
MATLAB 2012a.
Parameter choice and initialization
Stage 1: (coding) determines coding and code length steps are the
main point in the model solution structure. The bus headway interval
will be used to length coding part which maximum headway (Hmax)
is upper bound and minimum headway (Hmin) is lower bound. To
encode the bus stop-skipping pattern, the length of the stop-skipping
pattern is the number of stops skipped where 00 is represented as
non-stop skipped pattern, 01 and 10 are represented the stop-skipping
based on passenger volume and recommended bus stop spacing,
respectively. Furthermore, passengers remaining at the bus stop and
arrival rate should be coded which they will be used to detect the
fitness value.

Type: Regular 11 Hafezi and Habib
Stage 2: (initial population) the initial population size will be
determined by N chromosomes. Next step is to use phony random
numbers as the primary resolution among N population.
Stage 3: (parameter choice) defines the crossing and mutation rate.
The number of generations will be defined by ki. According to Refs.
[25, 26] and other relevant parameters of genetic algorithm, the value
of crossover rate is 0.8 and the mutation rate is 0.005. The population
and generation size of the GA are set to be 100 and 60 respectively.
Fitness value: The objective function presented in this paper is
combined from three values (passenger costs and operation cost)
which aims are to minimize these values. s1, s2 and s3 are the
coefficients of the objective function. L value is defined by the syntax
of coefficients which is large enough constant. The fitness function is
equal by product of L by objective function.
Genetic operator
Stage 1: (selection) selection is to determine which individuals enter
the next generation, for which roulette gambling law is chosen [23].
Stage 2: (crossover) in this stage the new chromosome will be
generated by composition of two produced chromosome. Crossover
probability is selected as a big number in the range of [0, 1]. To
generate two new chromosomes, this value in the next generation ki
should be replaced by an integer number between 1 and N.
Stage 3: (mutation) mutation rate is a smaller number in the range of
[0, 1]. In the case of chromosome’s random number was bigger than
mutation rate the value of gen should be change from 0 to 1, vice
versa.
Stopping criteria: The substitution of poor quality solutions with
new solutions is based on some fixed strategies. kmax will be defined
as termination criterion. If k > kmax, operation cycle are stopped and
prints the optimal value (best chromosome of the last generation).
Repeating: If k < kmax, then k = k + 1 and evaluation, optimization
and replacement of solutions are repeated until the termination
criterion is met.
Application to a real case

Type: Regular 12 Hafezi and Habib
To apply the genetic evolutionary model to a real case study
optimization problem encoding the potential solutions and defining
the objective function to be optimized must be addressed. A case
study based on an actual public bus operation in Halifax, Canada
(Figure 2) is used to demonstrate the usefulness of stop-skipping
scheme in an optimization bus travel time.
Figure 2 Case study
The total number of passenger transfers with this line is 4,482 per
day. The bus line to be studied in this paper is about 26,851 km from
northeast to south where the transfer of passengers from suburban
areas in the city centre takes place. It has 85 bus stops where the
origin and destination line terminals are used for parking buses and
crews’ rest breaks, and for boarding and alighting passengers. Each
bus has 31 seats and the total capacity is 49 people. The studied
period is 1 hour during the rush traffic period in the morning. The
acceleration and deceleration time is 10 s. Passengers volume is
shown in Figure 3. Passenger waiting endurance time is considered as
30 min. Delay time penalty value is considered as 10 min. Coefficient
of travel time is set as 0.15. The Un-equal headway pattern is
tabulated in Table 1 which it is provided according to volume
passenger pattern and actual average arrival rate.

Type: Regular 13 Hafezi and Habib
Table 1 Un-equal headway pattern Headway
(min) Frequency Service
5 12 5 7 6 5.5 4 3.5 4 6 6 6 5 5
6 10 6 8 6 4 6 4 6 5 7 8
7 9 10 4 7 4 5 4 8 8 10
8 8 10 8 7.5 6.5 5.5 8 6.5 8
9 7 10 8 6.5 6.5 9 11 11
10 6 12 8 8 12 8 12
13 5 15 10 8 12 15
15 4 20 10 10 20
21 3 15 30 15
30 2 30 30
Figure 3 Passengers volume at different bus stops
Result analysis
The genetic algorithm parameters, passenger volume and objective
function are coded in MATLAB R2012a and the tests were performed
on a personal computer with Inter(R) Core(TM) i5-2400 CPU @3.10
GHz, and 8.00 G RAM in the environment of Microsoft Windows 7
professional. Calculation results of the numerical example are shown
in Table 2. In Table 2, 00 corresponds to bus service with non-stop
skipping pattern, 01 and 10 corresponds to bus service with stops
skipping pattern according to passenger volume and recommended
stop spacing analysis.
Table 2 Different service pattern along with different bus headway

Type: Regular 14 Hafezi and Habib
Hea
dw
ay (
min
)
Fre
qu
ency
Ser
vic
e p
att
ern
Ob
ject
ive
valu
es
Savin
g c
ost
(%
)
5 12 01 01 10 00 10 00 01 01 10 01 10 00 35560 16.89%
00 00 00 00 00 00 00 00 00 00 00 00 42785
6 10 00 10 01 01 01 10 00 00 10 10 38910 14.81%
00 00 00 00 00 00 00 00 00 00 45673
7 9 10 10 10 00 00 01 01 00 10 41820 16.24%
00 00 00 00 00 00 00 00 00 49930
8 8 00 10 01 00 10 01 00 10 46235 4.71%
00 00 00 00 00 00 00 00 48520
9 7 10 10 00 01 01 10 00 48108 21.83%
00 00 00 00 00 00 00 61543
10 6 01 00 10 10 00 01 51098 29.95%
00 00 00 00 00 00 72940
13 5 10 00 01 10 00 55870 19.88%
00 00 00 00 00 69732
15 4 00 10 00 01 56934 7.02%
00 00 00 00 61233
21 3 00 10 00 59543 6.36%
00 00 00 63589
30 2 00 01 61043 4.53%
00 00 63941
From the result, it shows that the minimal and the maximal value of
optimized objective function are 61043 and 51098, respectively.
Compared with non-stop skipping pattern (72940 and 63941), the
total cost is reduced by 29.95% and 4.53%, respectively which this
proves that optimization is very considerable and significant. The
service patterns presented in this paper are reasonable to save system
cost deeply. Furthermore, increased headway results in a greater
optimized objective function. Therefore, with increased bus
frequency, passenger waiting time at the bus stop and whole system
costs subsequently decreases.
Conclusions
In this paper, optimization of passenger and operating costs through
using genetic algorithm based method has been presented. The
objective function is developed by minimizing the total delay at
station, travel time in-bus and fleet size. The maximum and minimum
results obtained by numerical example can be saved by 29.95% and
4.53%, respectively, compared with the un-optimized value. The
obtained optimization results show that the proposed service pattern
with un-equal headway is reasonable. Forthcoming work should
discuss about preparation different service pattern according to traffic
volume and bus speed limitation.
Type: Regular 15 Hafezi and Habib
Acknowledgments
This research is funded by Canadian Foundation for Innovation (CFI)
and the Province of Nova Scotia. The authors thank the Metro
Transit, Halifax Regional Municipality for providing the test data
used in this study. The authors also would like to thank Mr. Levi
Megenbir for proof reading the article.
References
1. Dessouky, M., et al., Real-time control of buses for schedule coordination at a
terminal. Transportation Research Part A: Policy and Practice, 2003. 37(2):
p. 145-164. 2. Wagale, M., et al., Real-time Optimal Bus Scheduling for a City Using A DTR
Model. Procedia - Social and Behavioral Sciences, 2013. 104(0): p. 845-
854. 3. Sun, C., W. Zhou, and Y. Wang, Scheduling Combination and Headway
Optimization of Bus Rapid Transit. Journal of Transportation Systems
Engineering and Information Technology, 2008. 8(5): p. 61-67. 4. Estrada, M., et al., Design and implementation of efficient transit networks:
Procedure, case study and validity test. Transportation Research Part A:
Policy and Practice, 2011. 45(9): p. 935-950. 5. Karlaftis, M.G., A DEA approach for evaluating the efficiency and effectiveness of
urban transit systems. European Journal of Operational Research, 2004.
152(2): p. 354-364. 6. Li, Y., W. Xu, and S. He, Expected value model for optimizing the multiple bus
headways. Applied Mathematics and Computation, 2013. 219(11): p. 5849-
5861. 7. Wu, J. and N. Hounsell, Bus Priority Using pre-signals. Transportation Research
Part A: Policy and Practice, 1998. 32(8): p. 563-583.
8. Wahlstedt, J., Impacts of Bus Priority in Coordinated Traffic Signals. Procedia - Social and Behavioral Sciences, 2011. 16(0): p. 578-587.
9. Fu, L. and X. Yang, Design and Implementation of Bus-Holding Control Strategies
with Real-Time Information. Transportation Research Record: Journal of the Transportation Research Board, 2002. 1791(-1): p. 6-12.
10. Xuan, Y., J. Argote, and C.F. Daganzo, Dynamic bus holding strategies for
schedule reliability: Optimal linear control and performance analysis. Transportation Research Part B: Methodological, 2011. 45(10): p. 1831-
1845. 11. Chen, X., et al., Analyzing urban bus service reliability at the stop, route, and
network levels. Transportation Research Part A: Policy and Practice, 2009.
43(8): p. 722-734.
12. Fu, L. and X. Yang, Design and implementation of bus-holding control strategies
with real-time information. Transportation Research Record: Journal of the
Transportation Research Board, 2002. 1791(1): p. 6-12.
Type: Regular 16 Hafezi and Habib
13. Furth, P.G., Alternating deadheading in bus route operations. Transportation
science, 1985. 19(1): p. 13-28.
14. Delle Site, P. and F. Filippi, Service optimization for bus corridors with short-turn strategies and variable vehicle size. Transportation Research Part A: Policy
and Practice, 1998. 32(1): p. 19-38.
15. Li, Y., J.-M. Rousseau, and F. Wu, Real-Time Scheduling on a Transit Bus Route. 1991.
16. Sun, A. and M. Hickman, The Real–Time Stop–Skipping Problem. Journal of
Intelligent Transportation Systems, 2005. 9(2): p. 91-109. 17. Liu, Z., et al., Bus stop-skipping scheme with random travel time. Transportation
Research Part C: Emerging Technologies, 2013. 35(0): p. 46-56.
18. Yan, Y., et al., Robust optimization model of schedule design for a fixed bus route. Transportation Research Part C: Emerging Technologies, 2012. 25(0): p.
113-121. 19. Li, Y., R. J.-M., and M. Gendreau, Real-time scheduling on a transit bus route: a
0–1 stochastic programming model, in Proceedings of the Thirty-Third
Annual Meeting. 1991, Transportation Research Forum. p. 157-166. 20. Fu, L., Q. Liu, and P. Calamai, Real-time optimization model for dynamic
scheduling of transit operations. Transportation Research Record: Journal
of the Transportation Research Board, 2003. 1857(1): p. 48-55. 21. Kim, M. and P. Schonfeld, Integrating bus services with mixed fleets.
Transportation Research Part B: Methodological, 2013. 55(0): p. 227-244.
22. Hill, S.A., Numerical analysis of a time-headway bus route model. Physica A: Statistical Mechanics and its Applications, 2003. 328(1–2): p. 261-273.
23. Liang, F. and W. Hung Wong, Evolutionary Monte Carlo: Applications to Cp
Model Sampling and Change Point Problem. Statistica Sinica, 2000. 10: p.
317-342.
24. Yu, B., et al., Parallel genetic algorithm in bus route headway optimization.
Applied Soft Computing, 2011. 11(8): p. 5081-5091. 25. Khosravi, A., et al., A genetic algorithm-based method for improving quality of
travel time prediction intervals. Transportation Research Part C: Emerging
Technologies, 2011. 19(6): p. 1364-1376. 26. Dias, T.G., J.P.d. Sousa, and J.F. Cunha, Genetic Algorithms for the Bus Driver
Scheduling Problem: A Case Study. The Journal of the Operational
Research Society, 2002. 53(3): p. 324-335.