business analysis of ornamental plant nurseries in · pdf filebusiness analysis of ornamental...
TRANSCRIPT
FE269
Business Analysis of Ornamental Plant Nurseries in Florida, 19981
Alan W. Hodges, Loretta N. Satterthwaite, and John J. Haydu2
1. This document is FE269, one of a series of the Food and Resource Economics Department, Florida Cooperative Extension Service, Institute of Food and Agricultural Sciences, University of Florida. Original publication date December 2000. Revised June 2003. Reviewed January 2012. Visit the EDIS website at http://edis.ifas.ufl.edu.
2. Alan W. Hodges, coordinator of economic analysis, Department of Food and Resource Economics, University of Florida, Gainesville, FL.; Loretta N. Satterthwaite, coordinator of statistical research, and John J. Haydu, professor, Department of Food and Resource Economics, University of Florida, Mid-Florida Research and Education Center, Apopka, FL.
The Institute of Food and Agricultural Sciences (IFAS) is an Equal Opportunity Institution authorized to provide research, educational information and other services only to individuals and institutions that function with non-discrimination with respect to race, creed, color, religion, age, disability, sex, sexual orientation, marital status, national origin, political opinions or affiliations. U.S. Department of Agriculture, Cooperative Extension Service, University of Florida, IFAS, Florida A&M University Cooperative Extension Program, and Boards of County Commissioners Cooperating. Millie Ferrer-Chancy, Interim Dean
AbstractInformation is presented on sales, production, costs, assets and liabilities, and efficiency indicators for 37 wholesale ornamental plant nurseries in Florida in 1998. Nursery products represented among the sampled firms included container and field-grown woody ornamentals, tropical foliage, and flowering plants. The average firm had annual sales of nursery plants of $2.71 million (M), total income of $2.89M, and net firm income of $548 thousand (K). Total assets averaged $5.31M, including plant inventory, land, equipment, buildings, supplies, cash on hand, and accounts receivable; and total liabilities were $1.57M. Firms used an average production area of 55 acres, employed 49 full-time equivalent (FTE) persons, and managed total capital of $5.7M. As a share of value produced, costs were 34.7 percent for labor, 26.1 percent for materials, 5.0 percent for equipment/facilities, 10.0 percent for overhead, 3.8 percent for depreciation, 3.9 percent for interest, and 4.6 percent for management. Net profit margin averaged 18.9 percent; rate of return on capital investment, 7.9 percent; and rate of return on net worth, 11.2 percent. Value produced per square foot of growing area averaged $1.18, and value produced per FTE of labor was $58K. Growing space managed per FTE averaged 1.13 acres. Capital managed per FTE and per acre of growing space averaged $118K and $105K, respectively. Inventory turnover averaged 0.77. Similar information is presented for large, small, and highly
profitable firms, and for different types of plants. Compared to previous results for 1990, firms in 1998 were significantly larger—sales increased 66 percent in inflation-adjusted terms, production area increased 95 percent, employment increased 114 percent, total capital managed increased 122 percent, net worth increased 99 percent, and net income increased 45 percent. However, profitability and productivity were lower—net margin decreased 19 percent, rate of return on net worth decreased 20 percent, value produced per square foot decreased 11 percent, and inven-tory turnover declined 27 percent. These results confirm that profitability in the Florida nursery plant industry has continued to decline as the industry becomes more competitive.
Keywords: business analysis, Florida, wholesale nurseries, ornamental plants, sales, costs, net income, efficiency, resource use.
AcknowledgmentsThis report was made possible by the owners and managers of cooperating wholesale ornamental plant nursery firms who made available their records on a confidential basis for analysis. Assistance was provided by University of Florida Extension Ornamental Horticulture Agents Alan Fehrman, Frank Melton, Roger Newton, and Bill Schall. Thanks to Bill Messina and Al Wysocki for peer review of the manuscript.
2
IntroductionThe state of Florida is the second largest producer of ornamental plants in the United States, with over 5,000 registered wholesale growers (DPI, 1998), and wholesale cash receipts of $1.28 billion in 1998 (Johnson, 1999). Ornamental plants produced in Florida include woody ornamentals (landscape trees and shrubs), tropical foliage, flowering plant products, cut foliage, and turfgrass sod. Florida dominates production of tropical foliage with about 90 percent of U.S. sales.
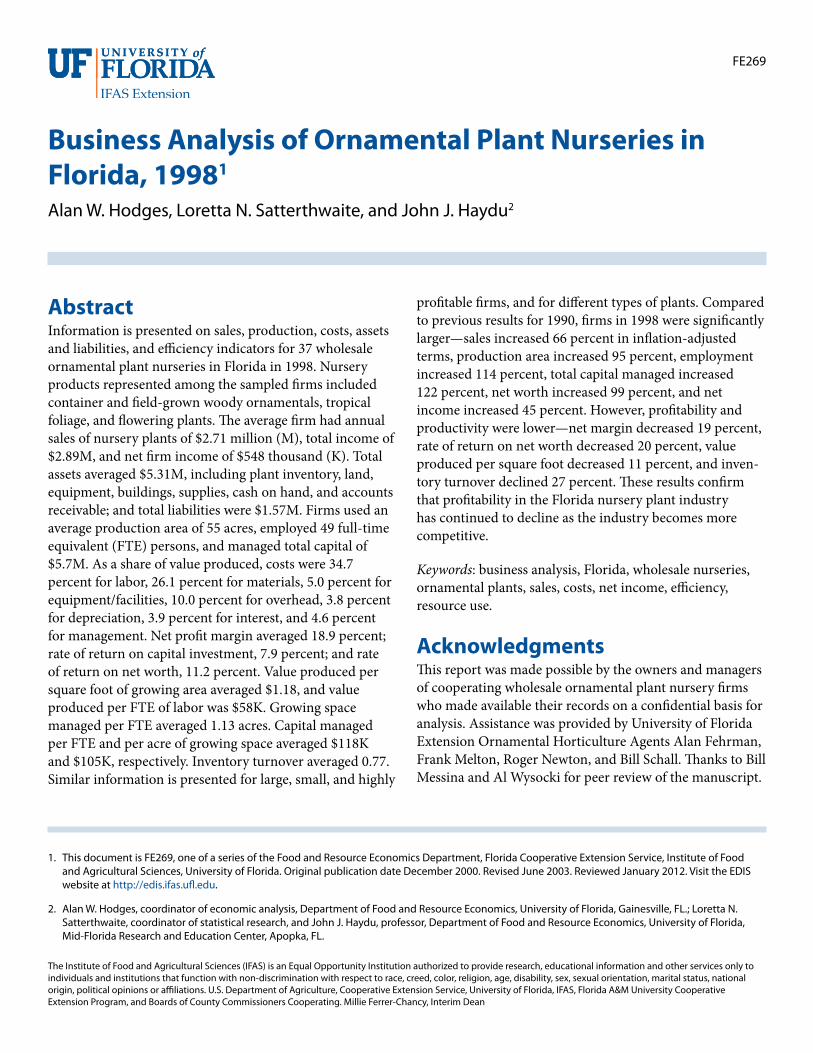
Growth of the ornamental plant industry in Florida has mirrored that in the nation as a whole, with sales of ornamental plant products rapidly increasing in the 1970s and early 1980s and then experiencing slower growth in the latter 1980s. In the 1990s, sales of Florida greenhouse and nursery crops declined in real terms until 1993, then increased until 1996, and have held steady since then (Figure 1). During this period of maturation and increasing competition, the ornamental horticulture industry experi-enced problems common to other parts of U.S. agriculture, including over-production, depressed prices, reduced profitability, and increased business failures.
Information in this report was collected as part of the University of Florida’s Nursery Business Analysis Program. Since the 1960s, this program has gathered confidential production and accounting records from wholesale nurser-ies in Florida. This report updates previous reports for 1995 (Hodges, Satterthwaite, and Haydu, 1997) and 1990 (Hodges, 1992).
ProceduresInformation Collected and ReportedInformation for this report was collected from 37 wholesale ornamental nursery firms in Florida for the 1998 fiscal year. Data were also analyzed for 12 of these same firms that previously provided information for 1990 and 1995, respectively. In most cases, the data represented a calendar-year period of January to December; however, in a few instances, up to six months data were for a previous year. Firms participated in the Nursery Business Analysis Program voluntarily, so although it is not a statistically representative sample of firms, it is believed to represent firms with above-average management quality by virtue of their willingness to participate in such quality improvement programs. Managers who participated in this program received a report with information similar to that presented in this paper. Information gathered included monthly sales, other income, expenses itemized in 25 categories, assets and liabilities, inventory values, value of leased property, production area, and labor hours or number of full-time persons employed. Information was gathered from com-pany financial statements (or income tax forms and other production records), transcribed to a standard worksheet, and entered into computer spreadsheets for analysis. Reported results represent weighted averages for firms in each group, so larger firms had greater influence on the results by virtue of their greater values for sales, expenses, etc. Trends in operating results for 1990, 1995, and 1998 were compiled for the same set of 12 firms that provided information in all years. These results were adjusted for inflation using the gross domestic product (GDP) implicit price deflator, which increased 20 percent between 1990 and 1998 (Slater and Strawser, 1999).
Accounting ConventionsA number of accounting conventions were adopted in order to standardize the collection of information from different firms and to make possible consistent comparisons among different groups and across years. Sales of resold or “brokered” plants from other firms were deducted from total sales to give nursery-produced sales. Net returns from brokered sales were included in “miscellaneous income.” For some firms with a large proportion of brokerage sales, a portion of fixed costs and overhead expenses were charged as nursery production expenses. For firms with diversified operations that contributed records for two or more indus-try sectors, overhead costs and asset values were allocated to each enterprise in proportion to product sales. Plant inventories were accounted for on an accrual basis, where changes in inventory values were added to sales to calculate
Figure 1. Florida grower cash receipts for greenhouse and nursery crops, 1989-1998.
3
total value of production and total income. Inventories were also included among owned capital investments. Plant in-ventories were normally valued at wholesale market value, based on average actual prices realized, and appropriately discounted for unfinished products. For example, if a crop is normally grown for eight months and is aged six months at year’s end, it would be valued at 75 percent of its normal wholesale value. In the absence of detailed inventory records, plant inventories were evaluated at 50 to 75 percent of finished wholesale value for all plants in production. All assets and liabilities were evaluated to represent a mid-year position by averaging the beginning and ending values for the period. Investments in buildings, site improvements, machinery, and equipment were taken at book value (i.e. original cost less accumulated depreciation). Leased capital assets in land, buildings, and equipment were estimated at current market value. Investments in land were generally valued at the original purchase price, which did not reflect the current appreciated value of landholdings for many older firms. In cases where assets were personally owned by corporate officers and leased exclusively to the company, these assets were taken at book value rather than market value, and debts to corporate officers were not included among company liabilities when there was no intention to repay these debts. In some cases, lease payments for land were taken as compensation for management.
Industry Groups AnalyzedRecords were separately compiled and analyzed for five groups of crops and production system types in the wholesale ornamental plant nursery industry: containerized woody ornamentals, field grown woody ornamentals, flowering plants, tropical foliage plants in Central Florida, and tropical foliage in South Florida. Production systems for woody ornamentals are characterized by open growing areas, while producers of tropical foliage and flowering plant products typically have weatherized greenhouses or shadehouses. Within each industry group, data were also analyzed as subgroups of large firms, small firms, and highly profitable firms where possible. Large firms were defined as having annual sales of $1 million or greater, while small firms had sales of less than $500,000. Highly profitable firms were defined as having returns to capital of at least 15 percent. The number of firms sampled in each industry is shown in Table 1. Of the 37 firms providing information for 1998, 12 of these firms also participated in 1990 and 1995. In order to assure confidentiality for participating firms, results are reported separately only for those industry groups for which three or more firms participated.
ResultsResults of the analysis are presented in separate sections on income and value produced, productive resources utilized, assets and liabilities, expenses, net returns and profitability, productivity and efficiency indicators, and financial ratios. Summary tables are presented with results for all firms; large, small, and highly profitable firms; and for the industry groups of container woody ornamentals, field woody ornamentals, flowering plants, and Central and South Florida tropical foliage. Information presented in charts shows changes in key measures from 1990 to 1998, in inflation-adjusted terms, for the 12 firms participating in both 1990 and 1998.
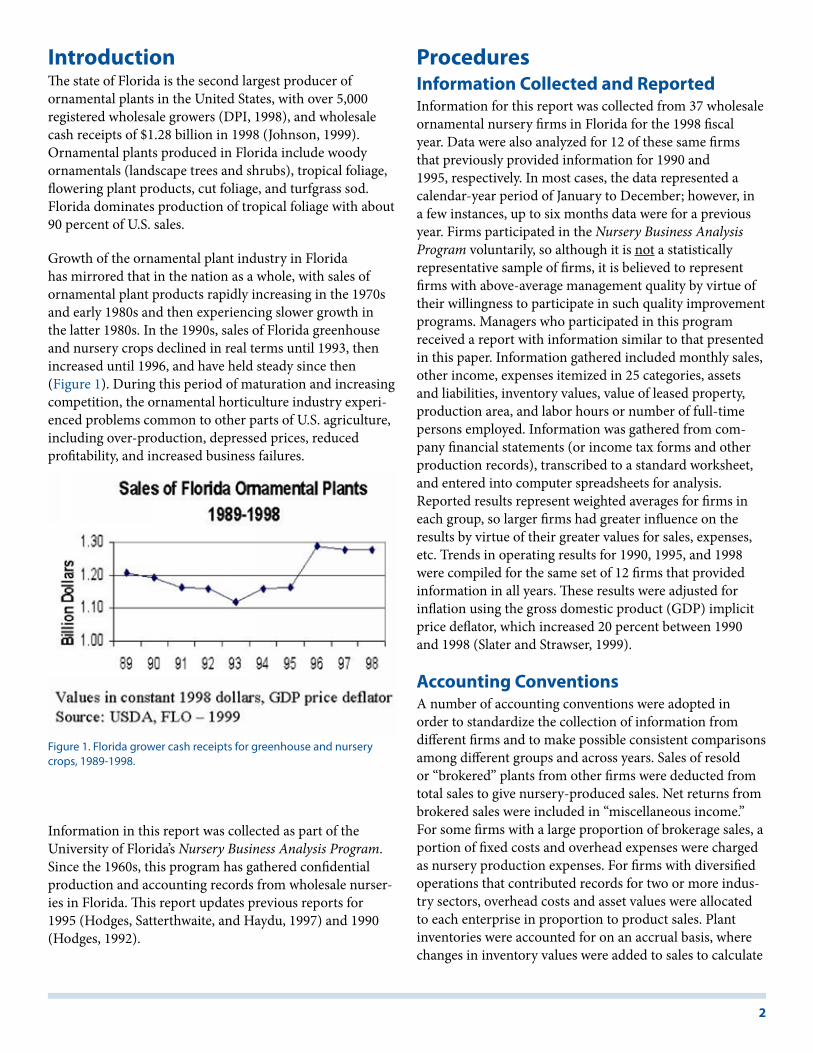
Income and Value ProducedANNuAl SAleSPlant sales by Florida nursery firms in 1998 averaged $2.7 million (M), including $2.4M in plants produced by the nurseries, net of products purchased from other growers and resold. Large firms (i.e. those with at least $1M in sales) had sales averaging $7.1M (Table 2). Sales were highest for flowering plant firms ($6.3M). Sales for Central and South Florida foliage firms averaged $1.3 and $2.6M, respectively; and sales by container and field growers of woody orna-mentals were $3.4M and $1.2M, respectively. For those firms providing information in both 1995 and 1998, average sales increased 74 percent higher in constant-dollar terms (Table 2). Over the period 1990–1998, average sales per firm increased 99 percent (Figure 2).
Figure 2. Average annual sales by 12 Florida nurseries, 1990, 1995, and 1998.
4
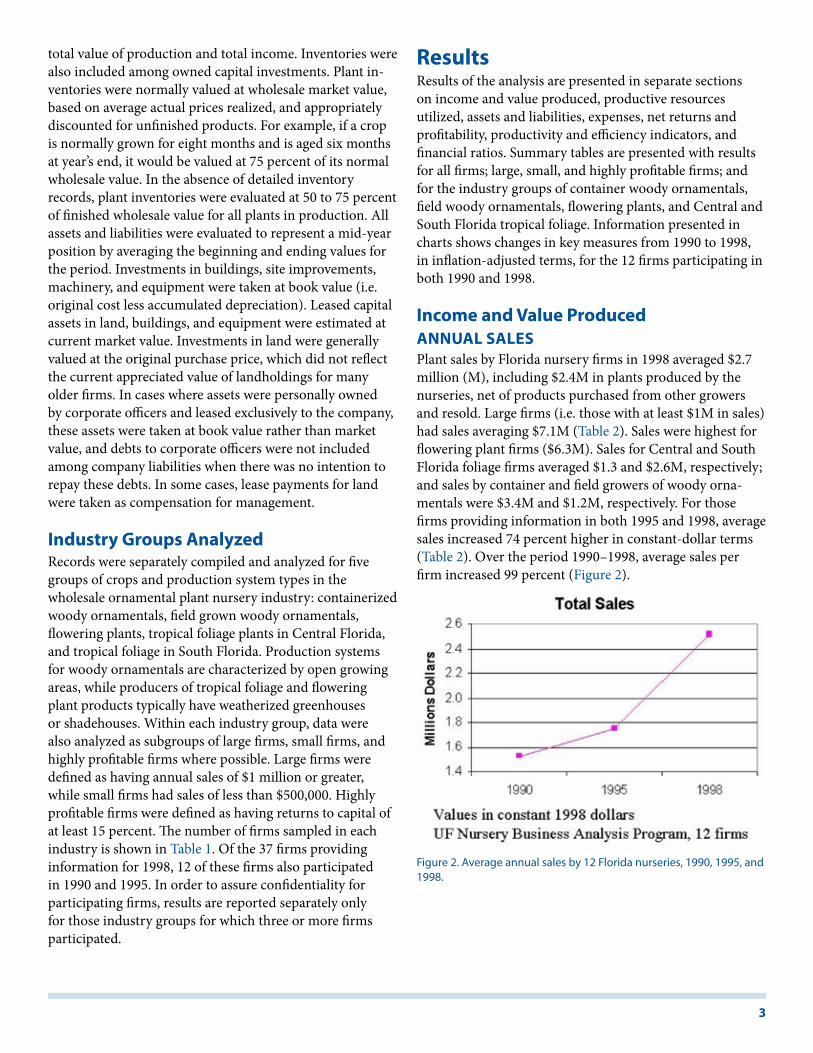
MONthly SAleSThe distribution of monthly sales as a percentage of total sales is shown in Figure 3. All industry groups generally followed similar trends, with peak sales during the spring months (March–May), followed by declining summertime sales, and then a smaller second peak in November. Flower-ing plant nurseries had dramatically more seasonal sales, with nearly 50 percent of annual sales during the spring months and less than five percent monthly during the July-September period. Presumably this pattern was related to the market for holiday crops. Sales were least seasonal for container woody ornamental nurseries.
PlANt INVeNtORy ChANGe ANd VAlue PROduCedChanges in plant inventory values during 1998 were positive for all industry groups, and averaged $395K for all firms and $1.3M for the large nurseries (Table 2). Value produced or output is a measure of productive effort of a firm, calculated as the sum of own plant sales plus change in plant inventory value. Value produced averaged $2.8M for all firms, ranging from $7.5M for large firms to $288K for small firms. Value produced by the same firms increased 48 percent from 1995 to 1998, and 74 percent between 1990 and 1998.
tOtAl INCOMeTotal income, including plant sales, changes in plant inven-tory values, and miscellaneous income from brokerage services, interest on accounts, rents, etc., averaged $2.9M for all firms, ranging from $7.7M for large firms to $392K for small firms (Table 2). Total income for the highly profit-able firms averaged $4.7M. Total income for the sub-sample of same firms has increased 47 percent since 1995 and 79 percent since 1990.
Resources used and Resource efficiency IndicatorsResources used for nursery plant production were land, labor, and managed capital. Indicators of productivity, efficiency, and resource-use intensity express relationships between the use of productive resources (nursery growing space, labor, and capital) and monetary measures of output. Because of characteristic differences in resource use, these indicators are more meaningful for different types of nursery operation than for large or small businesses.
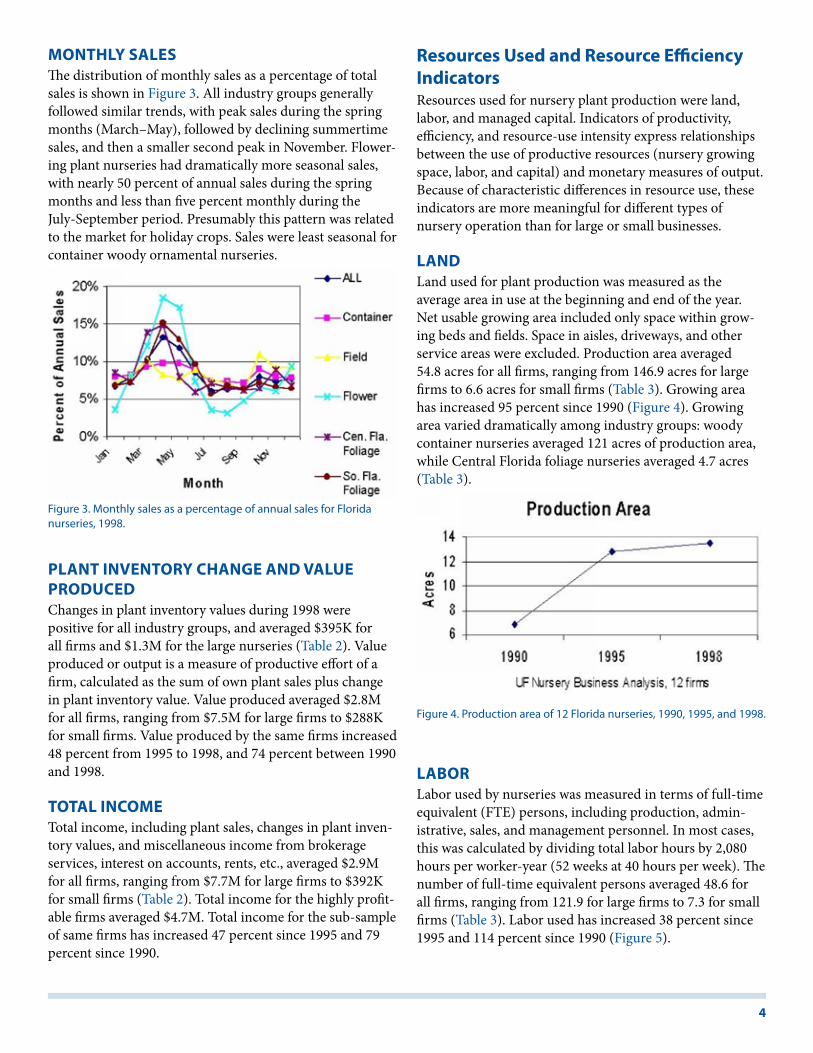
lANdLand used for plant production was measured as the average area in use at the beginning and end of the year. Net usable growing area included only space within grow-ing beds and fields. Space in aisles, driveways, and other service areas were excluded. Production area averaged 54.8 acres for all firms, ranging from 146.9 acres for large firms to 6.6 acres for small firms (Table 3). Growing area has increased 95 percent since 1990 (Figure 4). Growing area varied dramatically among industry groups: woody container nurseries averaged 121 acres of production area, while Central Florida foliage nurseries averaged 4.7 acres (Table 3).
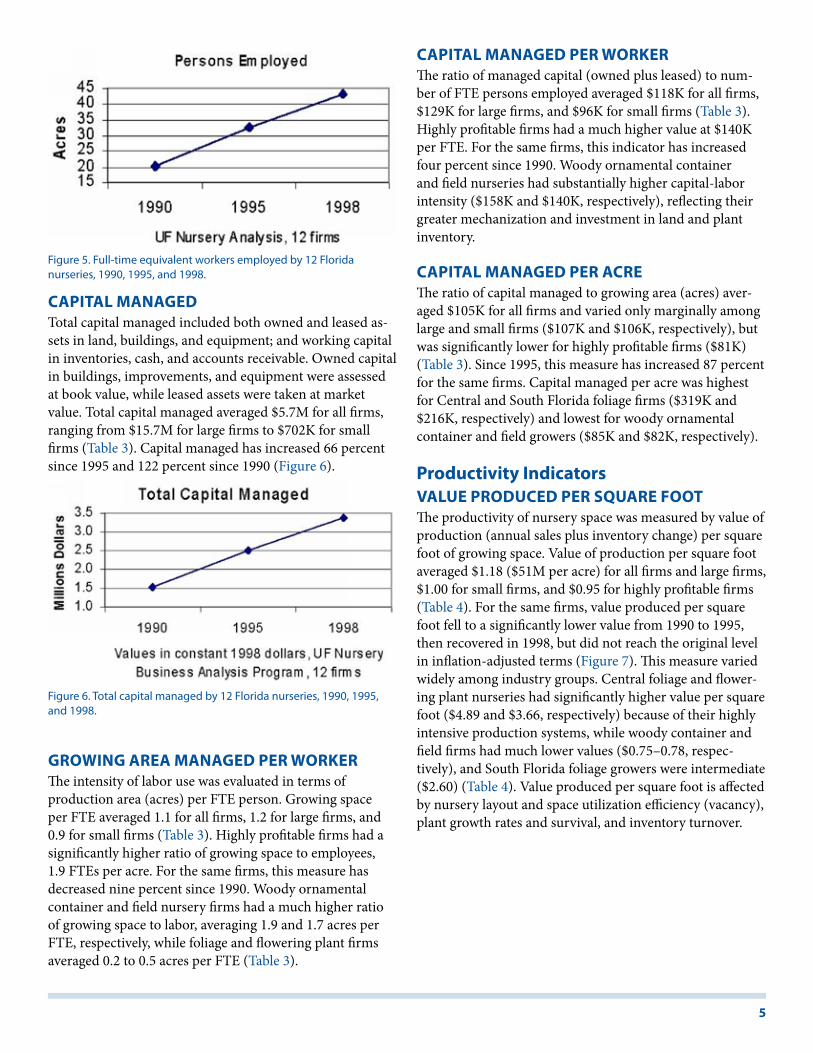
lABORLabor used by nurseries was measured in terms of full-time equivalent (FTE) persons, including production, admin-istrative, sales, and management personnel. In most cases, this was calculated by dividing total labor hours by 2,080 hours per worker-year (52 weeks at 40 hours per week). The number of full-time equivalent persons averaged 48.6 for all firms, ranging from 121.9 for large firms to 7.3 for small firms (Table 3). Labor used has increased 38 percent since 1995 and 114 percent since 1990 (Figure 5).
Figure 3. Monthly sales as a percentage of annual sales for Florida nurseries, 1998.
Figure 4. Production area of 12 Florida nurseries, 1990, 1995, and 1998.
5
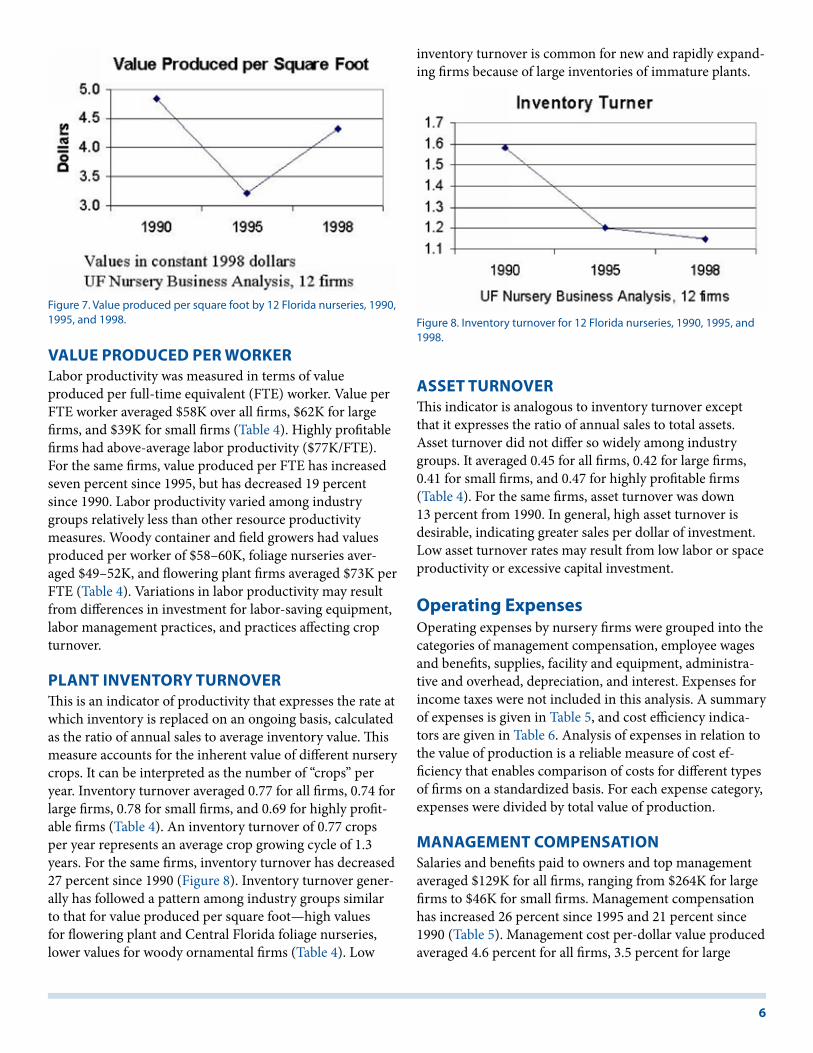
CAPItAl MANAGedTotal capital managed included both owned and leased as-sets in land, buildings, and equipment; and working capital in inventories, cash, and accounts receivable. Owned capital in buildings, improvements, and equipment were assessed at book value, while leased assets were taken at market value. Total capital managed averaged $5.7M for all firms, ranging from $15.7M for large firms to $702K for small firms (Table 3). Capital managed has increased 66 percent since 1995 and 122 percent since 1990 (Figure 6).
GROwING AReA MANAGed PeR wORkeRThe intensity of labor use was evaluated in terms of production area (acres) per FTE person. Growing space per FTE averaged 1.1 for all firms, 1.2 for large firms, and 0.9 for small firms (Table 3). Highly profitable firms had a significantly higher ratio of growing space to employees, 1.9 FTEs per acre. For the same firms, this measure has decreased nine percent since 1990. Woody ornamental container and field nursery firms had a much higher ratio of growing space to labor, averaging 1.9 and 1.7 acres per FTE, respectively, while foliage and flowering plant firms averaged 0.2 to 0.5 acres per FTE (Table 3).
CAPItAl MANAGed PeR wORkeRThe ratio of managed capital (owned plus leased) to num-ber of FTE persons employed averaged $118K for all firms, $129K for large firms, and $96K for small firms (Table 3). Highly profitable firms had a much higher value at $140K per FTE. For the same firms, this indicator has increased four percent since 1990. Woody ornamental container and field nurseries had substantially higher capital-labor intensity ($158K and $140K, respectively), reflecting their greater mechanization and investment in land and plant inventory.
CAPItAl MANAGed PeR ACReThe ratio of capital managed to growing area (acres) aver-aged $105K for all firms and varied only marginally among large and small firms ($107K and $106K, respectively), but was significantly lower for highly profitable firms ($81K) (Table 3). Since 1995, this measure has increased 87 percent for the same firms. Capital managed per acre was highest for Central and South Florida foliage firms ($319K and $216K, respectively) and lowest for woody ornamental container and field growers ($85K and $82K, respectively).
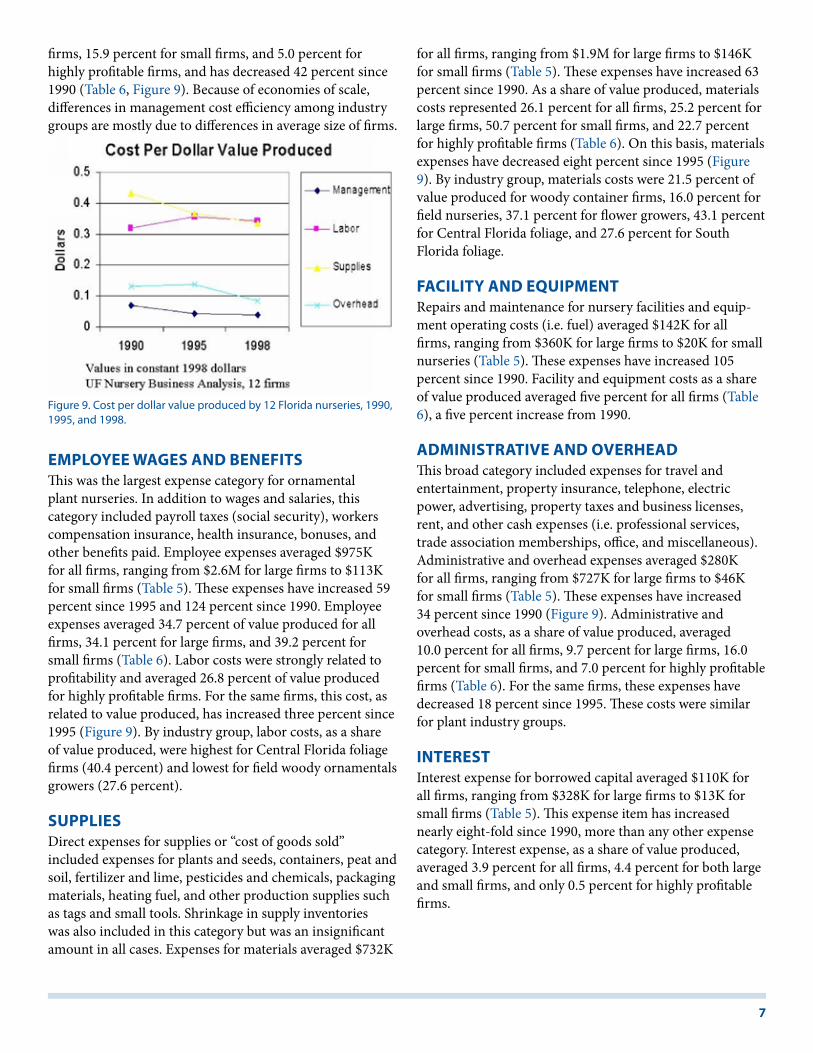
Productivity IndicatorsVAlue PROduCed PeR SquARe FOOtThe productivity of nursery space was measured by value of production (annual sales plus inventory change) per square foot of growing space. Value of production per square foot averaged $1.18 ($51M per acre) for all firms and large firms, $1.00 for small firms, and $0.95 for highly profitable firms (Table 4). For the same firms, value produced per square foot fell to a significantly lower value from 1990 to 1995, then recovered in 1998, but did not reach the original level in inflation-adjusted terms (Figure 7). This measure varied widely among industry groups. Central foliage and flower-ing plant nurseries had significantly higher value per square foot ($4.89 and $3.66, respectively) because of their highly intensive production systems, while woody container and field firms had much lower values ($0.75–0.78, respec-tively), and South Florida foliage growers were intermediate ($2.60) (Table 4). Value produced per square foot is affected by nursery layout and space utilization efficiency (vacancy), plant growth rates and survival, and inventory turnover.
Figure 5. Full-time equivalent workers employed by 12 Florida nurseries, 1990, 1995, and 1998.
Figure 6. Total capital managed by 12 Florida nurseries, 1990, 1995, and 1998.
6
VAlue PROduCed PeR wORkeRLabor productivity was measured in terms of value produced per full-time equivalent (FTE) worker. Value per FTE worker averaged $58K over all firms, $62K for large firms, and $39K for small firms (Table 4). Highly profitable firms had above-average labor productivity ($77K/FTE). For the same firms, value produced per FTE has increased seven percent since 1995, but has decreased 19 percent since 1990. Labor productivity varied among industry groups relatively less than other resource productivity measures. Woody container and field growers had values produced per worker of $58–60K, foliage nurseries aver-aged $49–52K, and flowering plant firms averaged $73K per FTE (Table 4). Variations in labor productivity may result from differences in investment for labor-saving equipment, labor management practices, and practices affecting crop turnover.
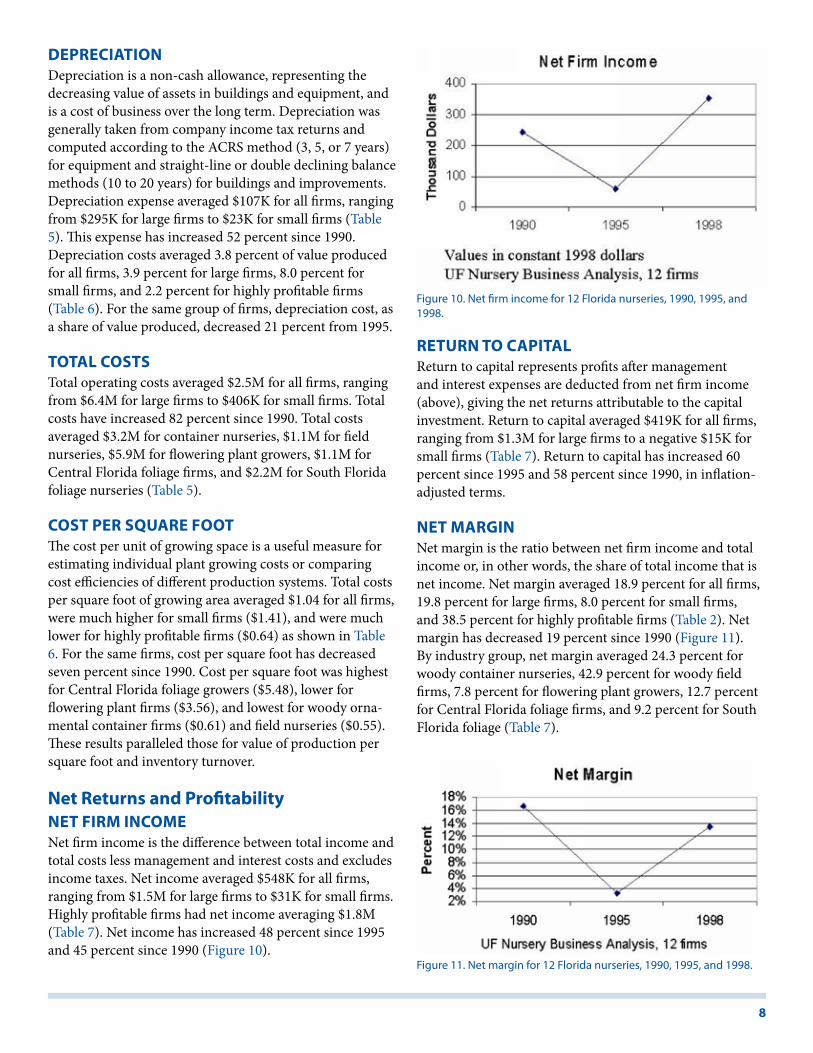
PlANt INVeNtORy tuRNOVeRThis is an indicator of productivity that expresses the rate at which inventory is replaced on an ongoing basis, calculated as the ratio of annual sales to average inventory value. This measure accounts for the inherent value of different nursery crops. It can be interpreted as the number of “crops” per year. Inventory turnover averaged 0.77 for all firms, 0.74 for large firms, 0.78 for small firms, and 0.69 for highly profit-able firms (Table 4). An inventory turnover of 0.77 crops per year represents an average crop growing cycle of 1.3 years. For the same firms, inventory turnover has decreased 27 percent since 1990 (Figure 8). Inventory turnover gener-ally has followed a pattern among industry groups similar to that for value produced per square foot—high values for flowering plant and Central Florida foliage nurseries, lower values for woody ornamental firms (Table 4). Low
inventory turnover is common for new and rapidly expand-ing firms because of large inventories of immature plants.
ASSet tuRNOVeRThis indicator is analogous to inventory turnover except that it expresses the ratio of annual sales to total assets. Asset turnover did not differ so widely among industry groups. It averaged 0.45 for all firms, 0.42 for large firms, 0.41 for small firms, and 0.47 for highly profitable firms (Table 4). For the same firms, asset turnover was down 13 percent from 1990. In general, high asset turnover is desirable, indicating greater sales per dollar of investment. Low asset turnover rates may result from low labor or space productivity or excessive capital investment.
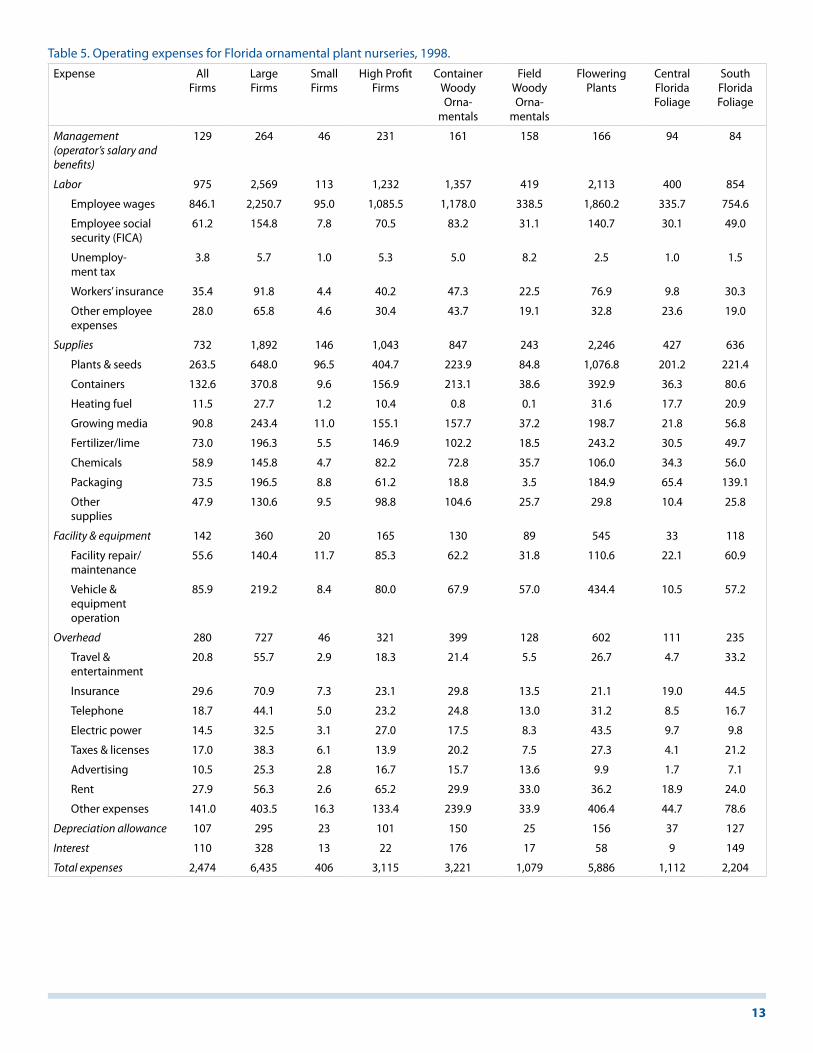
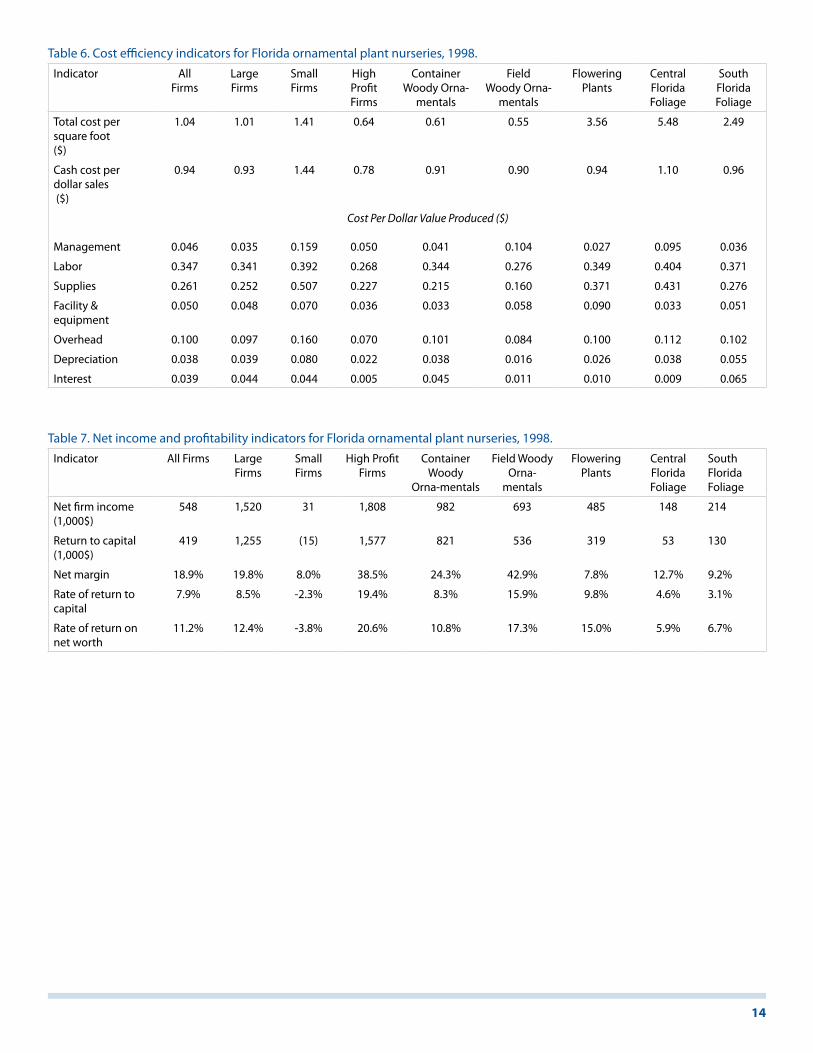
Operating expensesOperating expenses by nursery firms were grouped into the categories of management compensation, employee wages and benefits, supplies, facility and equipment, administra-tive and overhead, depreciation, and interest. Expenses for income taxes were not included in this analysis. A summary of expenses is given in Table 5, and cost efficiency indica-tors are given in Table 6. Analysis of expenses in relation to the value of production is a reliable measure of cost ef-ficiency that enables comparison of costs for different types of firms on a standardized basis. For each expense category, expenses were divided by total value of production.
MANAGeMeNt COMPeNSAtIONSalaries and benefits paid to owners and top management averaged $129K for all firms, ranging from $264K for large firms to $46K for small firms. Management compensation has increased 26 percent since 1995 and 21 percent since 1990 (Table 5). Management cost per-dollar value produced averaged 4.6 percent for all firms, 3.5 percent for large
Figure 7. Value produced per square foot by 12 Florida nurseries, 1990, 1995, and 1998. Figure 8. Inventory turnover for 12 Florida nurseries, 1990, 1995, and
1998.
7
firms, 15.9 percent for small firms, and 5.0 percent for highly profitable firms, and has decreased 42 percent since 1990 (Table 6, Figure 9). Because of economies of scale, differences in management cost efficiency among industry groups are mostly due to differences in average size of firms.
eMPlOyee wAGeS ANd BeNeFItSThis was the largest expense category for ornamental plant nurseries. In addition to wages and salaries, this category included payroll taxes (social security), workers compensation insurance, health insurance, bonuses, and other benefits paid. Employee expenses averaged $975K for all firms, ranging from $2.6M for large firms to $113K for small firms (Table 5). These expenses have increased 59 percent since 1995 and 124 percent since 1990. Employee expenses averaged 34.7 percent of value produced for all firms, 34.1 percent for large firms, and 39.2 percent for small firms (Table 6). Labor costs were strongly related to profitability and averaged 26.8 percent of value produced for highly profitable firms. For the same firms, this cost, as related to value produced, has increased three percent since 1995 (Figure 9). By industry group, labor costs, as a share of value produced, were highest for Central Florida foliage firms (40.4 percent) and lowest for field woody ornamentals growers (27.6 percent).
SuPPlIeSDirect expenses for supplies or “cost of goods sold” included expenses for plants and seeds, containers, peat and soil, fertilizer and lime, pesticides and chemicals, packaging materials, heating fuel, and other production supplies such as tags and small tools. Shrinkage in supply inventories was also included in this category but was an insignificant amount in all cases. Expenses for materials averaged $732K
for all firms, ranging from $1.9M for large firms to $146K for small firms (Table 5). These expenses have increased 63 percent since 1990. As a share of value produced, materials costs represented 26.1 percent for all firms, 25.2 percent for large firms, 50.7 percent for small firms, and 22.7 percent for highly profitable firms (Table 6). On this basis, materials expenses have decreased eight percent since 1995 (Figure 9). By industry group, materials costs were 21.5 percent of value produced for woody container firms, 16.0 percent for field nurseries, 37.1 percent for flower growers, 43.1 percent for Central Florida foliage, and 27.6 percent for South Florida foliage.
FACIlIty ANd equIPMeNtRepairs and maintenance for nursery facilities and equip-ment operating costs (i.e. fuel) averaged $142K for all firms, ranging from $360K for large firms to $20K for small nurseries (Table 5). These expenses have increased 105 percent since 1990. Facility and equipment costs as a share of value produced averaged five percent for all firms (Table 6), a five percent increase from 1990.
AdMINIStRAtIVe ANd OVeRheAdThis broad category included expenses for travel and entertainment, property insurance, telephone, electric power, advertising, property taxes and business licenses, rent, and other cash expenses (i.e. professional services, trade association memberships, office, and miscellaneous). Administrative and overhead expenses averaged $280K for all firms, ranging from $727K for large firms to $46K for small firms (Table 5). These expenses have increased 34 percent since 1990 (Figure 9). Administrative and overhead costs, as a share of value produced, averaged 10.0 percent for all firms, 9.7 percent for large firms, 16.0 percent for small firms, and 7.0 percent for highly profitable firms (Table 6). For the same firms, these expenses have decreased 18 percent since 1995. These costs were similar for plant industry groups.
INteReStInterest expense for borrowed capital averaged $110K for all firms, ranging from $328K for large firms to $13K for small firms (Table 5). This expense item has increased nearly eight-fold since 1990, more than any other expense category. Interest expense, as a share of value produced, averaged 3.9 percent for all firms, 4.4 percent for both large and small firms, and only 0.5 percent for highly profitable firms.
Figure 9. Cost per dollar value produced by 12 Florida nurseries, 1990, 1995, and 1998.
8
dePReCIAtIONDepreciation is a non-cash allowance, representing the decreasing value of assets in buildings and equipment, and is a cost of business over the long term. Depreciation was generally taken from company income tax returns and computed according to the ACRS method (3, 5, or 7 years) for equipment and straight-line or double declining balance methods (10 to 20 years) for buildings and improvements. Depreciation expense averaged $107K for all firms, ranging from $295K for large firms to $23K for small firms (Table 5). This expense has increased 52 percent since 1990. Depreciation costs averaged 3.8 percent of value produced for all firms, 3.9 percent for large firms, 8.0 percent for small firms, and 2.2 percent for highly profitable firms (Table 6). For the same group of firms, depreciation cost, as a share of value produced, decreased 21 percent from 1995.
tOtAl COStSTotal operating costs averaged $2.5M for all firms, ranging from $6.4M for large firms to $406K for small firms. Total costs have increased 82 percent since 1990. Total costs averaged $3.2M for container nurseries, $1.1M for field nurseries, $5.9M for flowering plant growers, $1.1M for Central Florida foliage firms, and $2.2M for South Florida foliage nurseries (Table 5).
COSt PeR SquARe FOOtThe cost per unit of growing space is a useful measure for estimating individual plant growing costs or comparing cost efficiencies of different production systems. Total costs per square foot of growing area averaged $1.04 for all firms, were much higher for small firms ($1.41), and were much lower for highly profitable firms ($0.64) as shown in Table 6. For the same firms, cost per square foot has decreased seven percent since 1990. Cost per square foot was highest for Central Florida foliage growers ($5.48), lower for flowering plant firms ($3.56), and lowest for woody orna-mental container firms ($0.61) and field nurseries ($0.55). These results paralleled those for value of production per square foot and inventory turnover.
Net Returns and ProfitabilityNet FIRM INCOMeNet firm income is the difference between total income and total costs less management and interest costs and excludes income taxes. Net income averaged $548K for all firms, ranging from $1.5M for large firms to $31K for small firms. Highly profitable firms had net income averaging $1.8M (Table 7). Net income has increased 48 percent since 1995 and 45 percent since 1990 (Figure 10).
RetuRN tO CAPItAlReturn to capital represents profits after management and interest expenses are deducted from net firm income (above), giving the net returns attributable to the capital investment. Return to capital averaged $419K for all firms, ranging from $1.3M for large firms to a negative $15K for small firms (Table 7). Return to capital has increased 60 percent since 1995 and 58 percent since 1990, in inflation-adjusted terms.
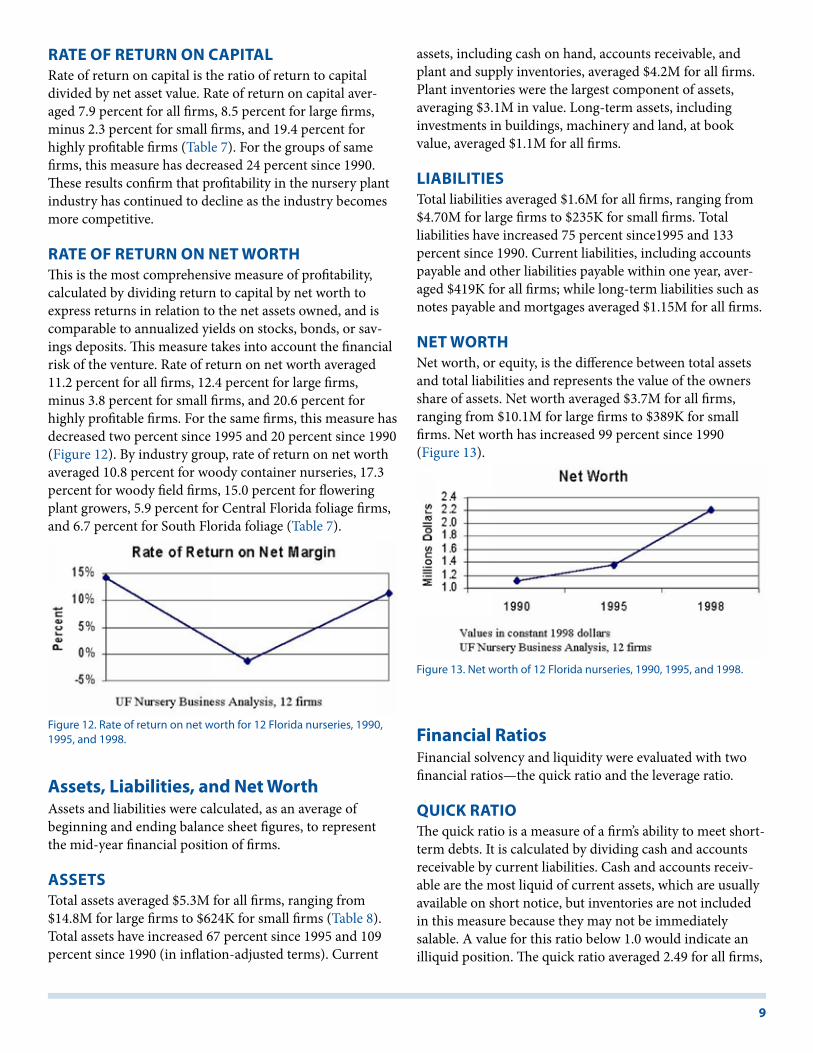
Net MARGINNet margin is the ratio between net firm income and total income or, in other words, the share of total income that is net income. Net margin averaged 18.9 percent for all firms, 19.8 percent for large firms, 8.0 percent for small firms, and 38.5 percent for highly profitable firms (Table 2). Net margin has decreased 19 percent since 1990 (Figure 11). By industry group, net margin averaged 24.3 percent for woody container nurseries, 42.9 percent for woody field firms, 7.8 percent for flowering plant growers, 12.7 percent for Central Florida foliage firms, and 9.2 percent for South Florida foliage (Table 7).
Figure 10. Net firm income for 12 Florida nurseries, 1990, 1995, and 1998.
Figure 11. Net margin for 12 Florida nurseries, 1990, 1995, and 1998.
9
RAte OF RetuRN ON CAPItAlRate of return on capital is the ratio of return to capital divided by net asset value. Rate of return on capital aver-aged 7.9 percent for all firms, 8.5 percent for large firms, minus 2.3 percent for small firms, and 19.4 percent for highly profitable firms (Table 7). For the groups of same firms, this measure has decreased 24 percent since 1990. These results confirm that profitability in the nursery plant industry has continued to decline as the industry becomes more competitive.
RAte OF RetuRN ON Net wORthThis is the most comprehensive measure of profitability, calculated by dividing return to capital by net worth to express returns in relation to the net assets owned, and is comparable to annualized yields on stocks, bonds, or sav-ings deposits. This measure takes into account the financial risk of the venture. Rate of return on net worth averaged 11.2 percent for all firms, 12.4 percent for large firms, minus 3.8 percent for small firms, and 20.6 percent for highly profitable firms. For the same firms, this measure has decreased two percent since 1995 and 20 percent since 1990 (Figure 12). By industry group, rate of return on net worth averaged 10.8 percent for woody container nurseries, 17.3 percent for woody field firms, 15.0 percent for flowering plant growers, 5.9 percent for Central Florida foliage firms, and 6.7 percent for South Florida foliage (Table 7).
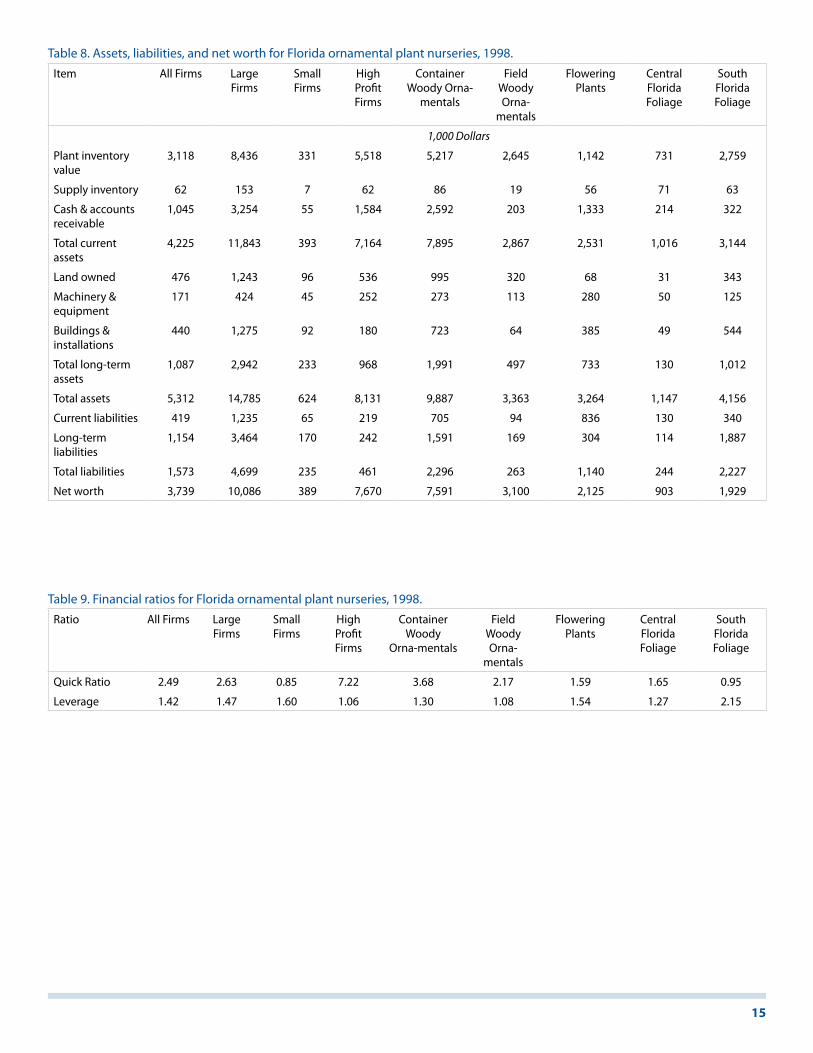
Assets, liabilities, and Net worthAssets and liabilities were calculated, as an average of beginning and ending balance sheet figures, to represent the mid-year financial position of firms.
ASSetSTotal assets averaged $5.3M for all firms, ranging from $14.8M for large firms to $624K for small firms (Table 8). Total assets have increased 67 percent since 1995 and 109 percent since 1990 (in inflation-adjusted terms). Current
assets, including cash on hand, accounts receivable, and plant and supply inventories, averaged $4.2M for all firms. Plant inventories were the largest component of assets, averaging $3.1M in value. Long-term assets, including investments in buildings, machinery and land, at book value, averaged $1.1M for all firms.
lIABIlItIeSTotal liabilities averaged $1.6M for all firms, ranging from $4.70M for large firms to $235K for small firms. Total liabilities have increased 75 percent since1995 and 133 percent since 1990. Current liabilities, including accounts payable and other liabilities payable within one year, aver-aged $419K for all firms; while long-term liabilities such as notes payable and mortgages averaged $1.15M for all firms.
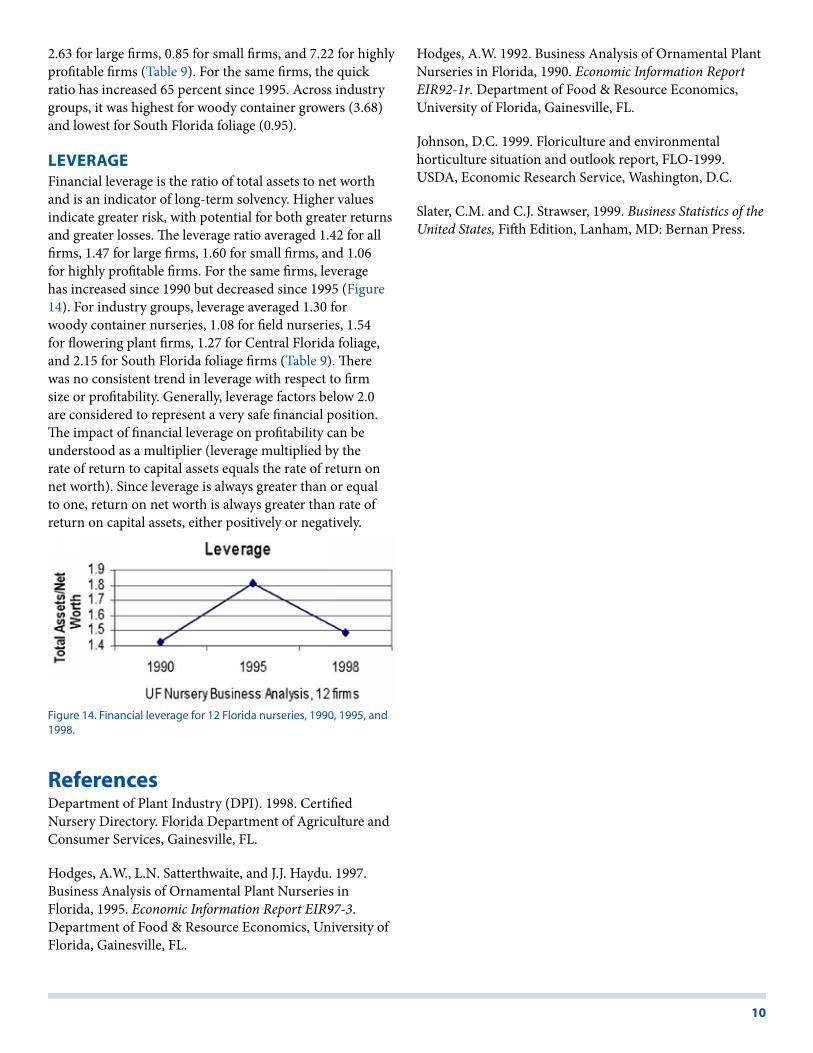
Net wORthNet worth, or equity, is the difference between total assets and total liabilities and represents the value of the owners share of assets. Net worth averaged $3.7M for all firms, ranging from $10.1M for large firms to $389K for small firms. Net worth has increased 99 percent since 1990 (Figure 13).
Financial RatiosFinancial solvency and liquidity were evaluated with two financial ratios—the quick ratio and the leverage ratio.
quICk RAtIOThe quick ratio is a measure of a firm’s ability to meet short-term debts. It is calculated by dividing cash and accounts receivable by current liabilities. Cash and accounts receiv-able are the most liquid of current assets, which are usually available on short notice, but inventories are not included in this measure because they may not be immediately salable. A value for this ratio below 1.0 would indicate an illiquid position. The quick ratio averaged 2.49 for all firms,
Figure 12. Rate of return on net worth for 12 Florida nurseries, 1990, 1995, and 1998.
Figure 13. Net worth of 12 Florida nurseries, 1990, 1995, and 1998.
10
2.63 for large firms, 0.85 for small firms, and 7.22 for highly profitable firms (Table 9). For the same firms, the quick ratio has increased 65 percent since 1995. Across industry groups, it was highest for woody container growers (3.68) and lowest for South Florida foliage (0.95).
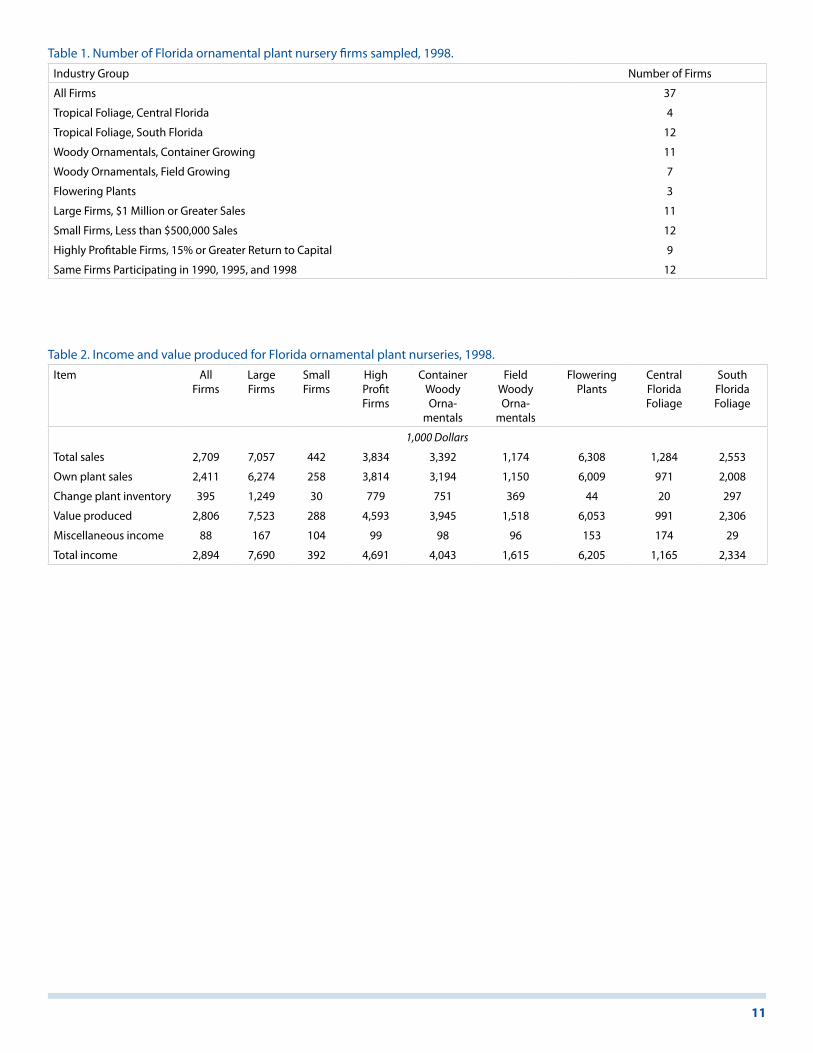
leVeRAGeFinancial leverage is the ratio of total assets to net worth and is an indicator of long-term solvency. Higher values indicate greater risk, with potential for both greater returns and greater losses. The leverage ratio averaged 1.42 for all firms, 1.47 for large firms, 1.60 for small firms, and 1.06 for highly profitable firms. For the same firms, leverage has increased since 1990 but decreased since 1995 (Figure 14). For industry groups, leverage averaged 1.30 for woody container nurseries, 1.08 for field nurseries, 1.54 for flowering plant firms, 1.27 for Central Florida foliage, and 2.15 for South Florida foliage firms (Table 9). There was no consistent trend in leverage with respect to firm size or profitability. Generally, leverage factors below 2.0 are considered to represent a very safe financial position. The impact of financial leverage on profitability can be understood as a multiplier (leverage multiplied by the rate of return to capital assets equals the rate of return on net worth). Since leverage is always greater than or equal to one, return on net worth is always greater than rate of return on capital assets, either positively or negatively.
ReferencesDepartment of Plant Industry (DPI). 1998. Certified Nursery Directory. Florida Department of Agriculture and Consumer Services, Gainesville, FL.
Hodges, A.W., L.N. Satterthwaite, and J.J. Haydu. 1997. Business Analysis of Ornamental Plant Nurseries in Florida, 1995. Economic Information Report EIR97-3. Department of Food & Resource Economics, University of Florida, Gainesville, FL.
Hodges, A.W. 1992. Business Analysis of Ornamental Plant Nurseries in Florida, 1990. Economic Information Report EIR92-1r. Department of Food & Resource Economics, University of Florida, Gainesville, FL.
Johnson, D.C. 1999. Floriculture and environmental horticulture situation and outlook report, FLO-1999. USDA, Economic Research Service, Washington, D.C.
Slater, C.M. and C.J. Strawser, 1999. Business Statistics of the United States, Fifth Edition, Lanham, MD: Bernan Press.
Figure 14. Financial leverage for 12 Florida nurseries, 1990, 1995, and 1998.
11
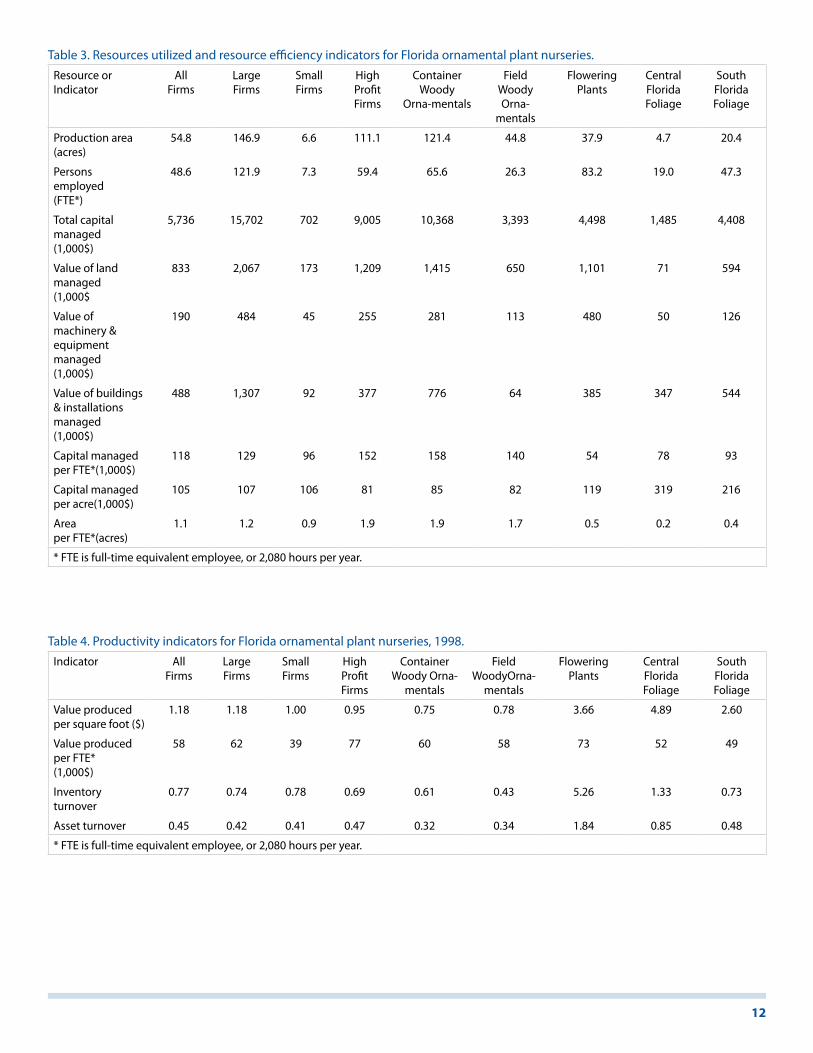
Table 1. Number of Florida ornamental plant nursery firms sampled, 1998.Industry Group Number of Firms
All Firms 37
Tropical Foliage, Central Florida 4
Tropical Foliage, South Florida 12
Woody Ornamentals, Container Growing 11
Woody Ornamentals, Field Growing 7
Flowering Plants 3
Large Firms, $1 Million or Greater Sales 11
Small Firms, Less than $500,000 Sales 12
Highly Profitable Firms, 15% or Greater Return to Capital 9
Same Firms Participating in 1990, 1995, and 1998 12
Table 2. Income and value produced for Florida ornamental plant nurseries, 1998.Item All
FirmsLarge Firms
Small Firms
High Profit Firms
Container Woody Orna-
mentals
Field Woody Orna-
mentals
Flowering Plants
Central Florida Foliage
South Florida Foliage
1,000 Dollars
Total sales 2,709 7,057 442 3,834 3,392 1,174 6,308 1,284 2,553
Own plant sales 2,411 6,274 258 3,814 3,194 1,150 6,009 971 2,008
Change plant inventory 395 1,249 30 779 751 369 44 20 297
Value produced 2,806 7,523 288 4,593 3,945 1,518 6,053 991 2,306
Miscellaneous income 88 167 104 99 98 96 153 174 29
Total income 2,894 7,690 392 4,691 4,043 1,615 6,205 1,165 2,334
12
Table 3. Resources utilized and resource efficiency indicators for Florida ornamental plant nurseries.Resource or Indicator
AllFirms
LargeFirms
SmallFirms
High Profit Firms
Container Woody
Orna-mentals
Field Woody Orna-
mentals
Flowering Plants
Central Florida Foliage
South Florida Foliage
Production area(acres)
54.8 146.9 6.6 111.1 121.4 44.8 37.9 4.7 20.4
Persons employed(FTE*)
48.6 121.9 7.3 59.4 65.6 26.3 83.2 19.0 47.3
Total capital managed(1,000$)
5,736 15,702 702 9,005 10,368 3,393 4,498 1,485 4,408
Value of land managed(1,000$
833 2,067 173 1,209 1,415 650 1,101 71 594
Value of machinery & equipment managed(1,000$)
190 484 45 255 281 113 480 50 126
Value of buildings & installations managed(1,000$)
488 1,307 92 377 776 64 385 347 544
Capital managedper FTE*(1,000$)
118 129 96 152 158 140 54 78 93
Capital managed per acre(1,000$)
105 107 106 81 85 82 119 319 216
Areaper FTE*(acres)
1.1 1.2 0.9 1.9 1.9 1.7 0.5 0.2 0.4
* FTE is full-time equivalent employee, or 2,080 hours per year.
Table 4. Productivity indicators for Florida ornamental plant nurseries, 1998.Indicator All
FirmsLargeFirms
SmallFirms
High Profit Firms
Container Woody Orna-
mentals
Field WoodyOrna-
mentals
Flowering Plants
Central Florida Foliage
South Florida Foliage
Value produced per square foot ($)
1.18 1.18 1.00 0.95 0.75 0.78 3.66 4.89 2.60
Value produced per FTE*(1,000$)
58 62 39 77 60 58 73 52 49
Inventory turnover
0.77 0.74 0.78 0.69 0.61 0.43 5.26 1.33 0.73
Asset turnover 0.45 0.42 0.41 0.47 0.32 0.34 1.84 0.85 0.48
* FTE is full-time equivalent employee, or 2,080 hours per year.
13
Table 5. Operating expenses for Florida ornamental plant nurseries, 1998.Expense All
FirmsLargeFirms
SmallFirms
High Profit Firms
Container WoodyOrna-
mentals
Field Woody Orna-
mentals
Flowering Plants
Central Florida Foliage
South Florida Foliage
Management (operator’s salary and benefits)
129 264 46 231 161 158 166 94 84
Labor 975 2,569 113 1,232 1,357 419 2,113 400 854
Employee wages 846.1 2,250.7 95.0 1,085.5 1,178.0 338.5 1,860.2 335.7 754.6
Employee social security (FICA)
61.2 154.8 7.8 70.5 83.2 31.1 140.7 30.1 49.0
Unemploy-ment tax
3.8 5.7 1.0 5.3 5.0 8.2 2.5 1.0 1.5
Workers’ insurance 35.4 91.8 4.4 40.2 47.3 22.5 76.9 9.8 30.3
Other employee expenses
28.0 65.8 4.6 30.4 43.7 19.1 32.8 23.6 19.0
Supplies 732 1,892 146 1,043 847 243 2,246 427 636
Plants & seeds 263.5 648.0 96.5 404.7 223.9 84.8 1,076.8 201.2 221.4
Containers 132.6 370.8 9.6 156.9 213.1 38.6 392.9 36.3 80.6
Heating fuel 11.5 27.7 1.2 10.4 0.8 0.1 31.6 17.7 20.9
Growing media 90.8 243.4 11.0 155.1 157.7 37.2 198.7 21.8 56.8
Fertilizer/lime 73.0 196.3 5.5 146.9 102.2 18.5 243.2 30.5 49.7
Chemicals 58.9 145.8 4.7 82.2 72.8 35.7 106.0 34.3 56.0
Packaging 73.5 196.5 8.8 61.2 18.8 3.5 184.9 65.4 139.1
Other supplies
47.9 130.6 9.5 98.8 104.6 25.7 29.8 10.4 25.8
Facility & equipment 142 360 20 165 130 89 545 33 118
Facility repair/maintenance
55.6 140.4 11.7 85.3 62.2 31.8 110.6 22.1 60.9
Vehicle & equipment operation
85.9 219.2 8.4 80.0 67.9 57.0 434.4 10.5 57.2
Overhead 280 727 46 321 399 128 602 111 235
Travel & entertainment
20.8 55.7 2.9 18.3 21.4 5.5 26.7 4.7 33.2
Insurance 29.6 70.9 7.3 23.1 29.8 13.5 21.1 19.0 44.5
Telephone 18.7 44.1 5.0 23.2 24.8 13.0 31.2 8.5 16.7
Electric power 14.5 32.5 3.1 27.0 17.5 8.3 43.5 9.7 9.8
Taxes & licenses 17.0 38.3 6.1 13.9 20.2 7.5 27.3 4.1 21.2
Advertising 10.5 25.3 2.8 16.7 15.7 13.6 9.9 1.7 7.1
Rent 27.9 56.3 2.6 65.2 29.9 33.0 36.2 18.9 24.0
Other expenses 141.0 403.5 16.3 133.4 239.9 33.9 406.4 44.7 78.6
Depreciation allowance 107 295 23 101 150 25 156 37 127
Interest 110 328 13 22 176 17 58 9 149
Total expenses 2,474 6,435 406 3,115 3,221 1,079 5,886 1,112 2,204
14
Table 6. Cost efficiency indicators for Florida ornamental plant nurseries, 1998.Indicator All
FirmsLargeFirms
Small Firms
High Profit Firms
Container Woody Orna-
mentals
Field Woody Orna-
mentals
Flowering Plants
Central Florida Foliage
South Florida Foliage
Total cost per square foot($)
1.04 1.01 1.41 0.64 0.61 0.55 3.56 5.48 2.49
Cash cost per dollar sales ($)
0.94 0.93 1.44 0.78 0.91 0.90 0.94 1.10 0.96
Cost Per Dollar Value Produced ($)
Management 0.046 0.035 0.159 0.050 0.041 0.104 0.027 0.095 0.036
Labor 0.347 0.341 0.392 0.268 0.344 0.276 0.349 0.404 0.371
Supplies 0.261 0.252 0.507 0.227 0.215 0.160 0.371 0.431 0.276
Facility & equipment
0.050 0.048 0.070 0.036 0.033 0.058 0.090 0.033 0.051
Overhead 0.100 0.097 0.160 0.070 0.101 0.084 0.100 0.112 0.102
Depreciation 0.038 0.039 0.080 0.022 0.038 0.016 0.026 0.038 0.055
Interest 0.039 0.044 0.044 0.005 0.045 0.011 0.010 0.009 0.065
Table 7. Net income and profitability indicators for Florida ornamental plant nurseries, 1998.Indicator All Firms Large
FirmsSmall Firms
High Profit Firms
Container Woody
Orna-mentals
Field Woody Orna-
mentals
Flowering Plants
Central Florida Foliage
South Florida Foliage
Net firm income (1,000$)
548 1,520 31 1,808 982 693 485 148 214
Return to capital (1,000$)
419 1,255 (15) 1,577 821 536 319 53 130
Net margin 18.9% 19.8% 8.0% 38.5% 24.3% 42.9% 7.8% 12.7% 9.2%
Rate of return to capital
7.9% 8.5% -2.3% 19.4% 8.3% 15.9% 9.8% 4.6% 3.1%
Rate of return on net worth
11.2% 12.4% -3.8% 20.6% 10.8% 17.3% 15.0% 5.9% 6.7%
15
Table 8. Assets, liabilities, and net worth for Florida ornamental plant nurseries, 1998.Item All Firms Large
FirmsSmall Firms
High Profit Firms
Container Woody Orna-
mentals
Field Woody Orna-
mentals
Flowering Plants
Central Florida Foliage
South Florida Foliage
1,000 Dollars
Plant inventory value
3,118 8,436 331 5,518 5,217 2,645 1,142 731 2,759
Supply inventory 62 153 7 62 86 19 56 71 63
Cash & accounts receivable
1,045 3,254 55 1,584 2,592 203 1,333 214 322
Total current assets
4,225 11,843 393 7,164 7,895 2,867 2,531 1,016 3,144
Land owned 476 1,243 96 536 995 320 68 31 343
Machinery & equipment
171 424 45 252 273 113 280 50 125
Buildings & installations
440 1,275 92 180 723 64 385 49 544
Total long-term assets
1,087 2,942 233 968 1,991 497 733 130 1,012
Total assets 5,312 14,785 624 8,131 9,887 3,363 3,264 1,147 4,156
Current liabilities 419 1,235 65 219 705 94 836 130 340
Long-term liabilities
1,154 3,464 170 242 1,591 169 304 114 1,887
Total liabilities 1,573 4,699 235 461 2,296 263 1,140 244 2,227
Net worth 3,739 10,086 389 7,670 7,591 3,100 2,125 903 1,929
Table 9. Financial ratios for Florida ornamental plant nurseries, 1998.Ratio All Firms Large
FirmsSmall Firms
High Profit Firms
Container Woody
Orna-mentals
Field Woody Orna-
mentals
Flowering Plants
Central Florida Foliage
South Florida Foliage
Quick Ratio 2.49 2.63 0.85 7.22 3.68 2.17 1.59 1.65 0.95
Leverage 1.42 1.47 1.60 1.06 1.30 1.08 1.54 1.27 2.15