business analytics and the pi system -...
TRANSCRIPT

Presented by
© Copyr i gh t 2012 OSIso f t , LLC.
Business
Analytics and
the PI System
Curt Hertler
Marketing Manager, Microsoft Alliance

© Copyr i gh t 2012 OSIso f t , LLC. 2
Agenda
• Business Analytics introduction
• Business Analytics tools and examples
– PI Asset Framework
– PI OLEDB Enterprise
– MS PowerPivot
– MS SQL PowerView
– MS SQL Analysis Services
• Key points to take home

© Copyr i gh t 2012 OSIso f t , LLC. 3
Business Intelligence Fundamentals
• It’s about Decision Making
Every level of the organization
To have value, BI needs “the Right Information
at the Right Time in the Right Format”
• The Right Information
FOSH = Financial, Operational, Sales, Human
Resources
• The Right Time
With PI System, the right time is real time
• The Right Format
Familiarity encourages adoption

© Copyr i gh t 2012 OSIso f t , LLC. 4
• Most people are used to thinking of PI like this
– one tag over time….
PI System data for reporting and decision making

© Copyr i gh t 2012 OSIso f t , LLC.
• Think of data as a cube for decision making.
– 1st dimension : PI Data Archive history
– Other dimensions : PI Asset Framework structure.
• Different perspectives can be found when
– Sorting data
– Presenting data
– Analyzing data
PI System data for reporting and decision making
5

© Copyr i gh t 2012 OSIso f t , LLC.
Business Analytics Toolkit
PI OLEDB Enterprise
PI Server
Enterprise
PowerPivot
for Excel 2010 Power View
6

© Copyr i gh t 2012 OSIso f t , LLC. 7
Example: Substation Power Distribution Profile
Wolverine
Bighorn Basin
Gypsy Junction
Victory Valley
Eastern District
Northern District
Falcon Pass
Pine Hill
Thunder Peak
Southern District
Western District
Eagle Point
Ford Avenue
Granite Cliff
Red River
Elm Street
Maple Grove
My Objectives
• Regional and Rate
Period Power
Distribution
• Aging Asset Risk
Assessment
• Equipment Condition
Benchmarking
• Want to do it myself !

© Copyr i gh t 2012 OSIso f t , LLC. 8
PI Asset Framework (PI AF)
Asset
Hierarchy
• District
• Substation
• Transformer
Asset Attributes
• PI System Data
• Equipment
Specifications
• Lab Analysis

© Copyr i gh t 2012 OSIso f t , LLC. 13
PI OLEDB Enterprise
• Leverage structure used
throughout your PI System
infrastructure
• Insure accurate aggregation
of real-time events
• Scale-up by using the PI AF
Structure
• Access PI Event Frames
(next release)
© Copyr i gh t 2012 OSIso f t , LLC. 14
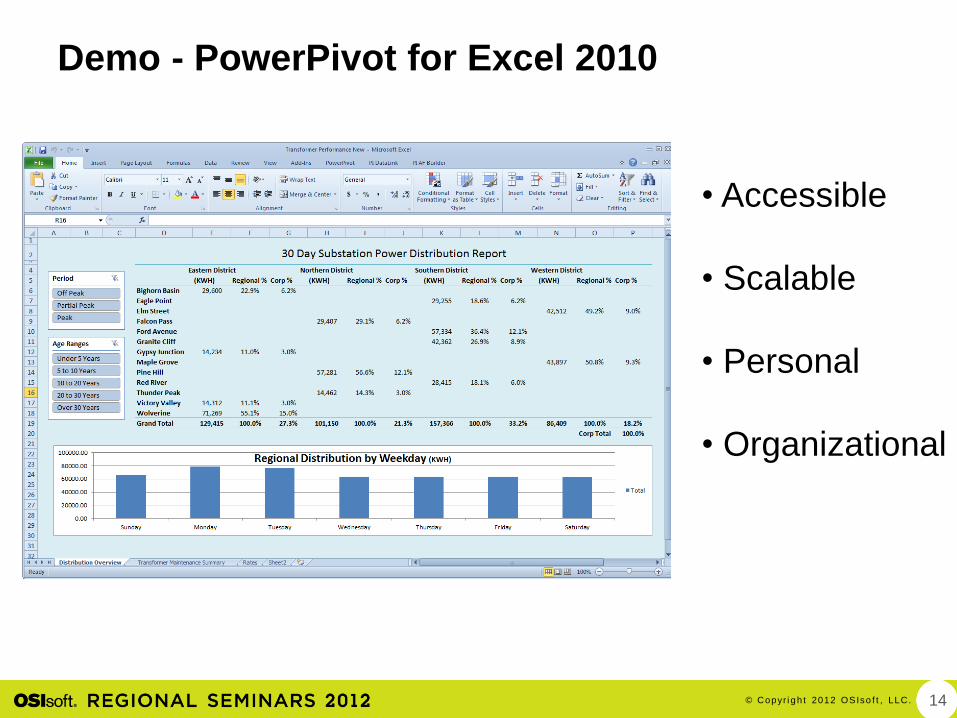
Demo - PowerPivot for Excel 2010
• Accessible
• Scalable
• Personal
• Organizational
© Copyr i gh t 2012 OSIso f t , LLC. 15
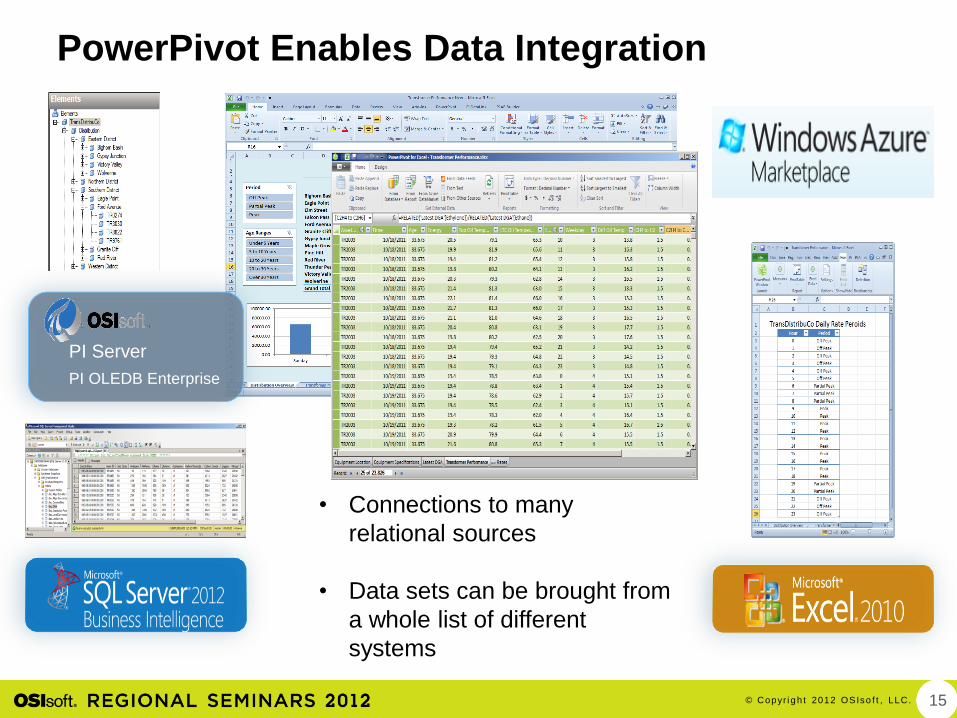
PowerPivot Enables Data Integration
PI OLEDB Enterprise
PI Server
• Connections to many
relational sources
• Data sets can be brought from
a whole list of different
systems

© Copyr i gh t 2012 OSIso f t , LLC. 16
PowerPivot Enables Data Integration
Can I use PI DataLink?
• Manual refresh step required
to copy and paste values
• Limited to ~1 million rows
• No support for upsizing to
SQL Analysis Services 2012

© Copyr i gh t 2012 OSIso f t , LLC.
Equipment Location PI OLEDB Enterprise
Equipment Specifications PI OLEDB Enterprise
Latest DGA PI OLEDB Enterprise
PowerPivot Creates the “Cube”
Configure
Relationships
between tables
based on like
columns, i.e.
“Asset ID” or
“Hour”
Transformer Performance
PI OLEDB Enterprise
Rates Excel Linked Table
17

© Copyr i gh t 2012 OSIso f t , LLC. 18
PowerPivot for Sharepoint
• Provides the
analysis capabilities
of PowerPivot
within the
SharePoint portal
• Allows users to
access and work
with PowerPivot
workbooks without
downloading the
workbook and data

© Copyr i gh t 2012 OSIso f t , LLC. 19
Microsoft SQL 2012 PowerView
• Reports creation combining all PI System sources
– PI Asset Framework
– PI Data Archive
– SQL Server data
• Thin client
• Rich and dynamic client
• Collaborative tool
• Windows integrated security
• SharePoint and PowerPoint integration
© Copyr i gh t 2012 OSIso f t , LLC. 20
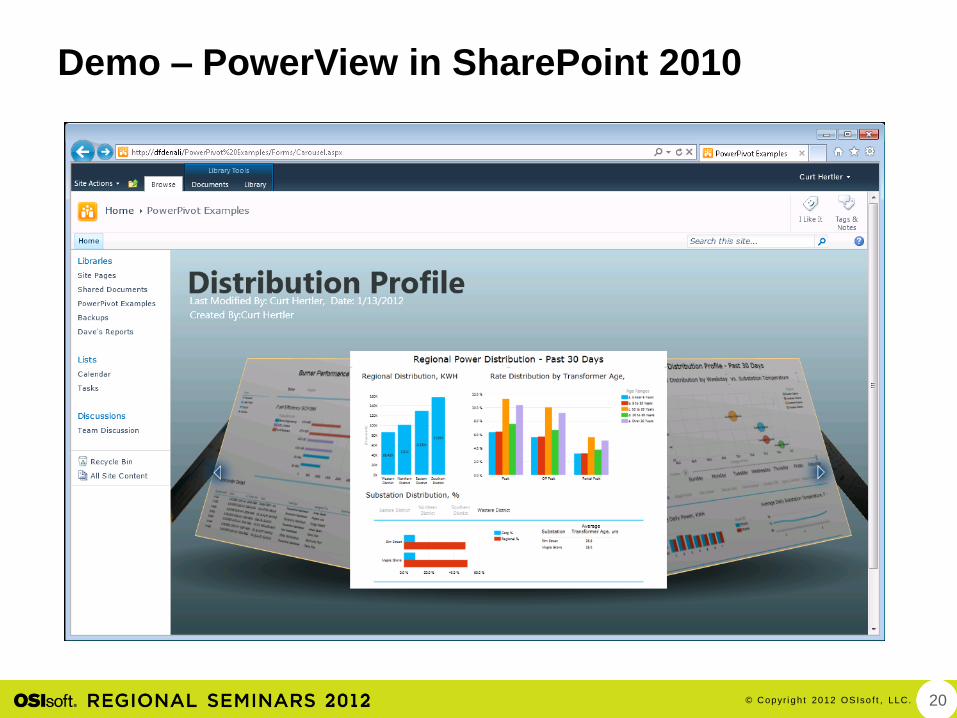
Demo – PowerView in SharePoint 2010

© Copyr i gh t 2012 OSIso f t , LLC. 21
PowerView – Interactive Analysis
• Interactive report updates using filters
PI OLEDB Enterprise
PI Server 2010
Distribution
by District
Distribution
by Transformer Age
Distribution
by Age and Rate

© Copyr i gh t 2012 OSIso f t , LLC. 22
PowerView - Multiple Views and Pages
• Create different reports from a single data cube
PI OLEDB Enterprise
PI Server 2010
Aging Asset Risk
Assessment
Weekday Distribution
Profile Equipment Condition
Benchmarking

© Copyr i gh t 2012 OSIso f t , LLC. 23
Power View Reports in PowerPoint
• PowerView reports can be used interactively in
PowerPoint presentations

© Copyr i gh t 2012 OSIso f t , LLC. 24
• Microsoft version: SQL Server Analysis Services (SSAS) provides comprehensive, enterprise scale analytic solutions that deliver actionable insights through familiar tools.
• Plain(er) English: SSAS allows you to design, build, and refresh data cubes from multiple sources and make them available for client analysis.
• Key features: – Source data can be stored directly or simply linked
– Source data can be incrementally refreshed
– Data can be shared to many users efficiently
– Data can be used as a source for further analysis, providing a middle tier for analytics and greater efficiency
SQL Server Analysis Services - Overview …

© Copyr i gh t 2012 OSIso f t , LLC. 25
Administrative
• Business Intelligence
Development Studio
– Build new BI Solutions
– Microsoft Visual Studio 2008
• Currently not supported in
MS Visual Studio 2010
– Components:
• Cube Designer
• Dimension Designer
• etc
• SQL Server Management
Studio
– Administer existing BI
solutions
SQL Server Analysis Services - Clients …

© Copyr i gh t 2012 OSIso f t , LLC. 26
End Users
• Excel 2010 – SQL Server Data
Mining add-ins
• PowerPivot for Excel
• PowerPivot for SharePoint
• SQL Server Reporting Services
• PowerView for SharePoint
SQL Server Analysis Services - Clients …

© Copyr i gh t 2012 OSIso f t , LLC. 29
Additional Information OSIsoft Resources • “Business Analytics with your PI System Data
using Microsoft PowerPivot”
• PI T&D Users Group Site extranet.osisoft.com
• OSIsoft vCampus vcampus.osisoft.com
• Microsoft Resources • www.microsoft.com/en-us/bi/powerpivot.aspx
• Helpful Books • “PowerPivot for the Data Analyst”, Bill Jelen
• “Practical PowerPivot & DAX Formulas for Excel 2010”,
Art Tennick

© Copyr i gh t 2012 OSIso f t , LLC. 30
Key points to take home
• Intuitive BI tools from OSIsoft and Microsoft
• Democratization of information
• Users can perform their own analysis
• Find the Right Information at the Right Time in
the Right Format !

Brought to you by
© Copyr i gh t 2012 OSIso f t , LLC.