business and bikeshare user perceptions of the … · business and bikeshare user perceptions of...
TRANSCRIPT

Buehler and Hamre, Economic Benefits of Capital Bikeshare 1
1 2
3
Business and Bikeshare User Perceptions of the 4
Economic Benefits of Capital Bikeshare 5 6 7
by Ralph Buehler and Andrea Hamre 8
9 10 Please cite as: Buehler, R., Hamre, A. 2015. “Business and Bikeshare User Perceptions of the 11 Economic Benefits of Capital Bikeshare,” Transportation Research Record: Journal of the 12 Transportation Research Board, No. 2520, pp. 100-111. 13 14 15 16 Ralph Buehler (corresponding author) 17 School of Public and International Affairs 18 Virginia Tech, Alexandria Center 19 1021 Prince Street, Suite 200 20 Alexandria, VA 22314 21 Tel: 703-706-8104 22 Fax: 703-518-8009 23 [email protected]; [email protected] 24 25 26 Andrea Hamre 27 School of Public and International Affairs 28 Virginia Tech, Alexandria Center 29 1021 Prince Street, Suite 200 30 Alexandria, VA 22314 31 [email protected] 32 33 34 Word count text, abstract, references, and cover page: 5,544 35 Number of figures and tables: 8 (250 words) 36 Total word count including figures and tables: 7,544 37 38 Note 1: This research has been supported by the Mid-Atlantic University Transportation Center 39 (MAUTC) of USDOT’s Research and Innovative Technology Administration (RITA). 40 41
Buehler and Hamre 2
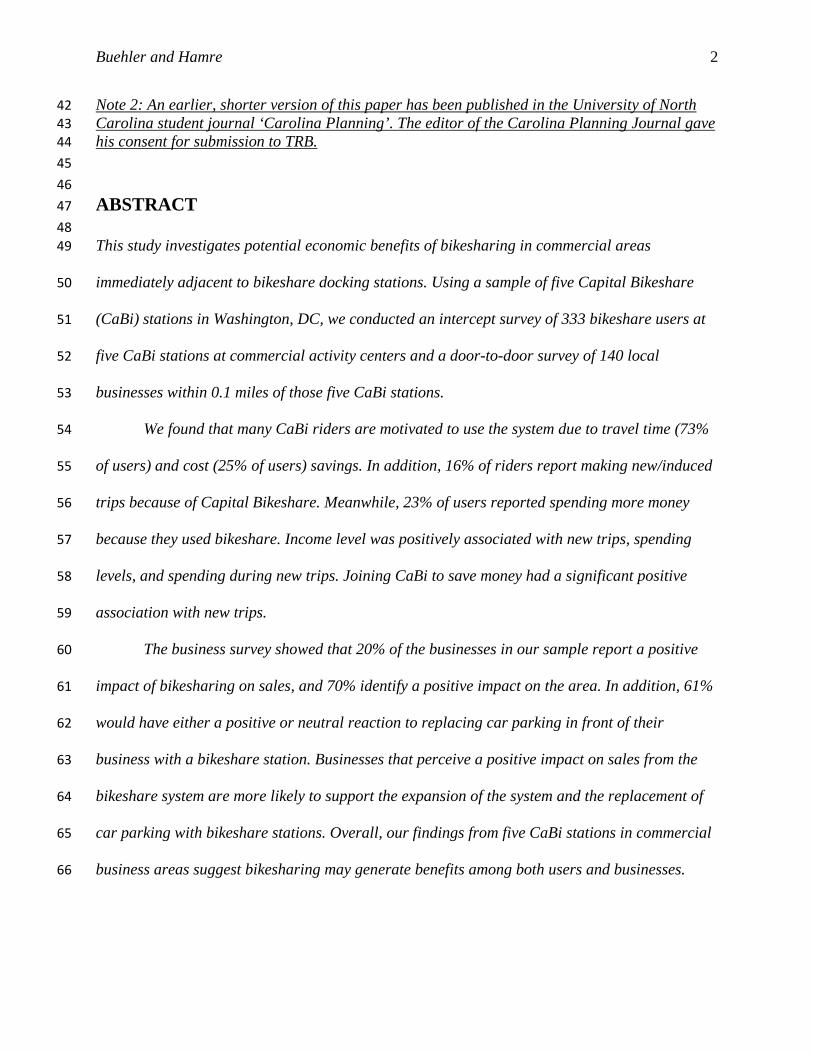
Note 2: An earlier, shorter version of this paper has been published in the University of North 42 Carolina student journal ‘Carolina Planning’. The editor of the Carolina Planning Journal gave 43 his consent for submission to TRB. 44 45 46 ABSTRACT 47 48 This study investigates potential economic benefits of bikesharing in commercial areas 49
immediately adjacent to bikeshare docking stations. Using a sample of five Capital Bikeshare 50
(CaBi) stations in Washington, DC, we conducted an intercept survey of 333 bikeshare users at 51
five CaBi stations at commercial activity centers and a door-to-door survey of 140 local 52
businesses within 0.1 miles of those five CaBi stations. 53
We found that many CaBi riders are motivated to use the system due to travel time (73% 54
of users) and cost (25% of users) savings. In addition, 16% of riders report making new/induced 55
trips because of Capital Bikeshare. Meanwhile, 23% of users reported spending more money 56
because they used bikeshare. Income level was positively associated with new trips, spending 57
levels, and spending during new trips. Joining CaBi to save money had a significant positive 58
association with new trips. 59
The business survey showed that 20% of the businesses in our sample report a positive 60
impact of bikesharing on sales, and 70% identify a positive impact on the area. In addition, 61% 61
would have either a positive or neutral reaction to replacing car parking in front of their 62
business with a bikeshare station. Businesses that perceive a positive impact on sales from the 63
bikeshare system are more likely to support the expansion of the system and the replacement of 64
car parking with bikeshare stations. Overall, our findings from five CaBi stations in commercial 65
business areas suggest bikesharing may generate benefits among both users and businesses. 66

Buehler and Hamre 3
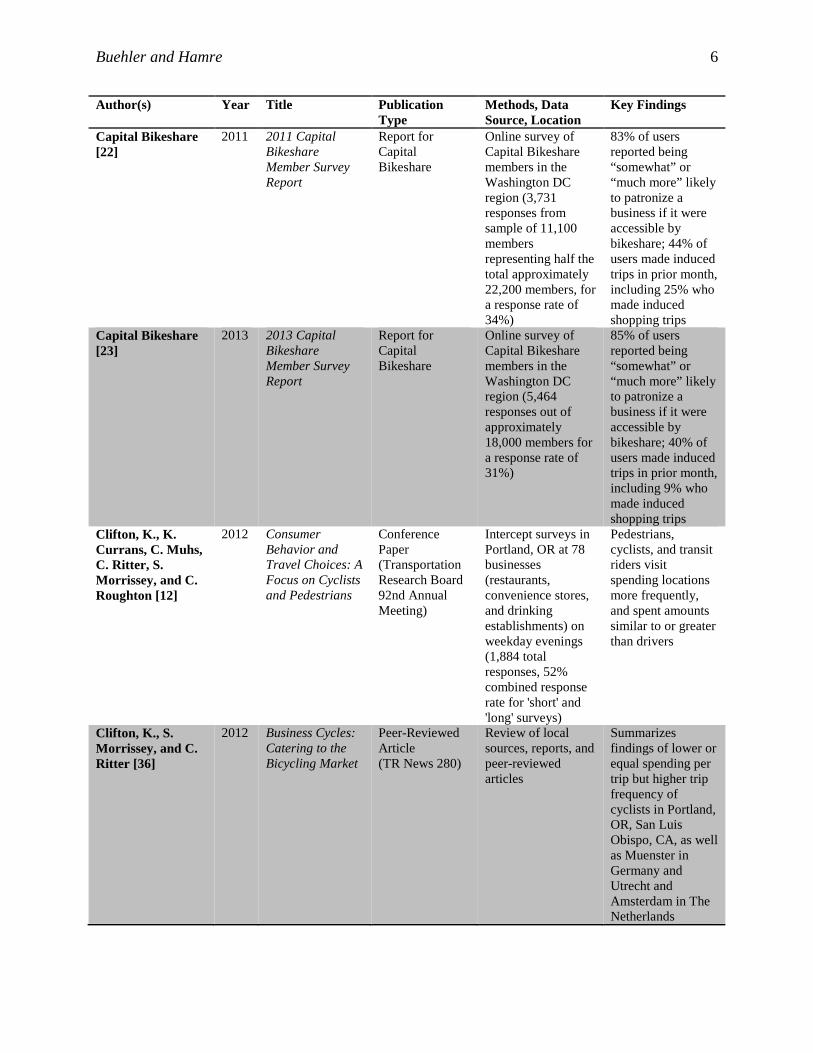
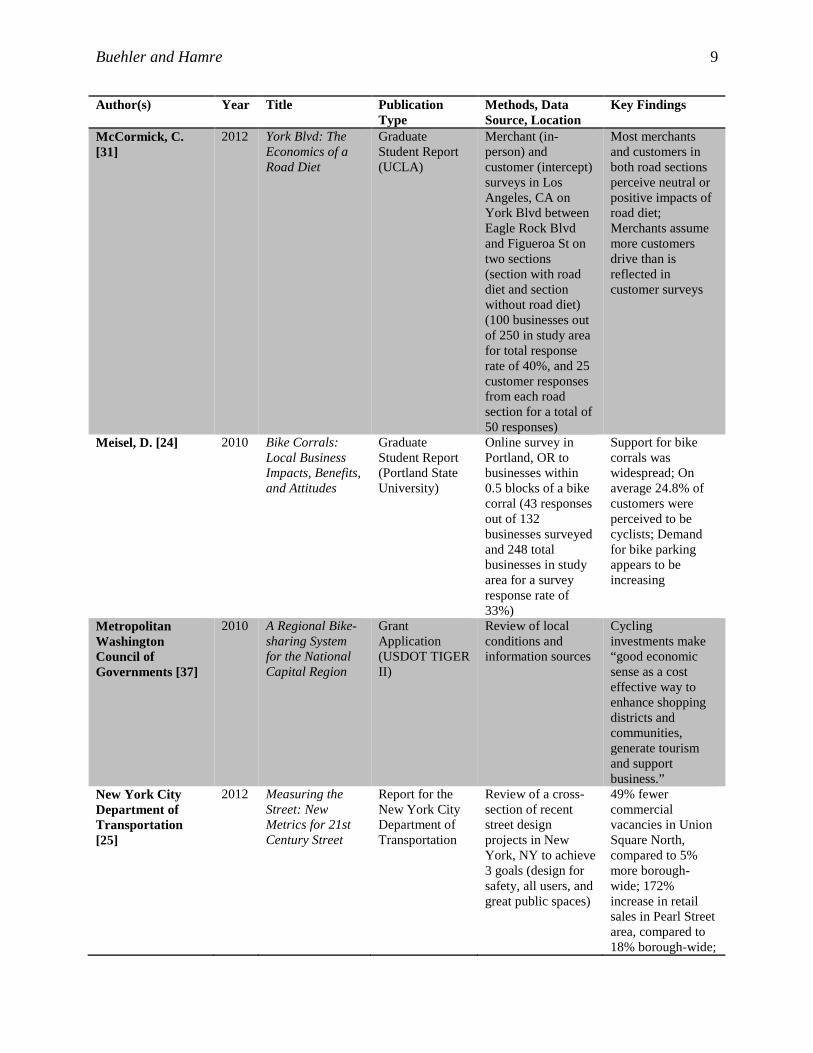
INTRODUCTION 67 68 Bikesharing, a rapidly growing and flexible form of transportation, offers a wide range of 69 benefits. These include reduced pollution and congestion, increased physical activity and access 70 to transit, and improved transportation system efficiency and neighborhood accessibility [1-4]. 71 However, the repurposing of limited public space for bikeshare docking stations has been met 72 with some resistance, and concerns have been raised regarding the impact of bikeshare systems 73 on local businesses [5, 6]. While supporters contend that bikesharing attracts new customers, 74 opponents argue that the systems actually deter customers and are a waste of valuable public 75 space [7]. 76 77 The purpose of this study is to investigate the economic benefits of bikesharing, with a particular 78 focus on commercial areas adjacent to bikeshare docking stations. First, we present an overview 79 of research on the economic effects of cycling. Then we describe our empirical method for 80 studying the economic effects surrounding five Capital Bikeshare (“CaBi”) stations in 81 Washington, DC, which entailed both a user intercept survey and a door-to-door survey of local 82 businesses. Finally, we present our empirical analysis and results, and conclude with a discussion 83 of our findings. 84 85 LITERATURE REVIEW 86 87 Interest in the economic effects of cycling is growing. A number of recent studies have 88 investigated: 1) the relationship between mode choice and spending patterns; 2) the relationship 89 between cycling infrastructure and spending; 3) whether bikesharing generates new travel and 90 spending; and 4) business perceptions regarding bikesharing systems and cycling in general. This 91 is an emerging area of research with only a few peer-reviewed publications. Table 1 presents an 92 overview of both domestic and international sources and includes two peer-reviewed articles, 93 four peer-reviewed conference papers, three reports for municipalities and one for a national 94 government transportation agency, seven graduate student research papers, twelve reports for 95 interest groups, two reports for CaBi, and a grant application. The studies originate from 96 geographic areas with a range of cycling levels, including relatively high and relatively low 97 cycling mode share. This may affect the transferability of any given study’s findings. 98 Nevertheless, across diverse geographic areas, a number of consistent key findings emerge from 99 the literature. 100 101 First, a number of studies suggest cyclists spend less per trip than drivers, but shop more 102 frequently, and therefore spend at levels comparable to or higher than customers arriving by car 103 [7-20]. For example, Clifton et al [12] analyzed consumer spending and mode choice using 104 intercept surveys at local businesses in the Portland, Oregon region. Overall, they found that 105 non-driving customers spent amounts similar to or greater than customers arriving by 106 automobile. Moreover, non-driving customers tended to visit spending locations more 107 frequently. Stzabinski [18] and Forkes & Smith Lea [20] found similar results for sections of 108 Toronto’s Bloor Street. Using surveys of businesses and pedestrians, they found that non-drivers 109 were likely to spend more per month than drivers. 110 111

Buehler and Hamre 4
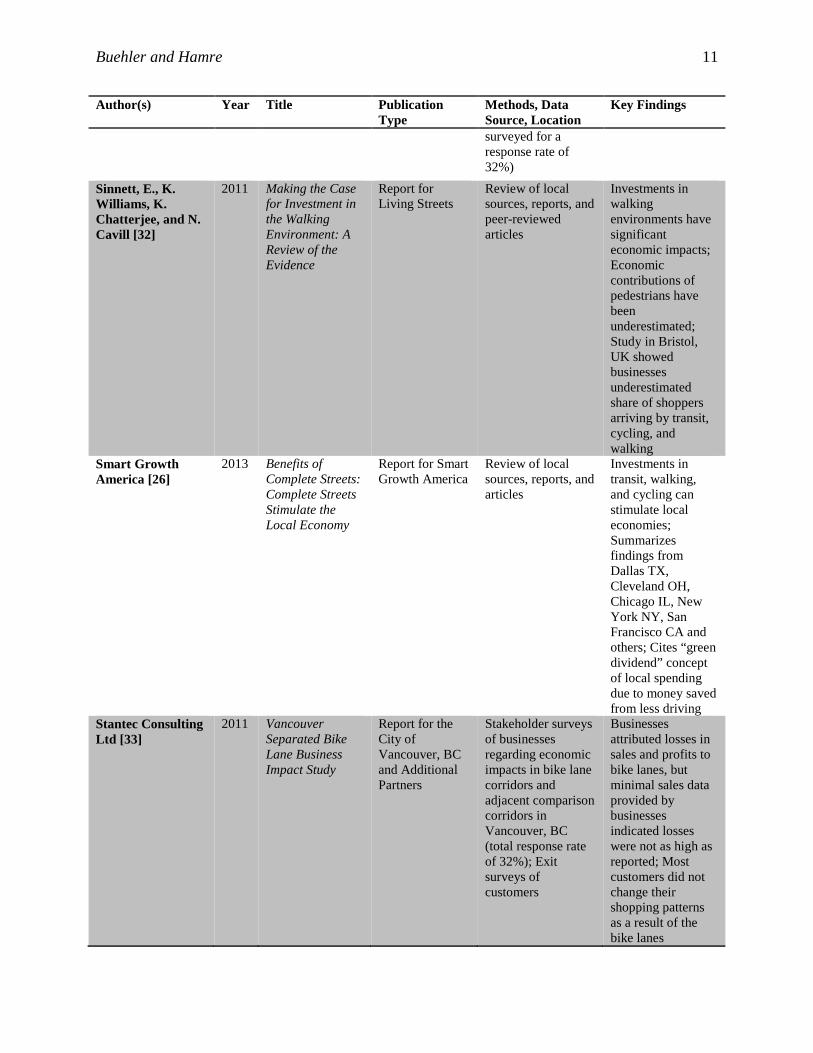
Second, a number of recent studies suggest that cycling infrastructure, traffic calming, and 112 investments in walking environments are effective at attracting customers [7, 18-26]. For 113 example, CaBi collected information through surveys of its members [22, 23] on the relationship 114 between the bikeshare system and patronage of local businesses and found that roughly 85% of 115 users reported being “somewhat” or “much more” likely to patronize a business accessible by 116 bikeshare. In addition, a study for the City of Austin, TX, estimated that the Downtown Bicycle 117 Boulevard was likely to have a “very positive” impact on retail sales [21]. 118 119 Third, there is evidence that bikesharing may generate new travel and spending [22, 23, 27]. For 120 example, Schoner et al [27] analyzed the economic activity associated with bikeshare stations in 121 the Twin Cities’s, MN, Nice Ride system using trip data, a survey of local businesses, and a 122 survey of system subscribers. They observed that bikeshare users often travel to spending 123 destinations and estimated that up to about 13% of trips would not have occurred without the 124 bikesharing system. In addition, Capital Bikeshare found that 9%-25% of users made induced 125 (new) shopping trips over the course of a month in the Washington, DC region [22, 23]. 126 127 Fourth, the literature suggests that businesses tend to have positive perceptions of bikesharing 128 systems and cycling in general, mixed perceptions regarding direct impacts on sales, mixed 129 levels of support for reallocating space to bikesharing or other cycling facilities, and a tendency 130 to overestimate the share of customers arriving by car vs. other modes [11, 15, 16, 18, 19, 27-131 35]. For example, LoSapio [30] conducted an analysis of the impact of Capital Bikeshare in the 132 Dupont Circle neighborhood of Washington, DC, and found that 11% of businesses observed an 133 increase in daily traffic and 13% perceived a positive impact on sales due to CaBi. In contrast, a 134 study for the City of Vancouver indicated that some businesses attributed losses in sales and 135 profits to newly installed bicycle lanes; nevertheless, review of a sample of sales data suggested 136 losses were not as high as reported by businesses during the initial survey [33]. Schoner et al [27] 137 found that 17% of businesses would support replacing car parking with bikeshare stations and 138 8% would support using sidewalk space for bikeshare stations. Despite their general support for 139 the Nice Ride program, the majority of businesses surveyed were not supportive of reallocating 140 space in favor of bikeshare. This may relate to the tendency to overestimate the share of 141 customers arriving by car observed in a number of locations [16, 34, 35]. 142 143 Together, these studies suggest that cycling and bikesharing are associated with consumer 144 spending and some induced travel. In addition, the literature suggests that cycling facilities can 145 attract customers to nearby businesses. Further, businesses are generally supportive of bikeshare 146 systems but have mixed perceptions about direct sales impacts and mixed degrees of support for 147 the reallocation of space for cycling infrastructure. Building on this growing body of research, 148 this present study makes a unique contribution by surveying bikeshare users at stations as well as 149 businesses located adjacent to the same stations. To date, none of the existing literature has 150 analyzed the impacts of a bikeshare system from both the user and business perspective. 151 152 153 154 155 156 157

Buehler and Hamre 5
TABLE 1 Overview of Literature on Economics and Cycling 158 Author(s) Year Title Publication
Type Methods, Data Source, Location
Key Findings
Alliance for Biking & Walking [8]
2014 Bicycling and Walking in the United States: 2014 Benchmarking Report
Report for the Alliance for Biking and Walking
Review of local sources, reports, and peer-reviewed articles
Summarizes findings of increased spending relating to cyclists and pedestrians in New York, NY, Fort Worth, TX, Twin Cities, MN, Portland, OR, San Francisco, CA, and Austin, TX
Angelou Economics [21]
2010 Literature Review and Impact of the Bicycle Boulevard
Report for the City of Austin, TX
Economic impact analysis of bicycle lanes and boulevards in Austin, TX using IMPLAN modeling, and data from the Texas Comptroller’s Office and City of Austin
Austin Downtown Bicycle Boulevard estimated to have a 'very positive' impact on property values, retail sales, and quality of life ($96,000-$274,000 additional annual sales revenue due to bicycle traffic by 2020)
Bent, E. and K. Singa [9]
2009 Modal Choices and Spending Patterns of Travelers to Downtown San Francisco, California: Impacts of Congestion Pricing on Retail Trade
Peer-Reviewed Article (Transportation Research Record)
Intercept surveys of a random sample of travelers over 16 years of age in San Francisco, CA on weekday afternoons & evenings in downtown retail areas (1,390 responses in downtown sample)
Transit riders, pedestrians, and cyclists spent less per trip than drivers, but visited downtown stores more frequently; Pedestrians spent the most per month of any modal group
Bernier-Heroux, L. and J. Ryan [10]
2012 East Village Shoppers Study: A Snapshot of Travel and Spending Patterns of Residents and Visitors in the East Village
Report for Transportation Alternatives
Intercept surveys of a random sample of pedestrians on First and Second Avenues in East Village neighborhood of New York, NY (420 responses)
Pedestrians and cyclists visit the neighborhood more often than drivers and transit riders, and spend more on a weekly basis; Drivers account for less than 4% of retail spending in the neighborhood
Buis, J. and R. Wittink [11]
2000 The Economic Significance of Cycling: A Study to Illustrate the Costs and Benefits of Cycling Policy
Report for Vereniging van Nederlandse Gemeenten (Association of Dutch Municipalities)
Review of local sources, reports, and peer-reviewed articles
Cyclists shop more frequently than drivers, and spend amounts comparable to motorists (over time)
Buehler and Hamre 6
Author(s) Year Title Publication Type
Methods, Data Source, Location
Key Findings
Capital Bikeshare [22]
2011 2011 Capital Bikeshare Member Survey Report
Report for Capital Bikeshare
Online survey of Capital Bikeshare members in the Washington DC region (3,731 responses from sample of 11,100 members representing half the total approximately 22,200 members, for a response rate of 34%)
83% of users reported being “somewhat” or “much more” likely to patronize a business if it were accessible by bikeshare; 44% of users made induced trips in prior month, including 25% who made induced shopping trips
Capital Bikeshare [23]
2013 2013 Capital Bikeshare Member Survey Report
Report for Capital Bikeshare
Online survey of Capital Bikeshare members in the Washington DC region (5,464 responses out of approximately 18,000 members for a response rate of 31%)
85% of users reported being “somewhat” or “much more” likely to patronize a business if it were accessible by bikeshare; 40% of users made induced trips in prior month, including 9% who made induced shopping trips
Clifton, K., K. Currans, C. Muhs, C. Ritter, S. Morrissey, and C. Roughton [12]
2012 Consumer Behavior and Travel Choices: A Focus on Cyclists and Pedestrians
Conference Paper (Transportation Research Board 92nd Annual Meeting)
Intercept surveys in Portland, OR at 78 businesses (restaurants, convenience stores, and drinking establishments) on weekday evenings (1,884 total responses, 52% combined response rate for 'short' and 'long' surveys)
Pedestrians, cyclists, and transit riders visit spending locations more frequently, and spent amounts similar to or greater than drivers
Clifton, K., S. Morrissey, and C. Ritter [36]
2012 Business Cycles: Catering to the Bicycling Market
Peer-Reviewed Article (TR News 280)
Review of local sources, reports, and peer-reviewed articles
Summarizes findings of lower or equal spending per trip but higher trip frequency of cyclists in Portland, OR, San Luis Obispo, CA, as well as Muenster in Germany and Utrecht and Amsterdam in The Netherlands

Buehler and Hamre 7
Author(s) Year Title Publication Type
Methods, Data Source, Location
Key Findings
Drennen, E. [28] 2003 Economic Effects of Traffic Calming on Urban Small Businesses
Graduate Student Report (San Francisco State University)
Interviews in San Francisco, CA with merchants in the service, food, and retail sectors via a modified random sampling about the Valencia Street bicycle lanes (27 businesses interviewed out of a total of 122 in the study area for a response rate of 22%)
65% of businesses perceive the general impact on business and sales of the bicycle lanes has been positive; 65% perceive no impact on the availability of customer parking and 15% perceive a positive impact on its availability; 44% perceive a positive impact for economic revitalization; 37% perceive a positive impact on sales with no businesses perceiving a negative impact
Fiets Beraad [14] 2011 Cyclists Spend as Much in Supermarket as Motorists
Report for Fiets Beraad
Review of local research project involving interviews of shoppers at 4 suburban supermarkets in The Netherlands
Cyclists visit the supermarket 3.2 times per week and spend about 50 euros per trip, while drivers visit 2.5 times per week and spend more than 50 euros per trip; the weekly share of customer turnover is approximately 48% cyclists and 52% drivers
Fleming, T., S. Turner, and L. Tarjomi [15]
2013 Reallocation of Road Space
Report for the New Zealand Transport Agency
Survey of retailers (in-person and mail) and shoppers (offered to customers by businesses after completion of a sale) in 3 central city locations and 6 arterial shopping areas in New Zealand (144 retailer surveys out of 547 total shops for a response rate of 26%, 1744 shopper responses)
Transit riders, pedestrians, and cyclists spend less per trip than drivers but shop more frequently; Cyclists spend only $4 less per trip than drivers in central city locations

Buehler and Hamre 8
Author(s) Year Title Publication Type
Methods, Data Source, Location
Key Findings
Flusche, D. [7] 2013 Bicycling Means Business: The Economic Benefits of Bicycle Infrastructure
Report for Advocacy Advance
Review of local sources, reports, and peer-reviewed articles
Summarizes findings relating to cycling and economic impacts, including spending and customer levels, in Chicago, IL, Hattiesburg, MN, Long Beach, CA, Memphis, TN, Portland, OR, Washington, DC, and other locations
Forkes, J. and N. Smith Lea [20]
2010 Bike Lanes, On-Street Parking and Business - Year 2 Report: A Study of Bloor Street in Toronto's Bloor West Village
Report for The Clean Air Partnership
In-person surveys of businesses and pedestrians in Toronto, ON on Bloor St between Kennedy Ave and Jane St (96 businesses out of 158 in the study area for a response rate of 61%, 510 pedestrian responses)
Customers who usually do not drive to the neighborhood are significantly more likely to spend over $100 per month than customers who usually drive
Lee, A. [29] 2008 What is the Economic Contribution of Cyclists Compared to Car Drivers in Inner Suburban Melbourne's Shopping Strips?
Graduate Student Report (University of Melbourne)
Intercept surveys of visitors in Melbourne, AUS near the Lygon Court Shopping Centre about spending and travel patterns (1020 responses); Public space mapping
Cyclists spend less per trip than drivers and have shorter trip durations; Authors speculate that cyclists visit study area more frequently; 67% of public space in the study area is allocated to cars, versus 3% for cyclists
Losapio, R. [30] 2013 Is Capital BikeShare Good for Business: Initial Evidence from the Dupont Circle Area in Washington, D.C.
Graduate Student Report (Virginia Tech)
In-person surveys in Washington, DC at 121 businesses (retail, entertainment, and restaurant) within 0.25 miles of a Dupont Circle bikeshare station (92% response rate from random sample of 131 businesses out of 602 businesses in study area)
11% of businesses observed an increase in daily traffic related to Capital Bikeshare; 13% of businesses perceived a positive impact on sales; 39.0% of businesses considered their location positive in relation to Capital Bikeshare
Buehler and Hamre 9
Author(s) Year Title Publication Type
Methods, Data Source, Location
Key Findings
McCormick, C. [31]
2012 York Blvd: The Economics of a Road Diet
Graduate Student Report (UCLA)
Merchant (in-person) and customer (intercept) surveys in Los Angeles, CA on York Blvd between Eagle Rock Blvd and Figueroa St on two sections (section with road diet and section without road diet) (100 businesses out of 250 in study area for total response rate of 40%, and 25 customer responses from each road section for a total of 50 responses)
Most merchants and customers in both road sections perceive neutral or positive impacts of road diet; Merchants assume more customers drive than is reflected in customer surveys
Meisel, D. [24] 2010 Bike Corrals: Local Business Impacts, Benefits, and Attitudes
Graduate Student Report (Portland State University)
Online survey in Portland, OR to businesses within 0.5 blocks of a bike corral (43 responses out of 132 businesses surveyed and 248 total businesses in study area for a survey response rate of 33%)
Support for bike corrals was widespread; On average 24.8% of customers were perceived to be cyclists; Demand for bike parking appears to be increasing
Metropolitan Washington Council of Governments [37]
2010 A Regional Bike-sharing System for the National Capital Region
Grant Application (USDOT TIGER II)
Review of local conditions and information sources
Cycling investments make “good economic sense as a cost effective way to enhance shopping districts and communities, generate tourism and support business.”
New York City Department of Transportation [25]
2012 Measuring the Street: New Metrics for 21st Century Street
Report for the New York City Department of Transportation
Review of a cross-section of recent street design projects in New York, NY to achieve 3 goals (design for safety, all users, and great public spaces)
49% fewer commercial vacancies in Union Square North, compared to 5% more borough-wide; 172% increase in retail sales in Pearl Street area, compared to 18% borough-wide;

Buehler and Hamre 10
Author(s) Year Title Publication Type
Methods, Data Source, Location
Key Findings
71% increase in retail sales on Fordham Road, compared to 23% borough-wide
O'Connor, D., J. Nix, S. Bradshaw, and E. Shiel [16]
2011 Report on Shopper Travel Behaviour in Dublin City Centre
Conference Paper (Irish Transport Research Network 2011 Proceedings)
Intercept survey of pedestrians in Dublin, IRE on Grafton and Henry Streets in the Dublin City Centre (1,009 total responses); In-person survey of store managers (60 total from the study area)
Pedestrians and cyclists spend lower amounts per trip but visit the area more often than drivers; Businesses over-estimate the share of customers arriving by car
Popovich, N. and S. Handy [17]
2014 Bicyclists as Consumers: Mode Choice and Spending Behavior in Downtown Davis, CA
Conference Paper (Transportation Research Board 93rd Annual Meeting)
Online surveys in Davis, CA, in 2009 and 2010, of residents regarding spending behavior (total of 2,043 responses for a response rate of 20.4%; subset of 1,677 responses used in the analysis)
Cyclists spent lower amounts per trip but shopped more frequently than drivers, leading to comparable spending across the two groups
Rowe, K. [38] 2013 Bikenomics: Measuring the Economic Impact of Bicycle Facilities on Neighborhood Business Districts
Graduate Student Report (University of Washington)
Analysis of retail sales data based on case studies in Seattle, WA of Greenwood Ave North and NE 65th Street Neighborhood Business Districts after installation of bicycle facilities
Bicycle facilities and loss of automobile travel lanes and car parking did not result in negative impact on retail sales
Schoner, J., R. A. Harrison, and X. Wang [27]
2012 Sharing to Grow: Economic Activity Associated with Nice Ride Bike Share Stations
Graduate Student Report (University of Minnesota)
Trip data for all 116 Nice Ride stations in the Twin Cities, MN, as of 2011, and surveys of businesses (in-person) and users (online) (29 businesses out of 68 businesses affiliated with Nice Ride and/or in station areas identified in a spatial sample for a response rate of 43%, 1,197 users out of 3,693 total
Station activity is positively associated with food-related businesses and job accessibility; Businesses have generally positive attitudes toward Nice Ride; Users often travel to spending destinations; Some new trips likely occur due to Nice Ride
Buehler and Hamre 11
Author(s) Year Title Publication Type
Methods, Data Source, Location
Key Findings
surveyed for a response rate of 32%)
Sinnett, E., K. Williams, K. Chatterjee, and N. Cavill [32]
2011 Making the Case for Investment in the Walking Environment: A Review of the Evidence
Report for Living Streets
Review of local sources, reports, and peer-reviewed articles
Investments in walking environments have significant economic impacts; Economic contributions of pedestrians have been underestimated; Study in Bristol, UK showed businesses underestimated share of shoppers arriving by transit, cycling, and walking
Smart Growth America [26]
2013 Benefits of Complete Streets: Complete Streets Stimulate the Local Economy
Report for Smart Growth America
Review of local sources, reports, and articles
Investments in transit, walking, and cycling can stimulate local economies; Summarizes findings from Dallas TX, Cleveland OH, Chicago IL, New York NY, San Francisco CA and others; Cites “green dividend” concept of local spending due to money saved from less driving
Stantec Consulting Ltd [33]
2011 Vancouver Separated Bike Lane Business Impact Study
Report for the City of Vancouver, BC and Additional Partners
Stakeholder surveys of businesses regarding economic impacts in bike lane corridors and adjacent comparison corridors in Vancouver, BC (total response rate of 32%); Exit surveys of customers
Businesses attributed losses in sales and profits to bike lanes, but minimal sales data provided by businesses indicated losses were not as high as reported; Most customers did not change their shopping patterns as a result of the bike lanes

Buehler and Hamre 12
Author(s) Year Title Publication Type
Methods, Data Source, Location
Key Findings
Sustrans [34] 2003 Traffic Restraint and Retail Vitality
Report for Sustrans
Review of local sources, reports, and peer-reviewed articles
Reference to studies in Graz, Bristol, Leicester, and Edinburgh on tendency for businesses to overestimate share of customers arriving by car and correspondingly support increased car parking
Sustrans [35] 2006 Shoppers and How They Travel
Report for Sustrans
Overview of study of business impacts of VIVALDI “showcase” bus routes in Bristol, UK, comprised of interviews with 126 retailers and 840 customers
Retailers overestimated share of customers arriving by car; Retailers attributed losses in business to bus routes, but most customers reported no change in shopping patterns; Investments in the walking environment should be effective at attracting customers
Sztabinski, Fred [18]
2009 Bike Lanes, On-Street Parking and Business: A Study of Bloor Street in Toronto's Annex Neighborhood
Report for The Clean Air Partnership
In-person surveys of businesses and pedestrians in Toronto, ON on Bloor St between Spadina Ave and Bathurst St (61 businesses out of 110 in the study area for a response rate of 55%, 538 pedestrian responses)
Customers arriving by walking and cycling shop more frequently and spend more per month than customers arriving by automobile or public transport
Tolley, R. [19] 2011 Good for Business: The Benefits of Making Streets More Walking and Cycling Friendly
Discussion Paper (National Heart Foundation of Australia)
Review of local sources, reports, and peer-reviewed articles
Traffic calming and facilities for pedestrians and bicyclists are associated with increased retail spending, higher visitation frequencies, and longer dwell times
Buehler and Hamre 13
Author(s) Year Title Publication Type
Methods, Data Source, Location
Key Findings
Wang, X., G. Lindsey, J. Schoner, and A. Harrison [39]
2012
Modeling Bike Share Station Activity: The Effects of Nearby Businesses and Jobs on Trips to and from Stations
Conference Paper (Transportation Research Board 92nd Annual Meeting)
Trip data for all 116 Nice Ride stations in the Twin Cities, MN, as of 2011 (mean annual trips per station of 3,749)
Station activity positively associated with food-related businesses and employment, but not general retail establishments
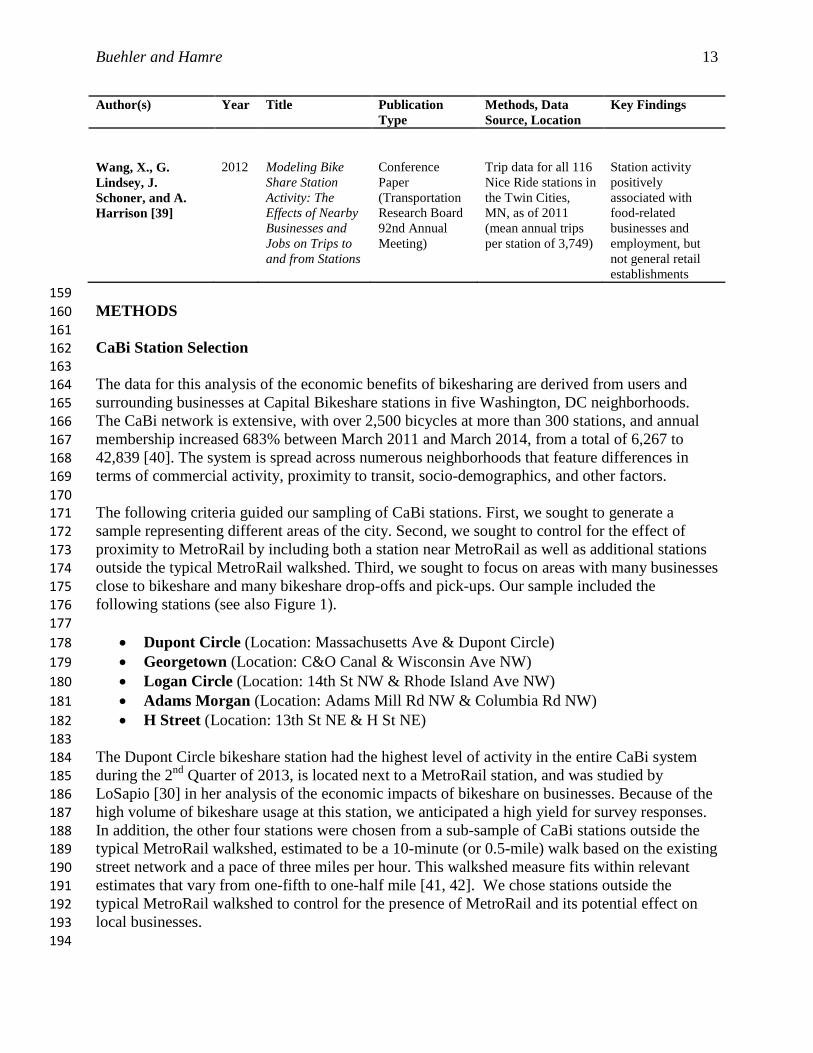
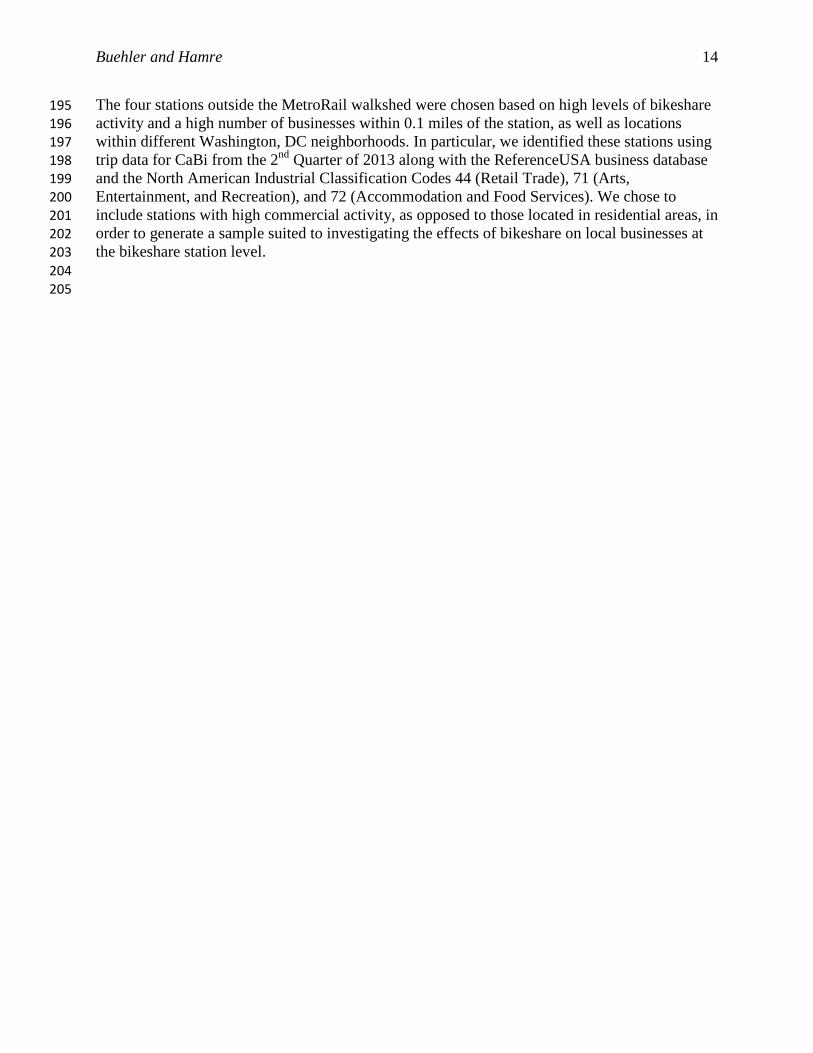
159 METHODS 160 161 CaBi Station Selection 162 163 The data for this analysis of the economic benefits of bikesharing are derived from users and 164 surrounding businesses at Capital Bikeshare stations in five Washington, DC neighborhoods. 165 The CaBi network is extensive, with over 2,500 bicycles at more than 300 stations, and annual 166 membership increased 683% between March 2011 and March 2014, from a total of 6,267 to 167 42,839 [40]. The system is spread across numerous neighborhoods that feature differences in 168 terms of commercial activity, proximity to transit, socio-demographics, and other factors. 169 170 The following criteria guided our sampling of CaBi stations. First, we sought to generate a 171 sample representing different areas of the city. Second, we sought to control for the effect of 172 proximity to MetroRail by including both a station near MetroRail as well as additional stations 173 outside the typical MetroRail walkshed. Third, we sought to focus on areas with many businesses 174 close to bikeshare and many bikeshare drop-offs and pick-ups. Our sample included the 175 following stations (see also Figure 1). 176 177
• Dupont Circle (Location: Massachusetts Ave & Dupont Circle) 178 • Georgetown (Location: C&O Canal & Wisconsin Ave NW) 179 • Logan Circle (Location: 14th St NW & Rhode Island Ave NW) 180 • Adams Morgan (Location: Adams Mill Rd NW & Columbia Rd NW) 181 • H Street (Location: 13th St NE & H St NE) 182
183 The Dupont Circle bikeshare station had the highest level of activity in the entire CaBi system 184 during the 2nd Quarter of 2013, is located next to a MetroRail station, and was studied by 185 LoSapio [30] in her analysis of the economic impacts of bikeshare on businesses. Because of the 186 high volume of bikeshare usage at this station, we anticipated a high yield for survey responses. 187 In addition, the other four stations were chosen from a sub-sample of CaBi stations outside the 188 typical MetroRail walkshed, estimated to be a 10-minute (or 0.5-mile) walk based on the existing 189 street network and a pace of three miles per hour. This walkshed measure fits within relevant 190 estimates that vary from one-fifth to one-half mile [41, 42]. We chose stations outside the 191 typical MetroRail walkshed to control for the presence of MetroRail and its potential effect on 192 local businesses. 193 194
Buehler and Hamre 14
The four stations outside the MetroRail walkshed were chosen based on high levels of bikeshare 195 activity and a high number of businesses within 0.1 miles of the station, as well as locations 196 within different Washington, DC neighborhoods. In particular, we identified these stations using 197 trip data for CaBi from the 2nd Quarter of 2013 along with the ReferenceUSA business database 198 and the North American Industrial Classification Codes 44 (Retail Trade), 71 (Arts, 199 Entertainment, and Recreation), and 72 (Accommodation and Food Services). We chose to 200 include stations with high commercial activity, as opposed to those located in residential areas, in 201 order to generate a sample suited to investigating the effects of bikeshare on local businesses at 202 the bikeshare station level. 203 204 205

Buehler and Hamre 15
FIGURE 1 Capital Bikeshare Station Sample in Relation to Streets and MetroRail Stations 206 207
208

Buehler and Hamre 16
User and Business Surveys 209
For the user and business surveys we worked with Virginia Tech graduate students to design the 210 surveys and to collect the data. The user survey investigated motivations for using CaBi and the 211 spending patterns of CaBi users surrounding CaBi stations. The user survey contained a total of 212 23 questions and relied on the intercept method of approaching users as they returned bikes to 213 stations. The surveys were conducted in 2-4 hour shifts over four weekends (Friday afternoon 214 through Sunday) in October 2013 at the five CaBi stations selected for our analysis. The survey 215 focused on spending after the most recent CaBi trip, but also included questions regarding the 216 frequency of trips to the area and use of the CaBi system. We collected the data on Friday 217 afternoons and weekends, when discretionary trips were more likely and commute trips were less 218 likely. We anticipated a higher participation rate from non-commuters, due to fewer time 219 constraints on discretionary trips. In addition, we expected that surveying on weekends would 220 result in a higher share of CaBi users going to spending destinations. 221 222 The business survey contained a total of 22 questions and relied on in-person impromptu 223 (unscheduled) interviews with staff (owners, managers, and other staff) at local businesses. The 224 surveys were conducted over five weeks in October and November 2013 at businesses located 225 within a narrow radius (0.1 miles) of our CaBi station sample. We obtained an initial list of 326 226 businesses in this radius using the North American Industrial Classification System codes for 227 Retail Trade, Arts, Entertainment, and Recreation, and Accommodation and Food Services [43]. 228 With the survey, we collected information from businesses about their perceptions of the impact 229 of the CaBi system. 230 231 We used simple descriptive statistics and appropriate bivariate analysis techniques to investigate 232 the relationships between independent variables and stated or perceived economic impact as 233 reported by users and businesses. Details about the analysis techniques are provided in the 234 sections below. 235 236 RESULTS 237 238 User Survey 239 240 Our user survey yielded a total of 333 responses, with an approximate response rate of at least 241 50% per station and shift. In comparing the demographic profile of users in our sample to the 242 demographic profile of users in the CaBi Member Survey, we found many similarities [23]. Most 243 users in our sample were young (67% under the age of 35) and male (65%), while nearly all 244 respondents (94%) had earned a bachelor’s degree. A small share of our sample (10%) lived in a 245 household with an income less than $35,000, while over 25% reported living in a household with 246 an income above $125,000. Most (66%) of the users in our sample were annual members of 247 CaBi. 248 249 Users were motivated to use CaBi due to shorter travel times (73%), enjoyment (42%), exercise 250 (41%), and lower travel costs (25%). In addition, most users (66%) reported traveling to a 251 spending destination (e.g. food-related, retail, or entertainment). Users traveling to spending 252 destinations spent varying amounts, with 65% planning to spend between $10-$49 and 29% 253
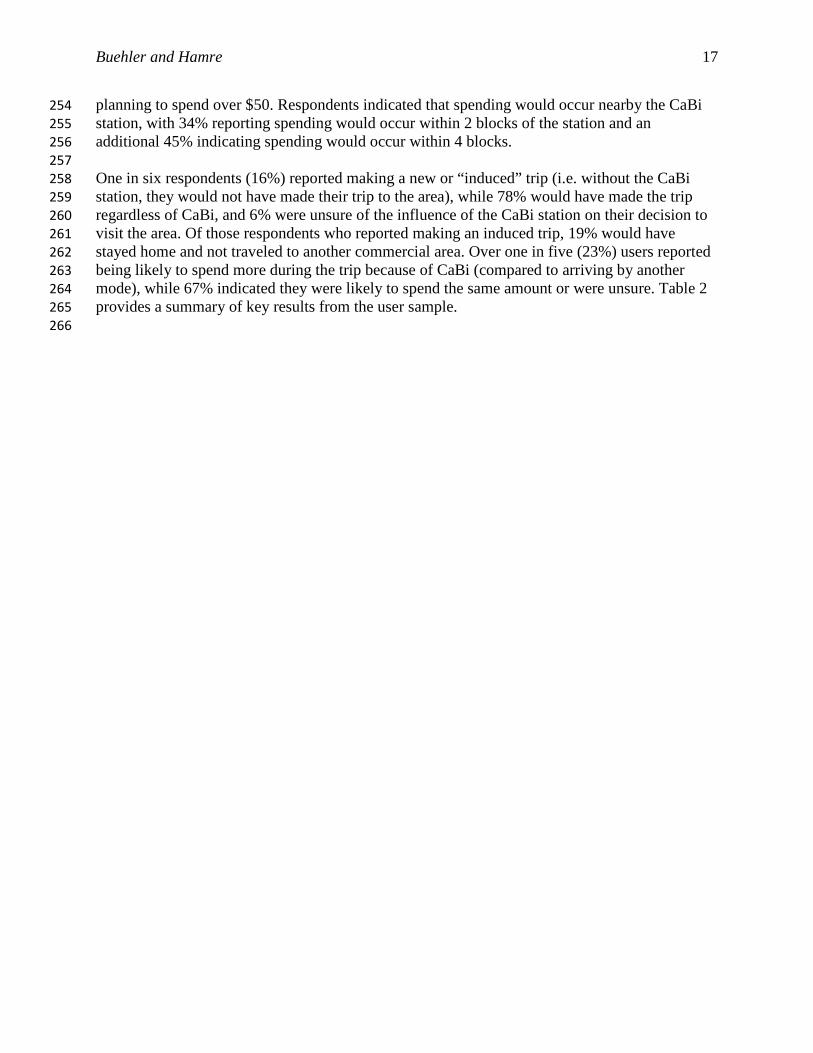
Buehler and Hamre 17
planning to spend over $50. Respondents indicated that spending would occur nearby the CaBi 254 station, with 34% reporting spending would occur within 2 blocks of the station and an 255 additional 45% indicating spending would occur within 4 blocks. 256 257 One in six respondents (16%) reported making a new or “induced” trip (i.e. without the CaBi 258 station, they would not have made their trip to the area), while 78% would have made the trip 259 regardless of CaBi, and 6% were unsure of the influence of the CaBi station on their decision to 260 visit the area. Of those respondents who reported making an induced trip, 19% would have 261 stayed home and not traveled to another commercial area. Over one in five (23%) users reported 262 being likely to spend more during the trip because of CaBi (compared to arriving by another 263 mode), while 67% indicated they were likely to spend the same amount or were unsure. Table 2 264 provides a summary of key results from the user sample. 265 266

Buehler and Hamre 18
267 268 TABLE 2 Summary of Select 2013 Virginia Tech Capital Bikeshare User Survey Results 269
270
271
272
273
274 275 276 277 278 279 280 281 282 283 284 285 286
User Survey % N Top reasons for using CaBi Travel Time 73% 333 Enjoyment 42% 333 Exercise 41% 333 Travel Costs 25% 333 Share of Users Traveling to Spending Destination 66% 333 Spending Less Than $10 6% 198 Spending $10-$49 65% 198 Spending $50 or More 29% 198 Spending Within 2 Blocks of Station 34% 190 Spending Within 4 Blocks of CaBi Station 45% 190 Spending Greater than 4 Blocks/Did Not Know 22% 190 Share of Users Making New/Induced Trip 16% 326 Share of Users Making a Trip Regardless of CaBi 78% 326 Share of Users Spending More Because of CaBi 23% 260

Buehler and Hamre 19
In addition to the results presented above on the user sample as a whole, we investigated the 287 significance of a series of bivariate relationships between user characteristics and economic 288 effects. In particular, we focused on whether new trips, trips to spending destinations, new trips 289 to spending destinations, or spending levels varied across a series of user characteristics. Table 3 290 summarizes the dependent and independent variables analyzed, along with their level of 291 measurement and definition. 292 293 294

Buehler and Hamre 20
TABLE 3 Description of Dependent and Independent Variables for User Survey Bivariate 295 Analysis 296 Variable Description New/Induced Trip (Dependent Variable)
Nominal, (New/Induced Trip =1 vs Not a New/Induced Trip=0)
Spending Trip (Dependent Variable)
Nominal, (Spending Trip=1 vs Not a Spending Trip=0)
Spending Level (Dependent Variable)
Ordinal, 3 categories (Less than $10, $10-$49, $50 or More)
New Trip with Spending (Dependent Variable)
Nominal, (New/Induced Trip to Spending Destination=1 vs Not a New Trip to Spending Destination=0)
Annual Member (Independent)
Nominal, (Annual Member=1 vs Daily or Monthly Member=0)
Cyclist Type (Independent)
Nominal, 4 categories (Strong, Moderate, Curious, Not a Cyclist)
Education (Independent)
Nominal, (Bachelor’s Degree & Higher=1 vs Less than Bachelor’s=0)
Gender (Independent)
Nominal, (Male=1 vs Female=0)
Income Level (Independent)
Ordinal, 4 categories (<$35K, $35K-$74,999, $75K-$124,999, >$125,000)
Joined for Fun (Independent)
Nominal, 1/0 (Joined for Fun v Did not Join for Fun)
Joined to Save Money (Independent)
Nominal, (Joined to Save Money=1 vs Did not Join to Save Money=0)
Number of CaBi Trips (Independent)
Interval-Ratio (Number of CaBi trips in Previous Month)
Station (Independent)
Nominal, 5 stations (Adams Morgan, Dupont Circle, Georgetown, H Street, Logan Circle)
Trip by CaBi b/c of Cost (Independent)
Nominal, (Made trip by CaBi because of cost=1 vs Did not Make Trip Because of Cost=0)
Trip by CaBi b/c of Speed (Independent)
Nominal, (Made trip by CaBi because of Speed=1 vs Did not Make Trip Because of Speed=0)
297 298

Buehler and Hamre 21
We performed statistical tests to evaluate the significance of the bivariate relationships. 299 Specifically, because all of our dependent variables were either measured on the nominal or 300 ordinal level of measurement, Chi2 tests were appropriate. In a few instances, cell frequencies 301 were small, casting doubt on the reliability of Chi2 tests. In these instances, we also used Fisher’s 302 Exact Tests. However, the outcomes of the statistical tests did not vary between Chi2 and 303 Fisher’s Exact Tests in any of those instances. Thus for brevity, we report all Chi2 p-values in 304 Table 4, even though some are based on Fisher’s Exact Test. In addition, we also calculated 305 appropriate measures of bivariate association to evaluate the strength and direction of the 306 relationships. Specifically, we used Cramer’s V for the nominal dependent variables and 307 proportional reduction in error (“PRE”) measures for the ordinal dependent variable (spending 308 level), and we used Lambda for the nominal independent variables and Gamma for the ordinal 309 and interval/ratio independent variables. Table 5 summarizes the results of our analysis of these 310 bivariate relationships. 311 312 Income level had significant positive relationships with induced trips, spending levels, and 313 new/induced trips with spending. Joining CaBi to save money had a significant positive 314 association with induced trips. In addition, induced trips varied significantly by station area, with 315 the Dupont Circle and Georgetown stations reporting the highest shares of new trips and H Street 316 reporting the lowest share. For spending trips, we found a significant association with station 317 area, with Georgetown and H Street reporting the highest shares of spending trips and Logan 318 Circle reporting the lowest. Joining CaBi for enjoyment and taking the trip by CaBi because of 319 cost savings had a significant association with spending level. Finally, new trips with spending 320 had a significant association with station area, with Dupont Circle and Georgetown having the 321 highest shares and H Street the lowest. 322 323

Buehler and Hamre 22
324 TABLE 4 Summary of User Survey Bivariate Relationships 325 Independent Variables
Dependent Variable Chi2 p-value
New/Induced Trip
Spending Trip
Spending Level
New Trips With Spending
Annual Member >0.10 >0.10 >0.10 >0.10 Cyclist Type >0.10 >0.10 >0.10 >0.10 Education >0.10 >0.10 >0.10 >0.10 Gender >0.10 >0.10 >0.10 >0.10 Income Level 0.060 >0.10 0.019 0.017 Joined for Fun >0.10 >0.10 0.070 >0.10 Joined to Save Money 0.025 >0.10 >0.10 >0.10 Number of CaBi trips >0.10 >0.10 >0.10 >0.10 Station 0.049 0.000 >0.10 0.033 Trip by CaBi b/c Cost >0.10 >0.10 0.099 >0.10 Trip by CaBi b/c Speed >0.10 >0.10 >0.10 >0.10
(Note: significant p-values (<.1) in bold) 326 327 328

Buehler and Hamre 23
Business Survey 329 330 Our business survey yielded a total of 140 responses out of the initial list of 326 total businesses 331 in the survey area, for an overall response rate of approximately 40%, with variations across 332 station areas, from approximately 24% in Adams Morgan to 51% in H Street, as well as business 333 type, from 17% for non-food and non-retail businesses to 51% for food-related businesses and 334 63% for retail businesses. 335 336 Most businesses were aware of the CaBi system (88%), and 32% of respondents reported having 337 experience using the system. Table 5 shows that while most businesses did not know if CaBi had 338 any effect on the customer traffic levels, approximately 10% perceived an increase in overall 339 customer traffic due to CaBi. One in five businesses attributed a positive impact on sales to 340 CaBi, 36% reported a neutral impact, 43% were unsure, and 1% perceived a negative impact. 341 Most businesses (70%) indicated CaBi had positively impacted the surrounding area, while 342 another 7% reported a neutral impact. 343 344 Most businesses (59%) indicated they would like to see CaBi expand. Regarding public space 345 tradeoffs, 22% of businesses indicated they would have a positive reaction to replacing sidewalk 346 space with a CaBi station and 29% would have a positive reaction to replacing car parking space, 347 while 26% would be neutral regarding sidewalk space and 32% would be neutral regarding car 348 parking space. 349 350 351

Buehler and Hamre 24
TABLE 5 Summary of Select 2013 Virginia Tech Capital Bikeshare Business Survey 352 Results 353 Business Survey % N Impact of CaBi on Overall Customer Traffic Increased 10% 133 No Change 28% 133 Decreased 1% 133 Unsure 61% 133 Impact of CaBi on Overall Sales Positive 20% 133 Neutral 36% 133 Negative 1% 133 Unsure 43% 133 Impact on the Surrounding Area Positive 70% 133 Neutral 7% 133 Negative 2% 133 Unsure 22% 133 Would Like CaBi to Install New Stations 59% 138 Remove Existing Stations 1% 138 Neither Install Nor Remove Stations 27% 138 Unsure 13% 138 Reaction to Replacing Sidewalk Space With CaBi Positive 22% 138 Neutral 26% 138 Negative 52% 138 Reaction to Replacing Car Parking With CaBi Positive 29% 136 Neutral 32% 136 Negative 39% 136 354 355

Buehler and Hamre 25
In addition to the results presented above on the business sample as a whole, we investigated the 356 significance of a series of bivariate relationships to identify correlates of perceived economic 357 effects. In particular, we focused on whether business perceptions of CaBi’s impact on sales, 358 perceptions of overall changes in sales, support for installing more CaBi stations, and support for 359 replacing car parking with CaBi stations varied across a series of business characteristics. Table 360 6 summarizes the dependent and independent variables analyzed, along with their level of 361 measurement and definition. 362 363 364

Buehler and Hamre 26
TABLE 6 Description of Dependent and Independent Variables for User Survey Bivariate 365 Analysis 366 Variable Description CaBi Impact on Sales (Dependent, Independent)
Nominal, Perceived Impact of CaBi on Sales (Positive, Neutral, Negative, Don’t Know)
Overall Sales (Dependent)
Nominal, Perceived Change in Overall Sales in Previous 12 months (Increased, No Change, Decreased, Don’t Know)
Install More CaBi Stations (Dependent, Independent)
Nominal, (Interested in Seeing More CaBi Stations Installed=1 vs No Change or Interested in Seeing Stations Removed=0)
Car Parking Change (Independent)
Nominal, (Perceive Replacing Car Parking for CaBi Positively=1 vs Perceive Replacing Car Parking for CaBi Negatively or Neutrally=0)
Station (Independent)
Nominal, 5 stations (Adams Morgan, Dupont Circle, Georgetown, H Street, Logan Circle)
Business Type (Independent)
Nominal, 3 categories (Retail, Food-Related, Other)
Business Size (Independent)
Ordinal, 4 categories (1-9 workers, 10-19 workers, 20-29 workers, >30 workers)
367 368

Buehler and Hamre 27
We performed statistical tests to evaluate the significance of the relationships. We used the same 369 methodology and testing procedures as explained in the user survey section. Table 7 summarizes 370 the results of our analysis of these bivariate relationships. 371 372 We did not find significant variation regarding business perceptions of CaBi’s impact on sales 373 across station areas, business type, or business size. Perceptions regarding overall sales 374 significantly varied across station areas, with the highest share of businesses perceiving 375 increased sales in Georgetown and the lowest share in Dupont Circle. We found a significant and 376 positive relationship between support for installing more CaBi stations and perceived impact of 377 CaBi on sales. Finally, we found a significant and positive association between support for 378 replacing car parking with CaBi and perceived impact of CaBi on sales (at the 10% level) as well 379 as support for installing more CaBi stations. 380 381 382

Buehler and Hamre 28
TABLE 7 Summary of Business Survey Bivariate Relationships 383 Independent Variable
Dependent Variable Chi2 p-value CaBi Impact on Sales
Overall Sales
Install More CaBi Stations
Car Parking Change
Station Area >0.10 0.064 >0.10 >0.10 Business Type >0.10 >0.10 >0.10 >0.10 Business Size >0.10 >0.10 >0.10 >0.10 CaBi Impact on Sales
NA >0.10 0.023 0.078
Install More CaBi Stations
NA 0.030
(Note: significant p-values (<.1) in bold) 384 385 386

Buehler and Hamre 29
5. Discussion and Conclusions 387
Our analysis of five Capital Bikeshare station areas suggests that bikeshare stations may have 388 significant economic benefits, based on the intentions and perceptions of users and businesses 389 surveyed in this study. Both users and businesses perceive monetary and non-monetary benefits. 390 For users, these benefits take the form of lower travel costs and time savings, with most users 391 (73%) motivated to use CaBi because cycling was faster than other modes and 25% motivated 392 because using the system offered monetary savings. For businesses, these benefits take the form 393 of increased customer traffic and sales and perceived positive impacts on the surrounding area, 394 with 20% of businesses reporting a positive impact on customer sales and 70% stating a positive 395 impact on the area. 396 397 Our user survey suggests that CaBi stations are encouraging new trips and new spending, and the 398 results of our business survey support this finding. While at least some of the trips and spending 399 reported by users are likely to be redistributive (i.e. shifting trips and spending from another 400 location), a portion of the trips and spending appears to be induced. About one in six users made 401 a new trip because of the presence of the CaBi station, and 19% of those traveling to the area 402 regardless of CaBi reported increased spending due to their use of CaBi. It seems that at least a 403 portion of the travel cost savings for CaBi users may be getting spent at businesses surrounding 404 stations. 405 406 The bivariate analysis of our user survey suggests there is no difference in the rate of new trips, 407 spending trips, spending levels, and new trips to spending locations based on annual membership 408 status, cyclist type, education, gender, number of recent CaBi trips, or stating speed as the reason 409 for choosing CaBi. Economic theory suggests that income is associated with spending patterns, 410 and we found this holds for CaBi users as well, with household income positively associated 411 with new trips, spending at higher rates, and new trips with spending in the area surrounding the 412 bikeshare station. 413 414 The bivariate analysis of our business survey suggests there is no significant difference across 415 station areas, business types (e.g. retail, food, other), and business size in perceived impacts of 416 CaBi on sales, support for the installation of more CaBi stations, or support for replacing car 417 parking with CaBi stations. Moreover, we found that businesses with a perception of positive 418 impacts on sales support expansion of the CaBi system and reallocation of space toward CaBi. 419 Similarly, businesses that support expansion of the system were more likely to support 420 reallocation of space away from car parking and toward CaBi. Together, these findings suggest 421 that bikeshare operators seeking to expand their bikeshare system should start near businesses 422 that perceive positive impacts on sales, and operators seeking to replace car parking with CaBi 423 stations may find this most feasible near businesses that support expansion of the system as a 424 whole. 425 426 Direct comparison of our findings to those of other studies examining the economic effects of 427 cycling should be undertaken with caution, due to variations in factors such as station sampling, 428 study area geographies, and respondent demographics. With that in mind, we note that our 429 findings are consistent with a number of findings presented in other recent studies. 430 431

Buehler and Hamre 30
Our findings regarding top motivations for joining CaBi are slightly lower, but largely consistent 432 with those given in the most recent CaBi annual member surveys: 73% in our sample vs. 85%-433 91% of annual members state travel time as a reason; 25% in our sample vs. 46%-52% of annual 434 members identified travel costs [22, 23]. 435 436 Our study also lends support to the recent findings that suggest cycling facilities attract 437 customers to nearby businesses. We found that 63% of users traveling to spending destinations 438 planned to spend $10-$49, which is higher than the $7-$14 estimated spending per trip found by 439 Schoner et al [27]. Our finding regarding the close proximity of spending near CaBi stations (a 440 combined total of 79% of users traveling to spending destinations intended to visit a business 441 within 2 or 4 blocks of the station) is consistent with the recent CaBi annual membership 442 surveys, which indicated 83%-85% of users were more likely to visit businesses near bikeshare 443 stations [22, 23]. 444 445 Our findings regarding new travel and new spending in relation to bikesharing are consistent 446 with other recent estimates. While our finding that 16% of users made induced trips is higher 447 than the upper range of 13% given by Schoner et al [27], it is within the range of 9%-25% 448 reported by Capital Bikeshare [22, 23]. 449 450 Our study is also consistent with recent findings of overall positive perceptions of bikesharing 451 and cycling among businesses, but mixed perceptions regarding impacts on sales and mixed 452 support for reallocating space toward bikesharing. Both Schoner et al [27] and the present study 453 found more support among businesses for replacing car parking with bikeshare stations than for 454 replacing sidewalk space. However, we found a higher level of support in our five Washington, 455 DC neighborhoods than was found for the Minneapolis/St. Paul area (29% in our study vs. 17% 456 in their study for car parking and 22% in our study vs. 8% in their study for sidewalk space). Our 457 results were also largely comparable to LoSapio’s [30] analysis of the Dupont Circle 458 neighborhood (10% of businesses perceived increases in daily traffic in our study vs. 11% in her 459 study, and 20% perceived increases in sales in our study vs. 13% in her study). 460 461 Our bivariate analysis found a positive correlation between perceived impact of CaBi on sales 462 and support for both system expansion and the replacement of car parking with bikeshare. Future 463 studies could further investigate factors that influence support for the reallocation of space 464 toward bikesharing; it could be that more accurate perceptions by businesses of the travel 465 patterns of their customers could lead to greater support for bikesharing and cycling in general. 466 467 Our study design warrants several caveats. We collected data during a single time period, and 468 our station selection criteria provided us with a sample characterized by high commercial 469 activity. Our data are therefore not able to capture changes over time or across the entire CaBi 470 system. In addition, we relied on a single bikeshare station near a MetroRail station; future 471 studies could collect more data co compare the effect of proximity to MetroRail. We also limited 472 data collection for users to weekends to focus on discretionary trips, so our analysis may not 473 relate to all trip types (e.g. commuting) and days of the week. Our results also rely on the 474 comprehension of our survey participants and their stated (rather than revealed) behavior and 475 perceptions. Finally, our methodology did not capture spending information across modal 476 groups—excluding pedestrians, drivers, and transit users. 477

Buehler and Hamre 31
478 Overall, we find evidence that bikesharing can benefit both users and businesses by enabling 479 new trips and spending. Users and businesses both reported monetary and non-monetary benefits 480 from CaBi. In addition, we found mixed support for the reallocation of public space among 481 businesses, but a majority (61%) that would react positively or neutrally to the replacement of 482 car parking with a CaBi station. Our study may inform ongoing debates surrounding the effects 483 of bikesharing in relation to local businesses. 484 485

Buehler and Hamre 32
ACKNOWLEDGEMENTS 486 487 We would like to acknowledge the following graduate students for their data collection and 488 analysis efforts as part of a Fall 2013 studio class for the Virginia Tech Master’s in Urban and 489 Regional Planning program: Ryan Anderson, Eric Childs, Yasmine Doumi, Justin Godard, Chris 490 Marshall, Ashley Matthews, Katie McConnell, John Stowe, Nathan Wallingford, and Eric Weisz. 491 In addition, we would like to acknowledge the City of Alexandria Department of Transportation 492 and Environmental Services, BikeArlington, and Capital Bikeshare for their cooperation, as well 493 as all of our survey participants, including Capital Bikeshare users and local business owners and 494 employees. 495 496

Buehler and Hamre 33
REFERENCES 497 498 1. DeMaio, P., Bike-Sharing: History, Impacts, Models of Provision, and Future. Journal of Public 499
Transportation, 2009. 12(4): p. 41-56. 500 2. Shaheen, S., et al., Public Bikesharing in North America: Early Operator and User Understanding. 501
2012, Mineta Transportation Institute. 502 3. Shaheen, S., S. Guzman, and H. Zhang, Bikesharing Across the Globe, in City Cycling, J. Pucher 503
and R. Buehler, Editors. 2012, MIT Press. p. 183-209. 504 4. ITDP, The Bike-Share Planning Guide. 2013, Institute for Transportation & Development Policy. 505 5. Wemple, E., Capital Bikeshare Critic: A Lonely Pursuit, in TBD: All Over Washington. 2011. 506 6. Fascik, K., Bicycles? Tough Sit, in New York Post. April 19, 2013: New York, NY. 507 7. Flusche, D., Bicycling Means Business: The Economic Benefits of Bicycle Infrastructure. 2012, 508
Advocacy Advance: Washington, DC. 509 8. Alliance for Biking & Walking, Bicycling and Walking in the United Stations: 2014 Benchmarking 510
Report. 2014, Alliance for Biking & Walking: Washington, DC. 511 9. Bent, E. and K. Singa, Modal Choices and Spending Patterns of Travelers to Downtown San 512
Francisco, California: Impacts of Congestion Pricing on Retail Trade. Transportation Research 513 Record: Journal of the Transportation Research Board, 2009. 2115: p. 66-74. 514
10. Bernier-Heroux, L. and J. Ryan, East Village Shoppers Study: A Snapshot of Travel and Spending 515 Patterns of Residents and Visitors in the East Village. 2012, Transportation Alternatives: New 516 York, NY. 517
11. Buis, J. and R. Wittink, The Economic Significance of Cycling: A Study to Illustrate the Costs and 518 Benefits of Cycling Policy. 2000, VNG Uitgeverij: The Hague, The Netherlands. 519
12. Clifton, K., et al., Consumer Behavior and Travel Choices: A Focus on Cyclists and Pedestrians, in 520 Transportation Research Board 92nd Annual Meeting. 2012: Washington, DC. 521
13. Clifton, K. and C.D. Muhs, Capturing and Representing Multimodal Trips in Travel Surveys. 522 Transportation Research Record: Journal of the Transportation Research Board, 2012. 2285(1): 523 p. 74-83. 524
14. Fiets Beraad. Cyclists Spend as Much in Supermarket as Motorists. 2011. 525 15. Fleming, T., S. Turner, and L. Tarjomi, Reallocation of Road Space. 2013, NZ Transport Agency 526
Report 530. 527 16. O'Connor, D., et al., Report on Shopper Travel Behaviour in Dublin City Centre. 2011, Dublin 528
Institute of Technology: Dublin, Ireland. 529 17. Popovich, N. and S. Handy, Bicyclists as Consumers: Mode Choice and Spending Behavior in 530
Downtown Davis, CA, in Transportation Research Board 93rd Annual Meeting. 2014: 531 Washington, DC 532
18. Sztabinski, F., Bike Lanes, On-Street Parking and Business: A Study of Bloor Street in Toronto's 533 Annex Neighbourhood. 2009, The Clean Air Partnership: Toronto, Ontario. 534
19. Tolley, R., Good for Business: The Benefits of Making Streets More Walking and Cycling Friendly. 535 2011, National Heart Foundation of Australia. 536
20. Forkes, J. and N. Smith Lea, Bike Lanes, On-Street Parking and Business - Year 2 Report: A Study 537 of Bloor Street in Toronto's Bloor West Village. 2010, The Clean Air Partnership: Toronto, ON. 538
21. Angelou Economics, Literature Review and Impact of the Bicycle Boulevard. 2010, City of Austin: 539 Austin, TX. 540
22. Capital Bikeshare, 2011 Capital Bikeshare Member Survey Report. 2011, Capital Bikeshare: 541 Washington, DC. 542
23. Capital Bikeshare, 2013 Capital Bikeshare Member Survey Report. 2013, Capital Bikeshare: 543 Washington, DC. 544
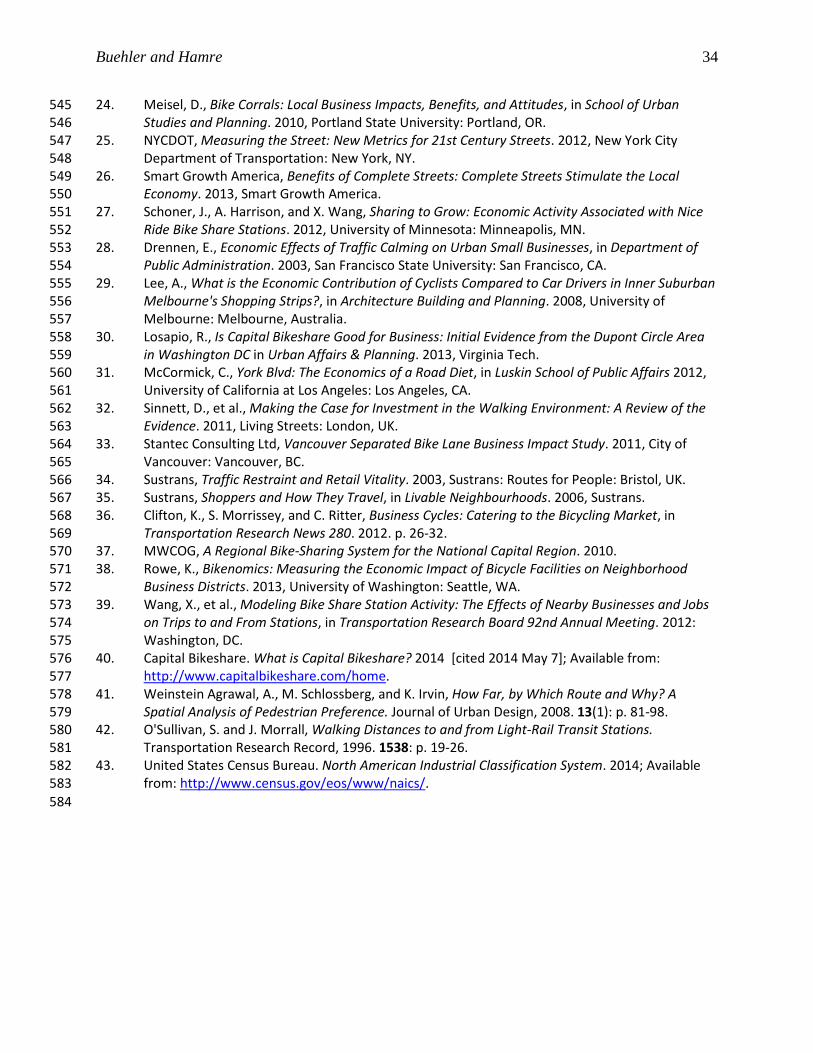
Buehler and Hamre 34
24. Meisel, D., Bike Corrals: Local Business Impacts, Benefits, and Attitudes, in School of Urban 545 Studies and Planning. 2010, Portland State University: Portland, OR. 546
25. NYCDOT, Measuring the Street: New Metrics for 21st Century Streets. 2012, New York City 547 Department of Transportation: New York, NY. 548
26. Smart Growth America, Benefits of Complete Streets: Complete Streets Stimulate the Local 549 Economy. 2013, Smart Growth America. 550
27. Schoner, J., A. Harrison, and X. Wang, Sharing to Grow: Economic Activity Associated with Nice 551 Ride Bike Share Stations. 2012, University of Minnesota: Minneapolis, MN. 552
28. Drennen, E., Economic Effects of Traffic Calming on Urban Small Businesses, in Department of 553 Public Administration. 2003, San Francisco State University: San Francisco, CA. 554
29. Lee, A., What is the Economic Contribution of Cyclists Compared to Car Drivers in Inner Suburban 555 Melbourne's Shopping Strips?, in Architecture Building and Planning. 2008, University of 556 Melbourne: Melbourne, Australia. 557
30. Losapio, R., Is Capital Bikeshare Good for Business: Initial Evidence from the Dupont Circle Area 558 in Washington DC in Urban Affairs & Planning. 2013, Virginia Tech. 559
31. McCormick, C., York Blvd: The Economics of a Road Diet, in Luskin School of Public Affairs 2012, 560 University of California at Los Angeles: Los Angeles, CA. 561
32. Sinnett, D., et al., Making the Case for Investment in the Walking Environment: A Review of the 562 Evidence. 2011, Living Streets: London, UK. 563
33. Stantec Consulting Ltd, Vancouver Separated Bike Lane Business Impact Study. 2011, City of 564 Vancouver: Vancouver, BC. 565
34. Sustrans, Traffic Restraint and Retail Vitality. 2003, Sustrans: Routes for People: Bristol, UK. 566 35. Sustrans, Shoppers and How They Travel, in Livable Neighbourhoods. 2006, Sustrans. 567 36. Clifton, K., S. Morrissey, and C. Ritter, Business Cycles: Catering to the Bicycling Market, in 568
Transportation Research News 280. 2012. p. 26-32. 569 37. MWCOG, A Regional Bike-Sharing System for the National Capital Region. 2010. 570 38. Rowe, K., Bikenomics: Measuring the Economic Impact of Bicycle Facilities on Neighborhood 571
Business Districts. 2013, University of Washington: Seattle, WA. 572 39. Wang, X., et al., Modeling Bike Share Station Activity: The Effects of Nearby Businesses and Jobs 573
on Trips to and From Stations, in Transportation Research Board 92nd Annual Meeting. 2012: 574 Washington, DC. 575
40. Capital Bikeshare. What is Capital Bikeshare? 2014 [cited 2014 May 7]; Available from: 576 http://www.capitalbikeshare.com/home. 577
41. Weinstein Agrawal, A., M. Schlossberg, and K. Irvin, How Far, by Which Route and Why? A 578 Spatial Analysis of Pedestrian Preference. Journal of Urban Design, 2008. 13(1): p. 81-98. 579
42. O'Sullivan, S. and J. Morrall, Walking Distances to and from Light-Rail Transit Stations. 580 Transportation Research Record, 1996. 1538: p. 19-26. 581
43. United States Census Bureau. North American Industrial Classification System. 2014; Available 582 from: http://www.census.gov/eos/www/naics/. 583
584