business as usual: juvenile justice during the 1980s
TRANSCRIPT

Notre Dame Journal of Law, Ethics & Public PolicyVolume 5Issue 2 Symposium on Serious Juvenile Crime Article 6
1-1-2012
Business as Usual: Juvenile Justice During the1980sIra M. Schwartz
Martha Wade Steketee
Jeffrey A. Butts
Follow this and additional works at: http://scholarship.law.nd.edu/ndjlepp
This Article is brought to you for free and open access by the Notre Dame Journal of Law, Ethics & Public Policy at NDLScholarship. It has beenaccepted for inclusion in Notre Dame Journal of Law, Ethics & Public Policy by an authorized administrator of NDLScholarship. For more information,please contact [email protected].
Recommended CitationIra M. Schwartz, Martha W. Steketee & Jeffrey A. Butts, Business as Usual: Juvenile Justice During the 1980s, 5 Notre Dame J.L. Ethics& Pub. Pol'y 377 (1991).Available at: http://scholarship.law.nd.edu/ndjlepp/vol5/iss2/6

BUSINESS AS USUAL: JUVENILE JUSTICEDURING THE 1980s
IRA M. SCHWARTZ*MARTHA WADE STEKETEE**
JEFFREY A. Burrs***
INTRODUCTION'
The juvenile justice system during the 1980s failed to liveup to the goals it set for itself during the 1960s and 1970s. TheU.S. Congress, Presidential commissions and numerous stan-dard-setting bodies determined during the 1970s that the mosteffective means of protecting the public safety and reducing theimpact ofjuvenile crime would involve prevention and commu-nity-based intervention, with minimal institutionalization. Theoverwhelming consensus was to reserve training schools andother secure facilities for chronic or violent offenders. Veryyoung and less serious offenders were to be supervised in non-institutional and community-based programs.
Despite this consensus, national rates ofjuvenile incarcera-tion remained virtually unchanged during the past decade. Bythe end of the 1980s, in fact, many states used incarcerationmore and often for less serious offenders. The glaringproblems of gang violence, drug abuse, and automatic weaponscaptured the headlines, yet the nation as a whole was notexperiencing a juvenile crime wave. The inner-cities becamemore isolated and more neglected during the 1980s, and a
Director, Center for the Study of Youth Policy at the University ofMichigan and Professor, University of Michigan School of Social Work. Hewas the Administrator of the federal Office of Juvenile Justice andDelinquency Prevention during the Carter Administration.
0* Researcher, Center for the Study of Youth Policy, a social workerand a doctoral student at the University of Michigan School of Social Work.
*** Researcher, Center for the Study of Youth Policy, a social workerand a doctoral candidate at the University of Michigan School of Social Work.
1. Some of the data utilized in this article were made available by theInter-university Consortium for Political and Social Research. Data for theJuvenile Detention and Correctional Facility Census, 1977, 1982-83 and1986-87, were originally collected by the United States Department of
Justice, Bureau of Justice Statistics and Office of Juvenile Justice andDelinquency Prevention. Neither the collector of the original data nor theConsortium bear any responsibility for the analysis or interpretationspresented here.

378 NOTRE DAME JOURNAL OF LAW, ETHICS & PUBLIC POLICY [Vol. 5
highly organized criminal subculture emerged in response tothe lucrative cocaine market. In many jurisdictions, theurgency of these problems was used to justify the abandonmentof community-based corrections programs. The political willto provide prevention and early treatment seemed to erode.
PLANS FOR REFORM
The origins of American practices in youth detention andcorrections can be traced to the "houses of refuge" of the mid-1800s and the child saver movement which emerged in the U.S.toward the end of the nineteenth century.' Public outrage overthe incarceration of young people in adult jails and prisonsgave rise to the belief that juveniles should be placed in sepa-rate institutions that emphasize rehabilitation and reform. 3
The houses of refuge, forerunners of contemporary juveniletraining schools, "promised judges, juries, police, and dis-gusted or overwhelmed parents an alternative to committingchildren to local jails or prisons."4 Pre-adjudication detentioncenters were developed much later, following the birth of thejuvenile court. Many of these centers served dependent andneglected children as well as those accused of crimes.
These juvenile institutions largely escaped public scrutinyuntil the 1960s and 1970s when class action lawsuits began toreveal abusive practices and intolerable conditions of confine-ment in training schools.5 Influential books further docu-mented the plight of children in these facilities.6 A five-yearexamination of the juvenile justice system by the United StatesSenate Judiciary Subcommittee to investigate Juvenile Delin-quency resulted in the enactment of the landmark Juvenile Jus-tice and Delinquency Prevention Act of 1974. 7 A number of
2. See generally Fox, Juvenile Justice Reform: An Historical Perspective, 22STAN. L. REV. 1187, 1188-1221 (1970).
3. See S. SCHLOSSMAN, LOVE AND THE AMERICAN DELINQUENT 57-62(1977).
4. Id. at 24.5. See, e.g., Harris v. Bell, 402 F. Supp. 469 (W.D. Mo. 1975); Inmates of
Boys' Training School v. Affieck, 346 F. Supp. 1354 (D.R.I. 1972); Lollis v.New York State Dept. of Soc. Services, 322 F. Supp. 473 (S.D.N.Y. 1970);Morales v. Turman, 383 F. Supp. 53 (E.D. Tex. 1974); Nelson v. Heyne, 355F. Supp. 451 (N.D. Ind. 1972) aff'd, 491 F.2d 352 (7th Cir. 1974), cert. denied,417 U.S. 976 (1974); Pena v. New York State Department of Social Services,322 F. Supp. 473 (S.D.N.Y. 1970).
6. K. WOODEN, WEEPING IN THE PLAYTIME OF OTHERS: AMERICA'S
INCARCERATED CHILDREN (1976); H. JAMES, CHILDREN IN TROUBLE: ANATIONAL SCANDAL (1970).
7. Juvenile Justice and Delinquency Prevention Act of 1974, Pub. L.

BUSINESS AS USUAL
presidentially-appointed commissions and national profes-sional standard-setting organizations also issued reports andpromulgated various sets of standards designed to upgrade thejuvenile justice system.
The impact of these developments was felt throughout thejuvenile justice system. One outcome was a major reconceptu-alization of the role and purpose of pre- and post-adjudicationincarceration ofjuveniles. A consensus of professional opinionemerged that pre-adjudication detention should be reservedfor youths who (1). present a clear and substantial threat to thecommunity, or (2) would likely abscond or fail to appear incourt if released on their own recognizance or under someform of community-based supervision. Standards published in1980 by the National Advisory Committee for Juvenile Justiceand Delinquency Prevention (NACJJDP) recommended that:
Juveniles subject to the jurisdiction of the family courtover delinquency should not be detained in a secure facil-ity unless:
a. They are fugitives from another jurisdiction;b. They request protection in writing in circum-
stances that present an immediate threat of seri-ous physical injury;
c. They are charged with murder in the first or sec-ond degree;
d. They are charged with a serious property crimeor a crime of violence other than first or second.degree murder which if committed by an adultwould be a felony, andi. They are already detained or on conditional
release in connection with another delin-quency proceeding;
ii. They have a demonstrable recent record ofwillful failures to appear at family courtproceedings;
iii. They have a demonstrable recent record ofviolent conduct resulting in physical injuryto others; or
iv. They have (a) demonstrable recent recordof adjudications for serious propertyoffenses; and
v. There is no less restrictive alternative thatwill reduce risk of flight, or of serious harm
No. 93-415, 88 Stat. 1109 (codified as amended in scattered sections of 42U.S.C., beginning at § 5601).
1991]

380 NOTRE DAME JOURNAL OF LAW. ETHICS & PUBLIC POUCY [Vol. 5
to property or to the physical safety of thejuvenile or others.8
A consensus also held that training schools should bereserved for serious violent and chronic juvenile offenders.The Juvenile Justice and Delinquency Prevention Act of 1974,for example, provided fiscal incentives for states to deinstitu-tionalize status offenders (runaways, school truants, youths inconflict with their parents, etc.),' to eliminate the jailing ofjuveniles in adult facilities,' 0 and to develop community-basedalternatives for non-violent and non-chronic delinquentyouths," as defined by the statute. 2 The authors of the Actrecognized that training schools were an important part of thecontinuum of services in youth corrections, but they believedthat these institutions should be used for the incarceration ofviolent and chronic juvenile law violators.'
The juvenile justice standards promulgated by the Insti-tute for Judicial Administration/American Bar Association rec-ommended that "[in choosing among statutorily permissibleoptions, the court should employ the least restrictive categoryand duration of disposition that is appropriate to the serious-ness of the offense, as modified by the degree of culpabilityindicated by the circumstances of the particular case, and bythe age and prior record of the juvenile."' 4 These standardsstated a clear preference to maintain a juvenile at home when-ever possible. "Removal from home is the most severe disposi-tion authorized for adjudicated juveniles. As such, it should bereserved for the most serious or repetitive offenses, and rarely,if ever, used for younger juveniles."'"
The IJA/ABA standards also encouraged state and localyouth corrections agencies to develop alternatives to institu-tions that could be used as dispositional options by the juvenilecourts. 16 In a similar vein, the NACJJDP standards recom-mended that training schools be used as a dispositional "last
8. NATIONAL ADVISORY COMMrIrEE FOR JUVENILE JUSTICE ANDDELINQUENCY PREVENTION, STANDARDS 297 (1980) [hereinafter STANDARDS].
9. See 42 U.S.C. § 5633(a)(12)(A).10. Id. § 5633(a)(14).11. Id. § 5633(a)(12)(B).12. I § 5603(1).13. Ford Administration Stifles Juvenile Justice Program: Hearings Before the
Subcommittee to Investigate Juvenile Delinquency of the Senate Committee on theJudiciary, 94th Cong., 1st Sess. 1, 4 (1975).
14. INSTITUTE OF JUDICIAL ADMINISTRATION & AMERICAN BARASSOCIATION, STANDARDS RELATING TO DISPOSmONS 34 (1980).
15. Id. at 62.16. INSTITUTE OF JUDICIAL ADMINISTRATION & AMERICAN BAR

BUSINESS AS USUAL
resort. '"7 These standards encouraged courts to select the"least restrictive" dispositional option "consistent with theseriousness of the offense, the juvenile's role in that offense,and the juvenile's age and prior record."'"
In 1973, the National Advisory Commission on CriminalJustice Standards and Goals issued a report recommendingthat states adopt youth correctional policies similar to thosethen being implemented in Massachusetts.' 9 Massachusettsrestricts the use of secure institutional treatment to cases in'which a youth needs to be confined for purposes of public pro-tection and cannot be managed in a less secure setting withoutcompromising public safety.2 °
By the late 1970s, it seemed that a major shift in juvenilejustice policy was in the offing. There was growing support forremoving non-chronic and non-violent juveniles from deten-tion centers and training schools by expanding the diversityand availability of community-based options. Increasing num-bers of state administrators and policymakers were becomingaware of the need for a range of sanctions and services in youthcorrections. From all indications, the 1980s promised to be adecade of reform in juvenile justice.
THE JUVENILE JUSTICE ENVIRONMENT OF THE 1980s
The best available evidence now suggests that there waslittle change during the 1980s in the nation's youth detentionand correctional policies. In fact, some states actuallyregressed, becoming more punitive and more institutionallyoriented. In part, this mirrored developments in adult correc-tions and criminal justice as a whole: both the prison popula-tion and the incarceration rate reached all-time highs duringthe 1980s. 2 I According to the Bureau of Justice Statistics, thenumber of Americans under some type of correctional supervi-sion increased by 30% between 1983 and 1986.2 The Bureau
ASSOCIATION, STANDARDS RELATING TO CORRECTIONS ADMINISTRATION 159(1980).
17. STANDARDS, supra note 8, at 377 (1980).18. Id. at 297.19. NAT'L ADVISORY COMMISSION ON CRIMINAL JUSTICE STANDARDS AND
GOALS, A NATIONAL STRATEGY TO REDUCE CRIME (1973).20. See generally B. KRISBERG, J. AUSTIN & P. STEELE, UNLOCKING
JUVENILE CORRECTIONS: EVALUATING THE MASSACHUSETTS DIVISION OF YoUtHSERVICES (1989).
21. BUREAU OF JUSTICE STATISTICS, REPORT TO THE NATION ON CRIME
AND JUSTICE 104 (2d ed. 1988).22. N.Y. Times, Dec. 15, 1987, at A21, col. 4.
1991]
382 NOTRE DAME JOURNAL OF LAW, ETHICS & PUBLIC POLICY [Vol. 5
of the Census reported that the number of corrections employ-ees at local, state and federal levels grew by 10% in 1987 alone,making corrections the fastest growing sector of governmentemployment.23
It is disturbing to find that the juvenile system followed thedirection' set by adult corrections. Juvenile justice policy dur-ing the 1980s became more concerned with social control andpunishment than with its historic mission of prevention andrehabilitation. Besieged by political pressure to do somethingabout juvenile crime, elected public officials responded byenacting more punitive measures. In many jurisdictions, theyadopted the cynical, throw-away-the-key attitude that some-times characterizes the adult correctional system. As is fre-quently the case with criminal justice issues, rising publicattention to juvenile crime resulted in actions which werehighly visible though not necessarily effective.
Policymakers in every level of government know that it ispopular -to call for a "tough" response to crime. Unless thepolitical environment allows public officials to say otherwise,being tough is inevitably translated as increased reliance uponincarceration, longer sentences, and prosecuting morejuveniles in the adult criminal courts. Even though popularperceptions of rising juvenile crime rates have been contra-dicted frequently by official statistics which show stable, or evendeclining rates, 24 and despite the fact that juvenile incarcera-tion rates seem to vary more by political boundaries than by theincidence of crime,25 the juvenile justice system inevitablyresponds to outside pressure by increasing the use ofincarceration.
Elected officials who advocate tougher sentencing laws andmore punitive approaches toward juvenile law violators oftenbelieve they are responding to the demands of the public, par-ticularly their own constituents. Surveys, however, indicatethat the public has a distorted picture of the juvenile crimeproblem. A national public opinion survey conducted in 1982revealed that 87% of the respondents believed that seriousjuvenile crime was increasing at an alarming rate.2" Yet
23. Government Workers at Record 17Million, L.A. Times, Apr. 21, 1989, at2, col. 4.
24. See generally Galvin & Polk,JuvenileJustice: Time for New Direction?, 29CRIME & DELINQ. 325 (1983); Cook & Laub, The (Surprising) Stability of YouthCrime Rates, 2 J. QUANTITATIVE CRIMINOLOGY 265 (1986).
25. See generally Krisberg, Litsky & Schwartz, Youth in Confinement: Justiceby Geography, 21J. RES. CRIME & DELINQ.. 153 (1984).
26. I. SCHWARTZ, (IN)JusTIcE FOR JUVENILES 26 (1989).
BUSINESS AS USUAL
national arrest rates for Part I offenses by juveniles were rela-tively stable between 1975 and 1987.27 A recent California sur-vey found that more than 80% of adults in that state believedthat the rate of juvenile crime had been increasing during the1980s.2 s In reality, the total juvenile arrest rate had fallen by8.1% between 1981 and 1986, while the rate for violent felo-nies fell 21.4%.29
The results from the California survey are particularlyinteresting because they raise questions about whether the-actions of politicians really reflect the thinking of the electo-rate. The California respondents expressed "a strong prefer-ence for sentencing juveniles to specialized treatment andcounseling programs in lieu of incarceration in state correc-tional facilities, even for repeat serious offenders." s° Theyexpressed only moderate support for spending tax dollars torelieve overcrowding in California's youth correction facilitiesand "strong support for the proposition that juvenile offendersshould be separated from adults in confinement, and for ajuve-nile sentencing scheme different from that of adults. '"
There remains among the public a general consensus thatjuvenile offenders should be treated. specially by the criminaljustice system. We are still likely to attribute juvenile crime tofrustrated economic opportunity and unemployment; weexpect the juvenile court to rehabilitate rather than simply topunish; and we expect minor offenses to be handled outside ofthe juvenile justice system-preferably by community agen-cies.3 2 The strain between these long-held values and the pop-ularity of hard-line, get-tough rhetoric produces acutedemands upon the agencies comprising the juvenile justice sys-tem. Juvenile courts are derided for being too lenient onjuve-nile offenders, but simultaneously criticized for exacerbatingthe problems of troubled youths by breaking up families andplacing young offenders in correctional institutions that do not"correct."
27. Idat 31; STEKETEE, WILLIS & SCHWARTZ, JUVENILE JUSTICE TRENDS:
1977-1987 17 (1989).28. Steinhart, California Opinion Poll. Public Attitudes on Youth Crime,
NAT'L COUNCIL ON CRIME & DELINQ. Focus, Dec. 1988, at 7.29. Id. at 6-7.30. Id. at 2.31. Id. at 1.32. Galvin & Polk, supra note 24, at 330.
19911

384 NOTRE DAME JOURNAL OF LAW, ETHICS & PUBLIC POLICY [Vol. 5
JUVENILE CORRECTIONS AND DETENTION
Apparently in response to these pressures, many statesincreased their rates of juvenile institutionalization during the1980s; others at least maintained their rates of confinement. Invery few states, however, did significant changes or reformresult from the federal policies, class action lawsuits, and tight-ened professional standards of the 1970s and early 1980s.Table 1, for example, indicates that national rates of admis-sions to detention centers were slightly higher in 1986 than in1977. According to these data from the federal government's
Juvenile Detention and Correctional Facility Census, 3 the totaladmission rate to public detention centers declined from 1,681admissions per 100,000 eligible youth population in 1977, to1,488 per 100,000 in 1982. At the time of most recent avail-able census (1986-87), the rate had climbed back to nearly1,800 admissions per 100,000.
In addition, there was a large increase in the rates of com-mitment to these facilities. Although not designed or recom-mended for the housing of committed youths, admissions ofcommitted juveniles to detention centers increased from 16 to96 per 100,000 between 1977 and 1986-a surge of 600%.Such an increase underscores the growing concern that deten-tion facilities are used inappropriately by the courts as a dispo-sitional option for adjudicated juveniles.34
Table 2 demonstrates that training school admission rateswere also relatively unchanged between 1977 and 1986. Aswas the case with detention centers, the total rate of admissionsto training schools declined from 227 to 205 per 100,000between 1977 and 1982, but grew to 236 by 1986. This tableshows that admissions for female juveniles increased much lessbetween 1982 and 1986. Male admissions, on the other hand,climbed by 17% during that period-from 345 to 403 per100,000 eligible youth population. The rates for commitment
33. U.S. Department of Justice, Office of Juvenile Justice andDelinquency Prevention, Juvenile Detention and Correctional FacilityCensus, 1977 and 1982-83 [computer files]. ICPSR ed. Ann Arbor,Michigan: Inter-university Consortium for Political and Social Research[producer and distributor]. U.S. Department of Justice, Office of JuvenileJustice and Delinquency Prevention, Juvenile Detention and CorrectionalFacility Census, 1986-87: Public Facilities (computer file]. Washington,D.C.: U.S. Department of Commerce, Bureau of the Census, 1988[producer]. Ann Arbor, Michigan: Inter-university Consortium for Politicaland Social Research, 1988 (distributor].
34. See generally Schwartz, Fishman, Hatfield, Krisberg & Eisikovits,Juvenile Detention: The Hidden Closets Revisited, 4 JUsT. Q. 219 (1987).

BUSINESS AS USUAL
TABLE 1
U.S. PUBLIC DETENTION CENTERS ADMISSIONS ANDRATES PER 100,000 ELIGIBLE YOUTHS BY
STATUS 1977, 1982 AND 1986
1977 1982 1986
Rate per Rate per Rate per# 100,000 # 100,000 # 100,000
Committed YouthsMales 3,806 26 16,940 120 21,039 159
Females 998 7 3,444 25 3,844 30Total 4,804 16 20,384 74 24,883 96
Detained YouthsMales 371,694 2,502 308,457 2,190 353,411 2,664
Females 112,738 790 81,717 604 89,329 702Total 484,432 1,663 390,174 1,414 442,740 1,703
All YouthsMales 375,728 2,530 325,461 2,311 374,461 2,823
Females 113,966 798 85,227 630 93,207 732Total 489,694 1,681 410,688 1,488 467,668 1,799
Notes:I. Rates are based on the numbers of youths aged 10 through the age of maximum
original juvenile court jurisdiction for each state and the District of Columbia.2. Committed status youths are those placed following adjudication. Detained
youths are pending adjudication or awaiting formal court disposition or placement.Voluntary status admissions (self-admits or referrals through agencies other than the
juvenile court) are included in the "all youths" lines above.Sources: Juvenile Detention and Correctional Facility Census, 1977, 1982-83 and1986-87. U.S. Bureau of the Census, Current Population Reports, Series P-25,published and unpublished data.
admissions only (i.e., excluding detainees) were essentially.stable.
A substantial proportion of the juveniles confined indetention centers and training schools were minor and pettylaw violators and, to a lesser extent, status offenders. Table 3shows the number of juveniles confined in public detentioncenters on the day of the most recently published facility cen-sus (February 2, 1987), as well as the offenses charged againstthese youths. This table reveals that only 41 7 of the detainedyouths were accused of committing a Part I offense (either vio-lent or property). Approximately 6% of the youths had beendetained for a status offense, while more than half werecharged with less serious Part II crimes such as shoplifting,drug offenses, vandalism and receiving stolen property. Thedata also reveal significant differences by gender. Just 22% ofdetained females were accused of a Part I offense.
19911

386 NOTRE DAME JOURNAL OF LAW, ETHICS & PUBLIC POLICY [Vol..5
TABLE 2
U.S. PUBLIC TRAINING SCHOOLS ADMISSIONS ANDRATES PER 100,000 ELIGIBLE YOUTHS BY
STATUS 1977, 1982 AND 1986
1977 1982 1986
Rate per Rate per Rate per# 100,000 # 100.000 # 100,000
Committed YouthsMales 48,903 329 41,888 297 43,988 332
Females 7,417 52 6,448 48 6,091 48Total 56,320 193 48,336 175 50,079 193
Detained YouthsMales 7,494 50 6.746 48 9,478 71
Females 2,201 15 1,481 11 1,842 14Total 9,695 33 8,227 30 11,320 44
All YouthsMales 56,427 380 48,639 345 53,466 403
Females 9,671 68 7,929 59 7,933 62Total 66,098 227 56,568 205 61,399 236
Notes:1. Rates are based on the numbers of youths aged 10 through the age of maximum
original juvenile court jurisdiction for each state and the District of Columbia.2. Committed status youths are those placed following adjudication. Detained
youths are pending adjudication or awaiting formal court disposition or placement.Voluntary status admissions (self-admits or referrals through agencies other than the
juvenile court) are included in the "all youths" lines above.Sources: Juvenile Detention and Correctional Facility Census, 1977, 1982-83 and1986-87. U.S. Bureau of the Census. Current Population Reports, Series P-25,published and unpublished data.
Table 4 depicts the offenses charged against youths whowere confined in public training schools at the time of the mostrecent census. Slightly more than half (53.6%) of thesejuveniles were accused of serious offenses. One-fifth had beenadjudicated for a Part I violent crime, while one-third werecharged with a serious property offense such as burglary orauto theft. Again, there were significant differences by gender,with two-thirds of the females being incarcerated for less seri-ous (non-Part I) crimes.
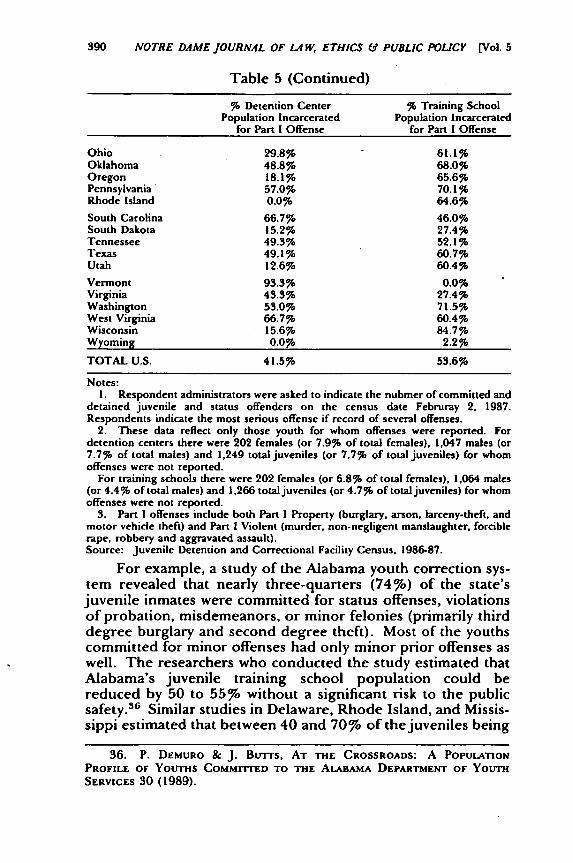
Table 5 provides the percentage in each state of confinedyouths that committed a Part I offense. As reported by admin-istrators in the 1986-87 census, these percentages vary substan-tially from state to state. State public training school facilitiesin Wisconsin, Washington, New Hampshire, and Pennsylvaniareported that more than 70% of their youth populations hadbeen charged with Part I offenses. In other states, however, theproportion of Part I offenders can be quite low, suggesting that

BUSINESS AS USUAL
TABLE 3
U.S. PUBLIC DETENTION CENTERS ONE DAY CouNTs
BY OFFENSE AND GENDER 1987
MALES FEMALES TOTAL# % # % # 5
Part I: Violent 1,691 13.5% 116 4.9% 1,807 12.1%
Part 1: Property 3,959 31.6% 409 17.4% 4,368 29.3%
Part I! 6,474 51.6% 1,415 60.0% 7.889 53.0%
Status 416 3.3% 417 17.7% 833 5.6%
Totals 12,540 .100.0% 2,357 100.0% 14,897 100.0%
Notes:1. Respondent administrators were asked to indicate the number of committed and
detained juvenile and status offenders on the census date February 2, 1987. They weredirected to report the most serious offense if records reflect several offenses.
2. Offense categories are collapsed here as presented in the Survey:Part I Violent: Murder, non-negligent manslaughter, forcible rape, robbery, and
aggravated assault.Part I Property: Burglary, arson, larceny-theft, motor vehicle theft.Part II: All offenses not Part I or Status.Status: Offense which "would not be considered a crime if committed by an adult"
Source: Juvenile Detention and Correctional Facility Census, 1986-87.
many non-serious offenders were being confined in correc-tional institutions. For example, Maine, Montana, North andSouth Dakota, Virginia and Kentucky all reported that 30% orless of the youths confined in their training schools committedserious, Part I offenses."3
State Studies
The federally-administered Juvenile Detention and Cor-rectional Facility Census, which provided most of the datapresented above, is a useful and internally consistent source ofdata on the national juvenile corrections population. It is espe-cially valuable as a device for tracking changes in the rates offacility admissions and periodic one-day counts. It cannot,however, be taken as a completely reliable measure of theseverity of offenses charged against the incarcerated juvenilepopulation.
35. These tables describe only those youths for whom offenses werereported. Vermont did not have a public training school; Wyoming had alarge number of cases in which no offense was reported. Overall, offenseswere reported for more than 95% of youths present in public training schoolson the census date.
19911

388 NOTRE DAME JOURNAL OF LAW, ETHICS & PUBLIC POLICY (Vol. 5
TABLE 4U.S. PUBLIC TRAINING SCHOOLS ONE DAY COUNTS
BY OFFENSE AND GENDER 1987
MALES FEMALES TOTAL
# % # %70Part I: Violent 4,850 21.1% 354 12.8% 5,204 20.2%
Part I: Property 8,044 35.0% 565 20.5% 8,609 33.4%
Part II 9,857 42.8% 1,538 55.8% 11,395 44.2%
Status 260 1.1% 300 10.9% 560 2.2%
Totals 23,011 100.0% 2,757 100.0% 25,768 100.0%
Notes:1. Respondent administrators were asked to indicate the numbers and types of
committed and detained juvenile and status offenders on the census date February 2,1987. They were directed to report the most serious offense if records reflect severaloffenses.
2. Offense categories are collapsed here as presented in the Survey:Part I Violent: Murder, non-negligent manslaughter, forcible rape, robbery, and
aggravated assault.Part I Property: Burglary, arson, larceny-theft, motor vehicle theft.Part II: All offenses not Part I or Status.Status: Offense which "would not be considered a crime if committed by an adult"
Source: Juvenile Detention and Correctional Facility Census, 1986-87.
The Census, which is better known as the Children in Cus-tody series, relies upon questionnaires filled out by administra-tors. Each administrator answers a number of questions aboutthe youths being held in his or her facility. The questionnaireasks the administrators to report the most serious offensescharged against the youths who were in custody on the censusdate. The youths' case records or legal files are not reviewed indetail by anyone outside of the facilities. The most accuratecharacterization of the offenses committed by incarceratedjuveniles would require reviews of the documents typicallyfound in delinquency case records.
Recently, a number of states conducted risk assessmentstudies that offer an additional source of information aboutjuvenile corrections populations. Independent researchersexamined institutional case records in the states and evaluatedthe recentness, severity, and frequency of delinquent behavioramong incarcerated juvenile offenders. Through these studies,the offender population of each juvenile correctional systemwas segmented into relatively low-risk and relatively high-riskgroups so that policymakers and youth correction officialscould make informed decisions about how the system's limited

BUSINESS AS USUAL
resources were being allocated. These studies confirmed that arelatively large proportion of the juveniles confined in statetraining schools are not serious or chronic offenders. Further-more, the studies suggest that the Facility Census may actuallyunderestimate the extent to which non-serious offenders areincarcerated in training schools.
TABLE 5
U.S. PUBLIC DETENTION CENTERS AND TRAINING
SCHOOLS PERCENT JUVENILESINCARCERATED FOR PART I
OFFENSES By STATE AND TOTAL 1987
% Detention CenterPopulation Incarcerated
for Part I Offense
% Training SchoolPopulation Incarcerated
for Part I Offense
AlabamaAlaskaArizonaArkansasCalifornia
ColoradoConnecticutDelawareD.C.Florida
GeorgiaHawaiiIdahoIllinoisIndiana
IowaKansasKentuckyLouisianaMaine
MarylandMassachusettsMichiganMinnesotaMississippi
MissouriMontanaNebraskaNevadaNew Hampshire
New JerseyNew MexicoNew YorkNorth CarolinaNorth Dakota
46.9%36.1%26.2%73.3%41.0%
41.3%60.0%68.2%20.6%45.6%
47.9%15.7%62.5%44.0%27.9%
66.7%47.3%39.0%55.1%0.0%
32.2%57.8%44.9%36.2%42.9%
37.5%0.0%
27.9%17.1%64.3%
46.2%21.8%44.7%43.7%25.0%
43.4%47.4%61.1%63.9%45.9%
68.6%48.9%36.8%45.1%53.4%
54.1%66.7%69.4%58.2%43.5%
39.0%59.3%30.4%67.4%23.8%
41.4%53.3%66.4%46.9%63.9%
38.9%25.1%34.8%34.2%73.7%
58.1%51.0%68.4%41.5%23.1%
1991)
390 NOTRE DAME JOURNAL OF LAW. ETHICS & PUBLIC POLICY (Vol. 5
Table 5 (Continued)
% Detention Center % Training SchoolPopulation Incarcerated Population Incarcerated
for Part I Offense for Part I Offense
Ohio 29.8% 61.1%Oklahoma 48.8% 68.0%Oregon 18.1% 65.6%Pennsylvania 57.0% 70.1%Rhode Island 0.0% 64.6%
South Carolina 66.7% 46.0%South Dakota 15.2% 27.4%Tennessee 49.3% 52.1%Texas 49.1% 60.7%Utah 12.6% 60.4%
Vermont 93.3% 0.0%Virginia 43.3% 27.4%Washington 53.0% 71.5%West Virginia 66.7% 60.4%Wisconsin 15.6% 84.7%Wyoming 0.0% 2.2%
TOTAL U.S. 4 1.5% 53.6%
Notes:1. Respondent administrators were asked to indicate the nubmer of committed and
detained juvenile and status offenders on the census date Februray 2, 1987.Respondents indicate the most serious offense if record of several offenses.
2. These data reflect only those youth for whom offenses were reported. Fordetention centers there were 202 females (or 7.9% of total females), 1,047 males (or7.7% of total males) and 1,249 total juveniles (or 7.7% of total juveniles) for whomoffenses were not reported.
For training schools there were 202 females (or 6.8% of total females), 1,064 males(or 4.4% of total males) and 1,266 total juveniles (or 4.7% of total juveniles) for whomoffenses were not reported.
3. Part I offenses include both Part I Property (burglary, arson, larceny-theft, andmotor vehicle theft) and Part I Violent (murder, non-negligent manslaughter, forciblerape, robbery and aggravated assault).Source: Juvenile Detention and Correctional Facility Census, 1986-87.
For example, a study of the Alabama youth correction sys-tem revealed that nearly three-quarters (74%) of the state'sjuvenile inmates were committed for status offenses, violationsof probation, misdemeanors, or minor felonies (primarily thirddegree burglary and second degree theft). Most of the youthscommitted for minor offenses had only minor prior offenses aswell. The researchers who conducted the study estimated thatAlabama's juvenile training school population could bereduced by 50 to 55%o without a significant risk to the publicsafety.3 6 Similar studies in Delaware, Rhode Island, and Missis-sippi estimated that between 40 and 70% of the juveniles being
36. P. DEMURO & J. Burrs, AT THE CROSSROADS: A POPULATIONPROFILE OF YOUTHS COMMITTED TO THE ALABAMA DEPARTMENT OF YOUTHSERVICES 30 (1989).

BUSINESS AS USUAL
held in secure facilities were neither violent nor chronic offend-ers, and could most likely be managed safely in thecommunity.37
Juveniles in Jails
Despite amendments to the Juvenile Justice Act mandatingthe removal of youths from adult jails,3 8 young people still arebeing held in adult correctional facilities. Censuses and samplesurveys of jails throughout the 1980s by the Bureau of JusticeStatistics indicated that juveniles were confined in these facili-ties. The 1983 census found 1,736 youths under 18 being heldin adult jails on June 30, 1983, with similar numbers reportedfor both 1985 and 1986. 3' Though the Bureau ofJustice Statis-tics indicates that such numbers must be interpreted with cau-tion as they comprise fewer than 1 of the incarceratedpopulations on these dates,40 it remains true that youths con-tinue to be incarcerated in facilities designed for adults, con-trary to federal law.
POLICY FOR THE 1990s
Despite the clear intent of the amended Juvenile Justiceand Delinquency Prevention Act of 1974 and the standards andgoals advocated by the Institute for Judicial Administration/American Bar Association, and the National Advisory Commit-tee for Juvenile Justice and Delinquency Prevention, there werefew changes in the rate of juvenile incarceration during the1980s. Some youths were still being held in adultjails, and rel-atively minor and non-serious offenders were being placed insecure facilities, including a number of status offenders. It wasapparent by the end of the decade that the reforms envisionedby federal policymakers had not materialized. Yet, innovativepolicymakers and juvenile justice professionals in some stateswere beginning to re-emphasize community-based youth cor-rections. Prompted at least in part by revenue constraints and
37. See P. DEMURO & B. KRISBERG, ADJUDICATED YoUTH IN DELAWAREWHO NEED SECURE CARE 13 (1987); P. DEMURO &J. BUTrrs, REPORT TO THEJUVENILE JUSTICE TASK FORCE: RHODE ISLAND'S JUVENILE JusTICE SYSTEM-MORE OF THE SAME .. . OR AN OPPORTUNITY FOR REFORM? 4 (1988);J. BUTrrs& P. DEMURO, POPULATION PROFILE AND RISK ASSESSMENT STUDY: MISSISSIPPI
DEPARTMENT OF YOuTH SERVICES 19 (1989).38. Juvenile Justice Amendments of 1980, Pub. L. No. 96-509, 94 Stat.
2750, (codified as amended at 42 U.S.C. § 5633(a)(14)).39. BUREAU OF JUSTICE STATISTICS, DEPARTMENT OF JUSTICE,
CORRECTIONAL POPULATIONS IN THE UNITED STATES 6 (1989).40. Id.
1990]
392 NOTRE DAME JOURNAL OF LAW, ETHICS & PUBLIC POLICY [Vol. 5
class action lawsuits,4 ' several states had reduced their trainingschool populations and were -exploring new correctionalapproaches that rely on community supervision while reservingsecure placement for chronic and violent youthful offenders."
Massachusetts and Utah, for example, are widely recog-nized for their reliance on community-based programs andlimited use of confinement for committed youths. Relativelyfew juveniles in these two states are prosecuted in the adultcriminal courts and sentenced to adult prisons. Their youthcorrections systems have been studied by the National Councilon Crime and Delinquency (NCCD). Recently, NCCD con-cluded that "Utah's policy of community-based corrections didnot worsen public safety." 43 The NCCD researchers observedthat "the imposition of appropriate community-based controlson highly active serious and chronic juvenile offenders isconsistent with public protection goals."" The study alsonoted that managing these youthful offenders in the commu-nity had saved Utah taxpayers more than $30 million in capitalcosts and approximately $10 million annually in operatingexpenditures.4 5
NCCD's evaluation of the youth corrections system in Mas-sachusetts found that youths placed in the custody of the statecommitted far fewer offenses after leaving state care and that"there was a slight tendency over time to commit less seriouscrimes." 46 The NCCD study also compared the recidivismrates of youths in the Massachusetts system with those in thestates of Pennsylvania, Utah, Florida, Texas, Illinois, Wiscon-sin, and California. The results showed that the youths in theMassachusetts system "had equivalent, and in some instanceslower recidivism rates than youths from [the] other states."'47
Citing Utah's experience with community-based corrections,the NCCD researchers believed that expanding the use ofsecure confinement in Massachusetts would involve large pub-
41. See cases cited supra note 5.
42. See generally Blackmore, Brown & Krisberg, Juvenile Justice Reform:The Bellwether States (1988); Butts, Youth Corrections in Maryland: The Dawning ofa New Era, in YOUTH CORRECTION REFORM: THE MARYLAND AND FLORIDAEXPERIENCE (Ctr. for the Study of Youth Policy ed. 1988).
43. NATIONAL COUNCIL ON CRIME AND DELINQUENCY, THE IMPACT OFJUVENILE COURT INTERVENTION 147 (1987).
44. Id.
45. Id. at 134-36.46. B. KRISBERG, J. AUSTIN & P. STEELE, supra note 20, at 18.
47. Id at 25.

BUSINESS AS USUAL
lic expenditures, but "would not produce a noticeable reduc-tion in youth crime."148
A recent study in Wayne County (Detroit), Michigan testedthe effectiveness of intensive community-based supervisionprograms as an alternative to commitment. The study had arandomized design and followed more than 500 cases over afour-year period. The results showed that the recidivism ofyouths placed in the intensive probation programs was noworse than that of youths committed to the state and usuallyplaced in public and private training schools.49 Moreover, theintensive probation programs cost about one-third as much ascommitment and incarceration. The study estimated that theState of Michigan saved nearly $9 million in placement costs byusing community programs instead of commitment.
Policymakers and juvenile justice officials who equatebeing "tough" with good policy would thus be well advised tore-evaluate their juvenile crime control practices. Institutionalconfinement is but one resource in the battle to control juve-nile crime, and should be focused on serious and violentoffenders in order to permit adequate financing of quality com-munity-based programs. This strategy, which has been imple-mented successfully in Massachusetts, Utah, and Maryland,' isneither new nor radical. It is the sound, cost-effective approachcalled for throughout the 1970s but never consistently imple-mented before being abandoned in favor of "getting tough."
CRITICAL ISSUES
The need for reforms in youth detention and correctionalpractices will be studied and debated by researchers, juvenilejustice professionals, and policymakers in the years ahead.Those involved in shaping the policies of the next decadeshould consider a number of important issues in planning forthe future.
48. Id. at 33.49. See Barton & Butts, Viable Options: Intensive Supervision Programs for
Juvenile Delinquents, 36 CRIME & DELINQ. 238, 244 (1990).50. See generally Loughran, Juvenile Corrections: The Massachusetts
Experience, in REINVESTING YOUTH CORRECTIONS RESOURCES: A TALE OFTHREE STATES 7 (1987); Van Vleet, Rutherford & Schwartz, Reinvesting YouthCorrections Resources in Utah, in id. at 23; Butts, supra note 42; Matheson,Political Leadership in Juvenile Justice Reform, in YOUTH CORRECTIONS AND THEQUIET REVOLUTION 7 (n.d.); Bangerter, Youth Corrections in Utah: A Commitmentto Excellence, in id at 17.
19901
394 " NOTRE DAME JOURNAL OF I W, ETHICS & PUBLIC POLICY (Vol. 5
Race
The U.S. is becoming an increasingly diverse nation, withmany cultures and ethnicities. This is especially true amongyoung people. Minorities have been disproportionately incar-cerated for many years. Although blacks comprise approxi-mately 15% of the population, they account for 38% of youthsin public juvenile correctional facilities."' In 1982, the incar-ceration rate in public juvenile correctional facilities was fourtimes greater for black male juveniles than for white males,while black females were incarcerated at over twice the rate ofwhite females in similar public facilities.5 2 Addressing the dis-proportionate rate of minority incarceration in the juvenile jus-tice system may first require comprehensive social andeconomic reforms, but this issue should hold center stage inthe future.
Gender
Researchers during the 1970s documented the long-stand-ing differential treatment of girls by the juvenile justice sys-tem."3 Their research indicated that girls were more likely tobe incarcerated for a less serious offense than their male coun-terparts, and that they were often confined for longer periodsof time than boys who had committed serious offenses. Unfor-tunately, despite some decline in the rates of female incarcera-tion, the differential treatment of female juveniles continues tobe a problem. Girls are still being confined for less seriousoffenses than are boys, and programs designed especially forfemale offenders are rare. Juvenile justice professionals andelected public officials need .to make this issue a top priorityand design programs that will reduce the rate of incarcerationamong girls.
Public Opinion
The distorted picture the public has about the juvenilecrime problem is particularly troublesome. It is difficult to
51. See Krisberg, Schwartz, Fishman, Eisikovits, & Guttman, TheIncarceration of Minority Youth, 33 CRIME & DELtNo. 173, 179 (1987).
52. Id. at 184-85.53. See, e.g., Kratcoski, Differential Treatment of Delinquent Boys and Girls in
Juvenile Court, 53 CHILD WELFARE 16 (1972); Sarri, Juvenile Law: How itPenalizes Females, in THE FEMALE OFFENDER 67 (L. Crites ed. 1976);Schlossman & Wallach, The Crime of Precocious Sexuality: Female. JuvenileDelinquency in the Progressive Era, 48 HARV. ED. REV. 65 (1978); Chesney-Lind,
Judicial Paternalism and the Female Status Offender. Training Women to Know TheirPlace, 23 CRIME & DELIN. 121 (1977).
BUSINESS AS USUAL
imagine how rational juvenile crime control policies can bedeveloped and maintained when most citizens are ill-informedon the issue and elected officials blatantly exploit this. Everyeffort must be made to inform and educate the public about thenature and scope of the juvenile crime problem so that sounddecisions can be made. The experiences of the 1988 presiden-tial campaign should serve as a stern reminder of the social fric-tion surrounding correctional policy and the extent to whichignorance and fear have been allowed to affect public debate."
The Federal Role
There is no escaping the need for federal leadership injuvenile justice policy. In the future, federal administratorsshould take the lead in acquainting state and local governmentswith the most effective and innovative juvenile justice practices.New energy should be focused on developing the non-institu-tional alternatives called for in the Juvenile Justice and Delin-quency Prevention Act of 1974 and its amendments. Inaddition, federal leaders should be spearheading a nationaleffort to prevent crime, not merely punish the small proportionof offenders who are actually caught and convicted. The U.S.Congress declared in 1974 that it would provide the necessaryresources, leadership and coordination to "develop and imple-ment effective methods of preventing and reducing juveniledelinquency, including methods with a special focus on main-taining and strengthening the family unit so that juveniles maybe retained in their homes." 5 5 Community-based prevention isfundamental to alleviating the problems of delinquency and itscommon antecedents: family disruption, school failure anddrug abuse. Now, as fifteen years ago, effective community-based prevention should be a national priority.
CONCLUSION
A number of forward-thinking state and local governmentshave shown that, given the availability of well-designed andwell-managed programs, many juvenile offenders can be main-tained in the community without jeopardizing the public safety.Yet, most of the nation has continued to believe that juvenilecrime is worsening and that an increasingly punitive andexpensive juvenile corrections system is the best solution to thecrime problem. This approach is wasteful at best and socially
54. See generally, e.g., Campaign Focus on Furloughs Prompts Review ofPrograms, 19 CRIM. JusT. NEWSL. I (Dec. 1, 1988).
55. 42 U.S.C. § 5602(b) (1988).
19901

396 NOTRE DAME JOURNAL OF LAW. ETHICS & PUBLIC POLICY [Vol. 5
destructive at worst. Juvenile justice policy must be redirectedduring the 1990s toward a more effective and efficient use ofscarce resources. The 1980s proved to be a decade of stagna-tion; the next ten years must be a decade of progress.