business cases for smart grid cyber security measures · pdf filecontract no 608224...
TRANSCRIPT
Contract No 608224
Deliverable D5.1
Business Cases for Smart Grid Cyber Security Measures
AIT Austrian Institute of Technology • Fraunhofer AISEC • The Queen’s University Belfast Energieinstitut an der Johannes Kepler Universität Linz • EMC Information Systems International Ltd
Kungliga Tekniska högskolan (KTH) • Landis + Gyr United Technologies Research Centre • SWW Wunsiedel GmBH
D5.1 Business Cases for Smart Grid Cyber Security Measures © SPARKS Consortium
Deliverable D5.1 Page 2 of 54
Document control information
Title Business Cases for Smart Grid Cyber Security Measures
Editor Gerhard Meindl
Contributors Gerhard Kleineidam, Gerhard Meindl
Description This document presents an approach to evaluate the costs – CAPEX,
OPEX – to achieve a certain security level necessary to avoid damages
from cyber attacks
Requested deadline 31/03/2016

D5.1 Business Cases for Smart Grid Cyber Security Measures © SPARKS Consortium
Deliverable D5.1 Page 3 of 54
Executive Summary
One of the goals of the SPARKS project is to provide economic guidance to stimulate investment in
higher security levels for the smart grid. This document describes a first estimation of a “fully-costed”
damage case for not implementing and investing into (smart) grid (cyber) security measures. These
cost estimates include active and passive costs, which allow decision makers to get a clear view on the
extent of the costs that are associated with non-implementation of different security levels.
The very first approach described in this deliverable uses data derived from a real black-out incident,
which occurred in Italy and the macro economical evaluations to find out the full amount of
macroeconomic damage in the regions involved (a top-down approach). The case study and
assessment of this incident has resulted in short and long-term cost effects of 0.08% to the Gross
Domestic Product (GDP). This factor is an essential element of the cost model developed to provide
an estimation of the expected maximum impact to any region hit by a cyber-attack to its Distribution
System Operator (DSO).
For a top-down approach to evaluate passive costs – costs for repair and losses – for energy supplying
companies, three DSOs have agreed to have their business data analysed on a commercial (CAPEX,
OPEX, Revenue) basis. For a first calculation of all costs following a blackout and concerning a DSO,
a calculation model was created. The cost evaluation based on a precise (bottom-up) approach
combined with a calculation of various attack scenarios and possible security measures for one DSO
(SWW) will be shown in D5.2.
Based on the evaluation of the results of the blackout in Italy, a first attempt of a macroeconomic
evaluation of possible effects of cyber-attacks and a projection of the results to SWW Wunsiedel
GmbH territory is undertaken.
A technical and process assessment on the security levels of grid, structure and ICT of three DSOs is
undertaken, the results are summarized in Strengths, Weaknesses, Opportunities and Threats (SWOT)
diagrams (section 4). The assessments provide insight on investment and security levels as of today
with some differences and different needs per DSO, in order to prepare for the future.
For the three DSOs, the specific amounts resulting from the top-down calculation of grid costs, loss of
revenues and macro economical costs, as a result of a black-out caused by a cyber-attack, are
presented. The dimension of the amounts involved will be compared with the annual profit, to show
the relevance. These amounts for sure have the quality to raise awareness with the Chief Financial
Officers (CFOs) of the worldwide energy supplying community.
D5.1 Business Cases for Smart Grid Cyber Security Measures © SPARKS Consortium
Deliverable D5.1 Page 4 of 54
Table of Contents
Executive Summary ................................................................................................................................................ 3
Table of Contents .................................................................................................................................................... 4
List of Figures: ........................................................................................................................................................ 5
Definitions and Abbreviations ................................................................................................................................ 7
1 Background and Motivation ........................................................................................................................... 9
2 Assessment Method: A Cost Model based on a Macroeconomic Case Study .............................................. 11
2.1 Assessing the Economic Ramifications of Supply Interruptions .......................................... 11
2.2 A Methodology for Economic Assessment ........................................................................... 11
2.3 Calculating the Impact of Cyber-Attacks to a DSO from Real Business Data ..................... 14
2.4 The Analogy between Macro-economical Evaluations and Business (DSO) Assessments .. 16
2.5 Methods, Assumptions and Limitations of Security Assessments ........................................ 16
2.5.1 Cyber Security Assessment using the German BSI Guidelines described in SWOT
diagrams ......................................................................................................................................... 17
2.5.2 Defining a Security Architecture and Levels using IEC 62443 ........................................ 18
3 A Macroeconomic Evaluation of Cyber-attacks and a Projection of the Results to the SWW Territory ..... 19
3.1 An Economic Test-bed based Empiric Analysis ................................................................... 19
3.1.1 People employed by businesses in supplied area .............................................................. 21
3.1.2 Power demand by businesses and households in supplied area ........................................ 22
3.1.3 Division of SWW area in urban vs. rural areas ................................................................. 23
3.1.4 Number of Interruptions in the Grid in the Supplied Area ................................................ 23
3.1.5 Duration of Interruptions in the Grid ................................................................................. 24
3.2 Assessment of Power Outage Damage .................................................................................. 25
3.3 Concluding remarks .............................................................................................................. 30
4 DSO Assessments Provide an Impression of the Current Security Situation, Challenges and Risks ........... 31
4.1 Results of the SWW Assessment .......................................................................................... 35
4.1.1 A value status analysis provides an overview of assets (CAPEX, OPEX, revenue) ..... 39
4.1.2 Results of SWW Self-assessment and Security Level ................................................... 39
4.2 Results of SWK Assessment ................................................................................................. 41
4.2.1 A value status analysis provides an overview of assets (CAPEX, OPEX, revenue) ..... 43
4.2.2 Results of SWK Self-assessment and Security Level ................................................... 43
4.3 Results of SWH Assessment ................................................................................................. 45
4.3.1 A value status analysis provides an overview of assets (CAPEX, OPEX, revenue) ..... 47
4.3.2 Results of SWH self assessment and security level ...................................................... 47
5 Key Findings and Conclusions ..................................................................................................................... 48
References ............................................................................................................................................................. 51
Appendix A: Details of Cost Calculations ............................................................................................................ 53
D5.1 Business Cases for Smart Grid Cyber Security Measures © SPARKS Consortium
Deliverable D5.1 Page 5 of 54
List of Figures:
Figure 1: The financial impact from (cyber) attacks to any grid infrastructure will be evaluated by
both, a top down and a bottom up approach. ......................................................................................... 10 Figure 2: Model for transfer of findings in Italy to SWW and supplied region .................................... 16 Figure 3: A survey provides the ranking of potential impact (economic loss) from cyber risks – see the
Allianz Risk Barometer 2015. Figures represent a percentage of all eligible responses to the questions
- 127 in total. More than one risk selected [5] ....................................................................................... 16 Figure 4 : The cyber security assessment process according to German BSI Guideline [10] ............... 17 Figure 5: The reference model according to IEC 62443 standards shows the automation and control
levels assessed. Chart developed according to [12] page 63. ................................................................ 18 Figure 6: Value added by sector in supplied area in % ......................................................................... 21 Figure 7: People employed by businesses in supplied area ................................................................... 22 Figure 8: Power demand by businesses and households in supplied area ............................................. 23 Figure 9: Number of interruptions in the grid in supplied area ............................................................. 24 Figure 10: Duration of interruptions in Grid in min p.a. in supplied area ............................................. 24 Figure 11: Sector-specific damage, taking into account lost intermediary inputs and additional
personnel costs for agriculture, forestry and fishing ............................................................................. 25 Figure 12: Sector-specific damages taking into account lost intermediary inputs and additional
personnel costs for Mining and quarrying electricity, gas, steam and air conditioning supply, water
supply, sewerage, waste management, and remediation activities ........................................................ 26 Figure 13: Sector-specific damages taking into account lost intermediary inputs and additional
personnel costs for Manufacturing ........................................................................................................ 26 Figure 14: Sector-specific damages taking into account lost intermediary inputs and additional
personnel costs for construction ............................................................................................................ 27 Figure 15: Sector-specific damages taking into account lost intermediary inputs and additional
personnel costs for Wholesale and retail trade, repair of motor vehicles and motorcycles; Transporting
and storage; Accommodation and food service activities ..................................................................... 27 Figure 16: Sector-specific damages taking into account lost intermediary inputs and additional
personnel costs for Information and communication ............................................................................ 28 Figure 17: Sector-specific damages taking into account lost intermediary inputs and additional
personnel costs for Financial and insurance activities........................................................................... 28 Figure 18: Sector-specific damages taking into account lost intermediary inputs and additional
personnel costs for Real estate activities. Professional, scientific and technical activities.
Administrative and support service activities ........................................................................................ 29 Figure 19: Sector-specific damages taking into account lost intermediary inputs and additional
personnel costs for Public administration and defense, compulsory social security, Education, Human
health and social work activities, Arts, entertainment and recreation, Other service activities ............ 29 Figure 20: Sector-specific damages taking into account lost intermediary inputs and additional
personnel costs for Services in private households ............................................................................... 30 Figure 21: Sector-specific damages taking into account lost intermediary inputs and additional
personnel costs for exterritorial organizations ...................................................................................... 30 Figure 22: The generic ICT architecture of an utility shows the potential targets for cyber-attacks on
administration, supervisory, and field level .......................................................................................... 32 Figure 23 : The EnWG Cascade specifies a process regarding how to manage and control the electrical
network; the necessity of re-dispatch interactions increases drastically in the coming years [16]. ...... 35 Figure 24: SWW’s current ICT architecture, management and control system (without research
systems and applications already running in a test phase) .................................................................... 36 Figure 25: SWW power system and grid with stations connected to SCADA and prepared connections
............................................................................................................................................................... 38 Figure 26: Partslist of SWW ICT vulnerability analysis ....................................................................... 38 Figure 27: SWW CAPEX / OPEX analysis .......................................................................................... 39
D5.1 Business Cases for Smart Grid Cyber Security Measures © SPARKS Consortium
Deliverable D5.1 Page 6 of 54
Figure 28: SWW SWOT analysis related to cyber security and smart grid capabilities show medium
risk and good preparations to meet furure challenges ........................................................................... 40 Figure 29: SWK’s current ICT architecture, management and remote grid control system ................. 41 Figure 30: SWK CAPEX / OPEX analysis ........................................................................................... 43 Figure 31: SWK SWOT analysis related to cyber security and smart grid capabilities ........................ 44 Figure 32 : SWH’s current ICT architecture and innovative smart grid infrastructure ......................... 45 Figure 33: SWH CAPEX / OPEX analysis ........................................................................................... 47 Figure 34: SWH SWOT analysis related to cyber security and smart grid capabilities ........................ 48 Figure 35: To keep the power grid stable it will be necessary to install advanced ICT systems to
provide the DSO safe and reliable tools to efficiently manage and control the grid at all levels [16]
p.30 ........................................................................................................................................................ 49
D5.1 Business Cases for Smart Grid Cyber Security Measures © SPARKS Consortium
Deliverable D5.1 Page 7 of 54
Definitions and Abbreviations
BDEW cascade – Bundesverband Deutscher Energiewirtschaft has developed cascading procedure in
generation and dispatching of renewables. In case of security, stability violations the TSO and DSO
collaborate to lower the infeed of renewable generation in DSOs grid. TSO initiates and DSOs operate
these measures according to a cascading process.
CAPEX – Capital expenditure (cost to set up grid on todays prices)
DBS – Data Base System
DSO – Distribution System Operator (regarding electricity distribution)
EHS – Environment / Health / Safety
EnWG – Energie Wirtschaftsgesetz means the German energy economy act
FO – Fibre Optics
FRFI – Federally Regulated Financial Institutions
GDP – Gross Domestic Product
GPRS – General Packet Radio Service
GSM – Global System for Mobile Communications
ICS – Industrial Control System
ICT – Information and Communication Technology
IEC – International Electrotechnical Commission. The IEC is the international standards and
conformity assessment body for all fields of electrotechnology.
KPI – Key Performance Indicator
MTBF – Meantime Between Failure
MTTI – Meantime to detect a fault (definition by the authors)
MTTR – Meantime to Recovery sometimes used as Meantime to Repair
OPEX – Operation expenditure (cost to operate system for one full year)
OT Operational Technology
Passive costs – total costs of damages and losses due to cyber-attack, where the target has been
unprotetected by refraining from usage of any available protection measures
PII – Personally Identifiable Information, or Sensitive Personal Information
RTU – Remote Terminal Unit
SCADA – Supervisory Control And Data Acquisition
D5.1 Business Cases for Smart Grid Cyber Security Measures © SPARKS Consortium
Deliverable D5.1 Page 8 of 54
Security zone – grouping of logical or physical assets that share common security requirements
SFTP – Safe File Transfer Protocol
Smart Grid – A smart grid is an electrical grid which includes a variety of operational and energy
measures including smart meters, smart appliances, renewable energy resources, and energy efficiency
resources. Electronic power conditioning and control of the production and distribution of electricity
are important aspects of the smart grid [1].
TCOR – Total Cost of Risk
TSO – Transmission System Operator (regarding electricity transmission)
Turnover - per day (breakdown from annual figure on 365 days)
VoLL – Value of lost load
VPN - Virtual Private Network meaning a virtual point-to-point connection to extend a private
network across a public network
WP – Work Package of this SPARKS project
D5.1 Business Cases for Smart Grid Cyber Security Measures © SPARKS Consortium
Deliverable D5.1 Page 9 of 54
1 Background and Motivation
WP5 in the SPARKS project is primarily concerned with developing new insights into the financial
and social aspects of smart grid cybersecurity, in order to support the activities that are being carried
out in the project, and to inform national and European discourse on these important matters.
It is important to understand the potential financial costs of cyber-attacks on a (smart) grid. The
information on overall costs for damage in the case of an attack, without protection measures (passive
costs), is very vague with one exception: risk managers have created a method of assessing the total
cost of risk (TCoR) to enterprises by collecting and comparing the cost for insuring several risks
arising during set-up and operation of business.
SPARKS makes a first attempt at the quantification of the expected passive costs of several attack
scenarios, such as those considered in the security analysis activities of the SPARKS project, to power
system operators in a smart grid. The aforementioned activity investigates the direct costs that, for
example, a DSO may face in the event of a successful cyber-attack to its (smart) grid infrastructure.
In Section 2 of this deliverable, a way to define a cost model by using analogies to macro-economic
studies is described. The approach is based on evaluating existing data on real blackout incidents,
searching for analogies that allow the use of macro-economic findings to calculate an overall view on
supplying enterprises, taking a look on risk management and insurance activities and concluding with
a look on existing regulations and architectures for cyber security. Following on from the presentation
of the approach to determining a cost model, in Section 3 the real outcomes and findings of blackout
incidents are projected to the SWW territory.
In Section 4, three economic test beds – SWW Wunsiedel, SWH Haßfurt and SWK Kelheim – that
represent typical (smart) grid systems have been assessed. All three grids under assessment are
operable on a “semi-smart” basis at different levels of automation, as of today. However, planning is
already on the way for all three grids to implement systems to achieve a “full-smart” level of grid
operation.
Finally, in Section 5, based on the findings of the security assessment of the three DSOs, an approach
is presented for a top-down estimation of how to evaluate the possible damage costs based on Capital
Expenditure (CAPEX), Operation Expenditure (OPEX), revenue of each DSO, and Gross Domestic
Product (GDP) of the supplied region. This approach is based on the real data of the three DSOs,
which have been taken from their balance sheets and business records.
Figure 1 describes the two different approaches – bottom up and top down – on how to determine the
results. The current status of the three DSOs concerning smart grid, smart grid investments, processes
and security level achieved is assessed and documented, the losses from lost revenue and liquidated
damages due to DSO liability obligations are estimated and documented in this document (top-down).
The results of a cost simulation based on a detailed cost model of the existing grid for the DSO SWW
will be described in Deliverable D5.2 (bottom-up). Business cases that motivate the adoption of the
smart grid measures that are produced in the project will be developed for the second version of this
document D5.2 (bottom-up) for one DSO (SWW).

D5.1 Business Cases for Smart Grid Cyber Security Measures © SPARKS Consortium
Deliverable D5.1 Page 10 of 54
Figure 1: The financial impact from (cyber) attacks to any grid infrastructure will be evaluated by both, a top down and a bottom up approach.
D5.1 Business Cases for Smart Grid Cyber Security Measures © SPARKS Consortium
Deliverable D5.1 Page 11 of 54
2 Assessment Method: A Cost Model based on a Macroeconomic Case Study
In the following, we describe our approach to top-down assessment of the costs of an attack to a DSO,
which form the basis of a business case for “non”-investing in cybersecurity solutions.
2.1 Assessing the Economic Ramifications of Supply Interruptions
The economic assessments carried out in this report contain the results of damage valuation of costs,
which arise in the event of a power outage. These investigate opportunity cost aspects of the
conducted “fully-costed business cases”.
In particular, costs arise to businesses, customers and society as a whole in the event that cyber
security measures are not successful. These encompass various cost categories and are investigated
here in detail. In contrary to the costs that arise for the DSO and power retailer, damage associated
with unavailability of electric energy potentially affects the entire economy. Despite their importance,
these are underrepresented in the public debate. Thus, these costs which are highly relevant for policy
makers and stakeholders from industry and administration are presented here.
Summarizing, by means of economic test beds, the aim of the investigation is to inform decision
makers with the knowledge of the costs that are associated with not successful protection measures.
They show the importance of electricity supply security for businesses and society and put a monetary
value to cyber security measures, which also come at a cost, but can now be evaluated also based on
their benefits.
2.2 A Methodology for Economic Assessment
This deliverable entails the development of the framework for assessing the economic damage, in the
case that protection measures are not successful. In doing so, a survey was conducted with the
participation of the economic testbed stakeholder SWW Wunsiedel GmbH. The main findings of these
empiric assessments and descriptive statistics of this stakeholder are presented subsequently.
In addition, findings from previous research projects are incorporated, especially with regard to
sectoral differences, e.g., in terms of the economic structure of the regions that are supplied, the
number of households and citizens, the economic status (GDP per capita), business specifics such as
personnel intensity of various sectors (i.e., the share of wages as a proportion of the overall value
added), etc.
Thus, for the evaluations in the conducted economic test beds, both primary research, and previous
findings from European and national sources were exploited. Thus, data elicited empirically, as well as
the statistical data, forms the cornerstone of this analysis1. First and foremost, a distinction between
the different categories of damages in the supplied areas was made. This results in a split into two
main customer groups:
1. Households
1 The statistical units for which the economic activity is reported, is determined by the availability of data. With
respect to the geographical dimension, the area reported by the DSO is taken as base unit and system boundary.
Additional to the geographical differentiation, economic activity is additionally split between 9 commercial as
well as the household sector.

D5.1 Business Cases for Smart Grid Cyber Security Measures © SPARKS Consortium
Deliverable D5.1 Page 12 of 54
2. Non-households, including industry, commercial and administrative entities
Accordingly, the economic loss calculation methodology is based on two independent assessment
pillars. For non-households, this analysis assesses the vulnerability of the commercial and public
service sectors, by means of value added methodology. In particular, a detailed analysis of the value
added of the different commercial and industrial sectors for the accounted regions per annum was
undertaken. The data for this investigation was gathered in collaboration with the DSO responsible for
the economic test bed of SWW Wunsiedel GmbH. Furthermore, detailed standardized load profiles for
each commercial sector and country have been created. This is necessary to account for individual
differences in terms of damage vulnerability2. Under the assumption that electricity consumption
serves as a direct proxy of current production levels, the value added for each region and industrial
sector for every minute of the year is calculated3.
Subsequently, the influence of personnel costs and lost inputs were considered. This takes into account
that certain materials might be lost in the case of an outage, which is especially relevant for the
production sectors.
In total, nine economic sectors were identified, all of which are based on the “NACE Rev. 2” system4.
Table 1 lists the represented sectors5. Subsequently, the influence of personnel costs and lost inputs
were considered. This takes into account that certain materials might be lost in case of an outage,
which is especially relevant for the producing sectors6.
Table 1: Assessed economic sectors and households
(A) Agriculture, forestry and fishing
(B,D,E) Mining and quarrying Electricity, gas, steam and air conditioning supply,
Water supply, sewerage, waste management and remediation activities
(C) Manufacturing
(F) Construction
(G,H,I) Wholesale and retail trade, repair of motor vehicles and motorcycles;
Transporting and storage; Accommodation and food service activities
(J) Information and communication
(K) Financial and insurance activities
(L,M,N) Real estate activities. Professional, scientific and technical activities.
Administrative and support service activities
(O,P,Q,R,S) Public administration and defence, compulsory social security, Education,
Human health and social work activities, Arts, entertainment and
recreation, Other service activities
2 The utilized individual load profiles are based on the standardized load profiles provided by BDEW/VDEW for
Germany. 3 This value added (VA) approach assumes the absolute absence of production in the case of power outage.
4 A full representation of the “NACE Rev. 2” was not possible due to data availability, thus the 21 sectors were
aggregated in 9 clusters. 5 The sectors T (activities of households as employers; undifferentiated goods- and services-producing activities
of households for own use) and U (activities of extraterritorial organisations and bodies) were neglected due to
data availability and their minor relevance in a European supply security context 6 The sectors T (activities of households as employers; undifferentiated goods- and services-producing activities
of households for own use) and U (activities of extraterritorial organisations and bodies) were neglected due to
data availability and their minor relevance in a European supply security context

D5.1 Business Cases for Smart Grid Cyber Security Measures © SPARKS Consortium
Deliverable D5.1 Page 13 of 54
In order to correct the value-added approach, economic damage differing from losing value added, like
material damage, re-starting time of production processes, etc., this independent calculation for the
outage costs for the commercial sector was conducted by applying state-of-the art outage assessment
methodologies. In addition, this calculation allows the assessment of the value of lost load (VoLL),
which is a prominently used figure for the value of supply security, and is characterized by the
division of total outage cost by the energy which was not supplied (in kWh). This makes it possible to
interact the figure with literature-based findings of the value of uninterrupted power supply7.
In terms of the assessed sectors, the NACE nomenclature was followed throughout. Exceptions to this
methodology are the case for the generic sector “mining-energy-water” (B,D,E) and for the sectors
(L), (M) and (N), which form the generic sector “Real estate activities, Professional, scientific and
technical activities, Administrative and support service activities”(L,M,N).
The public sector (O,P,Q,R,S) was calculated as the residuum.
In addition, this non-household customer group, residential customers are also taken into account. In
particular, for households, a quantification of their willingness to pay (WTP) to avoid an outage is the
corner stone of the opportunity cost assessment.
Data for this analysis come primarily from a survey conducted for the EU FP7 SESAME (Securing the
European Electricity Supply Against Malicious and Accidental Threats) research project. The survey
was conducted during the last two quarters of 2012 and the first quarter of 2013 in all EU- 27 nations.
The survey was given both as an Internet survey and on the phone with supplementary materials sent
to phone-respondents via post. This massive survey effort, encompassing over 13,000 interview hours
and over 400,000 contact attempts, yielded over 8,000 completed questionnaires with around 300
survey responses per nation. Substantial effort was exerted to ensure that the final sample was
representative of each nation's population in the dimensions of gender, age, working status, income,
nation, and rural residents. The survey obtained demographic, energy usage, and energy perception
information from each individual, and included a choice experiment designed to elicit respondent's
WTP to avoid blackouts of certain characteristics.
The basic facts of the sample for this analysis are presented in Table 2.
Table 2: Characteristic of survey respondents (N= 8,067)
Characteristic of respondents Mean Std. Dev. Min. Max.
lives in urban area 0.32 0.46 0 1
is male 0.49 0.50 0 1
between age 35 and 45 0.24 0.43 0 1
between age 46 and 60 0.30 0.46 0 1
over age 60 0.25 0.43 0 1
members in household 2.65 1.24 1 6
college degree 0.41 0.49 0 1
7 This analysis takes into account diminishing marginal costs of power outages. This is intuitive as after the first
moment adaption takes place. In addition, the calculation of the VoLL was also established to increase the
robustness and comparability of the outage cost analysis.
D5.1 Business Cases for Smart Grid Cyber Security Measures © SPARKS Consortium
Deliverable D5.1 Page 14 of 54
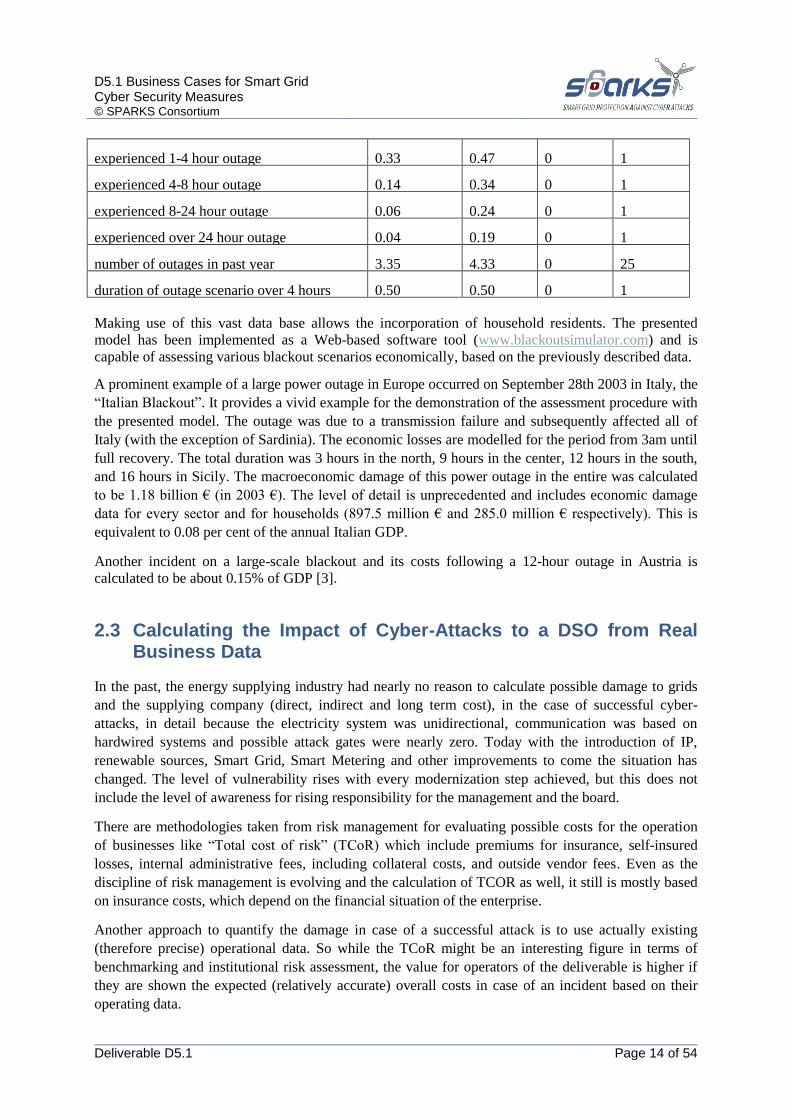
experienced 1-4 hour outage 0.33 0.47 0 1
experienced 4-8 hour outage 0.14 0.34 0 1
experienced 8-24 hour outage 0.06 0.24 0 1
experienced over 24 hour outage 0.04 0.19 0 1
number of outages in past year 3.35 4.33 0 25
duration of outage scenario over 4 hours 0.50 0.50 0 1
Making use of this vast data base allows the incorporation of household residents. The presented
model has been implemented as a Web-based software tool (www.blackoutsimulator.com) and is
capable of assessing various blackout scenarios economically, based on the previously described data.
A prominent example of a large power outage in Europe occurred on September 28th 2003 in Italy, the
“Italian Blackout”. It provides a vivid example for the demonstration of the assessment procedure with
the presented model. The outage was due to a transmission failure and subsequently affected all of
Italy (with the exception of Sardinia). The economic losses are modelled for the period from 3am until
full recovery. The total duration was 3 hours in the north, 9 hours in the center, 12 hours in the south,
and 16 hours in Sicily. The macroeconomic damage of this power outage in the entire was calculated
to be 1.18 billion € (in 2003 €). The level of detail is unprecedented and includes economic damage
data for every sector and for households (897.5 million € and 285.0 million € respectively). This is
equivalent to 0.08 per cent of the annual Italian GDP.
Another incident on a large-scale blackout and its costs following a 12-hour outage in Austria is
calculated to be about 0.15% of GDP [3].
2.3 Calculating the Impact of Cyber-Attacks to a DSO from Real Business Data
In the past, the energy supplying industry had nearly no reason to calculate possible damage to grids
and the supplying company (direct, indirect and long term cost), in the case of successful cyber-
attacks, in detail because the electricity system was unidirectional, communication was based on
hardwired systems and possible attack gates were nearly zero. Today with the introduction of IP,
renewable sources, Smart Grid, Smart Metering and other improvements to come the situation has
changed. The level of vulnerability rises with every modernization step achieved, but this does not
include the level of awareness for rising responsibility for the management and the board.
There are methodologies taken from risk management for evaluating possible costs for the operation
of businesses like “Total cost of risk” (TCoR) which include premiums for insurance, self-insured
losses, internal administrative fees, including collateral costs, and outside vendor fees. Even as the
discipline of risk management is evolving and the calculation of TCOR as well, it still is mostly based
on insurance costs, which depend on the financial situation of the enterprise.
Another approach to quantify the damage in case of a successful attack is to use actually existing
(therefore precise) operational data. So while the TCoR might be an interesting figure in terms of
benchmarking and institutional risk assessment, the value for operators of the deliverable is higher if
they are shown the expected (relatively accurate) overall costs in case of an incident based on their
operating data.
D5.1 Business Cases for Smart Grid Cyber Security Measures © SPARKS Consortium
Deliverable D5.1 Page 15 of 54
For this top-down approach, a calculation model, based on the three operating test beds – SWW
Wunsiedel (SWW), SWH Haßfurt (SWH) and SWK Kelheim (SWK) – has been developed using real
data to evaluate the following costs:
the damage costs to grid hardware and grid control system (combined with several expected
damage factors);
the necessary working effort to start operation again (combined with several effort factors);
the loss of revenue for the time during the outage (hours or days possible, based on the
average yearly revenues out of electricity sales);
and all the costs of damage caused to the supplied region (based on the real GDP of the
supplied region taken from statistics combined with the factor from the Italian blackout).
Sources like Italian Blackout show the real macroeconomic amount of damage in different regions
caused by live cyber-attacks. The figure is 0.08% of GDP. Another article on a 12 hour outage in
Austria calculated the costs of outage to be about 0.15% of GDP. In this calculation the factor 0,08%
of GDP is used as a more conservative estimate to avoid overestimation.
Based on the two aforementioned articles an average duration of 12 hours (often found in scientific
literature and mentioned here) is used as a suitable blackout period and stays conforms to established
scenarios.
Additionally, these sources show that the expected cost after a cyber-attack and blackout are low in
terms of direct damage to equipment and the software installed. The costs for repair depend on the
complexity of damage, availability of labor and spare parts.
CAPEX can be found in assets accounting for amortized cost and current replacement value; the data
on CAPEX can be separated for grid equipment and SCADA, control and ICT systems. No data on
buildings and vehicles were taken into account. The data for OPEX can be found in the operating
expenses in the profit and loss account; the operating expenses can be separated for grid equipment
and SCADA, control and ICT systems. Neither buildings nor vehicles have been taken into account.
To give a first indication on cost estimation without a viable tooling available, the results and findings
from live attacks are applied to the key financial figures of SWW, SWH and SWK. The mathematical
calculation tool is based on CAPEX and OPEX data, as is in the balance, combined with factors
derived from studies on real black-out events.
The loss of turnover for the supplying company (in days or hours or minutes) caused by cyber-attacks
can be calculated using the annual turnover achieved with selling electricity.
The overall damage to the supplied region is calculated with a reduction factor (0,08%) applied to the
annual GDP of the supplied region (see Section 3.1).
The questions on all possible matters of loss of reputation and loss of company value are not analyzed
here.
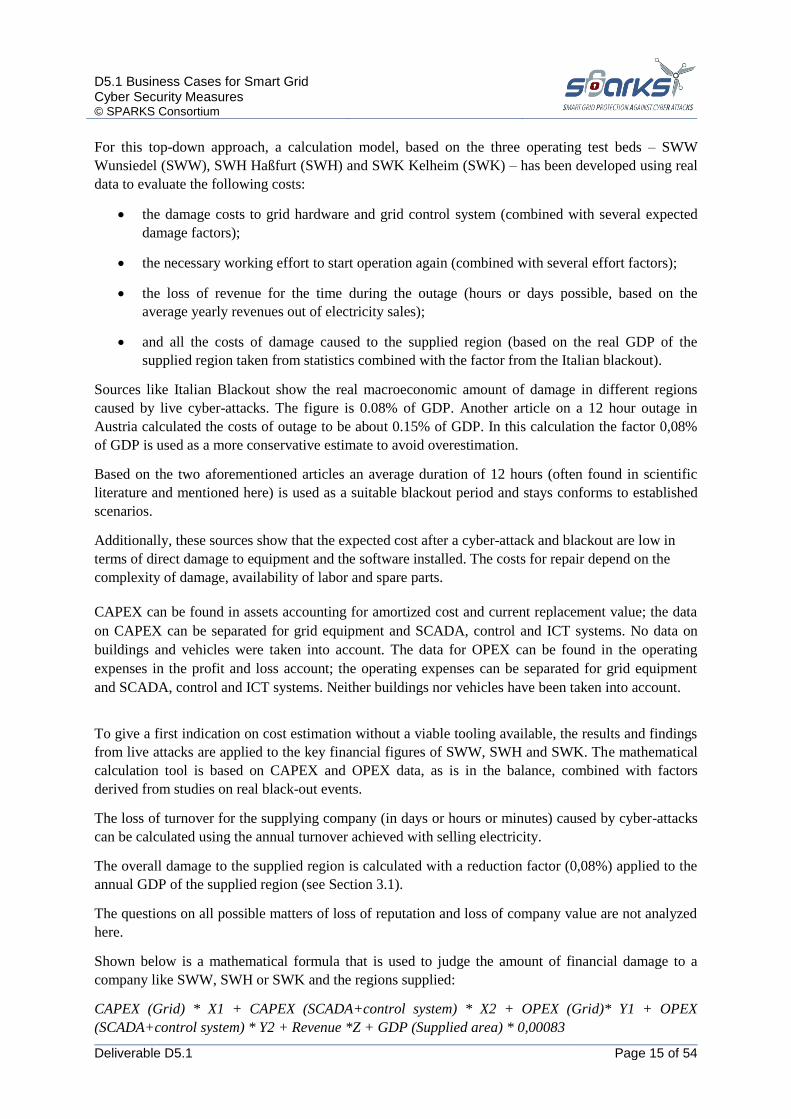
Shown below is a mathematical formula that is used to judge the amount of financial damage to a
company like SWW, SWH or SWK and the regions supplied:
CAPEX (Grid) * X1 + CAPEX (SCADA+control system) * X2 + OPEX (Grid)* Y1 + OPEX
(SCADA+control system) * Y2 + Revenue *Z + GDP (Supplied area) * 0,00083
D5.1 Business Cases for Smart Grid Cyber Security Measures © SPARKS Consortium
Deliverable D5.1 Page 16 of 54
2.4 The Analogy between Macro-economical Evaluations and Business (DSO) Assessments
The three companies to be assessed (SWW, SWH and SWK) all operate region-based grids, so the
formulas described in Section 2.3 are applied. Sources like the Italian Blackout show the real
macroeconomic amount of damage in different regions caused by live cyber-attacks. The figure is
0.08% of GDP. Another article on a 12-hour outage in Austria calculated the costs of outage to be
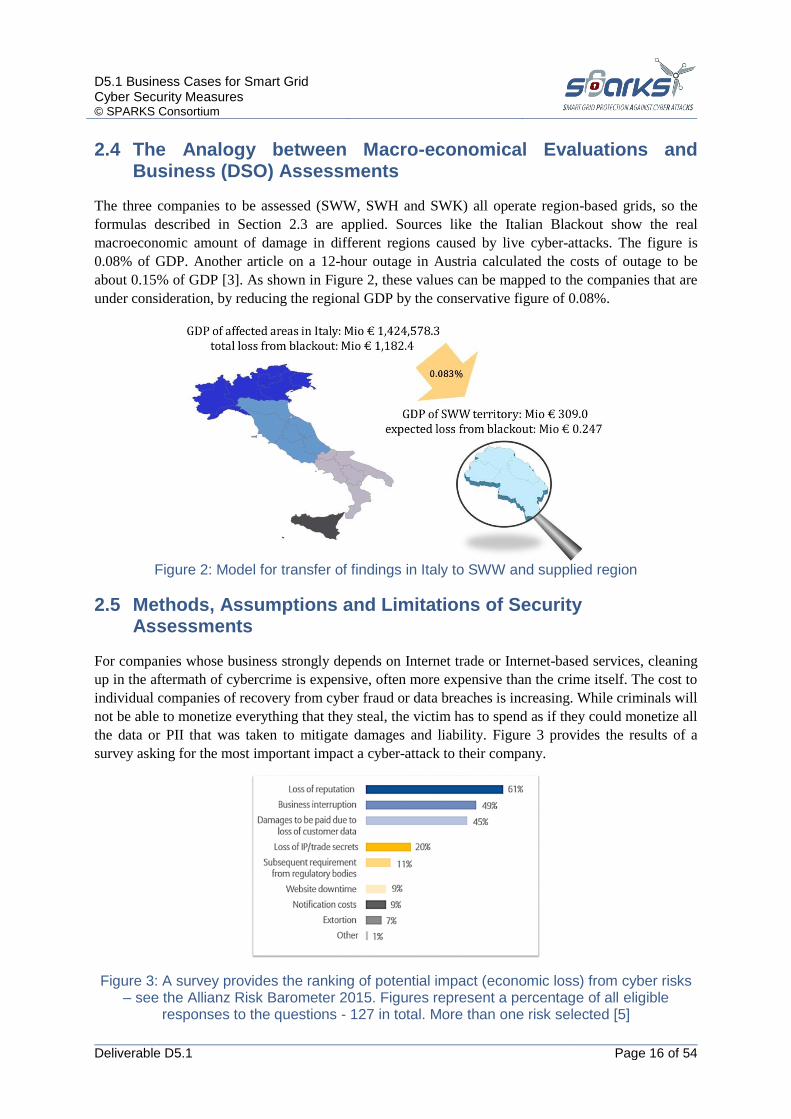
about 0.15% of GDP [3]. As shown in Figure 2, these values can be mapped to the companies that are
under consideration, by reducing the regional GDP by the conservative figure of 0.08%.
Figure 2: Model for transfer of findings in Italy to SWW and supplied region
2.5 Methods, Assumptions and Limitations of Security Assessments
For companies whose business strongly depends on Internet trade or Internet-based services, cleaning
up in the aftermath of cybercrime is expensive, often more expensive than the crime itself. The cost to
individual companies of recovery from cyber fraud or data breaches is increasing. While criminals will
not be able to monetize everything that they steal, the victim has to spend as if they could monetize all
the data or PII that was taken to mitigate damages and liability. Figure 3 provides the results of a
survey asking for the most important impact a cyber-attack to their company.
Figure 3: A survey provides the ranking of potential impact (economic loss) from cyber risks – see the Allianz Risk Barometer 2015. Figures represent a percentage of all eligible
responses to the questions - 127 in total. More than one risk selected [5]

D5.1 Business Cases for Smart Grid Cyber Security Measures © SPARKS Consortium
Deliverable D5.1 Page 17 of 54
Looking at DSOs and utility companies, this situation is different and the same survey would probably
provide other results. DSO’s business and operation is not Internet-based. The effect and impact of
cyber-attacks definitely would cause damage and losses, especially when considering the remedy
obligations from contracts with industry or other customers, in the case of a blackout. Therefore,
defining security levels and performing a risk analysis provides another and new approach for DSOs
and utility companies. Losses, such as lost revenue, penalties, interests, obligatories (fixed costs – e.g.
leasing), liability and recovery costs, will be investigated by:
1. A technical assessment of automation and the ICT infrastructure installed; and
2. An assessment of the business processes and the organization that address the risks from
cyber-attacks.
2.5.1 Cyber Security Assessment using the German BSI Guidelines described in SWOT diagrams
The SPARKS project has developed a cyber security assessment especially for DSOs and utility
companies. This assessment methodology and process were not available when WP5 initiated the
assessment of three reference DSOs. Nevertheless, to perform a cyber security self-assessment it is
useful to find guidance from an accepted and competent organization. In Germany, where the three
economic test beds are located, the BSI fulfills this role. DSOs are encouraged to use BSI guidelines to
assess their current level of preparedness, and to develop and maintain effective cyber security
practices [9]. Consequently, to complete the cybersecurity self-assessment we used the security
assessment approach that is advocated by the BSI, and depicted in Figure 4.
Figure 4 : The cyber security assessment process according to German BSI Guideline [10]
Assessments shall be documented in formalized reports, which due to confidetiality reasons are not up
to be published. Instead, the results of the DSO assessments done for SPARKS have been summarized
in form of SWOT diagrams (see Section 4). The SWOT matrix is a useful way of drawing together the
results of the BSI assessments. It is a technique for understanding Strength and Weaknesses, and for
identifying both the Opportunities and the Threats, which the DSO has to face. Identification of
SWOTs related to ICT and cyber security is important because they can inform later steps in planning
to achieve a secure but also a feasible and future oriented utility management system.
D5.1 Business Cases for Smart Grid Cyber Security Measures © SPARKS Consortium
Deliverable D5.1 Page 18 of 54
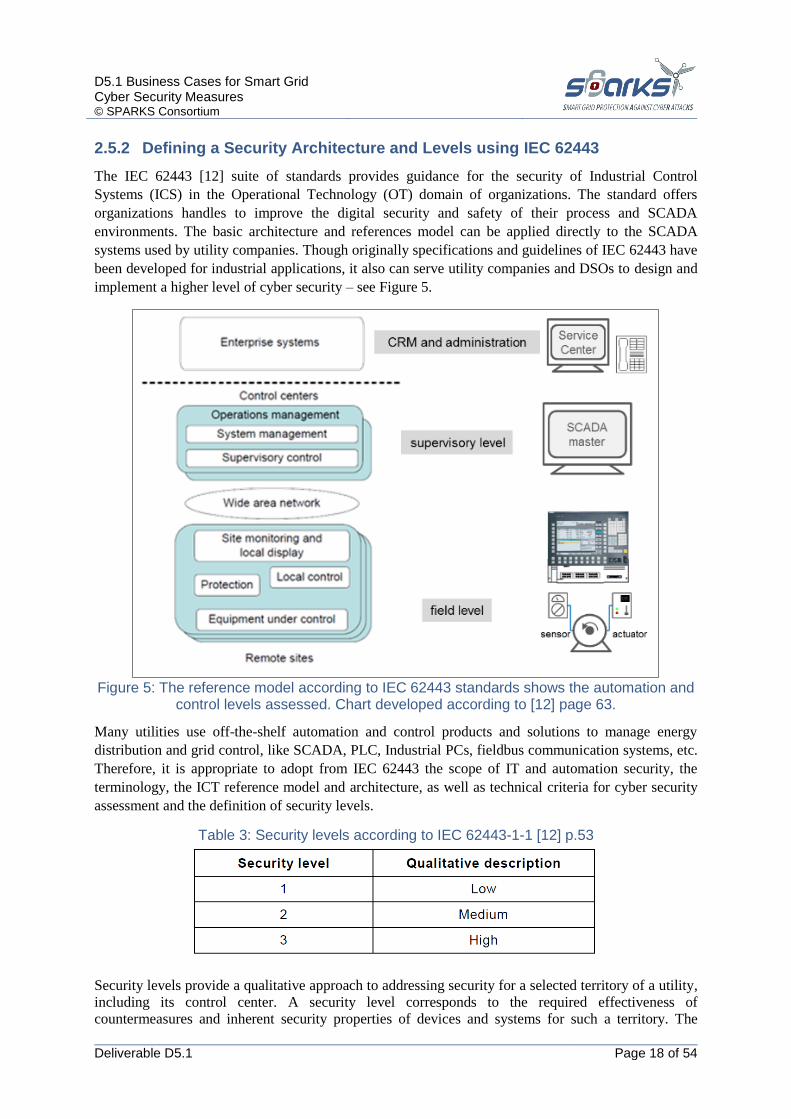
2.5.2 Defining a Security Architecture and Levels using IEC 62443
The IEC 62443 [12] suite of standards provides guidance for the security of Industrial Control
Systems (ICS) in the Operational Technology (OT) domain of organizations. The standard offers
organizations handles to improve the digital security and safety of their process and SCADA
environments. The basic architecture and references model can be applied directly to the SCADA
systems used by utility companies. Though originally specifications and guidelines of IEC 62443 have
been developed for industrial applications, it also can serve utility companies and DSOs to design and
implement a higher level of cyber security – see Figure 5.
Figure 5: The reference model according to IEC 62443 standards shows the automation and
control levels assessed. Chart developed according to [12] page 63.
Many utilities use off-the-shelf automation and control products and solutions to manage energy
distribution and grid control, like SCADA, PLC, Industrial PCs, fieldbus communication systems, etc.
Therefore, it is appropriate to adopt from IEC 62443 the scope of IT and automation security, the
terminology, the ICT reference model and architecture, as well as technical criteria for cyber security
assessment and the definition of security levels.
Table 3: Security levels according to IEC 62443-1-1 [12] p.53
Security levels provide a qualitative approach to addressing security for a selected territory of a utility,
including its control center. A security level corresponds to the required effectiveness of
countermeasures and inherent security properties of devices and systems for such a territory. The
D5.1 Business Cases for Smart Grid Cyber Security Measures © SPARKS Consortium
Deliverable D5.1 Page 19 of 54
security level method provides the ability to categorize risk for an individual DSO. It also helps to
define the required effectiveness of the countermeasures that are used to prevent unauthorized
electronic intervention that can read or affect the normal functioning of the grid systems in use. A
minimum of three security levels is recommended [12]. The three levels can be qualitatively
described, as shown in Table 3. For our study, the factors that influence the determination of the
security level are taken from the BSI guideline [10] – see also Figure 4.
3 A Macroeconomic Evaluation of Cyber-attacks and a Projection of the Results to the SWW Territory
This section contains an overview of the adverse effects resulting from insufficient cyber security
measures. A lack of sufficient privacy and security protection measures affect electricity markets
substantially8. The SPARKS project makes use of well-established assessment methodology for the
identification of damages resulting from the absence of appropriate cyber security measures, which in
the worst case lead to the interruption of power supply to customers. In this project, an evaluation of
the resulting adverse effects was conducted by means of economic test beds, which were implemented
in interaction with the participating DSO.9
In this report, a brief overview of the data provided by the test bed stakeholder is presented. The
methodology applied to these economic test beds was developed by (Reichl, Schmidthaler, &
Schneider, 2013) and first applied at the European level in the research project SESAME
(Schmidthaler, Reichl, Johannes , Schmidinger, Stefan , Voronca, Simona , & Roman,Tania Ecaterina,
2013). For ease of utilization, it has been modified thoroughly to cater for the need for intuitive
application of various user groups in industry, policy and administration. This resulted in an
application of a newly developed analysis tool10
for various power outage evaluations.
The investigation allows to thoroughly assess and objectively assign monetary damages to every
NACE sector (9 in total) at a very fine-mesh geographic granularity (NUTS II level, 266 in total). The
relevant conclusions are then drawn and the importance of sufficiently high levels of electricity supply
security to every sector and area (respectively) are presented. This allows a best-practice choice of
measures for decision makers and potentially affected power customers in various industries as well as
the interested public.
The remainder of this section is structured as follows: Section 3.1 investigates the situation in the
economic test bed SWW, which was conducted to shed some light on the importance of proper
security investments, which became a necessity with the dawn of a truly European smart grid. Section
3.2 then highlights the methodological approach needed for various sector-specific assessments.
3.1 An Economic Test-bed based Empiric Analysis
In order to incorporate the ramifications of supply interruptions resulting from unsuccessful cyber
security protection measures, economic test beds are assessed with regards to the effects on various
customer groups (businesses and administration from 9 sectors as well as households separately). The
economic test bed methodology is based on several empirical assessment stages.
8 D5.3 of the SPARKS project is dedicated to this topic, and provides a better understanding of the societal
dimension of deteriorating privacy and security standards. 9 DSO form the network part of formerly unified utility companies which were established after the vertical
disintegration of utilities. 10
blackout-simulator.com, which is described in detail in [3].
D5.1 Business Cases for Smart Grid Cyber Security Measures © SPARKS Consortium
Deliverable D5.1 Page 20 of 54
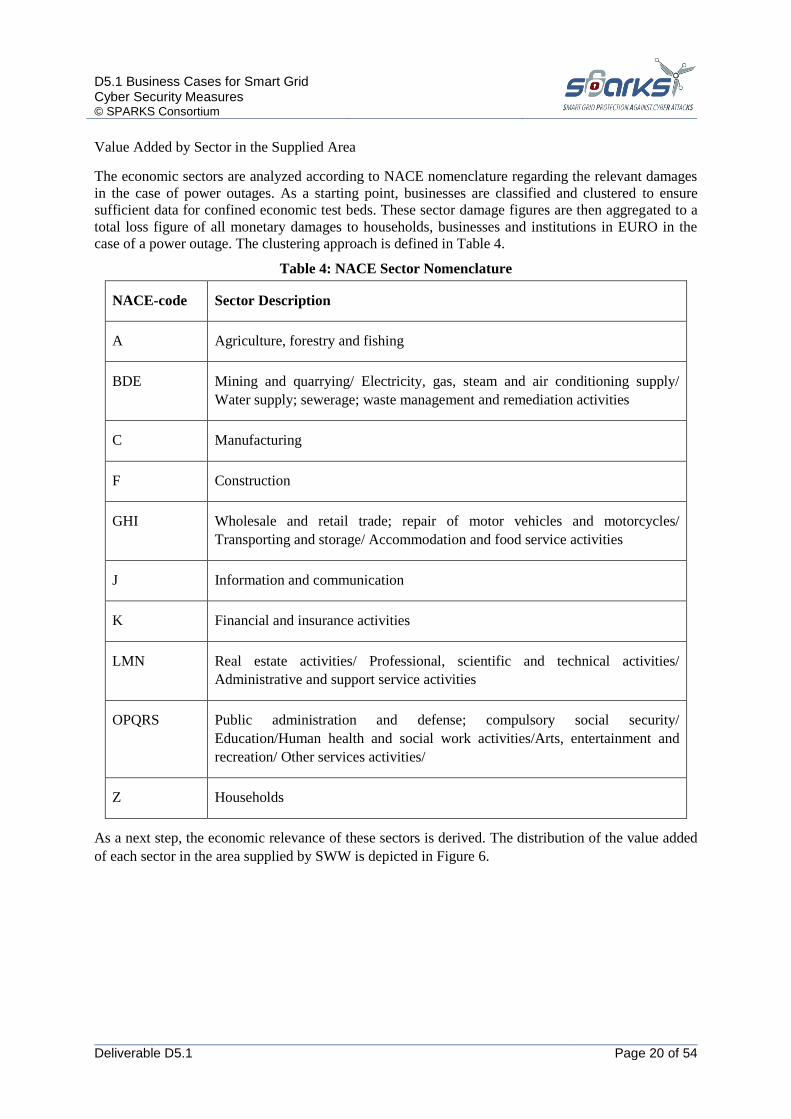
Value Added by Sector in the Supplied Area
The economic sectors are analyzed according to NACE nomenclature regarding the relevant damages
in the case of power outages. As a starting point, businesses are classified and clustered to ensure
sufficient data for confined economic test beds. These sector damage figures are then aggregated to a
total loss figure of all monetary damages to households, businesses and institutions in EURO in the
case of a power outage. The clustering approach is defined in Table 4.
Table 4: NACE Sector Nomenclature
NACE-code Sector Description
A Agriculture, forestry and fishing
BDE Mining and quarrying/ Electricity, gas, steam and air conditioning supply/
Water supply; sewerage; waste management and remediation activities
C Manufacturing
F Construction
GHI Wholesale and retail trade; repair of motor vehicles and motorcycles/
Transporting and storage/ Accommodation and food service activities
J Information and communication
K Financial and insurance activities
LMN Real estate activities/ Professional, scientific and technical activities/
Administrative and support service activities
OPQRS Public administration and defense; compulsory social security/
Education/Human health and social work activities/Arts, entertainment and
recreation/ Other services activities/
Z Households
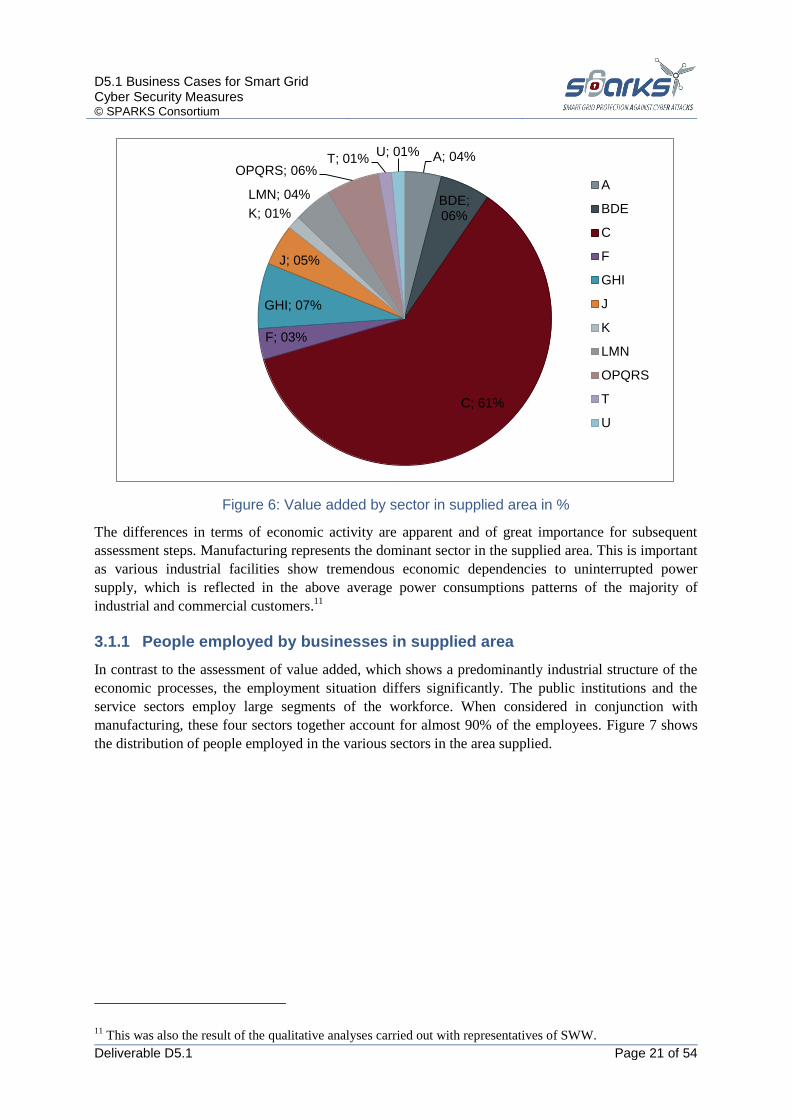
As a next step, the economic relevance of these sectors is derived. The distribution of the value added
of each sector in the area supplied by SWW is depicted in Figure 6.
D5.1 Business Cases for Smart Grid Cyber Security Measures © SPARKS Consortium
Deliverable D5.1 Page 21 of 54
Figure 6: Value added by sector in supplied area in %
The differences in terms of economic activity are apparent and of great importance for subsequent
assessment steps. Manufacturing represents the dominant sector in the supplied area. This is important
as various industrial facilities show tremendous economic dependencies to uninterrupted power
supply, which is reflected in the above average power consumptions patterns of the majority of
industrial and commercial customers.11
3.1.1 People employed by businesses in supplied area
In contrast to the assessment of value added, which shows a predominantly industrial structure of the
economic processes, the employment situation differs significantly. The public institutions and the
service sectors employ large segments of the workforce. When considered in conjunction with
manufacturing, these four sectors together account for almost 90% of the employees. Figure 7 shows
the distribution of people employed in the various sectors in the area supplied.
11
This was also the result of the qualitative analyses carried out with representatives of SWW.
A; 04%
BDE; 06%
C; 61%
F; 03%
GHI; 07%
J; 05%
K; 01%
LMN; 04%
OPQRS; 06% T; 01%
U; 01%
A
BDE
C
F
GHI
J
K
LMN
OPQRS
T
U

D5.1 Business Cases for Smart Grid Cyber Security Measures © SPARKS Consortium
Deliverable D5.1 Page 22 of 54
Figure 7: People employed by businesses in supplied area
Knowledge of the employment situation is important to account for the societal dimension and other
consequences of power outages, such as adverse effects on work place safety as well. The analysis of
employed personnel is thus helpful in identifying particularly vulnerable sectors.
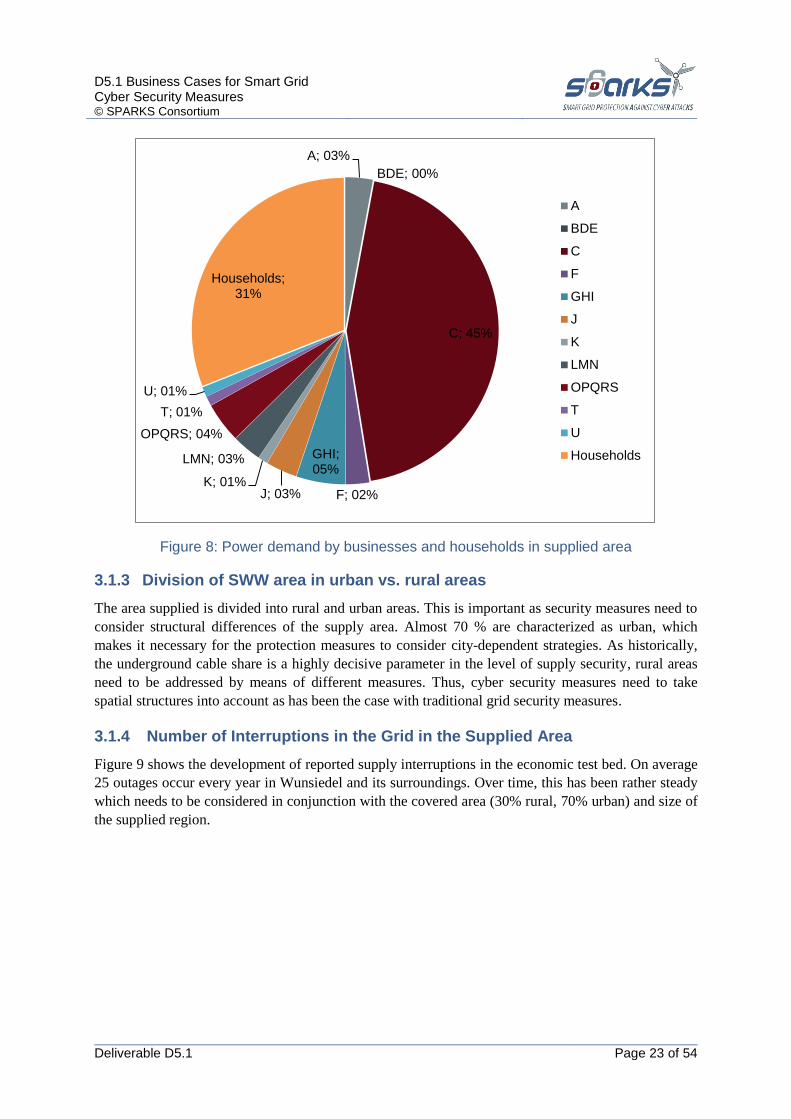
3.1.2 Power demand by businesses and households in supplied area
Considering the power demand of all customers including households, differences between sectors
become apparent: Although manufacturing still accounts for the large majority of the consumption –
en par with the economic relevance and employment status – households are found to be responsible
for almost one third of the demanded electricity (which are annual indicators of consumption). Figure
8 shows the distribution of power demand patterns in the economic sectors and households in the area
supplied.
A; 00%
BDE; 04%
C; 29%
F; 09%
GHI; 18% J; 00%
K; 03%
LMN; 04%
OPQRS; 33%
T; 00% U; 00%
A
BDE
C
F
GHI
J
K
LMN
OPQRS
T
U
D5.1 Business Cases for Smart Grid Cyber Security Measures © SPARKS Consortium
Deliverable D5.1 Page 23 of 54
Figure 8: Power demand by businesses and households in supplied area
3.1.3 Division of SWW area in urban vs. rural areas
The area supplied is divided into rural and urban areas. This is important as security measures need to
consider structural differences of the supply area. Almost 70 % are characterized as urban, which
makes it necessary for the protection measures to consider city-dependent strategies. As historically,
the underground cable share is a highly decisive parameter in the level of supply security, rural areas
need to be addressed by means of different measures. Thus, cyber security measures need to take
spatial structures into account as has been the case with traditional grid security measures.
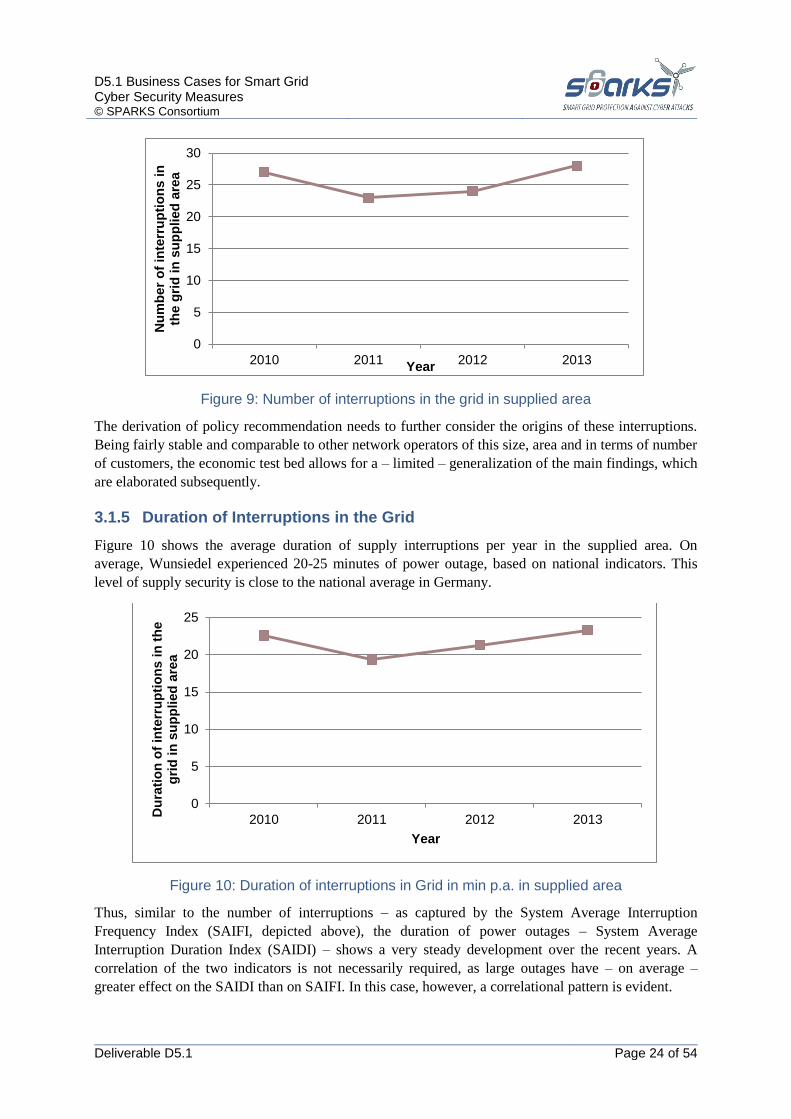
3.1.4 Number of Interruptions in the Grid in the Supplied Area
Figure 9 shows the development of reported supply interruptions in the economic test bed. On average
25 outages occur every year in Wunsiedel and its surroundings. Over time, this has been rather steady
which needs to be considered in conjunction with the covered area (30% rural, 70% urban) and size of
the supplied region.
A; 03%
BDE; 00%
C; 45%
F; 02%
GHI; 05%
J; 03% K; 01%
LMN; 03%
OPQRS; 04%
T; 01%
U; 01%
Households; 31%
A
BDE
C
F
GHI
J
K
LMN
OPQRS
T
U
Households
D5.1 Business Cases for Smart Grid Cyber Security Measures © SPARKS Consortium
Deliverable D5.1 Page 24 of 54
Figure 9: Number of interruptions in the grid in supplied area
The derivation of policy recommendation needs to further consider the origins of these interruptions.
Being fairly stable and comparable to other network operators of this size, area and in terms of number
of customers, the economic test bed allows for a – limited – generalization of the main findings, which
are elaborated subsequently.
3.1.5 Duration of Interruptions in the Grid
Figure 10 shows the average duration of supply interruptions per year in the supplied area. On
average, Wunsiedel experienced 20-25 minutes of power outage, based on national indicators. This
level of supply security is close to the national average in Germany.
Figure 10: Duration of interruptions in Grid in min p.a. in supplied area
Thus, similar to the number of interruptions – as captured by the System Average Interruption
Frequency Index (SAIFI, depicted above), the duration of power outages – System Average
Interruption Duration Index (SAIDI) – shows a very steady development over the recent years. A
correlation of the two indicators is not necessarily required, as large outages have – on average –
greater effect on the SAIDI than on SAIFI. In this case, however, a correlational pattern is evident.
0
5
10
15
20
25
30
2010 2011 2012 2013
Nu
mb
er
of
inte
rru
pti
on
s i
n
the g
rid
in
su
pp
lied
are
a
Year
0
5
10
15
20
25
2010 2011 2012 2013
Du
rati
on
of
inte
rru
pti
on
s i
n t
he
gri
d i
n s
up
plied
are
a
Year
D5.1 Business Cases for Smart Grid Cyber Security Measures © SPARKS Consortium
Deliverable D5.1 Page 25 of 54
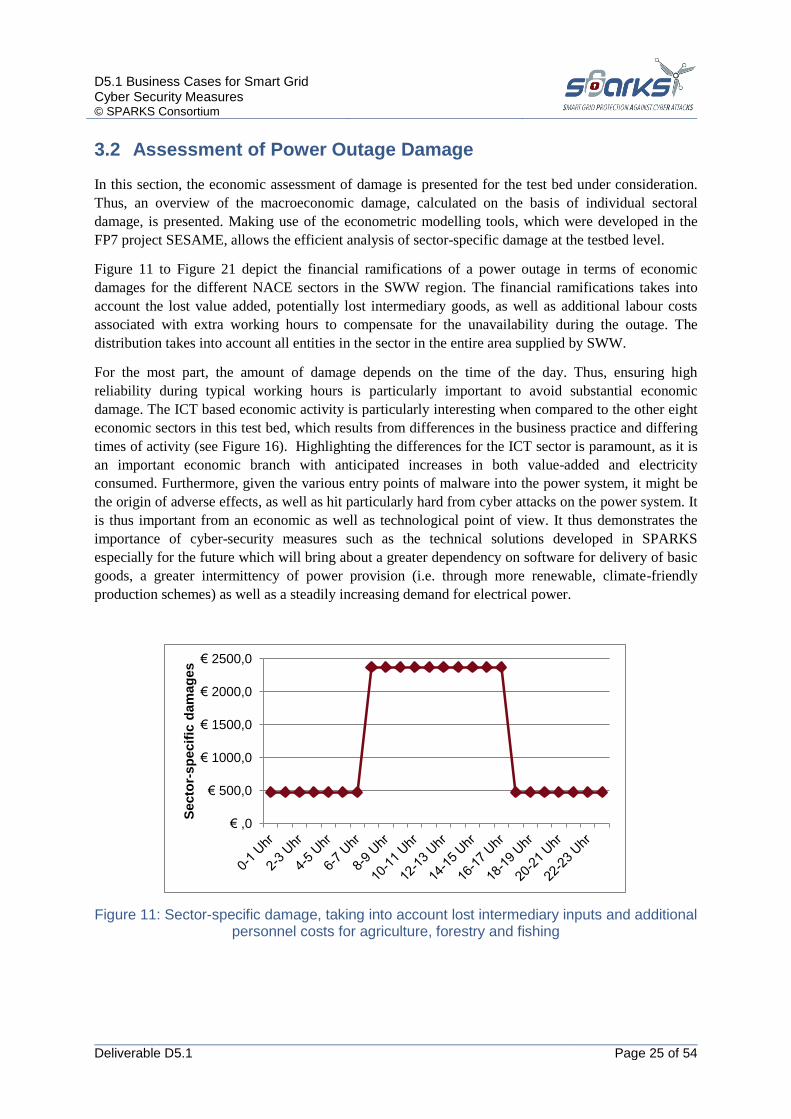
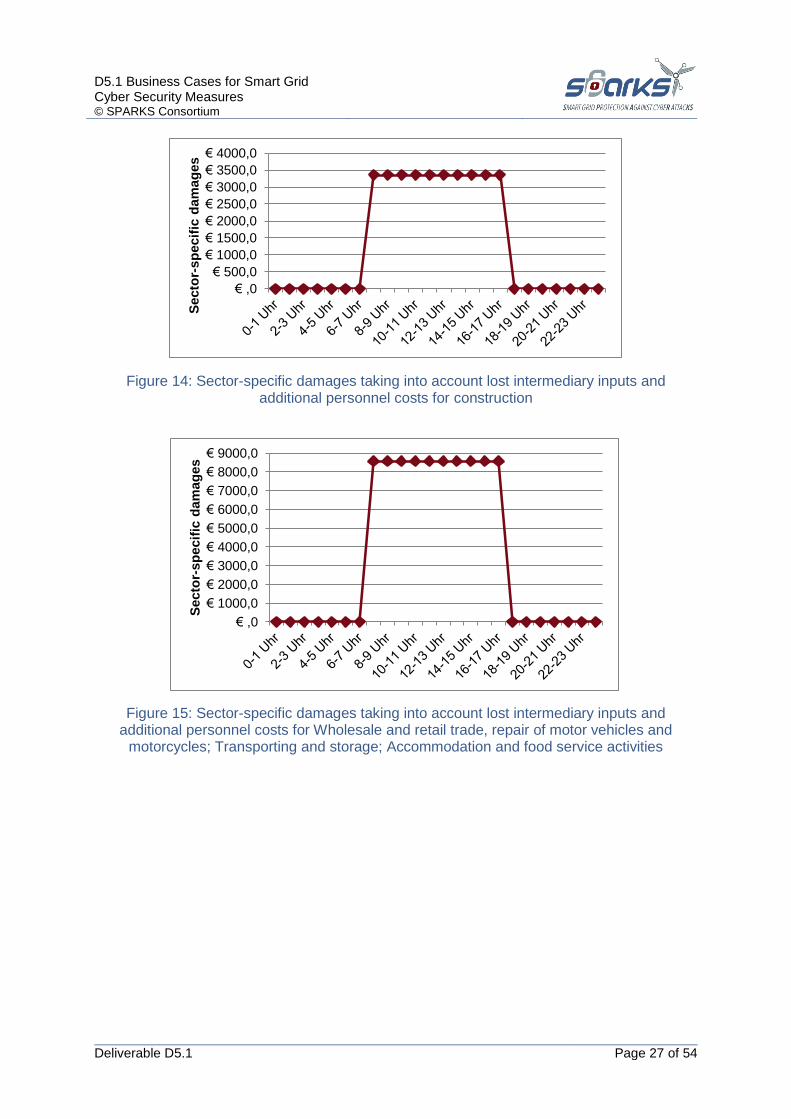
3.2 Assessment of Power Outage Damage
In this section, the economic assessment of damage is presented for the test bed under consideration.
Thus, an overview of the macroeconomic damage, calculated on the basis of individual sectoral
damage, is presented. Making use of the econometric modelling tools, which were developed in the
FP7 project SESAME, allows the efficient analysis of sector-specific damage at the testbed level.
Figure 11 to Figure 21 depict the financial ramifications of a power outage in terms of economic
damages for the different NACE sectors in the SWW region. The financial ramifications takes into
account the lost value added, potentially lost intermediary goods, as well as additional labour costs
associated with extra working hours to compensate for the unavailability during the outage. The
distribution takes into account all entities in the sector in the entire area supplied by SWW.
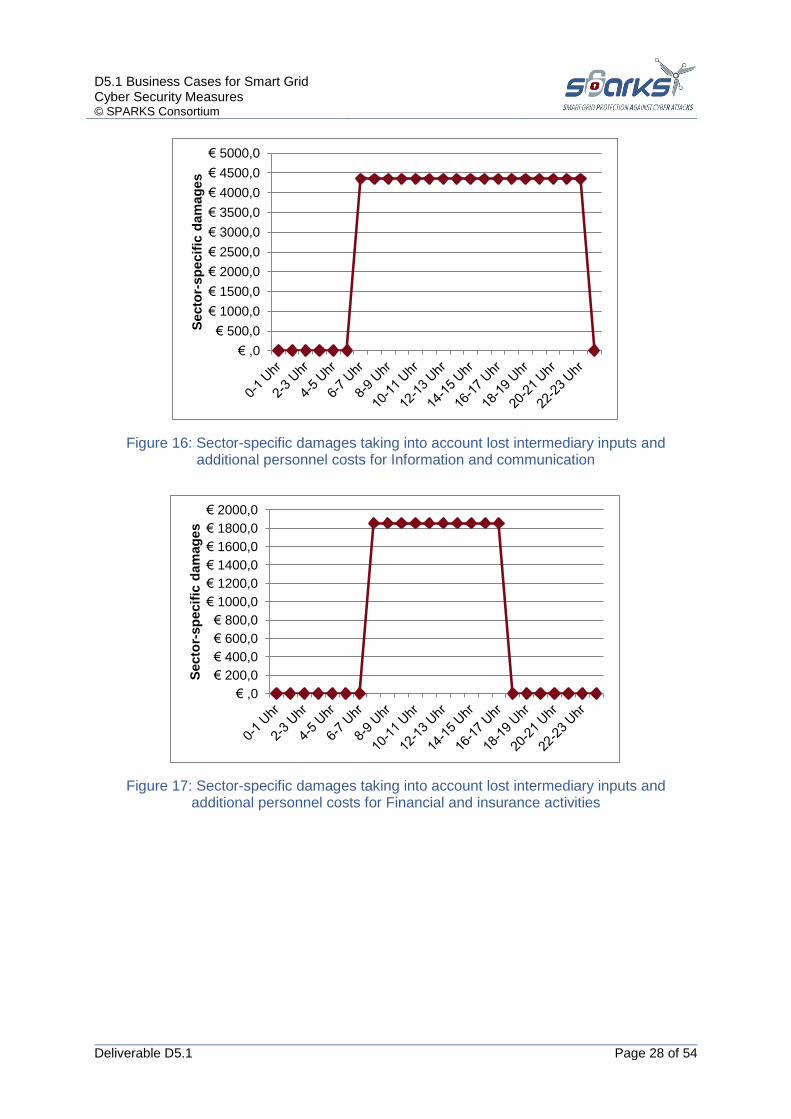
For the most part, the amount of damage depends on the time of the day. Thus, ensuring high
reliability during typical working hours is particularly important to avoid substantial economic
damage. The ICT based economic activity is particularly interesting when compared to the other eight
economic sectors in this test bed, which results from differences in the business practice and differing
times of activity (see Figure 16). Highlighting the differences for the ICT sector is paramount, as it is
an important economic branch with anticipated increases in both value-added and electricity
consumed. Furthermore, given the various entry points of malware into the power system, it might be
the origin of adverse effects, as well as hit particularly hard from cyber attacks on the power system. It
is thus important from an economic as well as technological point of view. It thus demonstrates the
importance of cyber-security measures such as the technical solutions developed in SPARKS
especially for the future which will bring about a greater dependency on software for delivery of basic
goods, a greater intermittency of power provision (i.e. through more renewable, climate-friendly
production schemes) as well as a steadily increasing demand for electrical power.
Figure 11: Sector-specific damage, taking into account lost intermediary inputs and additional personnel costs for agriculture, forestry and fishing
€ ,0
€ 500,0
€ 1000,0
€ 1500,0
€ 2000,0
€ 2500,0
Secto
r-sp
ecif
ic d
am
ag
es
D5.1 Business Cases for Smart Grid Cyber Security Measures © SPARKS Consortium
Deliverable D5.1 Page 26 of 54
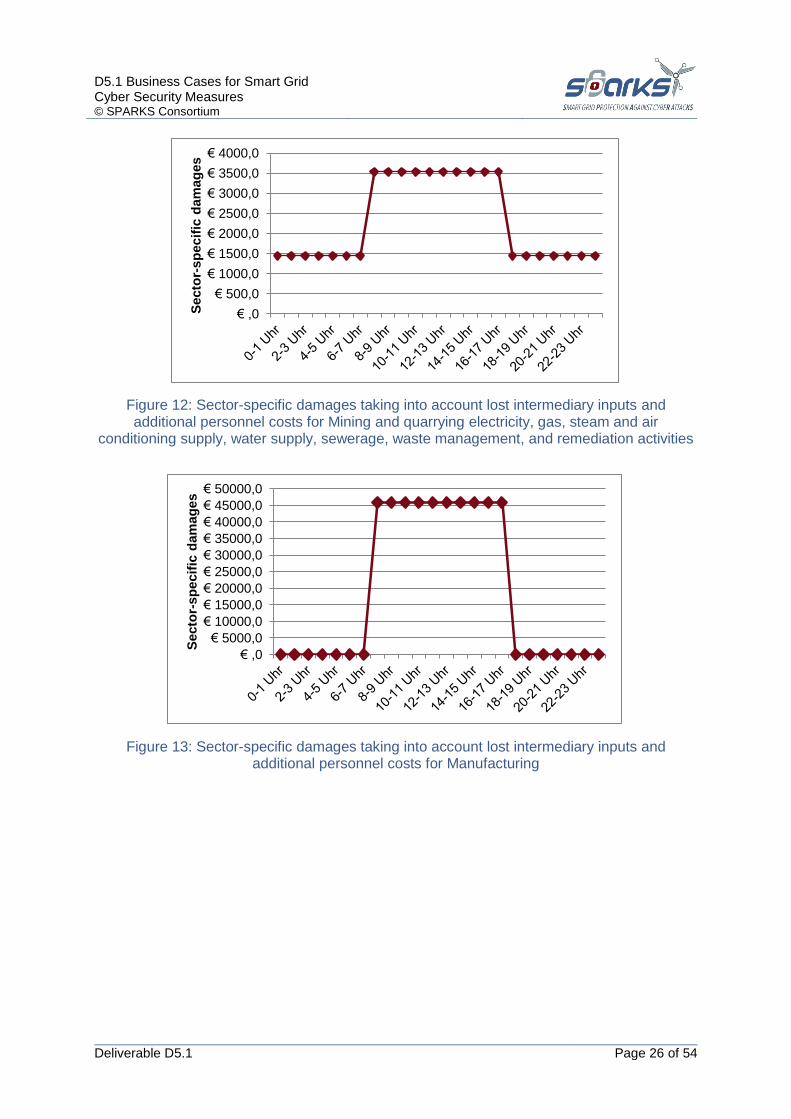
Figure 12: Sector-specific damages taking into account lost intermediary inputs and additional personnel costs for Mining and quarrying electricity, gas, steam and air
conditioning supply, water supply, sewerage, waste management, and remediation activities
Figure 13: Sector-specific damages taking into account lost intermediary inputs and additional personnel costs for Manufacturing
€ ,0
€ 500,0
€ 1000,0
€ 1500,0
€ 2000,0
€ 2500,0
€ 3000,0
€ 3500,0
€ 4000,0
Secto
r-sp
ecif
ic d
am
ag
es
€ ,0
€ 5000,0
€ 10000,0
€ 15000,0
€ 20000,0
€ 25000,0
€ 30000,0
€ 35000,0
€ 40000,0
€ 45000,0
€ 50000,0
Secto
r-sp
ecif
ic d
am
ag
es
D5.1 Business Cases for Smart Grid Cyber Security Measures © SPARKS Consortium
Deliverable D5.1 Page 27 of 54
Figure 14: Sector-specific damages taking into account lost intermediary inputs and additional personnel costs for construction
Figure 15: Sector-specific damages taking into account lost intermediary inputs and additional personnel costs for Wholesale and retail trade, repair of motor vehicles and
motorcycles; Transporting and storage; Accommodation and food service activities
€ ,0
€ 500,0
€ 1000,0
€ 1500,0
€ 2000,0
€ 2500,0
€ 3000,0
€ 3500,0
€ 4000,0
Secto
r-sp
ecif
ic d
am
ag
es
€ ,0
€ 1000,0
€ 2000,0
€ 3000,0
€ 4000,0
€ 5000,0
€ 6000,0
€ 7000,0
€ 8000,0
€ 9000,0
Secto
r-sp
ecif
ic d
am
ag
es
D5.1 Business Cases for Smart Grid Cyber Security Measures © SPARKS Consortium
Deliverable D5.1 Page 28 of 54
Figure 16: Sector-specific damages taking into account lost intermediary inputs and additional personnel costs for Information and communication
Figure 17: Sector-specific damages taking into account lost intermediary inputs and additional personnel costs for Financial and insurance activities
€ ,0
€ 500,0
€ 1000,0
€ 1500,0
€ 2000,0
€ 2500,0
€ 3000,0
€ 3500,0
€ 4000,0
€ 4500,0
€ 5000,0
Secto
r-sp
ecif
ic d
am
ag
es
€ ,0
€ 200,0
€ 400,0
€ 600,0
€ 800,0
€ 1000,0
€ 1200,0
€ 1400,0
€ 1600,0
€ 1800,0
€ 2000,0
Secto
r-sp
ecif
ic d
am
ag
es
D5.1 Business Cases for Smart Grid Cyber Security Measures © SPARKS Consortium
Deliverable D5.1 Page 29 of 54
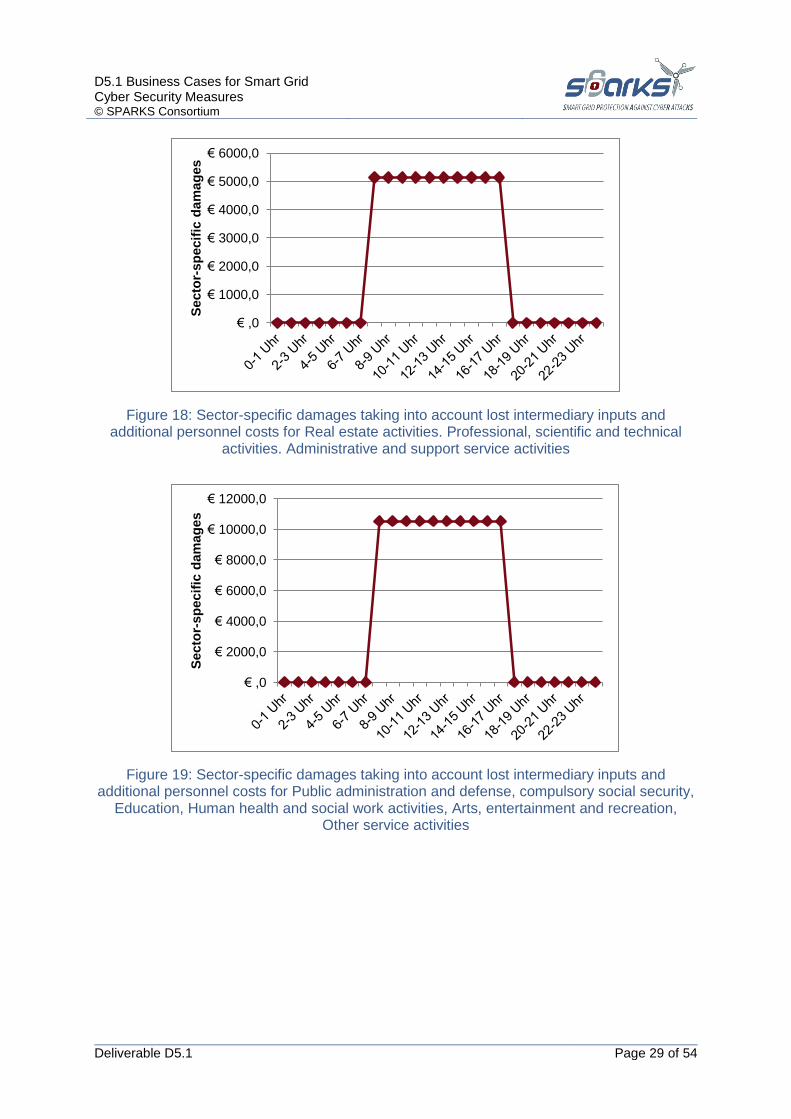
Figure 18: Sector-specific damages taking into account lost intermediary inputs and additional personnel costs for Real estate activities. Professional, scientific and technical
activities. Administrative and support service activities
Figure 19: Sector-specific damages taking into account lost intermediary inputs and additional personnel costs for Public administration and defense, compulsory social security,
Education, Human health and social work activities, Arts, entertainment and recreation, Other service activities
€ ,0
€ 1000,0
€ 2000,0
€ 3000,0
€ 4000,0
€ 5000,0
€ 6000,0
Secto
r-sp
ecif
ic d
am
ag
es
€ ,0
€ 2000,0
€ 4000,0
€ 6000,0
€ 8000,0
€ 10000,0
€ 12000,0
Secto
r-sp
ecif
ic d
am
ag
es
D5.1 Business Cases for Smart Grid Cyber Security Measures © SPARKS Consortium
Deliverable D5.1 Page 30 of 54
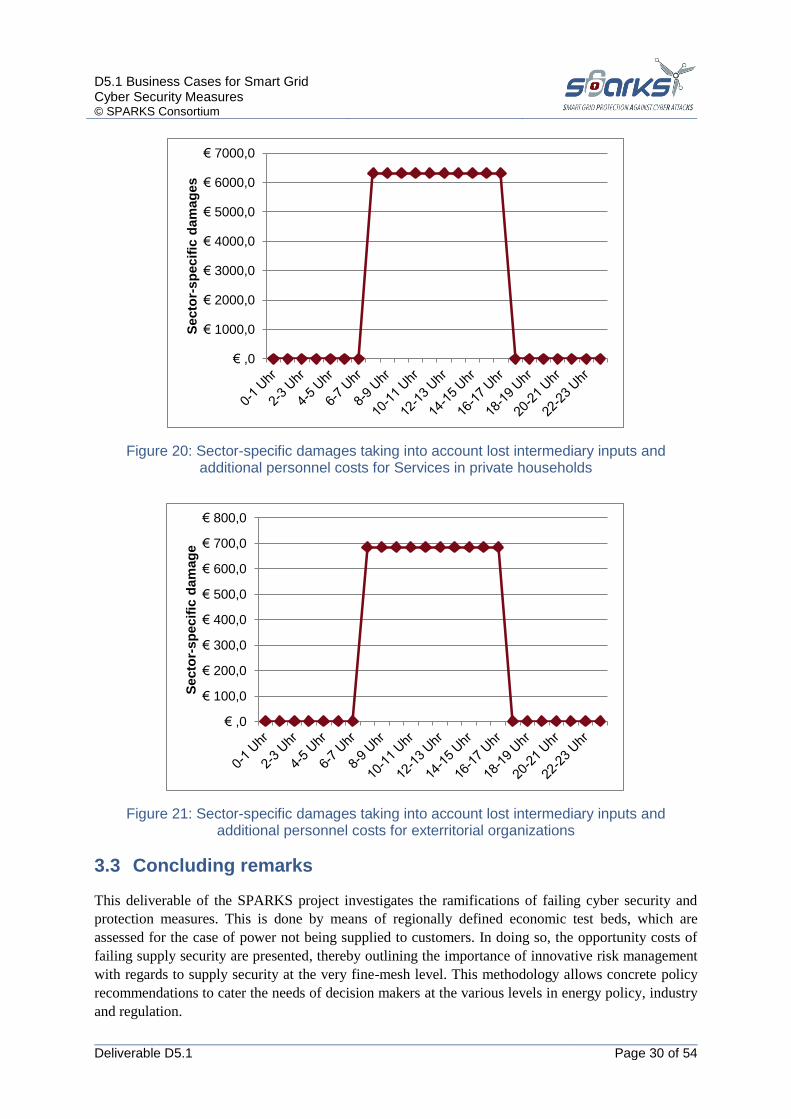
Figure 20: Sector-specific damages taking into account lost intermediary inputs and additional personnel costs for Services in private households
Figure 21: Sector-specific damages taking into account lost intermediary inputs and additional personnel costs for exterritorial organizations
3.3 Concluding remarks
This deliverable of the SPARKS project investigates the ramifications of failing cyber security and
protection measures. This is done by means of regionally defined economic test beds, which are
assessed for the case of power not being supplied to customers. In doing so, the opportunity costs of
failing supply security are presented, thereby outlining the importance of innovative risk management
with regards to supply security at the very fine-mesh level. This methodology allows concrete policy
recommendations to cater the needs of decision makers at the various levels in energy policy, industry
and regulation.
€ ,0
€ 1000,0
€ 2000,0
€ 3000,0
€ 4000,0
€ 5000,0
€ 6000,0
€ 7000,0
Secto
r-sp
ecif
ic d
am
ag
es
€ ,0
€ 100,0
€ 200,0
€ 300,0
€ 400,0
€ 500,0
€ 600,0
€ 700,0
€ 800,0
Secto
r-sp
ecif
ic d
am
ag
e

D5.1 Business Cases for Smart Grid Cyber Security Measures © SPARKS Consortium
Deliverable D5.1 Page 31 of 54
Thus, the methodology, the code of conduct and the policy relevance drawn from economic test beds
are presented in this report. This is done using a novel and easy-to-use economic impact assessment
tool for power outage evaluation, taking special consideration of the threats originating from cyber
attacks. Most importantly, the costs of power outages are borne by different private and business
consumer groups. Knowing the magnitude of damages enables policy makers to identify particularly
vulnerable segments of society and the economy and to address the upcoming ICT-relevant threats by
means of these vulnerability estimates.
While the supply of electricity is relatively reliable in Europe, maintaining this degree of reliability in
the future involves a number of challenges. Efficient decisions on investing in infrastructure are
possible only if the value of electricity supply security to households and businesses can be
determined. Thus, in order to obtain an objective result for these prototypical test beds, a split design
which uses survey data including precise preference structures from over 8,300 European households
as well as a damage accounting mechanism for businesses, administration and public institutions is
used in SPARKS. As a result, not only particularly vulnerable sectors, such as the manufacturing
industry, or data-generating (ICT) processes, but all branches of the economy as per NACE 2008
scheme can be modeled which show greatly diverging vulnerabilities dependent on the sectoral
activity and business schemes.
The results for the region supplied by SWW shown in this section will be used specifically for the
bottom-up calculation in D5.2 and replace the overall GDP-approach (0.083%).
4 DSO Assessments Provide an Impression of the Current Security Situation, Challenges and Risks
The subject of this section is the assessment of the security situation of the ICT infrastructure and
systems, which are usually embedded into more complex enterprise systems of a DSO. IT
infrastructure includes control systems used in geographically dispersed operations such as utilities
(i.e., electricity, gas, and water), pipelines, facilities, building environmental control systems,
industries and applications such as e-mobility installations, that use automated or remotely controlled
or monitored assets. The term “security” is considered here to mean the prevention of illegal or
unwanted penetration, intentional or unintentional interference with the proper and intended operation,
or inappropriate access to confidential information in such ICT systems. Cybersecurity which is the
particular focus, includes computers, networks, operating systems, applications and other
programmable configurable components of the system, including also all services and processes
affecting security of the grid.
The DSOs that have been assessed are typical for regional utility companies in terms of revenue and
size, at least in Germany. On the other hand, they provide three completely different stages of smart
grid implementations from a “ready to start to learn” about smart grid technology to “already
optimizing” smart grid operations. This will help to develop, test, and roll out security measures for
any DSO regardless of the individual stage of development. The candidates assessed have been:
1. SWW Wunsiedel GmbH, Rot-Kreuz-Straße 6, 95632, Germany [13]
2. Stadtwerke Kelheim GmbH&CoKG (SWK), Hallstattstraße 15, 93309 Kelheim,
Germany [14]
3. Stadtwerk Haßfurt GmbH (SWH), Augsfelder Straße 6, 97437 Haßfurt, Germany [15]
In this document, the assessment results and the basic data necessary to develop a cost model to
calculate the impact of successful cyber-attacks are presented. The results of those assessments are
D5.1 Business Cases for Smart Grid Cyber Security Measures © SPARKS Consortium
Deliverable D5.1 Page 32 of 54
documented in form of SWOT diagrams. The cost model itself and the simulation of various attack
scenarios will be presented in SPARKS Deliverable D5.2.
The audience for cost based security considerations and assessment includes all users of the DSO’s
ICT infrastructure (including facility operations, maintenance, engineering, and corporate components
of the DSO organizations), customers, suppliers, government organizations involved with, or affected
by, control system cyber security, control system practitioners, and security practitioners.
Typical questions addressed may include:
a) What is the security level of the smart grid in our territory?
b) What is the probability to suffer from cyber-attacks and what would be the damage?
c) What is the remedy and what are the costs to repair?
d) What are the cost to increase the security level of the Smart Grid
The answers to the questions b), c), and d) will be given in Deliverable D5.2; here we focus on the
question a).
All data and information provided in this section are based on the assessment of three utility
companies that are typical for the expected fragmentation of the current DSO landscape, in which only
a few big companies manage power transmission and distribution into smaller units. The growing
number of distributed energy systems and micro-power-plants installed also requires a more
decentralized organization and independently acting power management. As mentioned earlier, in
Section 2.5, the German BSI guidelines [9], [10] have been used for the security assessment, along
with the IT reference model and the security levels assigned from the IEC 62443-1-1 standard [12].
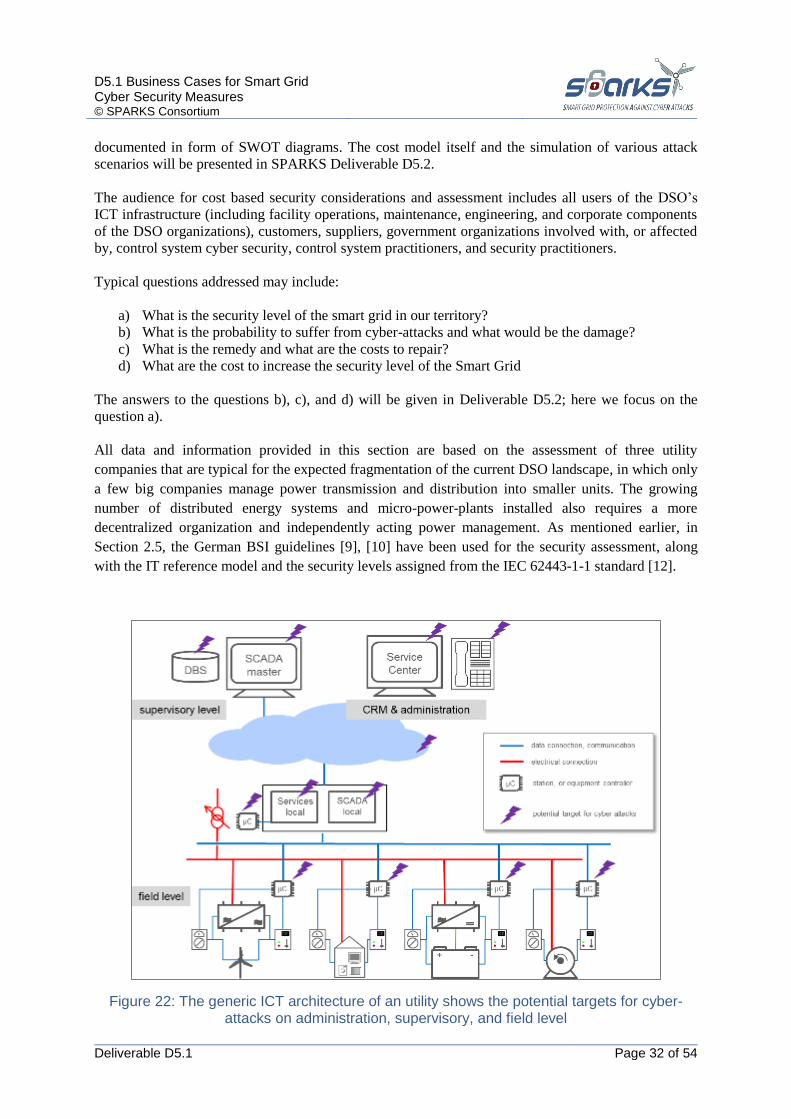
Figure 22: The generic ICT architecture of an utility shows the potential targets for cyber-attacks on administration, supervisory, and field level
D5.1 Business Cases for Smart Grid Cyber Security Measures © SPARKS Consortium
Deliverable D5.1 Page 33 of 54
Figure 22 shows a typical utility and DSO IT architecture and potential targets for cyber-attacks. The
impact of such attacks is listed below, while any combination and orchestration of such effects may
occur. People who know the features of open operating systems and networks could potentially intrude
into console devices, remote devices, databases, and, in some cases, control platforms. The effect of
intruders on one DSO’s ICT systems may include the following12
:
a) unauthorized access, theft, or misuse of confidential information;
b) publication of information to unauthorized destinations;
c) loss of integrity or reliability of process data and utility information;
d) loss of system availability;
e) process upsets leading to compromised functionality, inferior quality, poor efficiency in
energy generation and distribution capacity, or compromised safety;
f) equipment, station damage;
g) personal injury;
h) violation of legal and regulatory requirements;
i) risk to public health and confidence;
j) pollution and environmental damage
After a thorough security assessment, current security levels have been assigned to the three DSOs. A
number of factors are leading to more open ICT infrastructures for DSOs, including the general trend
towards IP-based communication; the strong need for integrating services that are currently running on
isolated platforms; and the need to speed up the reaction to power balancing requests from next level
DSOs or transmission net operator (EnWG and BDEW Cascade – see [16] and Figure 35). This
increased openness introduces new cybersecurity vulnerabilities.
According to BSI assessment, several factors contribute to the security level (achieved) of supply and
territory of a DSO. The security level (achieved) of a zone or conduit can be evaluated from analyzing
the following topics:
TOP 1: Management & Organization
Organization and business processes of the whole organization which might have an influence
on security have been analyzed. Focus of the assessment has dealt with: personnel resources
and management of critical security processes, existence and quality of security guidelines,
continuous security training for employees, document and version management of security
related guidelines and business processes, data backup and software maintenance, outsourced
services and access of external resources.
TOP 2: Physical IT Protection
The physical security measures installed have been analyzed focusing on: wiring and power
supplies, access control to critical hardware components, fire protection, and air conditioning.
12
Please find a detailed listing of effects from cyber-attacks in SPARKS deliverable D2.2 “Threat and Risk
Assessment Methodology”
D5.1 Business Cases for Smart Grid Cyber Security Measures © SPARKS Consortium
Deliverable D5.1 Page 34 of 54
TOP 3: Devices and Processes
ICT systems and infrastructure assessed: system configuration (hardware architecture), access
control (authentication, authorization, user rights), mobile computers, multi-functional and
multi-user devices (printer/scanner/fax, mass storages, etc.), gateways and routers.
TOP 4: ICT System Administration
Network and ICT system configuration and document management, system management and
operation, IT security administration.
TOP 5: Applications & Data Exchange
Access rights, user guidelines of common services and applications used in the company have
been assessed with focus on: mailing system, CRM system, SCADA, user data backup system,
internet. An essential part of this assessment has been concerned with regulations about
private use of such applications and the treatment of mobile data carriers and applications on
mobile devices.
While SWK is just beginning to install automatism, SWH is a front-runner who has two strong
partners (IDS and Deutsche Telekom) on board that have helped to install a safe and secure ICT
architecture. SWW has installed many inventive ICT-based systems, but lacks a general concept. An
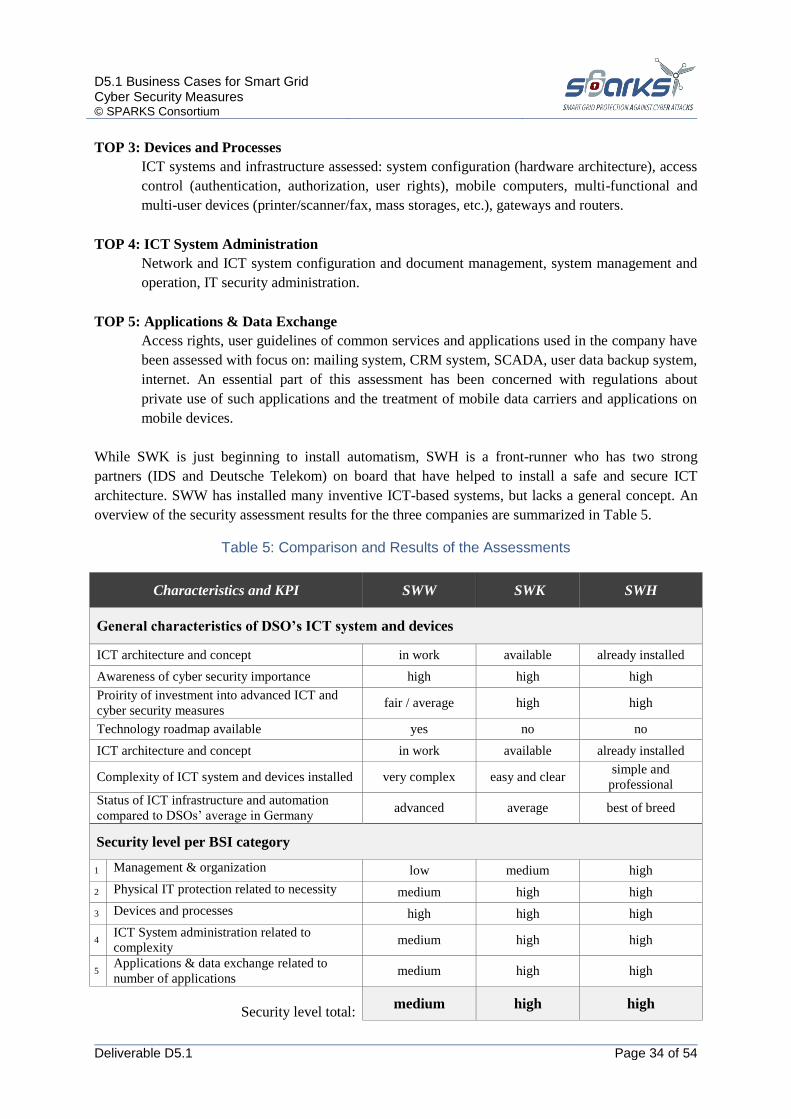
overview of the security assessment results for the three companies are summarized in Table 5.
Table 5: Comparison and Results of the Assessments
Characteristics and KPI SWW SWK SWH
General characteristics of DSO’s ICT system and devices
ICT architecture and concept in work available already installed
Awareness of cyber security importance high high high
Proirity of investment into advanced ICT and
cyber security measures fair / average high high
Technology roadmap available yes no no
ICT architecture and concept in work available already installed
Complexity of ICT system and devices installed very complex easy and clear simple and
professional
Status of ICT infrastructure and automation
compared to DSOs’ average in Germany advanced average best of breed
Security level per BSI category
1 Management & organization low medium high
2 Physical IT protection related to necessity medium high high
3 Devices and processes high high high
4 ICT System administration related to
complexity medium high high
5 Applications & data exchange related to
number of applications medium high high
Security level total: medium high high
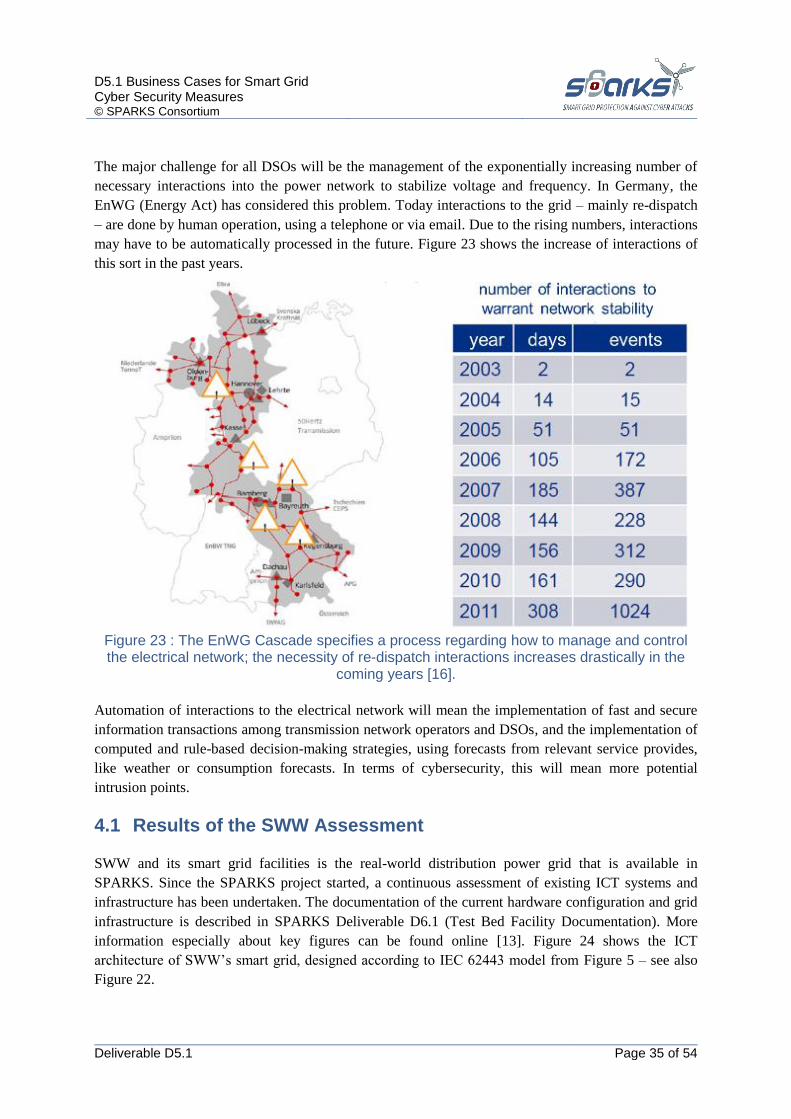
D5.1 Business Cases for Smart Grid Cyber Security Measures © SPARKS Consortium
Deliverable D5.1 Page 35 of 54
The major challenge for all DSOs will be the management of the exponentially increasing number of
necessary interactions into the power network to stabilize voltage and frequency. In Germany, the
EnWG (Energy Act) has considered this problem. Today interactions to the grid – mainly re-dispatch
– are done by human operation, using a telephone or via email. Due to the rising numbers, interactions
may have to be automatically processed in the future. Figure 23 shows the increase of interactions of
this sort in the past years.
Figure 23 : The EnWG Cascade specifies a process regarding how to manage and control the electrical network; the necessity of re-dispatch interactions increases drastically in the
coming years [16].
Automation of interactions to the electrical network will mean the implementation of fast and secure
information transactions among transmission network operators and DSOs, and the implementation of
computed and rule-based decision-making strategies, using forecasts from relevant service provides,
like weather or consumption forecasts. In terms of cybersecurity, this will mean more potential
intrusion points.
4.1 Results of the SWW Assessment
SWW and its smart grid facilities is the real-world distribution power grid that is available in
SPARKS. Since the SPARKS project started, a continuous assessment of existing ICT systems and
infrastructure has been undertaken. The documentation of the current hardware configuration and grid
infrastructure is described in SPARKS Deliverable D6.1 (Test Bed Facility Documentation). More
information especially about key figures can be found online [13]. Figure 24 shows the ICT
architecture of SWW’s smart grid, designed according to IEC 62443 model from Figure 5 – see also
Figure 22.
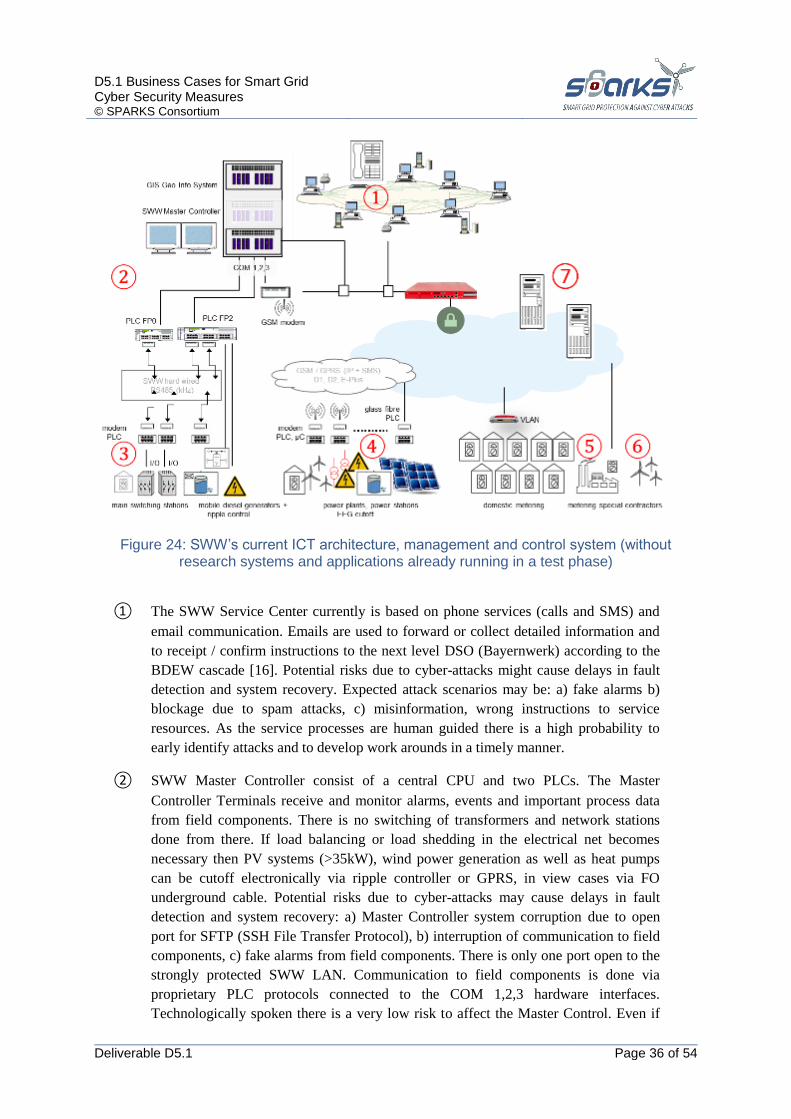
D5.1 Business Cases for Smart Grid Cyber Security Measures © SPARKS Consortium
Deliverable D5.1 Page 36 of 54
Figure 24: SWW’s current ICT architecture, management and control system (without research systems and applications already running in a test phase)
① The SWW Service Center currently is based on phone services (calls and SMS) and
email communication. Emails are used to forward or collect detailed information and
to receipt / confirm instructions to the next level DSO (Bayernwerk) according to the
BDEW cascade [16]. Potential risks due to cyber-attacks might cause delays in fault
detection and system recovery. Expected attack scenarios may be: a) fake alarms b)
blockage due to spam attacks, c) misinformation, wrong instructions to service
resources. As the service processes are human guided there is a high probability to
early identify attacks and to develop work arounds in a timely manner.
② SWW Master Controller consist of a central CPU and two PLCs. The Master
Controller Terminals receive and monitor alarms, events and important process data
from field components. There is no switching of transformers and network stations
done from there. If load balancing or load shedding in the electrical net becomes
necessary then PV systems (>35kW), wind power generation as well as heat pumps
can be cutoff electronically via ripple controller or GPRS, in view cases via FO
underground cable. Potential risks due to cyber-attacks may cause delays in fault
detection and system recovery: a) Master Controller system corruption due to open
port for SFTP (SSH File Transfer Protocol), b) interruption of communication to field
components, c) fake alarms from field components. There is only one port open to the
strongly protected SWW LAN. Communication to field components is done via
proprietary PLC protocols connected to the COM 1,2,3 hardware interfaces.
Technologically spoken there is a very low risk to affect the Master Control. Even if

D5.1 Business Cases for Smart Grid Cyber Security Measures © SPARKS Consortium
Deliverable D5.1 Page 37 of 54
the Master Controller goes down, the energy supply will not be affected because there
is no critical automatic switching which would do damage to the supply systems.
③ Main switching stations, ripple controller and balancing power generation are
controlled by the SWW Master Controller PLCs. The communication is hardwired via
a proprietary PLC communication protocol or simple PLC signals – see Figure 25.
The only risk would be an intrusion via the service interface of the PLCs.
④ Power plants, power stations, some water stations and special utilities are controlled
by the SWW Master Controller via GPRS. Alarms and error messages are sent to the
SWW Service Center via SMS. Despite sending alarms, events or process data, the
field devices receive power cutoff signals via the GPRS interface (EEG Abschaltung).
The potential risk stems from the IP-based communication interface of the SIM cards
used. The effects of a cyber-attack could be a) fake or blocked alarms, b) fake data and
information c) EEG cutoff of single power generators. There is no damage expected
just some loss of revenue due to power generation cutoffs.
⑤ Smart metering for domestic customers is done via VLAN. Metering data
(consumption) is time stamped and sent to the server of an external accounting service
provider. Potential risks due to cyber-attacks may cause loss and violation of personal
customer data. The effects could include: a) spied customer data b) gaps in metering.
The installed VLAN (Virtual Local Area Network) allows only reading of data with
the only write exception of time setting.
⑥ Special customers (e.g. industry, or external power plants) are connected via modem
to forward metering data to the server of a contracted accounting service provider. The
potential risk stems from the IP-based communication interface of the SIM cards used.
The effects of a cyber-attack could be a) fake or blocked alarms, b) fake data and
information c) EEG cutoff of single power generators. There is no damage expected to
consumer systems, which are protected by individual security measures.
⑦ SWW uses several external services like weather forecast, market prices, accounting
and billing services, etc. via Internet. The risk is to receive a) Spam or b) wrong / fake
information. Only instructions from the higher level DSO (Bayernwerk – system
OSKAR) may cause some irritation to SWW’s service resources.
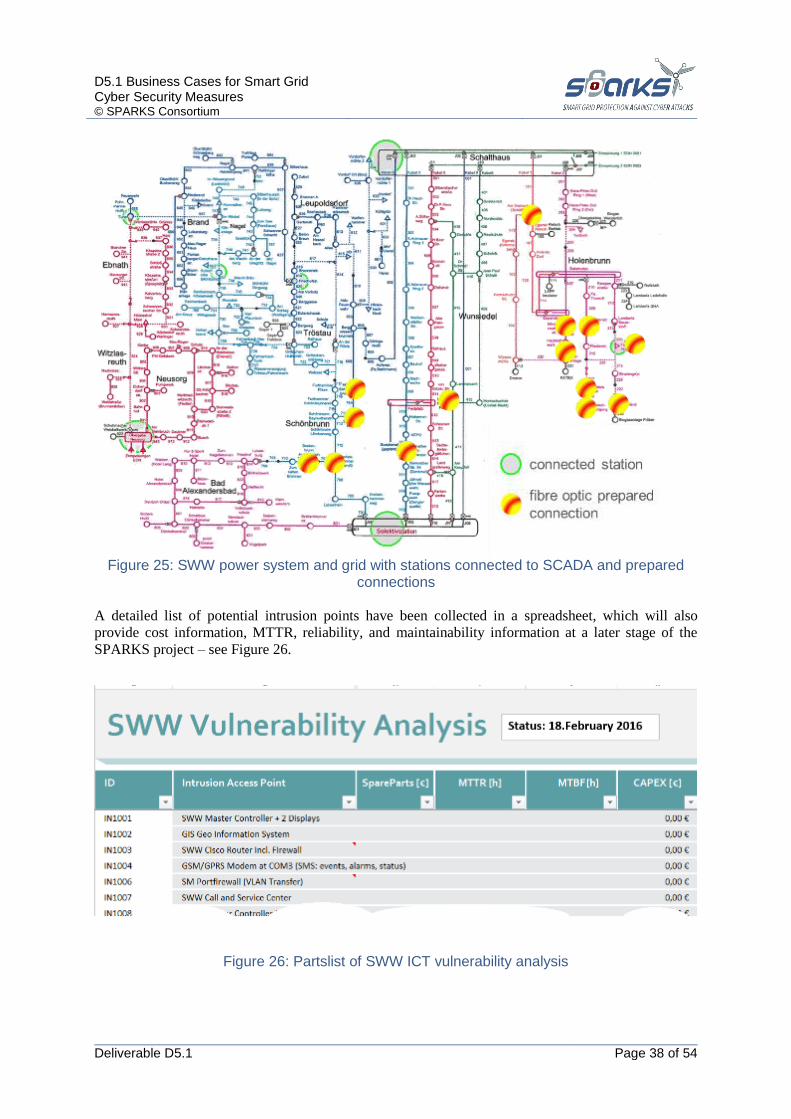
D5.1 Business Cases for Smart Grid Cyber Security Measures © SPARKS Consortium
Deliverable D5.1 Page 38 of 54
Figure 25: SWW power system and grid with stations connected to SCADA and prepared
connections
A detailed list of potential intrusion points have been collected in a spreadsheet, which will also
provide cost information, MTTR, reliability, and maintainability information at a later stage of the
SPARKS project – see Figure 26.
Figure 26: Partslist of SWW ICT vulnerability analysis

D5.1 Business Cases for Smart Grid Cyber Security Measures © SPARKS Consortium
Deliverable D5.1 Page 39 of 54
4.1.1 A value status analysis provides an overview of assets (CAPEX, OPEX, revenue)
Figure 27: SWW CAPEX / OPEX analysis
The data concerning revenues from selling electricity of the three DSOs can be found in the annual
reports or from the profit and loss accounts of the companies. The data for CAPEX can be found in
assets accounting for amortized cost and current replacement value; the data on CAPEX can be
separated for grid equipment and SCADA, control and ICT systems. All data on buildings and
vehicles were not taken into account. The data for OPEX can be found in the operating expenses in the
profit and loss account; the operating expenses can be separated for grid equipment and SCADA,
control and ICT systems. Neither buildings nor vehicles have been taken into account.
4.1.2 Results of SWW Self-assessment and Security Level
Today, SWW has made its first steps towards a smart grid by having installed some isolated operating
ICT systems, like intelligent power plants, monitoring and alarm notification of critical grid devices,
smart meter installations, and load flow monitoring. The current heterogeneous ICT architecture
provides SWW challenges for system administration and IT protection. Security processes according
to BSI guidelines are not installed yet. There is no strategy and no defined procedures on how to
handle different cyber-attack scenarios, or other unexpected events or unknown failures. The SWW
ICT landscape provides “security by obscurity”.
BDEW Cascade – load reduction and EEG switch off with a reaction time of only 15 minutes (after
automatic telephone call and email) cannot be achieved today. No 24/7 service center, no current
status of the grid is available, no automatic load balancing, viewing of remote breakers, which requires
time consuming manual switching. There is no decision-making procedure with clear rules on how to
avoid discriminating power shedding according to the EnWG [19].

D5.1 Business Cases for Smart Grid Cyber Security Measures © SPARKS Consortium
Deliverable D5.1 Page 40 of 54
Figure 28: SWW SWOT analysis related to cyber security and smart grid capabilities show
medium risk and good preparations to meet furure challenges
The fact is that there is a non-IP based controller architecture using a COM interface of the Master
Controller, which is hard to access – there is no automatic switching invoked by the master controller.
Other data – like metering data - is processed outside of SWW responsibility by special accounting
service providers who have their own security mechanism specialized to deal with personal data and
phishing. This justifies a technical high security level, but overall only a medium security level (see
Figure 28) due to gaps in operation and personnel resources for this kind of heterogeneous ICT
architecture. For the future, it is very clear that SWW have to invest a lot in ICT security like most of
the over 800 DSOs in Germany have to if they want to catch up with the increasing demand for
automatic response to load balancing requirements from next level electricity provider.
SWW and the municipality of Wunsiedel promote innovation, which has led to many opportunities for
research in that region. Many R&D prototypes in smart energy technology have been installed since.
Developing a roadmap has assisted SWW with identifying the projects that enable the business to
achieve its strategic goals, and to provide a mechanism for IT to forecast the technology needs that
map to its business goals and objectives. The first version of this roadmap has been published in
February 2012 [20], with a first revision released in May 2015. Among others, the roadmap will help
SWW to launch projects that shall provide sustainable benefit and prosperity to the whole region. An
important step on said roadmap has been done by implementing the new master controller platform,
and by partnering with suitable industry organizations.

D5.1 Business Cases for Smart Grid Cyber Security Measures © SPARKS Consortium
Deliverable D5.1 Page 41 of 54
4.2 Results of SWK Assessment
The power distribution network of SWK supplies a territory of 58 km² around the city of Kelheim.
SWK has installed transformer power of 61.4 MVA and power generation of 21 MW, mainly from
biomass and photovoltaic. Overall, SWK maintains about 120 kilometres of medium and 376 km of
low voltage lines, about 9380 grid connections, and 139 transformer stations. In 2015 (2014), SWK
has supplied 69.2 GWh (67.5 GWh) of electricity with a maximum power of 11.1 MW (13.6 MW).
SWK has realized that the permanently increasing portion of distributed energy generation will require
sophisticated energy management systems in the future to allow a stable operation of the grid at its
limits. In 2016, a new master control system was installed at SWK (Figure 29), which is based on the
SCADA product family SICAM. A commercial entity has been contracted to assess SWK’s ICT
systems and infrastructure according to BSI Guideline [8].
Figure 29: SWK’s current ICT architecture, management and remote grid control system
① The SWK Service Center currently is based on telephone services and regular email
communication. Emails are used for forwarding or collecting detailed information and
for receipt / confirmation of instructions to next level DSO (Bayernwerk) according to
the BDEW cascade [16]. Potential risks due to cyber-attacks might cause delays in
fault detection and system recovery. Expected attack scenarios may be: a) fake alarms
b) blockage due to spam attacks, c) misinformation, wrong instructions to service
resources. As the service processes are human guided there is a high probability to
early identify attacks and to develop work arounds in a timely manner.
D5.1 Business Cases for Smart Grid Cyber Security Measures © SPARKS Consortium
Deliverable D5.1 Page 42 of 54
② SWK Master Controller consists of two parallel CPUs equipped with mirror disks.
The master controller today is linked to the main transformer station, monitoring nine
20kV powerlines installed as open rings. Remote switching can be executed, but this
remote control function has been used for tests only. SWK’s master controller is
mainly used to control various water and gas stations. District heating has its own
SCADA systems, which is a part of SWK’s biomass power plant ICT system.
Potential risks to the master controller due to cyber-attacks may cause delays in fault
detection and system recovery: a) the only way to affect the master controller system
requires access to the open port to the terminal server used to operate the Master
Controller system, b) fake alarms from the main power station will have no effect
because there is no automatic switching and decisions are made by the operator only.
Technologically spoken there is a very low risk to affect the master controller.
③ Today only the main transformer station with its connection to the 110kV access point
the next level DSO (Bayernwerk) is connected to the master controller via RTU
(Remote Terminal Unit) using the IEC 104 [21] IP-based communication protocol.
Power plants are not connected to the master controller but are controlled by the ripple
controller, which is a standalone system. If load balancing or load shedding in the
electrical net becomes necessary then PV systems (>35kW) and heat pumps or other
electric heaters can be cutoff by human interaction.
④ Today SWK does not use GSM to monitor or control power systems in its network.
⑤ Smart metering for domestic customers has been outsourced to external accounting
service provider. There is no electronic metering installed today.
⑥ Special customers (e.g. industry) use electronic metering but data processing is
completely outsourced to an external service provider.
⑦ SWK’s grid control system is accessed for remote maintenance services from external
service providers. There is a very low, but valid, risk of unauthorized access via VPN
tunneled remote service. There is a bigger chance for spam attacks, fake power outage
information or unnecessary power shedding requests to the service center hotline.

D5.1 Business Cases for Smart Grid Cyber Security Measures © SPARKS Consortium
Deliverable D5.1 Page 43 of 54
4.2.1 A value status analysis provides an overview of assets (CAPEX, OPEX, revenue)
Figure 30: SWK CAPEX / OPEX analysis
4.2.2 Results of SWK Self-assessment and Security Level
SWK is only at the beginning to develop its utility ICT infrastructure. Due to the very low degree of
automation the potential risk of damage from cyber-attacks is low. The standard regulations and safety
instructions for utilities have been implemented. This provides SWK with a high security level; please
find a summary of the assessment in Table 5.
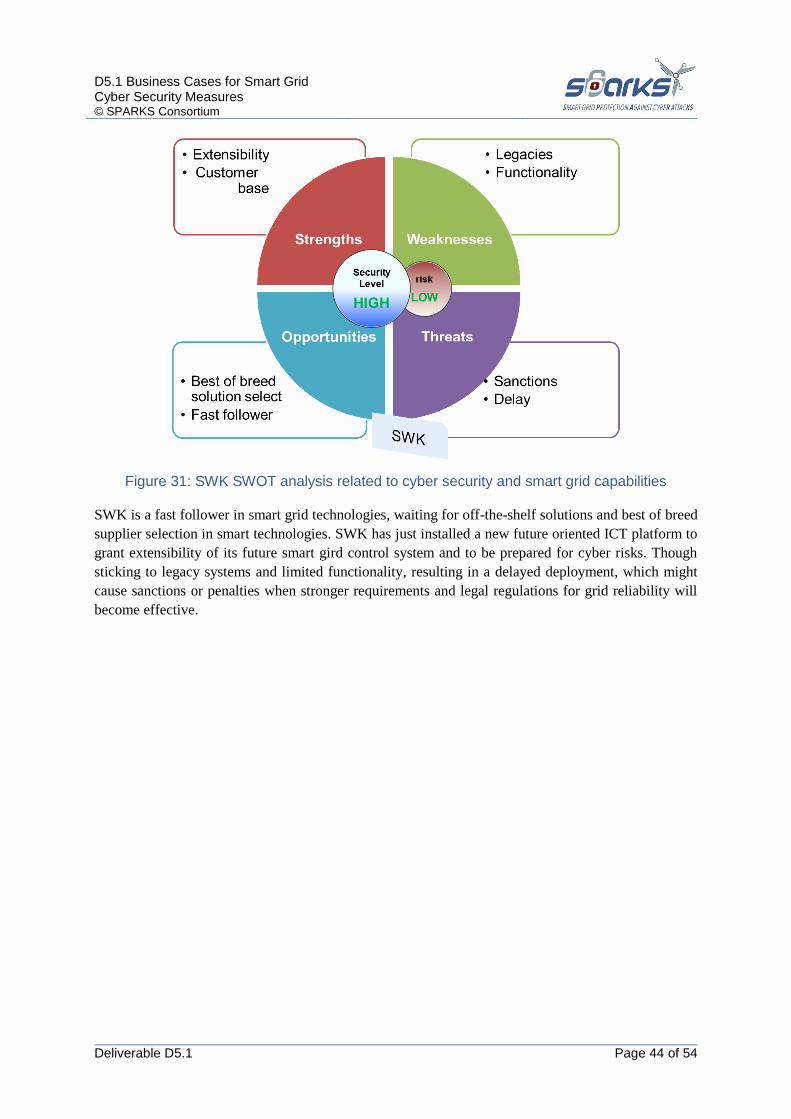
D5.1 Business Cases for Smart Grid Cyber Security Measures © SPARKS Consortium
Deliverable D5.1 Page 44 of 54
Figure 31: SWK SWOT analysis related to cyber security and smart grid capabilities
SWK is a fast follower in smart grid technologies, waiting for off-the-shelf solutions and best of breed
supplier selection in smart technologies. SWK has just installed a new future oriented ICT platform to
grant extensibility of its future smart gird control system and to be prepared for cyber risks. Though
sticking to legacy systems and limited functionality, resulting in a delayed deployment, which might
cause sanctions or penalties when stronger requirements and legal regulations for grid reliability will
become effective.
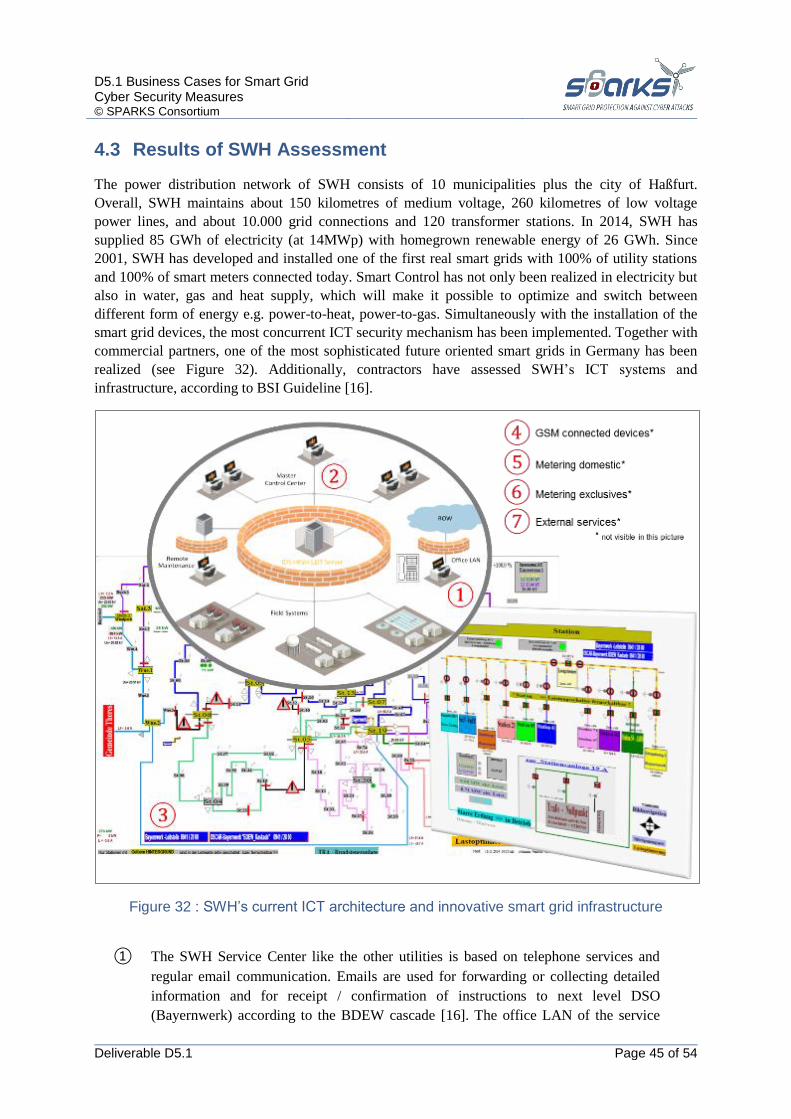
D5.1 Business Cases for Smart Grid Cyber Security Measures © SPARKS Consortium
Deliverable D5.1 Page 45 of 54
4.3 Results of SWH Assessment
The power distribution network of SWH consists of 10 municipalities plus the city of Haßfurt.
Overall, SWH maintains about 150 kilometres of medium voltage, 260 kilometres of low voltage
power lines, and about 10.000 grid connections and 120 transformer stations. In 2014, SWH has
supplied 85 GWh of electricity (at 14MWp) with homegrown renewable energy of 26 GWh. Since
2001, SWH has developed and installed one of the first real smart grids with 100% of utility stations
and 100% of smart meters connected today. Smart Control has not only been realized in electricity but
also in water, gas and heat supply, which will make it possible to optimize and switch between
different form of energy e.g. power-to-heat, power-to-gas. Simultaneously with the installation of the
smart grid devices, the most concurrent ICT security mechanism has been implemented. Together with
commercial partners, one of the most sophisticated future oriented smart grids in Germany has been
realized (see Figure 32). Additionally, contractors have assessed SWH’s ICT systems and
infrastructure, according to BSI Guideline [16].
Figure 32 : SWH’s current ICT architecture and innovative smart grid infrastructure
① The SWH Service Center like the other utilities is based on telephone services and
regular email communication. Emails are used for forwarding or collecting detailed
information and for receipt / confirmation of instructions to next level DSO
(Bayernwerk) according to the BDEW cascade [16]. The office LAN of the service
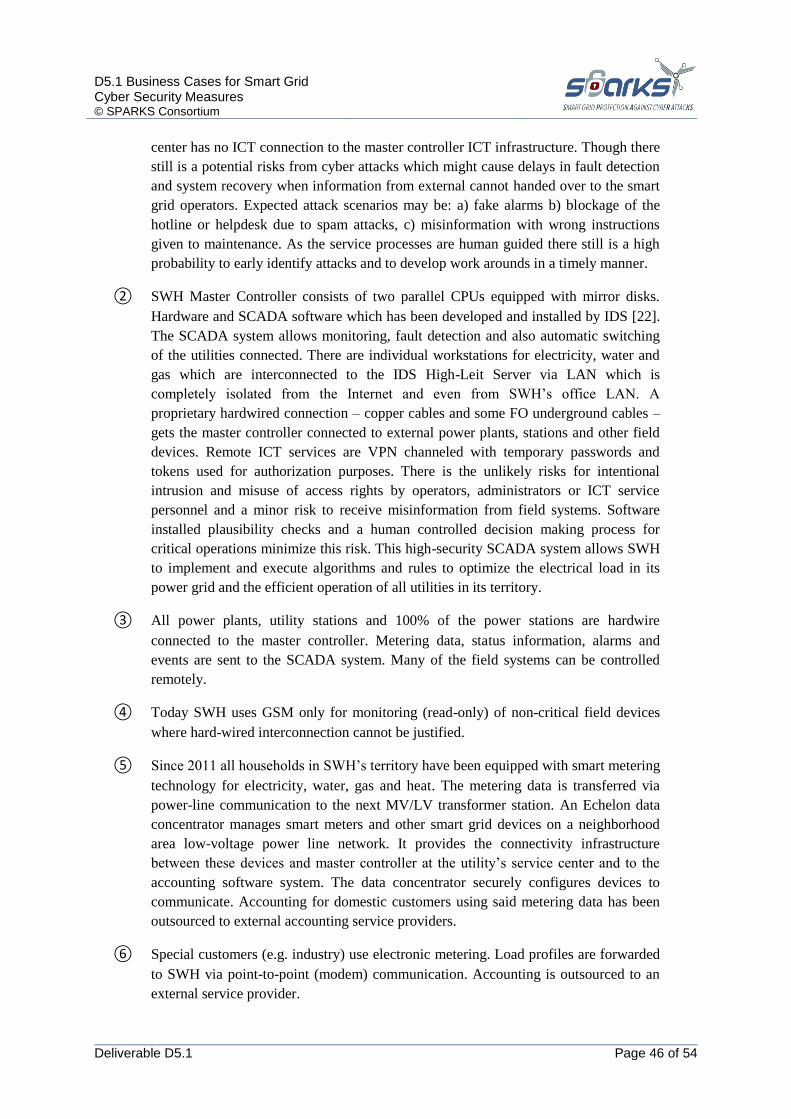
D5.1 Business Cases for Smart Grid Cyber Security Measures © SPARKS Consortium
Deliverable D5.1 Page 46 of 54
center has no ICT connection to the master controller ICT infrastructure. Though there
still is a potential risks from cyber attacks which might cause delays in fault detection
and system recovery when information from external cannot handed over to the smart
grid operators. Expected attack scenarios may be: a) fake alarms b) blockage of the
hotline or helpdesk due to spam attacks, c) misinformation with wrong instructions
given to maintenance. As the service processes are human guided there still is a high
probability to early identify attacks and to develop work arounds in a timely manner.
② SWH Master Controller consists of two parallel CPUs equipped with mirror disks.
Hardware and SCADA software which has been developed and installed by IDS [22].
The SCADA system allows monitoring, fault detection and also automatic switching
of the utilities connected. There are individual workstations for electricity, water and
gas which are interconnected to the IDS High-Leit Server via LAN which is
completely isolated from the Internet and even from SWH’s office LAN. A
proprietary hardwired connection – copper cables and some FO underground cables –
gets the master controller connected to external power plants, stations and other field
devices. Remote ICT services are VPN channeled with temporary passwords and
tokens used for authorization purposes. There is the unlikely risks for intentional
intrusion and misuse of access rights by operators, administrators or ICT service
personnel and a minor risk to receive misinformation from field systems. Software
installed plausibility checks and a human controlled decision making process for
critical operations minimize this risk. This high-security SCADA system allows SWH
to implement and execute algorithms and rules to optimize the electrical load in its
power grid and the efficient operation of all utilities in its territory.
③ All power plants, utility stations and 100% of the power stations are hardwire
connected to the master controller. Metering data, status information, alarms and
events are sent to the SCADA system. Many of the field systems can be controlled
remotely.
④ Today SWH uses GSM only for monitoring (read-only) of non-critical field devices
where hard-wired interconnection cannot be justified.
⑤ Since 2011 all households in SWH’s territory have been equipped with smart metering
technology for electricity, water, gas and heat. The metering data is transferred via
power-line communication to the next MV/LV transformer station. An Echelon data
concentrator manages smart meters and other smart grid devices on a neighborhood
area low-voltage power line network. It provides the connectivity infrastructure
between these devices and master controller at the utility’s service center and to the
accounting software system. The data concentrator securely configures devices to
communicate. Accounting for domestic customers using said metering data has been
outsourced to external accounting service providers.
⑥ Special customers (e.g. industry) use electronic metering. Load profiles are forwarded
to SWH via point-to-point (modem) communication. Accounting is outsourced to an
external service provider.
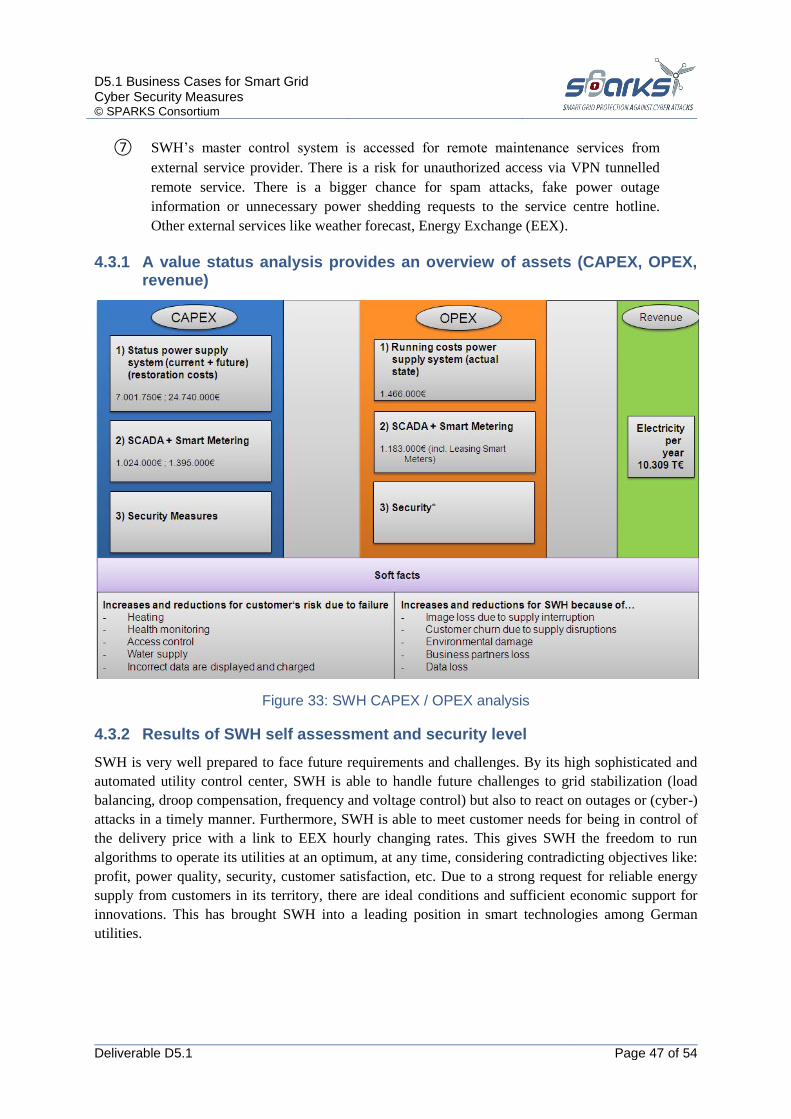
D5.1 Business Cases for Smart Grid Cyber Security Measures © SPARKS Consortium
Deliverable D5.1 Page 47 of 54
⑦ SWH’s master control system is accessed for remote maintenance services from
external service provider. There is a risk for unauthorized access via VPN tunnelled
remote service. There is a bigger chance for spam attacks, fake power outage
information or unnecessary power shedding requests to the service centre hotline.
Other external services like weather forecast, Energy Exchange (EEX).
4.3.1 A value status analysis provides an overview of assets (CAPEX, OPEX, revenue)
Figure 33: SWH CAPEX / OPEX analysis
4.3.2 Results of SWH self assessment and security level
SWH is very well prepared to face future requirements and challenges. By its high sophisticated and
automated utility control center, SWH is able to handle future challenges to grid stabilization (load
balancing, droop compensation, frequency and voltage control) but also to react on outages or (cyber-)
attacks in a timely manner. Furthermore, SWH is able to meet customer needs for being in control of
the delivery price with a link to EEX hourly changing rates. This gives SWH the freedom to run
algorithms to operate its utilities at an optimum, at any time, considering contradicting objectives like:
profit, power quality, security, customer satisfaction, etc. Due to a strong request for reliable energy
supply from customers in its territory, there are ideal conditions and sufficient economic support for
innovations. This has brought SWH into a leading position in smart technologies among German
utilities.
D5.1 Business Cases for Smart Grid Cyber Security Measures © SPARKS Consortium
Deliverable D5.1 Page 48 of 54
Figure 34: SWH SWOT analysis related to cyber security and smart grid capabilities
SWH’s ICT systems and infrastructure are designed for high security – find a summary of the
assessment in Table 5 above. There has been a thorough planning of attack scenarios and the
simulation of emergencies to prove the robustness of the smart control system and its resilience
against various kinds of attacks. Standard regulations and safety instructions for utilities have been
implemented in an exemplary manner. This provides SWH with a high security level.
5 Key Findings and Conclusions
The results of the assessments can easily be made transferable to other DSOs, at least to the 883 DSOs
in Germany. The current ICT systems implemented at the three DSOs seem to be relatively secure for
the time being, but for SWW and SWK not smart, yet. Nevertheless, there will always be leaks,
especially regarding the fact that the number of automation and communication devices and SCADA
systems installed will increase tremendously in the near future, in order to grant stability in the power
supply systems. As shown in Section 3, the challenge to DSOs stems from the increasing demand to
support the transmission system operator in power management, which will result in safer and
advanced information processing and communication technologies – see Figure 35 .
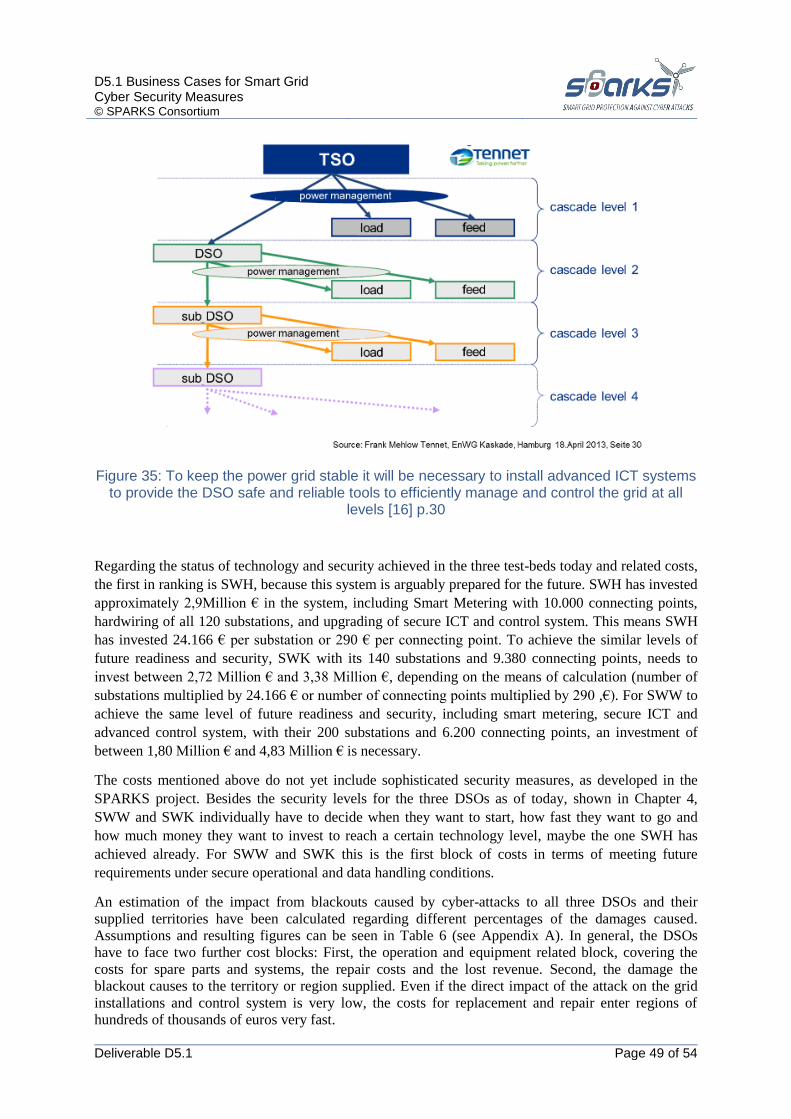
D5.1 Business Cases for Smart Grid Cyber Security Measures © SPARKS Consortium
Deliverable D5.1 Page 49 of 54
Figure 35: To keep the power grid stable it will be necessary to install advanced ICT systems to provide the DSO safe and reliable tools to efficiently manage and control the grid at all
levels [16] p.30
Regarding the status of technology and security achieved in the three test-beds today and related costs,
the first in ranking is SWH, because this system is arguably prepared for the future. SWH has invested
approximately 2,9Million € in the system, including Smart Metering with 10.000 connecting points,
hardwiring of all 120 substations, and upgrading of secure ICT and control system. This means SWH
has invested 24.166 € per substation or 290 € per connecting point. To achieve the similar levels of
future readiness and security, SWK with its 140 substations and 9.380 connecting points, needs to
invest between 2,72 Million € and 3,38 Million €, depending on the means of calculation (number of
substations multiplied by 24.166 € or number of connecting points multiplied by 290 ,€). For SWW to
achieve the same level of future readiness and security, including smart metering, secure ICT and
advanced control system, with their 200 substations and 6.200 connecting points, an investment of
between 1,80 Million € and 4,83 Million € is necessary.
The costs mentioned above do not yet include sophisticated security measures, as developed in the
SPARKS project. Besides the security levels for the three DSOs as of today, shown in Chapter 4,
SWW and SWK individually have to decide when they want to start, how fast they want to go and
how much money they want to invest to reach a certain technology level, maybe the one SWH has
achieved already. For SWW and SWK this is the first block of costs in terms of meeting future
requirements under secure operational and data handling conditions.
An estimation of the impact from blackouts caused by cyber-attacks to all three DSOs and their
supplied territories have been calculated regarding different percentages of the damages caused.
Assumptions and resulting figures can be seen in Table 6 (see Appendix A). In general, the DSOs
have to face two further cost blocks: First, the operation and equipment related block, covering the
costs for spare parts and systems, the repair costs and the lost revenue. Second, the damage the
blackout causes to the territory or region supplied. Even if the direct impact of the attack on the grid
installations and control system is very low, the costs for replacement and repair enter regions of
hundreds of thousands of euros very fast.
D5.1 Business Cases for Smart Grid Cyber Security Measures © SPARKS Consortium
Deliverable D5.1 Page 50 of 54
The loss of revenues increases directly with the timespan offline. In this document it is calculated top-
down out of the annual sale of electricity and broken down to daily or hourly sale. For Deliverable
D5.2, the calculation will be implemented bottom-up, determining and calculating the value of lost
load (VoLL).
Table 6 shows all the results from the calculations mentioned above. For example, one blackout up to
12 hours, with a direct damage of 1% of the grid and a repair effort of 3.5 days (1% of annual
operation costs) causes a total amount of damage costs of approximately 690.000 € in SWW, 582.000
€ in SWH and 702.000 € in SWK.
The most interesting figure included in this amounts is the damage costs to the supplied region per
incident, calculated top-down from the overall GDP of the DSO supply region multiplied with factor
0,08% derived from the Italian blackout case. The results of this calculation read like 247.000 € for
SWW, 280.000 € for SWH and 398.000 € for SWK
When compared with the annual profit of the year 2014 of the three DSOs the total amount of damage
reaches 176 % of profit for SWW based on a profit of 340.000 (2014), 34,0% of profit for SWH
based on a profit of 1.710.000 € and 42,8% of profit for SWK based on a profit of 1.640.000 €.
These figures will be very interesting for the Management of DSOs because they directly affect the
profit of the enterprise and therefore make stakeholders and board concerned (even more when
municipal) if not handled and settled properly. There will be possibilities to insure the risk of damage
following cyber-attacks in the future. However, the premium for this insurance will be related directly
to and depending on the technical efforts that have been undertaken to minimize the risk inside the
company. One way or the other, no CFO can deny the threats of not implementing security measures.
The intention is the figures shown in this document have the potential to create awareness for the
necessity of investments in (cyber) security measures. This top-down attempt to calculate the “price of
not implementing security” is approximate; however, the dimension of the amounts involved will not
lower drastically by applying algorithms that are more sophisticated.
Looking ahead to Deliverable D5.2, the bottom-up approach calculations, with precise repair costs and
the spare parts needed, and the costs for the SPARKS security measures will be implemented for
SWW. The direct costs and losses from a cyber-attack will be evaluated using a well-established
performance model (taken from SPARKS WP3), including the modelling for simulating cost / loss
impact from a cyber-attack scenarios from SPARKS WP2. The use of a hierarchical cost model from
elementary circuit components will allow the impact simulation and cost sensitivity analysis of a
utility. Finally, the specific industrial factors out of the SWW survey for the supplied region from
WP5 will be applied to calculate the possible damage to the region.
D5.1 Business Cases for Smart Grid Cyber Security Measures © SPARKS Consortium
Deliverable D5.1 Page 51 of 54
References
1. "Federal Energy Regulatory Commission Assessment of Demand Response & Advanced
Metering" (PDF). United States Federal Energy Regulatory Commission. United States Federal
Energy Regulatory Commission.
2. Johannes Reichl, Michael Schmidthaler, “Italian Blackout.pdf” , Assessing the socio-economic
effects of power outages ad hoc, © Springer-Verlag Berlin Heidelberg 2016, DOI
10.1007/s00450-014-0281-9
3. Johannes Reichl, Michael Schmidthaler, Friedrich Schneider, “The value of supply security: The
costs of power outages to Austrian households, firms and the public sector”, Sept., 15th 2012,
http://www.elsevier.com/locate/eneco.
4. Kim Zetter, “Everything We Know about Ukraine’s Power Plant Hack” blogged on
www.wired.com, Jan., 20th 2016, http://www.wired.com/2016/01/everything-we-know-about-
ukraines-power-plant-hack.
5. Allianz Risk Barometer 2015 – Full report available under:
http://www.agcs.allianz.com/insights/white-papers-and-case-studies/risk-barometer-2015/.
6. Frenkel, Michael, Ulrich Hommel, Gunter Dufey, and Markus Rudolf. Risk Management:
Challenge and Opportunity. 2nd ed. Berlin: Springer, 2005.
7. Merna, Tony, and Thaisal F. Al-Fani. Corporate Risk Management: An Organisational
Perspective. Chichester, UK: Wiley, 2008.
8. BSI German Federal Office for Information Security.
https://www.bsi.bund.de/EN/TheBSI/thebsi_node.html.
9. BSI Leitfaden zur Informationssicherheitsrevision. https://www.bsi.bund.de/DE/Themen/Cyber-
Sicherheit/Dienstleistungen/ISRevision/isrevision_node.html/.
10. BSI IS-Kurzrevision. https://www.bsi.bund.de/DE/Themen/Cyber-
Sicherheit/Dienstleistungen/ISRevision/ISKurzrevision/iskurzrevision_node.html
11. ISO/IEC 62443 suite of standards. http://www.iec.ch/technology/
12. IEC/TS 62443-1-1 Technical Specification - Industrial communication networks – Network and
system security – Part 1-1: Terminology, concepts and models. 2009.
13. SWW Facts & Figures: http://www.s-w-w.com/cms2/index.php?id=140
14. SWK Facts & Figures: http://stadtwerke-kelheim.de/netz/netzdaten
15. SWH Facts & Figures: http://www.stadtwerkhassfurt.de/netzestrom
16. Frank Mehlow Tennet, EnWG Kaskade, Hamburg 18.April 2013,
https://www.bdew.de/internet.nsf/419b3f74e0ee5f73c1256fba0038ddb3/9f33cb7747c0209ec1257
b5d005a6b3e/$FILE/Mehlow_Kaskadenkonzept_TenneT.pdf/.
D5.1 Business Cases for Smart Grid Cyber Security Measures © SPARKS Consortium
Deliverable D5.1 Page 52 of 54
17. Frank Mehlow Tennet, EnWG Kaskade, page 16,
18. Frank Mehlow Tennet, EnWG Kaskade, page 30,
19. VDE Netztechnik/Netzbetrieb Anwendungsregel: askadierung von Maßnahmen zur
Systemsicherheit – VDE-AR-N4140.
https://www.vde.com/de/fnn/Dokumente/Documents/E_VDE-AR-N_4140_2016-01.pdf
20. SWW Roadmap, Wunsiedler Weg – Energie: http://s-w-
w.com/cms2/fileadmin/inhalte/sww/berichte_dokumente/jahresmottos/motto_2014/sww_motto_2
014.pdf
21. IEC 60870-5-104 TCP protocol for connection-oriented secure data transmission.
22. IDS SCADA product IDS-Leit: http://www.ids.de/en/products/scada-system.html .
23. Bayerisches Statistisches Jahrbuch 2014: http://www.stmi.bayern.de/suk/bayern/jahrbuch/
D5.1 Business Cases for Smart Grid Cyber Security Measures © SPARKS Consortium
Deliverable D5.1 Page 53 of 54
Appendix A: Details of Cost Calculations
This appendix shows the model and formula used to calculate the different types of costs based on the
individual data of SWW, SWH and SWK. Table 6 shows the results of the top-down calculation.
The formula used:
CAPEX (Grid) * X1 + CAPEX (SCADA+control system) * X2 + OPEX (Grid)* Y1 + OPEX
(SCADA+control system) * Y2 + Revenue *Z + GDP (Supplied area) * 0,00083
The assumptions:
Percentage of damage X1=X2=Y1=Y2 (0.1%, 1%, 5%, 10%) applied to CAPEX for
replacement necessary and spent on OPEX for repair, per DSO, shown in “grid costs”; it
varies with the type, scenario and success of the attack.
Number of days Z=1; shows the loss of turnover for 1 day out of business per DSO; it is a cost
block depending on the duration of the black-out in hours or days.
GDP of supplied region multiplied with 0.083% (derived out of Italian incident) gives an
estimate for the macro-economical damage in the supplied region; it is a cost block per
incident (if black-out does not last longer than 9-12 hours). The annual GDP figures for
SWW, SWK, SWH territories have been taken from the “Bayerisches Statistisches Jahrbuch
2014” [23]
CAPEX, OPEX and Revenue taken from the individual assessment charts
X1 - percentage of expected share of grid installation to be replaced
X2 - percentage of expected share of SCADA+control system installation to be replaced
Y1 - percentage of regular operational cost of grid spent additionally on repair of grid
Y2 - percentage of regular operational cost of SCADA+control system spent additionally on
repair of control and communication system
Z - number of days electricity supply is not operable
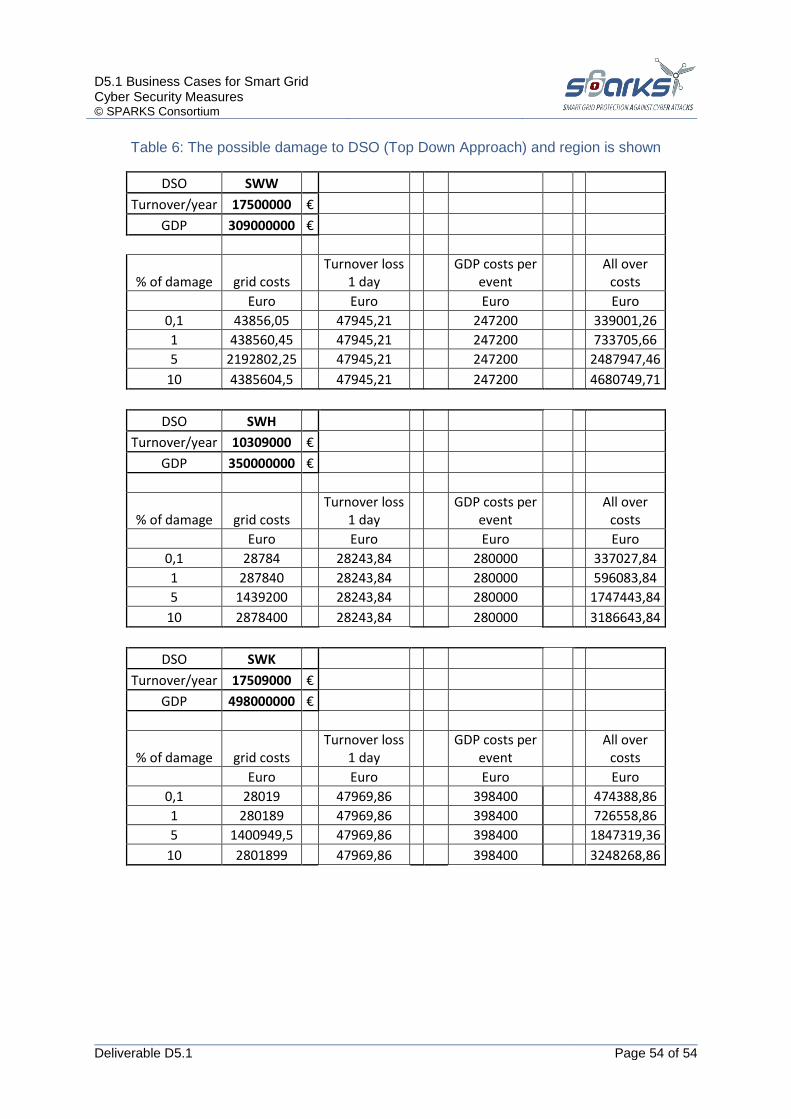
D5.1 Business Cases for Smart Grid Cyber Security Measures © SPARKS Consortium
Deliverable D5.1 Page 54 of 54
Table 6: The possible damage to DSO (Top Down Approach) and region is shown
DSO SWW
Turnover/year 17500000 €
GDP 309000000 €
% of damage grid costs Turnover loss
1 day GDP costs per
event All over
costs
Euro Euro Euro Euro
0,1 43856,05 47945,21 247200 339001,26
1 438560,45 47945,21 247200 733705,66
5 2192802,25 47945,21 247200 2487947,46
10 4385604,5 47945,21 247200 4680749,71
DSO SWH
Turnover/year 10309000 €
GDP 350000000 €
% of damage grid costs Turnover loss
1 day GDP costs per
event All over
costs
Euro Euro Euro Euro
0,1 28784 28243,84 280000 337027,84
1 287840 28243,84 280000 596083,84
5 1439200 28243,84 280000 1747443,84
10 2878400 28243,84 280000 3186643,84
DSO SWK
Turnover/year 17509000 €
GDP 498000000 €
% of damage grid costs Turnover loss
1 day GDP costs per
event All over
costs
Euro Euro Euro Euro
0,1 28019 47969,86 398400 474388,86
1 280189 47969,86 398400 726558,86
5 1400949,5 47969,86 398400 1847319,36
10 2801899 47969,86 398400 3248268,86