business cases for software security initiatives ... - … software security initiatives marco...
TRANSCRIPT

Copyright © 2009 - The OWASP FoundationPermission is granted to copy, distribute and/or modify this document under the terms of the GNU Free Documentation License.
The OWASP Foundation
OWASP
http://www.owasp.org
How to Create a Business Case for Software Security Initiatives
Marco MoranaOWASP LeadTISO Citigroup

OWASP 2
Status Quo of Software Security Spending
“Security software budgets are expected to growby approximately 4 % in 2010 despite overall IT budgets are shrinking " – Gartner
...but“..Security managers should continue to look for ways to maintain the same level of security for less moneyuntil the economy improves” - CIO MidMarket
and“Organizations that have suffered a public data breach spend more on security in the development process than those that have not” – OWASP

OWASP
Making the Business Cases: Essentials
Secure Software Engineering Awareness“ Security involves making sure things work, not in the presence of random faults, but in the face of an intelligent and malicious adversary trying to ensure that things will fail in the worst possible way at the worst possible time… again and again”
Prepare for Executive Management FAQs:Why I spend money on software security?How much I should spend ?What my competitors are doing?How I am doing at my vulnerabilities?How I get the most bang for the buck ?
3

OWASP 4
Main Factors Driving Software Security Adoption
?

OWASP
Lessons From the Court Room
5
170 million card and ATM numbers
used sqlinjection and packet sniffers

OWASP
Lessons From Law Enforcement (FBI)
6
THREAT INTELLIGENCE:Attack “xp_cmdshell on MSQL server to upload sniffers to capture CC transactions and ATM PINs from DB, HSMRECCOMENDATIONS:1. Disable xp_cmdshell,2. Deny extended URL,3. escape special characters such as “”, 4. Use store procedures, 5. Run SQL Server and IIS under non-privilege,6. Do not use “sa” hardcoded, 7. Lock account on mainframes against brute force8. Use minimum privileges on AD/SQL server, restrict access 9. Use proxy server for internet access, 10. Implement firewall rules 11. Ensure HSM do not take commands with PIN in the clear
OWASP 7
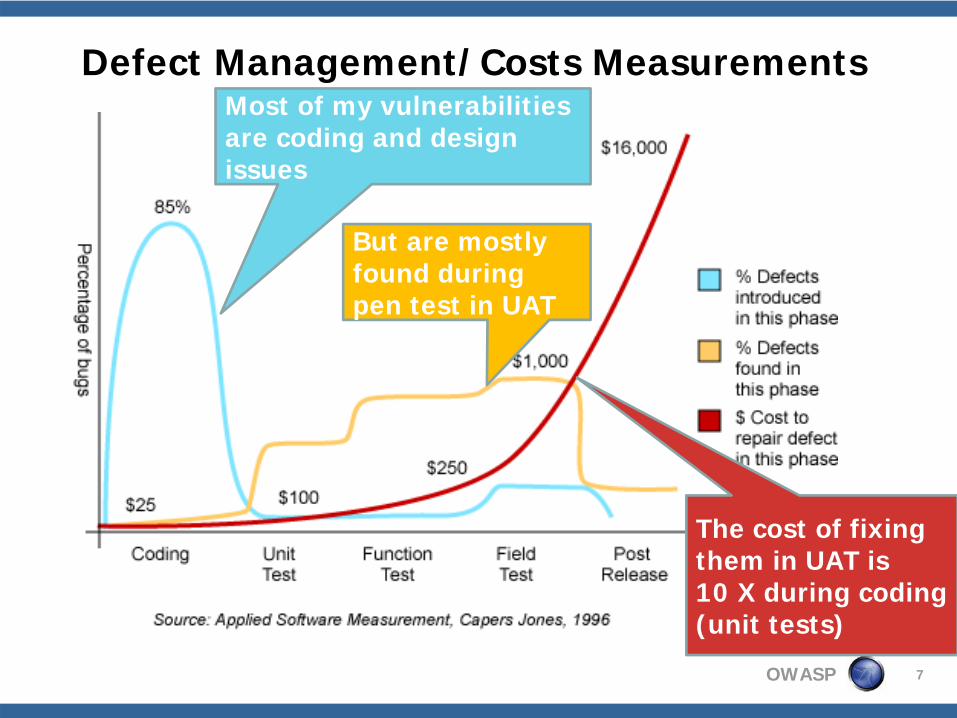
Defect Management/Costs Measurements
Process MetricsIs code validated against security coding standards?Is design of developers trained, using organizational security best practice technology, architecture and processes
Management Metrics% of applications rated “business-critical” that have been security tested% of projects that where developed with the SDL% of security issues identified by lifecycle phase% of issues whose risk has been accepted% of security issues being fixedAverage time to correct vulnerabilitiesBusiness impact of critical security incidents.
Most of my vulnerabilities are coding and design issues
But are mostly found during pen test in UAT
The cost of fixing them in UAT is 10 X during coding (unit tests)
OWASP
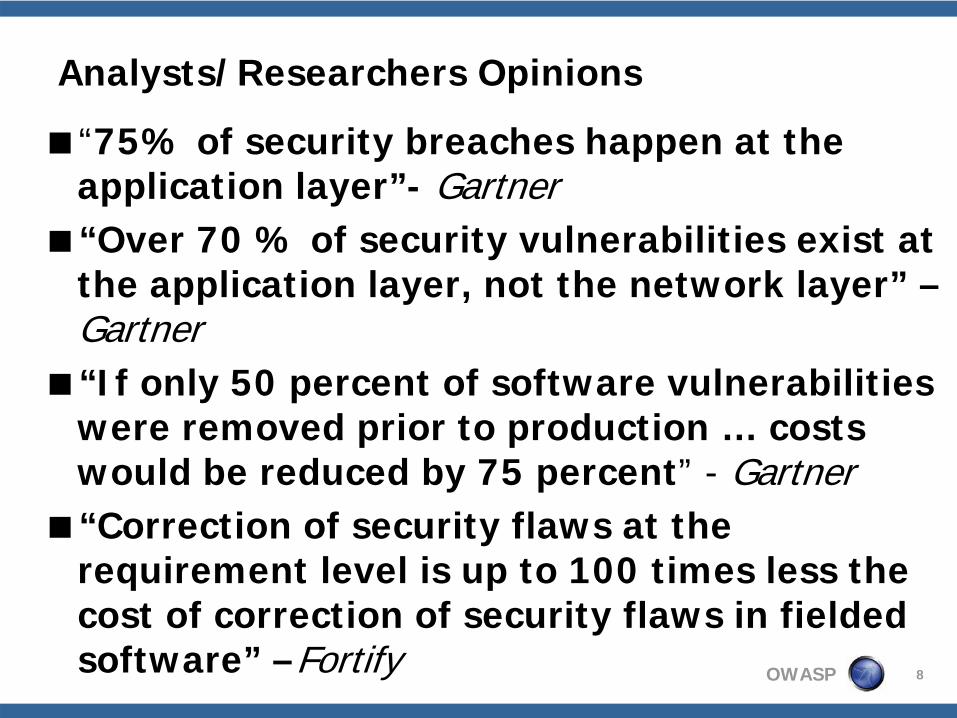
Analysts/Researchers Opinions
“75% of security breaches happen at the application layer”- Gartner “Over 70 % of security vulnerabilities exist at the application layer, not the network layer” –Gartner“If only 50 percent of software vulnerabilities were removed prior to production … costs would be reduced by 75 percent” - Gartner “Correction of security flaws at the requirement level is up to 100 times less the cost of correction of security flaws in fielded software” –Fortify 8

OWASP
Why Using Metrics And Maturity Models?
Use vulnerability metrics to articulate software security needs/opportunities
Point to software security root causesIdentify vulnerability trendsAnalyze needs for improvements
Use maturity models to provide visibility on the organization’s security capabilities
Assess organization capability levelsSet goals and needs to reach the goalsProvide the roadmap

OWASP
Vulnerability Taxonomies and Trends
10
Am I getting better ? Where ?

OWASP 11
Software Security Metrics Business Cases
Business Managers: shows that projects are on schedule and moving on target and testing cycles for vulnerabilities are shorter translating in cost savingsInformation Security Officers: show that we are getting better on reporting compliance and manage risk reductionDeveloper Leads: show that developers are getting better to write secure software when provided with secure coding training and tools

OWASP
Software Security Maturity Models: SAMM, BSIMM
12Source http://www.bsi-mm.com/ssf/
Source SAMM : http://www.opensamm.org/

OWASP
Activities, Objectives and Capability Levels
13
Use this as a yardstick to compare software security practices with other organizations
Source BSIMM http://www.bsi-mm.com/ssf/

OWASP
The Software Security Maturity Curve (CMM)
14
Time
CMM Level 1Initial
(Ad Hoc)
CMM Level 2Repeatable(Reactive
Processes)
CMM Level 3Defined
(Proactive)
CMM Level 4Managed(Product Driven)
CMM Level 5Optimizing
(Service Driven)
Catch & Patch
Ethical HackingSecure Code Reviews
on existing Applications
Software Security Risks Identified and Managed At Different Checkpoints During the SDLC
Improve Coverage of Software Security Risk Assessments, Identify Gaps and Opportunities
Vulnerability AssessmentsSource Code Analysis
Secure Coding StandardsBefore Product Release
Highest effort/cost is required here

OWASP
Cost vs. Benefit Analysis (CBA)
15
Purpose is to weight the cost of software security initiative vs. the benefitsCBRatio = COST of initiative
BENEFIT of initiative
Need to cost quantify factors and compare them (to compare apples with apples) for example:
COSTs:Secure software engineering costs for
training, new processes and tools BENEFITs:
Reduced costs in fixing with patching, lessen business impact of exploits

OWASP
Assumption Costs and Failure Costs of the Software Security Initiative
Assumption Costs (proactive):Cost of acquiring tools, standards and processes to develop secure softwareCost of hiring and/or training a software security teamCosts for implement security features (e.g. estimate possible as function of KLOC)
Failure Costs (reactive):Cost of develop and/or deploy patchesCost of incident responseCost of vulnerability exploits resulting in data breach, fraud, denial of service, quantifiable damage to the organization 16
The most difficult to estimate

OWASP
Assumption Costs vs. Failure Costs
17
No countermeasures, cost of failure (e.g. data breach is high)
Cost is low but CBRatio >1
CBRatio <1 but room for improvement
Optimal Spending, around 37% (Gordon and Loeb)

OWASP
Data Loss Liabilities Estimates
Consider FTC data (2003)4.6 % of US population suffered identity fraudCompanies spent 3 * 10^8 hours repairing the troubles caused + $ 5 Billion dollar spent out of pocketMinimum wage of 5.15 $/hr (in 2003)10 Million people involved
P = 4.6 %L = 3 x 10^8 x $ 5.15/hr + $ 5 * 10^9 = $ 655/victim
10^7 victims
My annual liability (P X L) for each data theft victim is $ 30.11
18
SOURCE: Dan. E. Geer, Economics & Strategies of Data Security

OWASP
Data Losses As Web Breaches (datalossdb.org)
19SOURCE: Open Security Foundation Data Loss Statistics

OWASP
Which Vulnerabilities Are Exploited? (WHID)
20
SOURCE: Breach Security The WHID 2009, August 2009

OWASP
Estimating SQL Injection Attack Liability
Probability of attack by type and attack vector incident (identity theft) data:
13 % of incidents involve breaches of web channel (datalossdb.org) 19 % of incidents use SQL injection as attack vector (WHID)P = 0.13 x 0.19 = 0.025 (2.5 %)
Estimate data loss for this attack:$ 655 per identity theft victim (2003 FTC data) 94 million individual records stolen (TJX incident)L = 94 X 10^6 x 0.025 x 655 = $ 1.5 Billion
21
OWASP
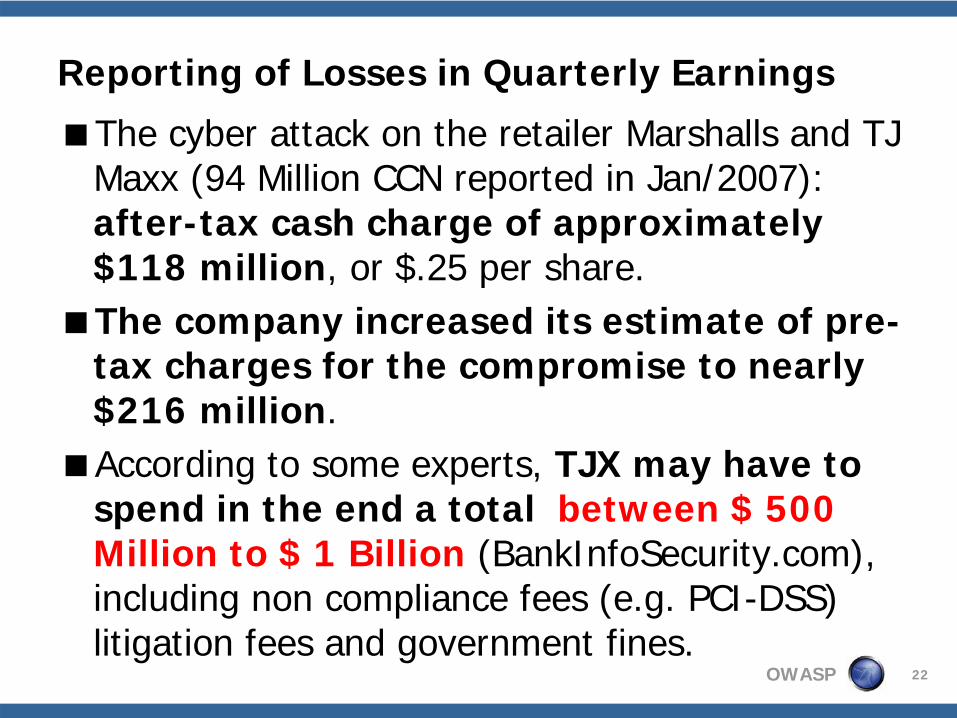
Reporting of Losses in Quarterly Earnings
The cyber attack on the retailer Marshalls and TJ Maxx (94 Million CCN reported in Jan/2007): after-tax cash charge of approximately $118 million, or $.25 per share.The company increased its estimate of pre-tax charges for the compromise to nearly $216 million. According to some experts, TJX may have to spend in the end a total between $ 500 Million to $ 1 Billion (BankInfoSecurity.com), including non compliance fees (e.g. PCI-DSS) litigation fees and government fines.
22

OWASP
Another Way to Look at Business Impact Of Data Breaches : Drop in Stock Price
23
130 ML CCN loss (reported January 20 2009)

OWASP
Quantitative Risk Analysis
24
Goal:Justify spending to improve security by assigning an objective monetary value to risk
Risk Analysis Methodology:Determine the Exposure Factor: Percentage of asset loss caused by identified threat (e.g. 20%)Determine Single Loss Expectancy (SLE): EF x the value of assets (e.g. $ 1 ML * 30%= $ 200 K)Estimate Annualized Rate of Occurrence (ARO): twice in ten years 2/10=0.2, 1 every year =1Determine the Annualized Loss Expectancy (ALE) ALE = SLE x ARO = $ 40 K

OWASP
Use Quantitative Risk Analysis to Estimate Annual Loss Due to SQL Injection Exploit
Exposure Factor (likelihood) of data loss via SQL injection attack: 2.5%
Based upon datalossdb and WHID calculated probability data)
SLE (EF x Value Assets): $ 43 MillionAsset Value: assume SQL injection attack will cause
fraud for 3 million credit card accounts (on-line web site for major bank) at a 580 $/account (use SANS data)
ARO: 40 % (four every 10 years)ALE (ALO X SLE): = $ 17 Million
25

OWASP
ROSI Of Secure Software Initiatives
ROSI (Return Of Security Investment)ROSI = Savings (Avoided loss) /Total Cost Of Solution
Goal:Answer the question on how much I can save by investing in Software Security
According to previous studies (Soo Hoo-IBM):For every 100,000 $ spent in software security I save:
$21,000 (21%) when defects are fixed and identified during design$15,000 (15%) when defects are fixed during implementation$12,000 (12%) when defects are fixed during testing
26
OWASP
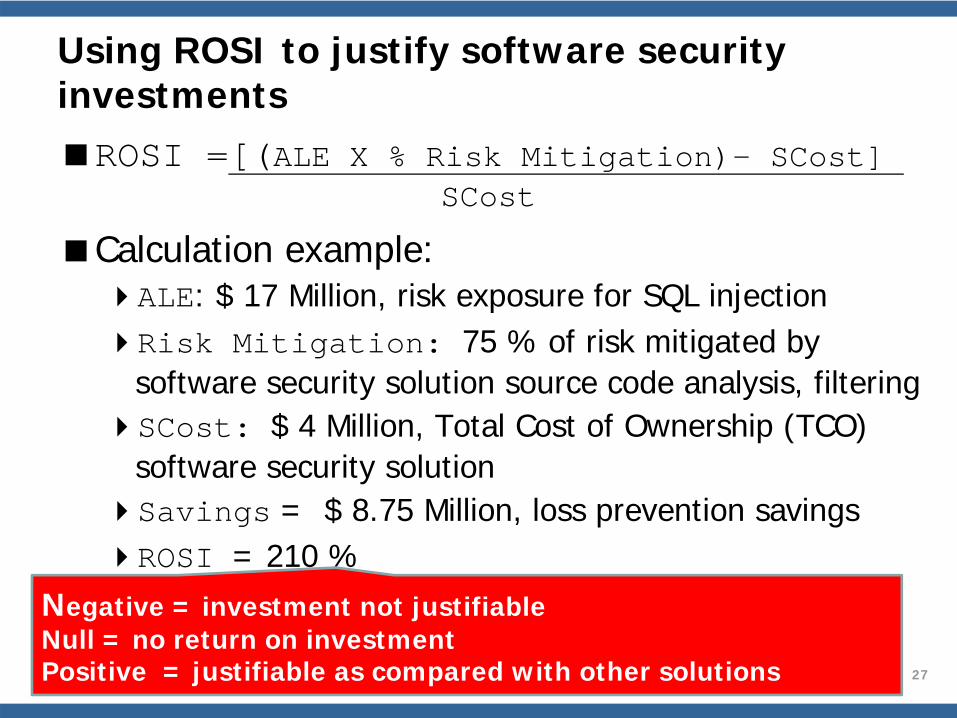
Using ROSI to justify software security investmentsROSI =[(ALE X % Risk Mitigation)- SCost]
SCost
Calculation example:ALE: $ 17 Million, risk exposure for SQL injectionRisk Mitigation: 75 % of risk mitigated by software security solution source code analysis, filteringSCost: $ 4 Million, Total Cost of Ownership (TCO) software security solution Savings = $ 8.75 Million, loss prevention savingsROSI = 210 %
27
Negative = investment not justifiableNull = no return on investmentPositive = justifiable as compared with other solutions

OWASP
Security Software Assurance Metrics: Balanced Scorecards
28
Correlation of budget with risk assessment and cost/benefits
Improved results of software security processes and operations
Reduced calls to CSR for reporting on security issues
Growth in assessed security processes & training activities

OWASP
Software Security Metrics In Support Of Business Cases
Metrics of technical valueCosts for testing and fixing vulnerabilitiesPercent security requirements satisfiedPercent developers with software sec. certifications
Metrics of comparative valueTCO of software security activities vs. unit revenueSecure software engineering costs vs. patching costs
Metrics of business valueEstimate for vulnerability & risk assessment costsBudget to address gaps in software sec. processesCosts for security certifications per business unit
29

OWASP
Come on is not so hard..
30

OWASP 31
In Summary
Rationale For Software Security Business CasePreparing the Business Case
Maturity ModelsMetrics and Measurements
Making the Business CaseSoftware Security Assurance AwarenessFailure Costs vs. Assumption CostsQualitative Risk AssessmentsReturn Of Security Investment (ROSI)Performance Measurement Metrics
Questions & Answers

OWASP 32
Thanks for listening, further references
Applied Software Measurement: Assuring Productivity and Quality
http://www.amazon.com/Applied-Software-Measurement-Assuring-Productivity/dp/0070328269
PCI-Data Security Standard (PCI DSS)https://www.pcisecuritystandards.org/security_standards/pci_dss.shtml
A CISO’s Guide to Application Securityhttp://www.nysforum.org/committees/security/051409_pdfs/A%20CISO'S%20Guide%20to%20Application%20Security.pdf

OWASP
Further references con’t
Gartner 2004 Press Releasehttp://www.gartner.com/press_releases/asset_106327_11.html
Making The Business Case For Software Assurance
https://buildsecurityin.us-cert.gov/daisy/bsi/articles/knowledge/business/685-BSI.html
SEI Capability Maturity Model Integration CMMihttp://www.sei.cmu.edu/cmmi/
33

OWASP
Further references con’t
Software Assurance Maturity Modelhttp://www.opensamm.org/
The Software Security Framework (SSF)http://www.bsi-mm.com/ssf/
National Information Assurance Glossaryhttp://www.cnss.gov/Assets/pdf/cnssi_4009.pdf
Dan. E. Geer, Economics & Strategies of Data Security
http://www.verdasys.com/thoughtleadership/
34

OWASP
Further references con’t
Open Security Foundation, Data Loss Statisticshttp://datalossdb.org/statistics
The WHID 2009 BI-Annual Report, August 2009http://www.breach.com/resources/whitepapers/downloads/WP_TheWebHackingIncidents-2009.pdf
Quantitative Risk Analysis Step-By-Stephttp://www.sans.org/reading_room/whitepapers/auditing/quantitative_risk_analysis_stepbystep_849?show=849.php&cat=auditing
Breach Worse Than Reported..http://www.bankinfosecurity.com/articles.php?art_id=606
35

OWASP
Further references con’t
Estimating Benefits from Investing in Secure Software Development
https://buildsecurityin.us-cert.gov/daisy/bsi/articles/knowledge/business/267-BSI.html
Return On Security Investment (ROSI)http://www.infosecwriters.com/text_resources/pdf/ROSI-Practical_Model.pdf
Models for Assessing the Cost and Value of Software Assurance
https://buildsecurityin.us-cert.gov/daisy/bsi/articles/knowledge/business/684-BSI.html 36