business cycles fall 2013. us real gdp (quarterly series)
TRANSCRIPT

Business Cycles
Fall 2013

US Real GDP (Quarterly series)

Real GDP Turkey
1998Q1
1998Q3
1999Q1
1999Q3
2000Q1
2000Q3
2001Q1
2001Q3
2002Q1
2002Q3
2003Q1
2003Q3
2004Q1
2004Q3
2005Q1
2005Q3
2006Q1
2006Q3
2007Q1
2007Q3
2008Q1
2008Q3
2009Q1
2009Q3
2010Q1
2010Q3
2011Q1
2011Q3
2012Q1
2012Q30.00
5000000.00
10000000.00
15000000.00
20000000.00
25000000.00
30000000.00
35000000.00
Real GDP (100=1998)
Real GDP (100=1998)

Real GDP in Turkey
1998Q1
1998Q3
1999Q1
1999Q3
2000Q1
2000Q3
2001Q1
2001Q3
2002Q1
2002Q3
2003Q1
2003Q3
2004Q1
2004Q3
2005Q1
2005Q3
2006Q1
2006Q3
2007Q1
2007Q3
2008Q1
2008Q3
2009Q1
2009Q3
2010Q1
2010Q3
2011Q1
2011Q3
2012Q1
2012Q30.00
5000000.00
10000000.00
15000000.00
20000000.00
25000000.00
30000000.00
35000000.00
0
5000000
10000000
15000000
20000000
25000000
30000000
35000000
40000000
Series1 Real GDP (100=1998)

Growth rate of Real GDP in Turkey
1998Q2
1998Q4
1999Q2
1999Q4
2000Q2
2000Q4
2001Q2
2001Q4
2002Q2
2002Q4
2003Q2
2003Q4
2004Q2
2004Q4
2005Q2
2005Q4
2006Q2
2006Q4
2007Q2
2007Q4
2008Q2
2008Q4
2009Q2
2009Q4
2010Q2
2010Q4
2011Q2
2011Q4
2012Q2
2012Q4
-6
-4
-2
0
2
4
6
8
10
Series1
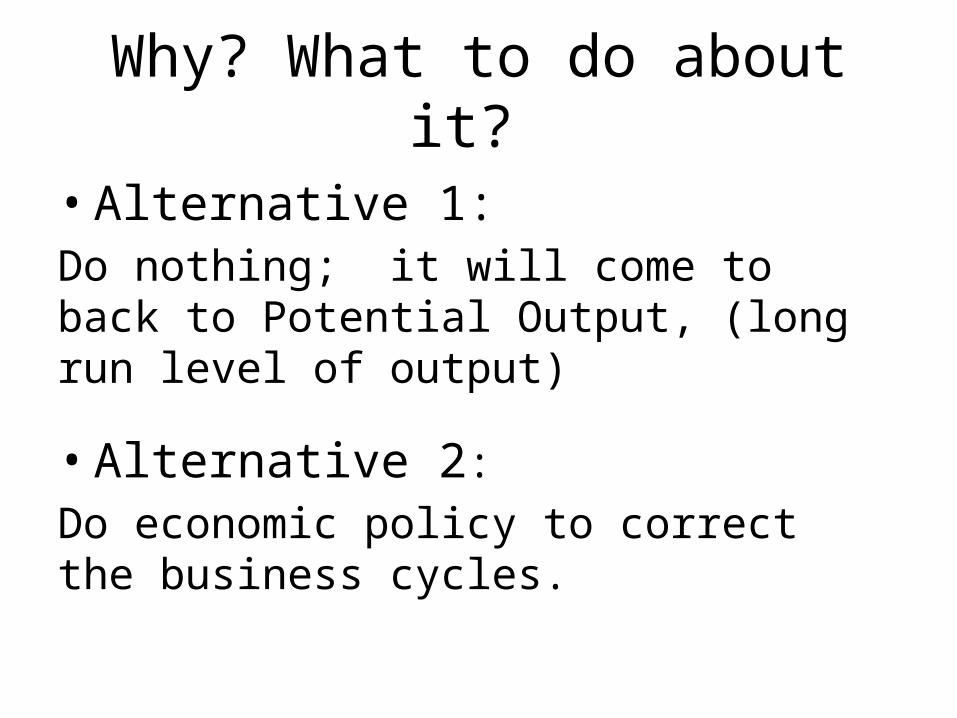
Why? What to do about it?
• Alternative 1:Do nothing; it will come to back to Potential Output, (long run level of output)
• Alternative 2:Do economic policy to correct the business cycles.

Why? What to do about it?‘Schools of Thought’
Historical Perspective• Classical View (until 1930s Great Depression)
(Start of Macroecononomics)
• Keynesian View (recovery of Great Depression)
Recent Perspective• New Keynesians• Monetarist Model• The New Classical Model• Real Business Cycles

Keynesian View
• Flow of demand for goods and services vs.
• Flow of supply of goods and services
in GOODS AND SERVICES MARKET

Keynesian Macroeconomics
• Aggregate Expenditure (aggregate demand)vs.
• Aggregate Supply

‘Desired’ Aggregate Expenditures
• Buyers in the Goods Market:1. Desired Consumption Expenditures,2. Desired Investment Expenditures,3. Desired Government Expenditures,4. Desired Net Exports
WHY ‘DESIRED’ EXPENDITURES?
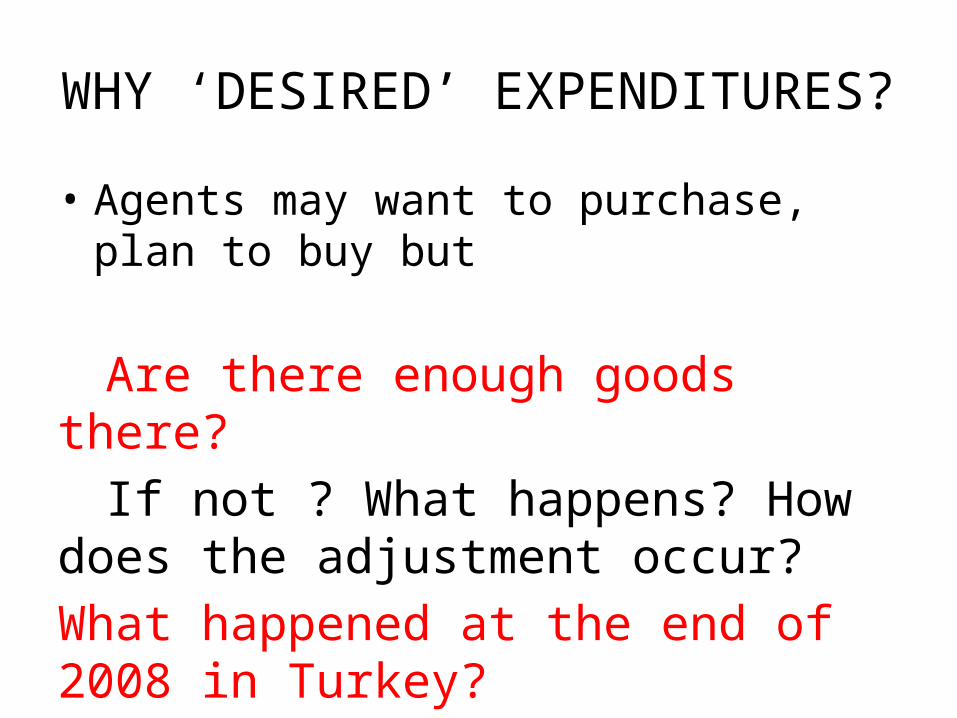
WHY ‘DESIRED’ EXPENDITURES?
• Agents may want to purchase, plan to buy but
Are there enough goods there?If not ? What happens? How does the
adjustment occur?What happened at the end of 2008 in Turkey?
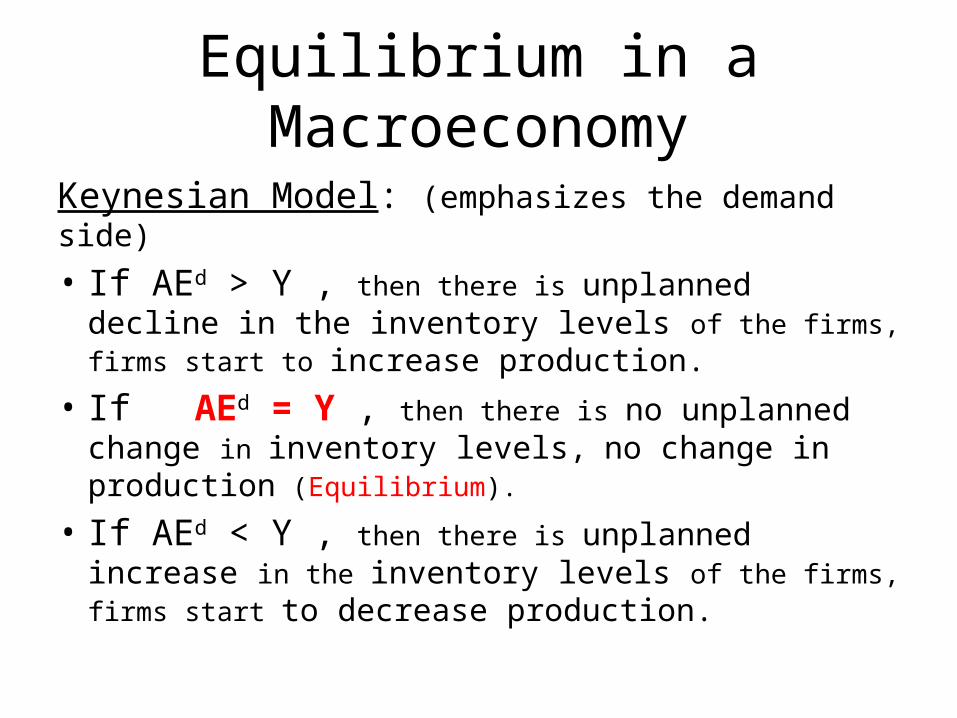
Equilibrium in a Macroeconomy
Keynesian Model: (emphasizes the demand side)
• If AEd > Y , then there is unplanned decline in the inventory levels of the firms, firms start to increase production.
• If AEd = Y , then there is no unplanned change in inventory levels, no change in production (Equilibrium).
• If AEd < Y , then there is unplanned increase in the inventory levels of the firms, firms start to decrease production.
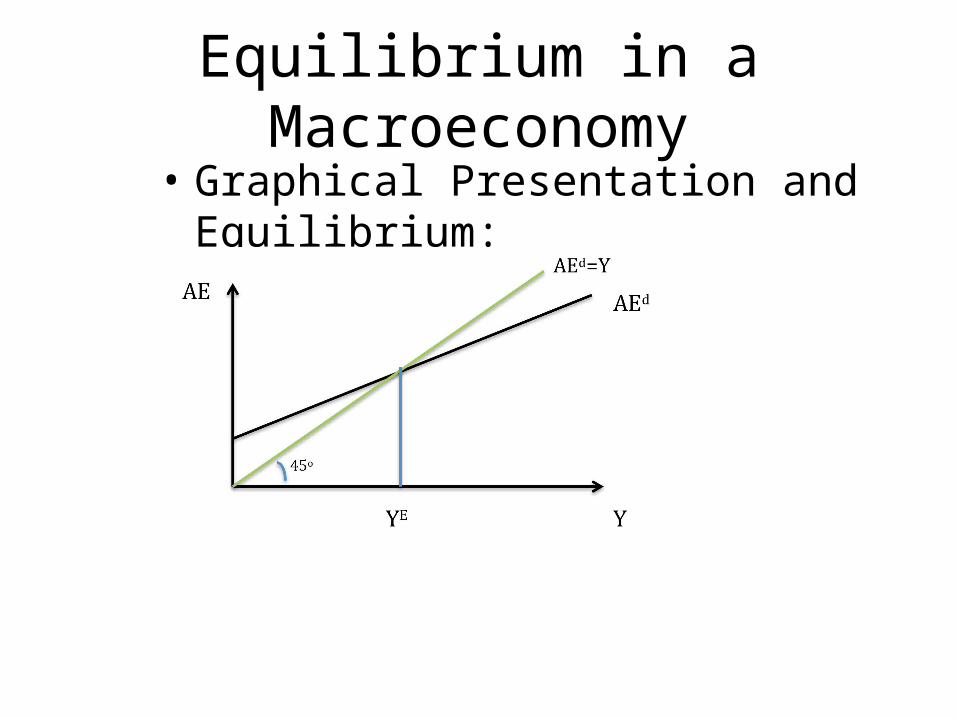
Equilibrium in a Macroeconomy• Graphical Presentation and Equilibrium:
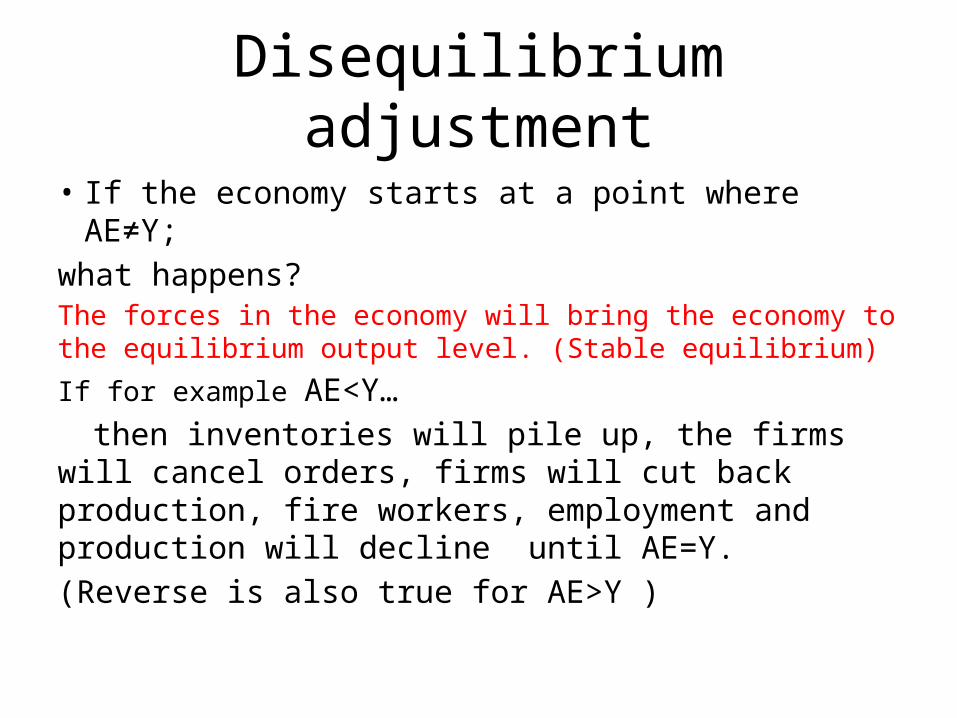
Disequilibrium adjustment
• If the economy starts at a point where AE≠Y; what happens?The forces in the economy will bring the economy to the equilibrium output level. (Stable equilibrium)
If for example AE<Y…then inventories will pile up, the firms will cancel
orders, firms will cut back production, fire workers, employment and production will decline until AE=Y. (Reverse is also true for AE>Y )
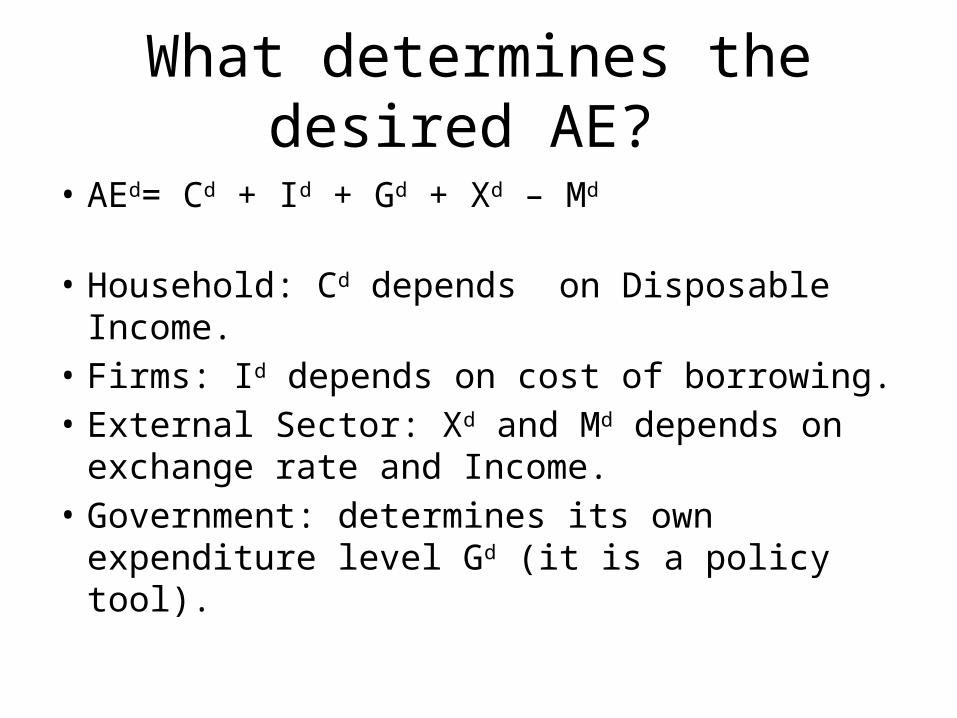
What determines the desired AE?
• AEd= Cd + Id + Gd + Xd – Md
• Household: Cd depends on Disposable Income.• Firms: Id depends on cost of borrowing.• External Sector: Xd and Md depends on
exchange rate and Income.• Government: determines its own expenditure
level Gd (it is a policy tool).

A Model for Desired Aggregate Expenditures
• Desired Consumption Expenditures: Cd
– What is Disposable Income? YD
•Therefore desired consumption expenditures are an increasing function of Y.

A Model for Desired Aggregate Expenditures
• Desired Investment Expenditures: Id
• Therefore we can write as:
•
A Model for Desired Aggregate Expenditures
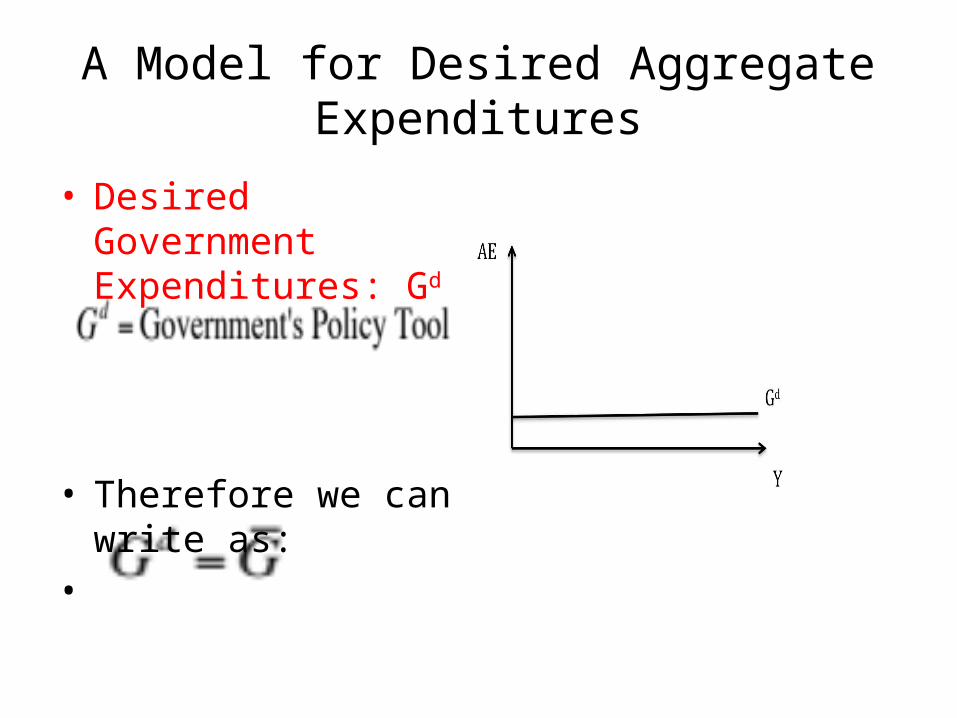
• Desired Government Expenditures: Gd
• Therefore we can write as:
•

A Model for Desired Aggregate Expenditures
• Desired Net Exports: NXd
(in the simple model)
• Therefore we can write as:

Mathematical Example
• Steps to find the Equilibrium Income (Output):1. Find Desired Aggregate Expenditure Function
as a function of Y.2. Use equilibrium condition: AEd= Y3. Solve for Y, which will be the level of output
which is equal to the level of AEd.
Example…

Why does the Equilibrium Income change?
• If any of the autonomous spending increase then equilibrium income will increase from YE to YE NEW.
• Possible causes of autonomous income increase are:
• (Graphically all of these are vertical (upward) shift of the AE function)
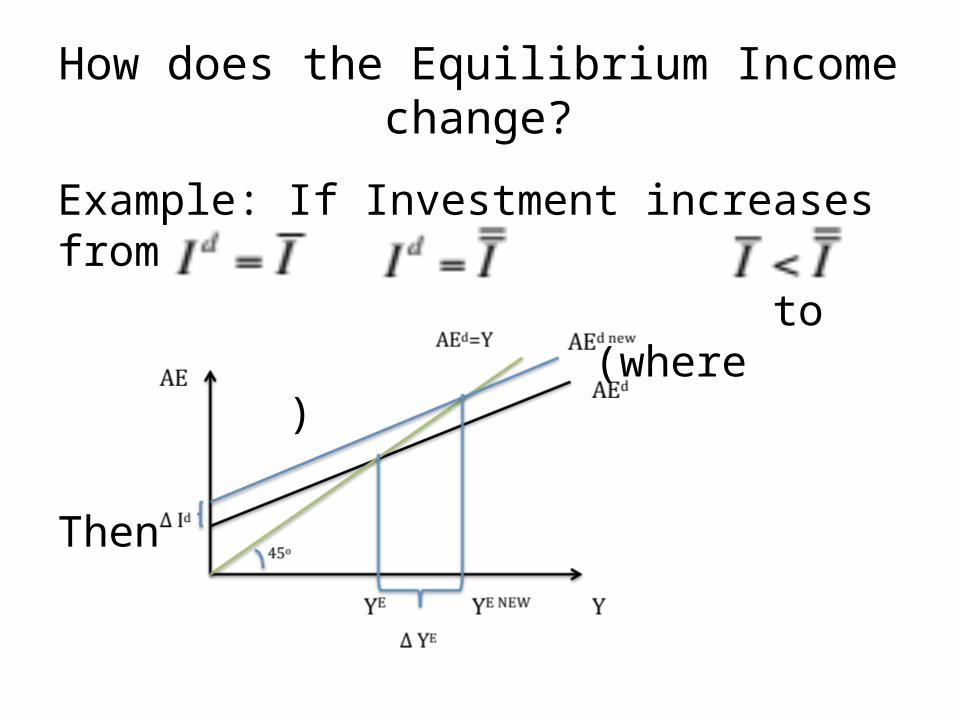
How does the Equilibrium Income change?
Example: If Investment increases from to (where )
Then
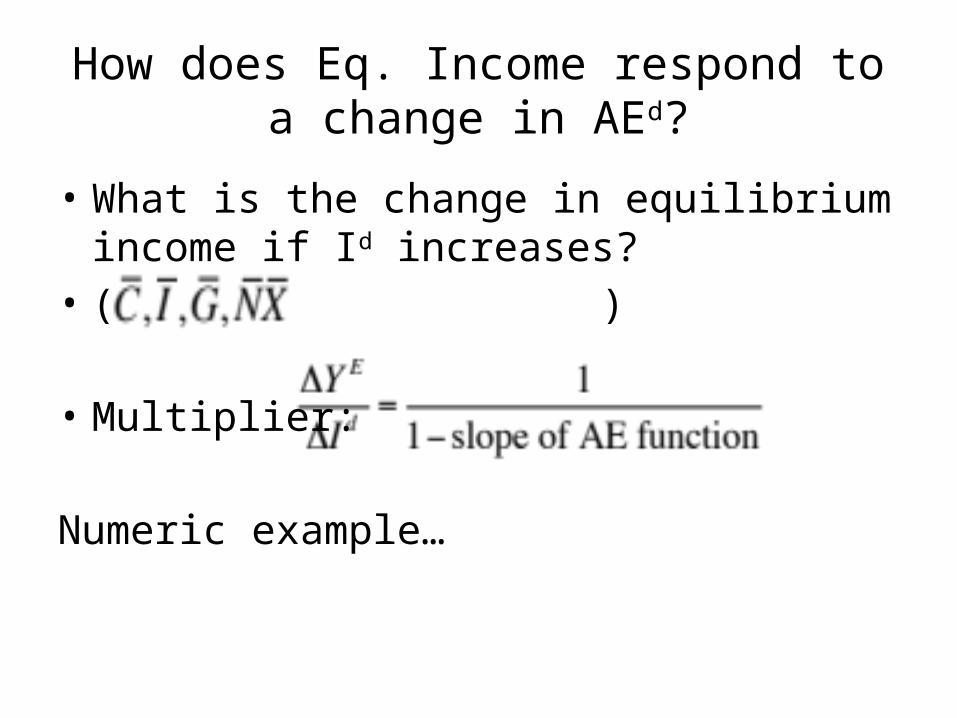
How does Eq. Income respond to a change in AEd?
• What is the change in equilibrium income if Id increases?
• ( )
• Multiplier:
Numeric example…
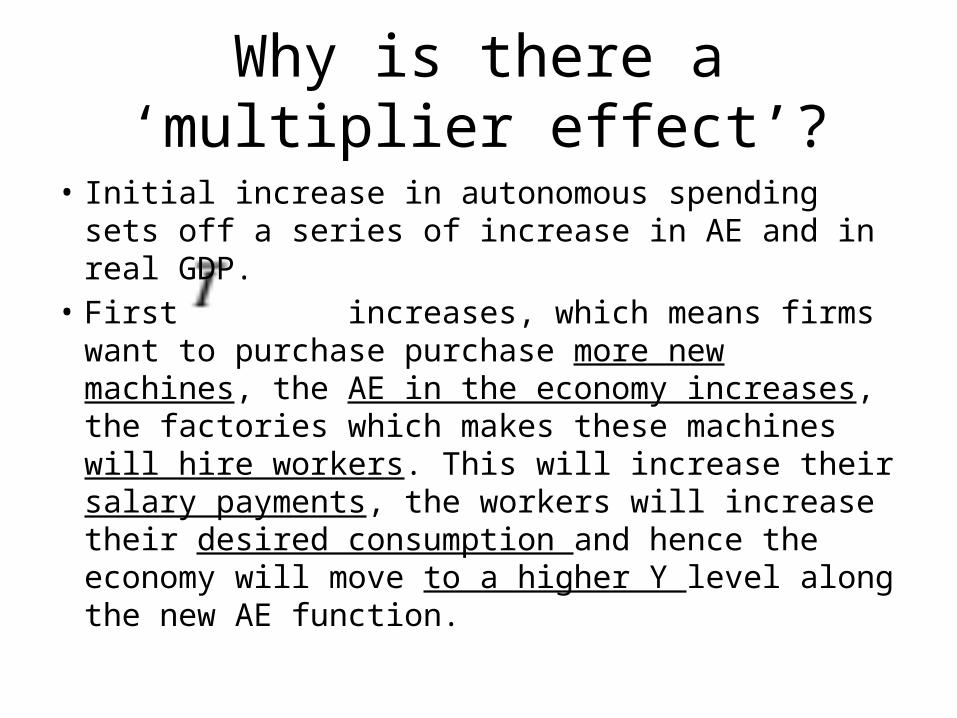
Why is there a ‘multiplier effect’?
• Initial increase in autonomous spending sets off a series of increase in AE and in real GDP.
• First increases, which means firms want to purchase purchase more new machines, the AE in the economy increases, the factories which makes these machines will hire workers. This will increase their salary payments, the workers will increase their desired consumption and hence the economy will move to a higher Y level along the new AE function.
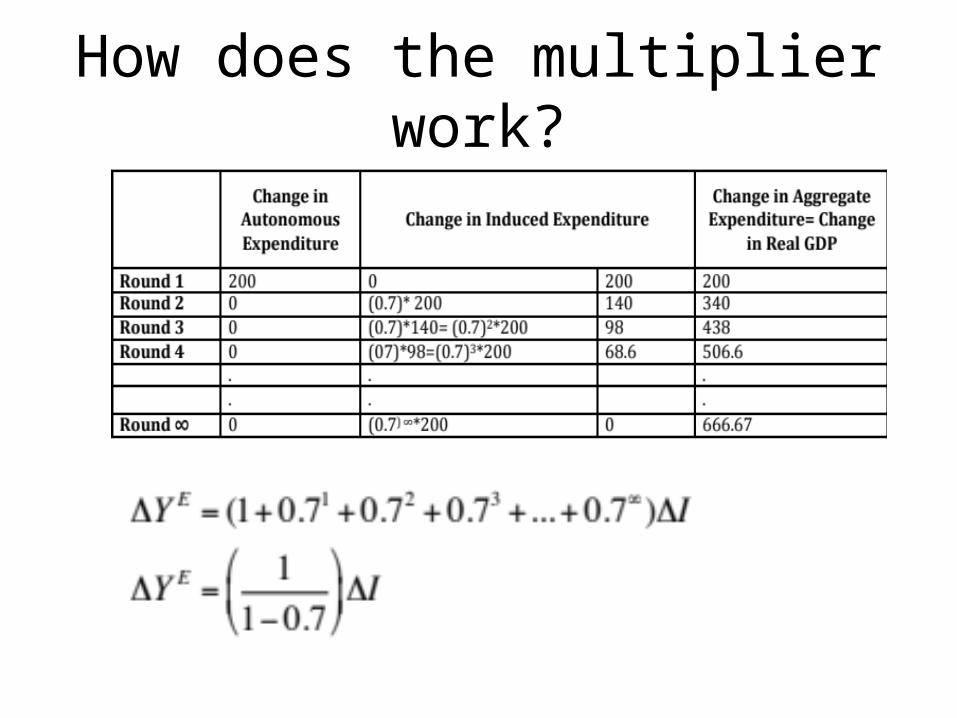
How does the multiplier work?
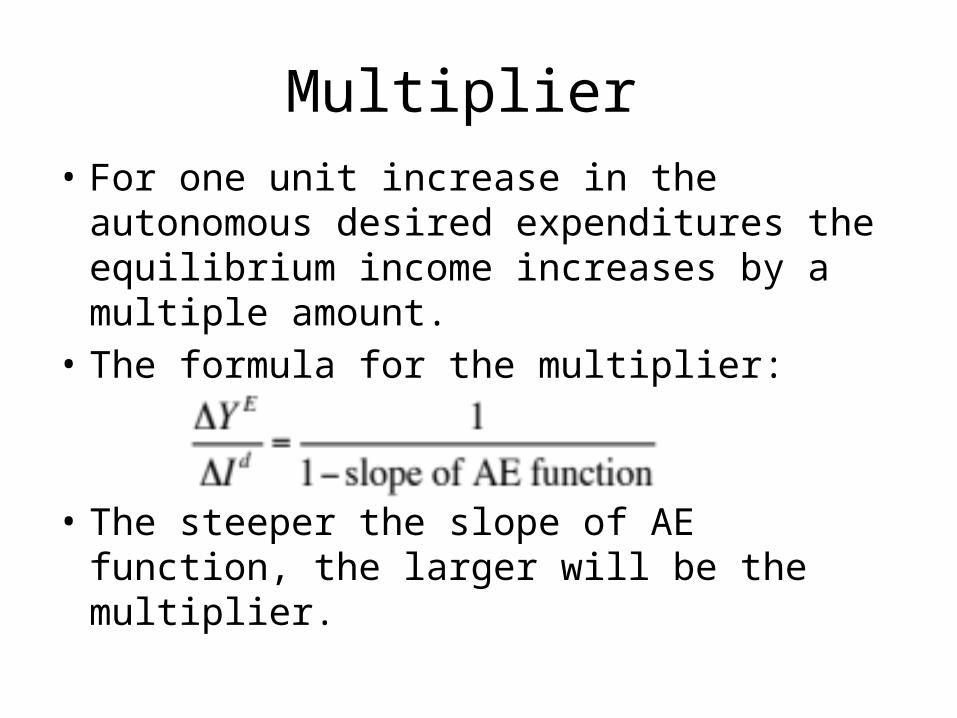
Multiplier • For one unit increase in the autonomous
desired expenditures the equilibrium income increases by a multiple amount.
• The formula for the multiplier:
• The steeper the slope of AE function, the larger will be the multiplier.

Why do we need the multiplier information?
• If Desired Government Expenditure increase by 1 billion TL, we can tell what will be the change in the equilibrium income. (Multiplier x 1 billion TL)
• Hence we will be able to tell how much increase in desired government expenditure is necessary to bring the economy to Potential Real GDP level.
Potential OutputIdeal level of income
• What is an ideal level of Real GDP?POTENTIAL INCOME
(Full employment level of income) • The income level that corresponds to the output
that will be produced if all resources are employed at a ‘normal’ rate.
• Here, the output level at the Natural Rate of Unemployment,
(U% is equal to only frictional + structural U% rate, and cyclical U% is zero.).
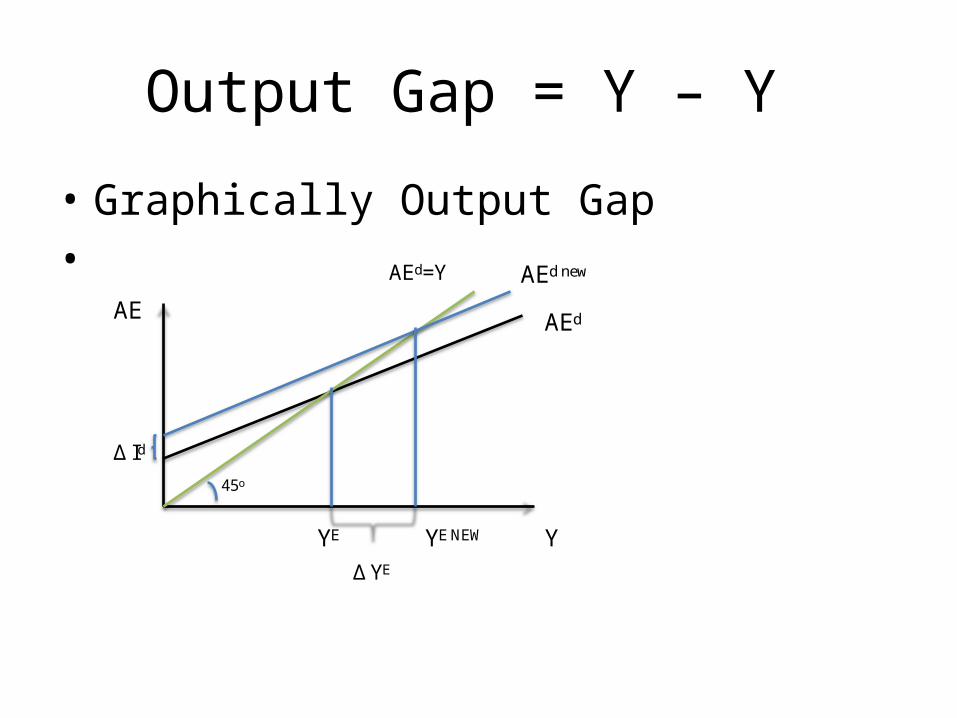
Output Gap = Y – Y
• Graphically Output Gap•
AE
Y
AEd
45o
YE
AEd=Y
YE NEW
AEd new
Δ Id
Δ YE

Necessary change in G to close the Output Gap
• ∆Y= multiplier*∆G• Hence you may compute the necessary change
in change in G from the above equation, as • ∆G= ∆Y/ multiplier

What if the government increases taxes by 1 Billion TL
• Is the effect on Real GDP ( Equilibrium income) expansionary or contractionary?
???• How much will be the change in Real GDP?
???